Abstract
Sulfuric acid anodization is one of the common methods used to improve corrosion resistance of aluminum alloys. Organic acids can be added to the sulfuric acid electrolyte in order to improve the properties of the anodized aluminum produced. In this study, the use of gallic acid as an additive to the sulfuric acid anodization of AA1100 was explored. The effect of varying anodization current density and gallic acid concentration on the properties of anodized aluminum samples was observed using electrochemical impedance spectroscopy, linear polarization, and scanning electron microscopy. It was observed that the corrosion resistance of samples anodized in gallic-sulfuric acid solution at 10 mA·cm−2 is lower than samples anodized in sulfuric acid. It was also observed that higher anodization current density can lead to lower corrosion resistances for aluminum samples anodized in gallic-sulfuric acid solution. However, samples anodized at 5 mA·cm−2 and at a gallic acid concentration of 5 g·L−1 showed better corrosion performance than the samples anodized in sulfuric acid only. This suggests that the use of low amounts of gallic acid as an additive for sulfuric acid anodization can lead to better corrosion resistances for anodized aluminum.
1. Introduction
Aluminum is one of the most used industrial materials due to its desirable properties, such as its high specific strength, high thermal and electrical conductivity, and high processability [1]. It has widespread application in transportation, packaging, electronics, construction, and even power generation [1,2]. However, Al is prone to corrosion due to its highly reactive nature [3]. It is especially vulnerable to degradation in chloride-rich environments [4]. Such tendency necessitates the use of anti-corrosion treatment to preserve the integrity of the structures involving Al. Some of these treatments are organic coating application, anodization, plasma electrolytic oxidation, and chemical conversion coating [3,4,5]. In general, these methods rely on creating a barrier that reduces the interaction of Al with corrosion-inducing substances.
Chromate conversion coating, a form of chemical conversion coating, was among the most common anti-corrosion treatments for Al [6]. It uses Cr(VI) to generate a protective oxide layer and to provide active corrosion inhibition [6,7]. Unfortunately, health and environmental hazards, associated with Cr(VI), made it necessary to search for safer but equally effective treatment methods [3,5,6]. Anodization is one of the alternatives subsequently explored. Anodizing Al involves immersing the metal in an electrolyte and then passing an electric current through it to produce a thick oxide layer. Process parameters like the electrolyte composition, current density, and electrolyte temperature can be adjusted to tune the properties of the oxide layer [5].
Sulfuric acid is a common anodization electrolyte for Al. It produces a dense oxide layer, which provides good corrosion protection [5]. It can also be combined with organic acids, in order to achieve improvements on surface adhesion, thickness, and corrosion inhibition; among others [3,5,8]. For instance, Boisier et al. reported that the use of tartaric acid leads to lower pore volume, which then yields better sealing quality and higher corrosion resistance for AA2024 T3 [9]. In another study, Machado et al. observed that anodization of AA2024 in malic-sulfuric acid electrolyte can result in higher corrosion resistance and lower flaw density, compared to anodization in tartaric-sulfuric acid [10]. Other examples of organic acids used in sulfuric acid anodization of Al are citric acid, oxalic acid, malic acid, and malonic acid [9,10,11,12,13]. There are several mechanism used to explain the improvements arising from the addition of organic acids to the sulfuric acid electrolyte. One reported mechanism is based on the reduction in the dissolution rate due to the weak nature of the organic acids [13].
Gallic acid (3,4,5-trihydroxybenzoic acid) is a naturally occurring weak acid found in plants and is a known antioxidant [14]. It has been encountered in some anti-corrosion studies involving Al and steel. Gohausen et al. filed a patent for the use of gallic acid as part of a sealing solution for anodized Al surfaces [15]. Reports that gallic acid has been added to a commercial sulfuric-organic electrolyte to minimize acid attack and improve pore structure development [16]. Gallic acid application as a corrosion inhibitor for Al and other metals had also been explored. Ali et al. reported that it can function as a mixed type inhibitor for AA6061 exposed to alkali solutions [17]. Keny et al. demonstrated that at low concentrations, it can be used as a corrosion inhibitor for carbon steel [18]. Obot and Madhankumar established that it can also be blended with tannic acid to achieve better corrosion inhibition for mild steel [19]. Altogether, these studies indicate that gallic acid can be used in anti-corrosion treatments. Its weak acidity also suggests that it can be integrated into the sulfuric acid anodization process. Despite this, there is limited literature on the use of gallic-sulfuric acid for the anodization of Al.
In this work, the applicability of gallic acid as an additive in sulfuric acid anodization was determined by observing the corrosion behavior of AA1100 anodized in a gallic-sulfuric acid electrolyte. The effect of parameters, such as gallic acid (GA) concentration and anodization current density were also analyzed. The changes in the corrosion parameters of the anodized metal at prolonged immersion in NaCl solution were also monitored.
2. Materials and Methods
2.1. Materials
Commercial AA1100 sheets (99%, Hi-Top Merch. Inc., Quezon City, Philippines) with dimensions of 60 mm × 100 mm × 4 mm were prepared. Analytical grade gallic acid, sulfuric acid, phosphoric acid, sodium hydroxide, sodium chloride, and ethanol were used. Deionized water was used for all solutions.
2.2. Anodization of AA 1100 Samples
The AA1100 sheets were pre-treated by initially degreasing in an ethanol ultrasonic bath for ten minutes. This was followed by etching in a 1 M sodium hydroxide solution for one minute. Afterwards, the etched sheets were electro-polished at constant voltage (6 V) in a 65%:20% (v/v) phosphoric–sulfuric acid solution for one minute. The sheets were rinsed with deionized water after each step.
The pretreated samples were anodized in gallic-sulfuric acid solutions with varying amounts of GA and at varying current densities. The gallic acid concentration was varied at values of 0, 5, and 10 g·L−1 while maintaining the current density at 10 mA·cm−2. Meanwhile, the current density was varied at values of 5, 10, and 15 mA·cm−2 while maintaining the GA concentration at 5 g·L−1. The sulfuric acid concentration was fixed at 50 g·L−1 for all trials [3]. Table 1 shows the samples names to be used in the succeeding text and their corresponding anodization conditions.

Table 1.
Summary of experimental conditions used for the anodization runs in the study.
The anodization was conducted in a two-electrode cell with the pretreated sheets as the anode and another Al sheet as the cathode. The electrodes were connected to a DC power supply with constant current output. The temperature was maintained at ~30 °C using a water bath. The anodization ran for 45 min and was constantly mixed using a magnetic stirrer.
After anodization, the samples were rinsed with deionized water to remove any residual electrolyte. The samples were then immediately submerged in boiling water for 20 min, in order to close and seal open pores, produced during the anodization process. The sealed samples were then air dried prior the succeeding steps.
2.3. Sample Imaging and Corrosion Studies
The samples used for imaging were dried and then mechanically fractured to acquire an image of the cross-section of the oxide layer [20]. These were then deposited with a thin Ag-Pd film via ion-sputtering prior to imaging using a scanning electron microscope (Hitachi S-3400N, Tokyo, Japan).
On the other hand, the samples for corrosion studies were immersed in an unstirred 3.5 wt.% NaCl solution maintained at ambient conditions. For electrochemical analysis, the samples were briefly taken out of the NaCl bath and placed in a three-electrode cell connected to a potentiostat (Autolab PGSTAT204N, Herisau, Switzerland). The cell had a 10 mm diameter exposed area for the working electrode, a Pt coil counter electrode, and a Ag/AgCl (3 M) reference electrode. The electrolyte used is similar to the NaCl bath. Different sections of the samples were exposed during electrochemical analysis. The samples were observed using electrochemical impedance spectroscopy (EIS) during a 20-day period, specifically after 0, 3, 7, 10, 15, and 20 days of immersion. EIS was implemented by applying an AC amplitude of 10 mV with respect to the open-circuit potential (OCP). The OCP was allowed to stabilize for at least five minutes prior to the EIS measurements. The frequency range was from 100 kHz to 10 mHz and five points were collected per decade. EIS measurements were performed thrice to assess replicability. Linear polarization was also performed once for each sample from −0.1 to 0.2 V vs. OCP at a scan rate of 2 mV·s−1 after 3, 7, 10, 15, and 20 days of immersion. The same cell used for EIS was used for linear polarization. The OCP was also allowed to stabilize for at least five minutes. Analysis of the electrochemical data was performed using Nova 2.0.2 (Metrohm AG, Herisau, Switzerland).
3. Results and Discussion
3.1. Imaging of Anodized Aluminum Oxide Samples
Images of the sealed anodized aluminum oxide (AAO) samples were taken using a scanning electron microscope (SEM) to assess the effects of the varying anodization conditions on the oxide layer morphology. The AAO is largely composed of Al2O3 and its hydrated form. Figure 1 shows the SEM images acquired for the samples produced at different anodization conditions. It must be noted that the visible cracks in Figure 1b,c,e were produced during the fracturing step and not due to prolonged immersion.

Figure 1.
SEM images (10,000× magnification) for samples (a) 5CD-5GA; (b) 10CD-5GA; (c) 15CD-5GA; (d) 10CD-0GA, and (e) 10CD-10GA. The images show the cross-section of the oxide layers formed during anodization at varying current densities and gallic acid concentrations.
A comparison of the estimated thickness of the oxide layers indicates that sample 5CD-5GA is thinnest (~2.8 μm), while sample 10CD-0GA is the thickest (~6.2 μm). For samples produced at different current densities, the order of thicknesses is: 5CD-5GA (~2.8 μm) < 10CD-5GA (~5.4 μm) < 15CD-5GA (~5.6 μm). The apparent trend indicates that, on its own, increasing anodization current density can lead to thicker oxide layers. This is consistent with the behavior reported in literature [3,21]. Higher current densities tend to facilitate faster Al ion generation thus resulting in larger oxide layer growth rates. This leads to thicker oxide layers. On the other hand, the order of the thicknesses for the samples produced at different gallic acid concentrations is: 10CD-10GA (~3.7 μm) < 10CD-5GA (~5.4 μm) < 10CD-0GA (~6.2 μm). This is potentially due to higher oxide dissolution rates at higher GA concentrations.
The trends observed in the oxide layer thickness are also consistent with the relative magnitudes of the cell voltage seen during anodization (Figure 2). At the latter part of the anodization, the order of the cell voltages was: 5CD-5GA < 10 CD-10GA < 10CD-5GA < 15CD-5GA < 10CD-0GA. This indicates that the voltage development during anodization was likely due to the thickness of the oxide layer being formed.
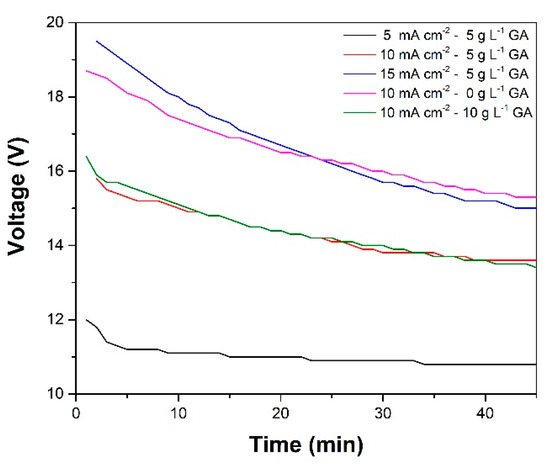
Figure 2.
Evolution of cell voltage with time during the anodization of the AA1100 samples at varying levels of gallic acid concentration and anodization current density.
Apart from the differences in the oxide layer thickness, variation in the cross-sectional profiles can also be observed among the samples. A distinct upper layer characterized by jagged fracture patterns is seen in samples 10CD-5GA, 15CD-5GA, and 10CD-10GA. However, these, are not evident in samples 5CD-5GA and 10CD-0GA. This layer is identified as the intermediate boehmite (AlO(OH)) layer. It has been reported that the boehmite layer formed during hot water sealing has flake like-characteristics and forms densely intertwined structures [22]. Its intertwined nature likely explains the jagged fracture patterns observed. The boehmite layer was formed through the hydration of Al2O3 (Equation (1)) during the hot water sealing [23,24]. Its prominence in some samples points to differences in the sealing behavior of anodic oxide layers produced. These differences can depend on pore morphology and complexing ability of the incorporated anions in the oxide layer [22]:
Al2O3 + H2O → 2AlO(OH).
3.2. Electrochemical Impedance Spectroscopy
The evolution of the corrosion behavior of the oxide layers during immersion in 3.5 wt.% NaCl solution was primarily observed using EIS. Figure 3a,b show the typical Bode plots acquired for the samples prior to prolonged immersion. The plots for samples 5CD-5GA, 10CD-5GA, and 10CD-0GA are generally similar. There are two time constants visible in the low frequency and high frequency ends signified by the peaks in the Bode-phase plot of the three samples. This is consistent with the usual two-layer structure (i.e., barrier layer and porous layer) of AAO [5,25]. The low frequency time constant is associated with the barrier layer properties, while the high frequency time constant is associated with the porous layer properties [26]. Bode plot features, consistent with these two layers, are also evident for samples 15CD-5GA and 10CD-10GA. However, an additional time constant in the medium frequency range is noticeable, and is attributed to small defects in the oxide layer, which exposed the substrate [27]. In terms of the impedance modulus, 5CD-5GA has the highest impedance in the medium and low frequency ranges, suggesting that its oxide layer has relatively better protective qualities. The low and medium frequency impedance (Figure 4a) of the samples decreased after 3 days of immersion. The features of the plots, corresponding to the additional time constant observed for 15CD-5GA and 10CD-10GA, were also less prominent in the 3-day immersion Bode-phase plot (Figure 4b).
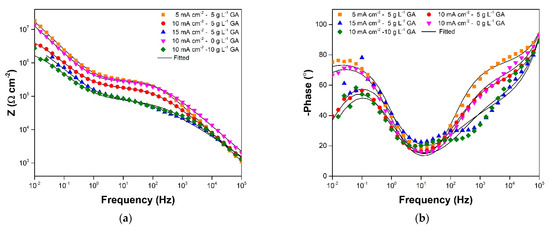
Figure 3.
(a) Bode-modulus and (b) Bode-phase plots at 0-day immersion in 3.5 wt.% NaCl maintained in ambient conditions.
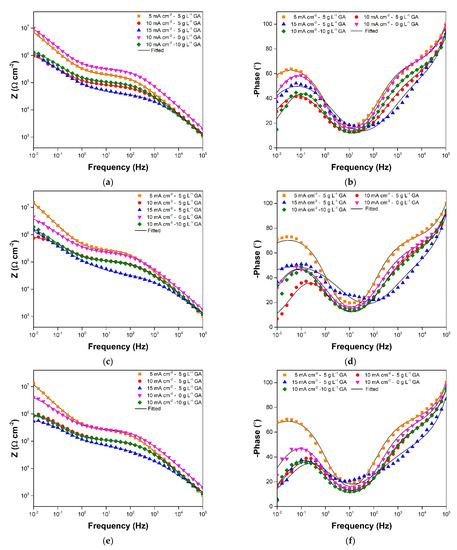
Figure 4.
Bode-modulus and Bode-phase plots at (a,b) 3-day; (c,d) 7-day; and (e,f) 10-day immersion in 3.5 wt.% NaCl maintained in ambient conditions.
The anodized aluminum samples showed considerably stable impedance values with further immersion as seen in Figure 4c–e and Figure 5. Sample 5CD-5GA still had the highest impedance in the low frequency range, while having comparable impedance, with sample 10CD-0GA in the medium frequency range. Samples 10CD-5GA and 10CD-10GA, on the other hand, had nearly equivalent impedance behavior throughout the immersion. Sample 15CD-5GA had the lowest impedance in all frequency ranges.
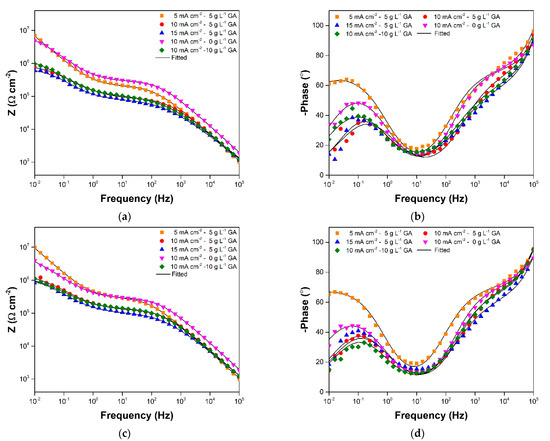
Figure 5.
Bode-modulus and Bode-phase plots at (a,b) 15-day; and (c,d) 20-day immersion in 3.5 wt.% NaCl maintained in ambient conditions.
An equivalent electric circuit (EEC) was fitted into the EIS data to further quantify the properties of the AAO layers. Figure 6a shows the general EEC used to model AAOs [28,29,30,31,32]. The components of this circuit include the electrolyte resistance (Rs); the porous layer capacitance (CPL) and resistance (RPL); the pore wall capacitance (CW) and resistance (RW); and the barrier layer capacitance (CBL) and resistance (RBL). The capacitances describe the surface charging behavior of the AAO components, while the resistance describe the ease of charge transport through the components. In this light, the resistance values can be used to assess the susceptibility of the anodized aluminum samples to chloride attack, and consequently, to compare their corrosion resistances.
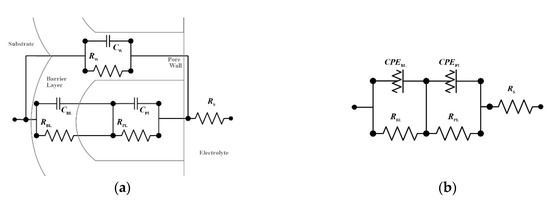
Figure 6.
(a) General EEC configuration for AAO; and (b) the simplified circuit used to model the sealed anodized samples.
Although the general EEC is useful in analyzing AAOs, it can be modified, in order to reflect the typical behavior of the components associated with the pore walls. The passage of current through the pore walls is minimal thus resulting to high RW values [29,31]. Meanwhile, low ionic movement through the pore walls leads to low CW values [29]. As this is the case, the pore wall branch of the general EEC is typically omitted [27,29,30,31]. The simplified EEC can be further modified to account for non-idealities in the AAO. Figure 6b shows an EEC which uses a constant phase element (CPE) instead of a capacitance. This is also the EEC fitted into the EIS data. A CPE is used in order to account for the non-homogeneity of real AAO systems—an aspect that is not well reflected in the use of a capacitive element in the EEC [29,31]. A CPE is fitted into the EIS data using the function shown in Equation (2) [30,31]. In the equation, ZCPE and f are the values from the impedance data, j is the imaginary unit, Q is the magnitude of the CPE, and n is the frequency dispersion factor which varies from 0 to 1 [29]. The CPE is equivalent to a resistor at n = 0 and to a capacitor at n = 1. For non-homogeneous components, the value of n is between 0.5 and 1. Meanwhile, the CPE values reported in the succeeding parts correspond to the fitted values of Q.:
ZCPE = 1/(j2πfQ)n.
Figure 7a,b show the fitted values of RPL, and porous layer constant phase element (CPEPL), respectively. Altogether, the changes in RPL and CPEPL values can be considered small. This indicates that good sealing of the porous layer was achieved. There are periods by which immersion where a decrease in the RPL of each sample can be observed. A corresponding increase in the CPEPL values can be also be seen for most of these periods. For instance, this is visible from day 0 to day 15 of sample 5CD-5GA, day 3 to day 10 of sample 15CD-5GA, and day 0 to day 7 of sample 10CD-0GA. These changes are attributed to ionic permeation through the sealed pores resulting to improved ionic conduction [9]. A gradual increase in the RPL of the samples and a corresponding decrease in the CPEPL can then be observed with further immersion. This is potentially due to the self-sealing of the oxide layers [9,30]. The process involves hydration of Al2O3 similar to hot water sealing albeit at a slower rate [30]. The same process is assumed to be the cause the disappearance of the third time constants observed for samples 15CD-5GA and 10CD-10GA in Figure 3.
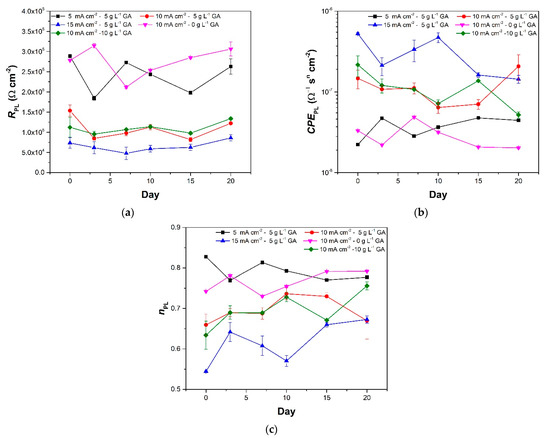
Figure 7.
Fitted values of the porous layer (a) resistance, (b) constant phase element, and (c) n of the anodized aluminum samples at different times during the prolonged immersion in 3.5 wt.% NaCl. The error bars in the plots pertain to the standard error based on three replicates.
A comparison of the RPL magnitudes shows that sample 10CD-0GA has the highest resistance for the porous layer. This is assumed to be a consequence of its oxide layer thickness being the highest among the samples tested. It is closely followed by sample 5CD-5GA. The rest of the samples have lower RPL values relative to samples 5CD-5GA and 10CD-0GA. The order of values for the RPL is the opposite when it comes to the CPEPL. Samples 5CD-5GA and 10CD-0GA have the lowest CPEPL, while sample 15CD-5GA has the highest. Meanwhile, the frequency dispersion factors (nPL) in Figure 7c show relatively stable values. Similar to the CPEPL, samples 5CD-5GA and 0GA-5CD also exhibit the highest nPL values indicating that they have the most homogeneous porous layers.
Figure 8a,b show the fitted values of RBL, and porous layer constant phase element (CPEBL), respectively. A decrease in the RBL values and a corresponding increase in the CPEBL of the samples at the earlier stages of immersion is apparent in the data. This coincides with the RPL decrease identified earlier. This suggests that the barrier layer was subjected to chloride attack when the porous layer was relatively more permeable. A decrease in the barrier layer frequency dispersion factor (nBL), shown in Figure 8c, also suggests that the chloride ion attack resulted in an increase in the barrier layers’ heterogeneity [33]. However, once the porous layer became stable, consequent stabilization of the RBL, CPEBL, and nBL are also observed for most of the samples. The fluctuation in the RBL values of sample 5CD-5GA after longer immersion is attributed to limitations in the data fitting process potentially because the resistance of its barrier layer is beyond the frequency range used [30]. Nonetheless, comparison of the RBL values clearly shows that sample 5CD-5GA has the most corrosion resistant barrier layer among the anodized samples. The nBL for sample 5CD-5GA is also consistently higher during the immersion, suggesting that it has the most homogeneous barrier layer.
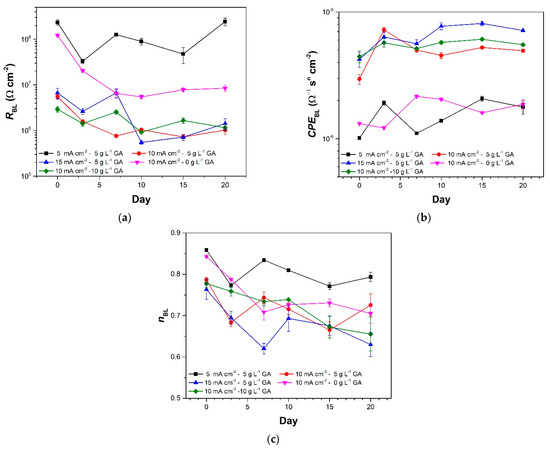
Figure 8.
Fitted values of the barrier layer (a) resistance, (b) constant phase element, and (c) n of the anodized aluminum samples at different times during the prolonged immersion in 3.5 wt.% NaCl. The error bars in the plots pertain to the standard error of based on three replicates.
The EEC values for samples anodized at different current densities show that higher anodization current density results in lower RPL and RBL. This can be attributed to the formation of a less dense oxide layer at higher levels of the anodization current density [21]. The density of the oxide layer is possibly related to the amount of incorporated anions. A higher anodization current density was reported to increase the degree of anion incorporation, which can lead to the observed behavior [34]. Meanwhile, the samples produced at varying GA concentrations show that anodization in gallic-sulfuric acid solution results in lower RPL and RBL, compared to anodization in sulfuric acid only. This is possibly due to the difference in the oxide layer thickness, which in turn, is related to the dissolution behavior of the samples. It has been reported that, for aluminum anodization, oxide dissolution prevails over oxide formation beyond a particular acid concentration threshold [3]. It is possible that the threshold for GA is relatively low. If so, this can explain the lower resistances observed for samples 10CD-5GA and 10CD-10GA.
Further comparison of sample 10CD-5GA and sample 10CD-10GA shows that the latter, once immersed, has better corrosion parameters particularly in terms of its RPL. It also has the least variation in the values of its corrosion parameters during immersion. This is possibly due to the higher amount of residual GA incorporated in the oxide layer, which helped in counteracting the effect of the corrosive bath [35]. Therefore, while higher amounts of GA can potentially contribute to higher oxide dissolution rate during anodization, the incorporate of GA and its derivatives might stabilize the corrosion behavior of the oxide layer during exposure to NaCl.
Despite the apparent effect of GA concentration on the resistances of samples 10CD-5GA and 10CD-10GA, the addition of GA during anodization might still be beneficial. This is evident when the resistances of sample 5CD-5GA is compared to those of 10CD-0GA. Higher resistances exhibited by sample 5CD-5GA suggest that a low GA concentration, coupled with a low anodization current density, can lead to a better corrosion resistance. It has been established in the literature that sulfuric acid anodization, at lower current densities, lead to lower corrosion resistances [3,21]. Therefore, it is unlikely that this improvement is only due to the difference in anodization current. The performance of 5CD-5GA is then probably a synergistic interaction between low current density and low GA concentration. However, the exact mechanism of this behavior still needs to be explored. One possibility is that the behavior is related to the complex formation between Al3+ and GA or its derivatives [36]. The resulting complex might have been incorporated into the oxide layer surface, which then improved its resistance to dissolution [35]. The same process might not have resulted in similar improvements in the samples anodized at higher current densities, given the higher degree of incorporation of other anions with the electrolyte. Another possibility is that the improvement is a consequence of the higher degree of homogeneity of the sample 5CD-5GA, as seen in Figure 7c and Figure 8c [8].
3.3. Linear Polarization
Linear polarization was implemented to supplement the corrosion data obtained using EIS. Figure 9 and Figure 10 show the Tafel plots generated from the linear polarization of the samples. The anodic branch of the plots show a gradual change in current density with increasing potential. This is indicative of passivation associated with the presence of the oxide layer. The cathodic branch, on the other hand, exhibits a relatively steeper slope which is associated with mixed control response [30,37].
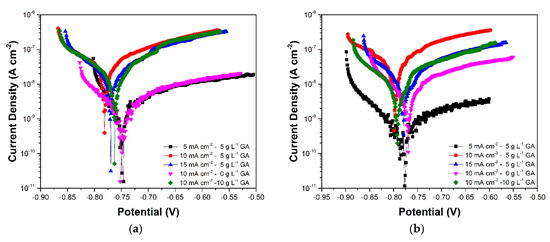
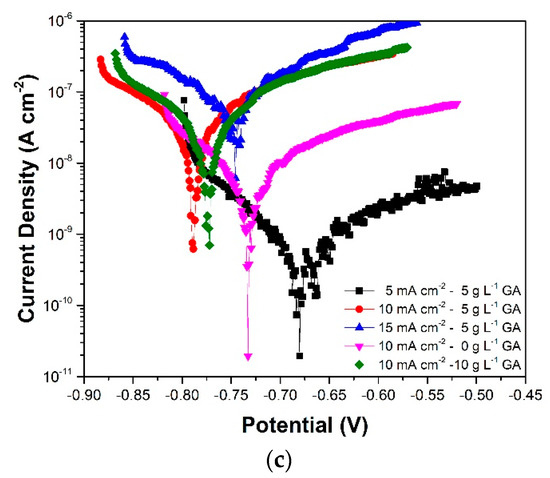
Figure 9.
Tafel plots of the anodized aluminum samples acquired after (a) 3 days, (b) 7 days, and (c) 10 days of immersion in 3.5 wt. % NaCl.
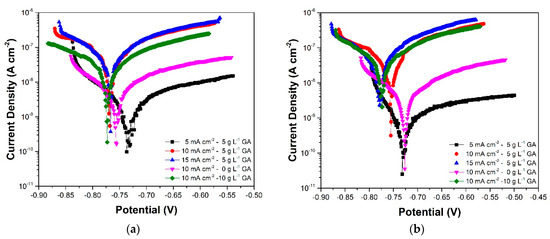
Figure 10.
Tafel plots of the anodized aluminum samples acquired after (a) 15 days, and (b) 20 days of immersion in 3.5 wt.% NaCl.
Table 2 shows the corrosion parameters obtained from the Tafel plots. The corrosion potential (Ecorr) values show a decrease during the initial stages of immersion, followed by a gradual increase in the latter part of the immersion. These changes are observed to occur with an increase and subsequent stabilization of the corrosion current density (jcorr). These responses are attributed to the initial dissolution and subsequent self-sealing of the oxide layer which was also apparent in the EIS results. At the end of the immersion period, samples 5CD-5GA and 10CD-0GA have the relatively highest Ecorr. The small difference in the corrosion potentials of the samples suggests though that they have comparable susceptibility to corrosion. Nonetheless, comparison of the sample Ecorr values against Ecorr of un-anodized AA1100 (−875 V vs. Ag/AgCl, 23 °C) exposed to a similar electrolyte shows that the anodized metals are less prone to corrosion [38]. Meanwhile, more pronounced differences can be observed in the jcorr values. Sample 5CD-5GA exhibited the lowest jcorr indicating that it has the lowest corrosion rate among the samples.

Table 2.
Corrosion parameters measured from Tafel plots of each sample.
Polarization resistance (RP) is a corrosion parameter proportional to jcorr and is also an indicator of the rate of corrosion of the material [39]. It is calculated from the corrosion current density and the Tafel slopes, which are measured from the anodic and cathodic branches of the Tafel plots. The relative RP values for each sample are observed to be consistent with the RBL values acquired using EIS. Sample 5CD-5GA still has the highest RP values for the most part of immersion. Additionally, the changes in the RP values follow the same trend as the changes in the RBL values. This further supports the corrosion behavior described by the EIS results.
4. Conclusions
The corrosion behavior of AA 1100 samples anodized in gallic-sulfuric acid baths was explored. It was determined that anodization, at different current densities and GA concentrations, can affect the thickness of the oxide layer produced and the corrosion behavior of the anodized samples. High anodization current densities and high GA concentrations can lead to lower corrosion resistances. However, anodization at low GA concentration (5 g·L−1) and low current density (5 mA·cm−2) can lead to superior corrosion resistances, relative to the sample anodized in sulfuric acid alone. Considering this behavior, we recommend exploring the corrosion behavior of the samples anodized at much lower current density and GA concentrations. Further studies to determine the mechanisms behind the observed effects of GA are also needed.
Altogether, it was established that at particular conditions, gallic-sulfuric acid anodization of aluminum can provide excellent corrosion protection. Being a naturally-occurring compound, the use of gallic acid also poses lower health and environmental hazards. As such, gallic-sulfuric acid anodization can be considered as a potential alternative for Cr(VI)-based treatments.
Author Contributions
Conceptualization, M.L.M.J., J.S.G., D.M.M. and C.J.C.N.; methodology, M.L.M.J., J.S.G., D.M.M. and C.J.C.N.; software, M.L.M.J., J.S.G., D.M.M. and C.J.C.N.; validation, M.L.M.J., J.S.G., D.M.M. and C.J.C.N.; formal analysis, M.L.M.J.; investigation, D.M.M.; resources, M.L.M.J.; data curation, M.L.M.J.; writing—original draft preparation, M.L.M.J., J.S.G., D.M.M. and C.J.C.N.; writing—review and editing, M.L.M.J.; visualization, M.L.M.J.; supervision, M.L.M.J.; project administration, M.L.M.J. All authors have read and agreed to the published version of the manuscript.
Funding
This research received no external funding.
Institutional Review Board Statement
Not applicable.
Informed Consent Statement
Not applicable.
Data Availability Statement
The data presented in this study are available in this article.
Acknowledgments
The authors would like to extend their gratitude to the donors of the UP Diliman College of Engineering Cesar Buenaventura Professorial Chair.
Conflicts of Interest
The authors declare no conflict of interest.
References
- Varshney, D.; Kumar, K. Application and use of different aluminium alloys with respect to workability, strength and welding parameter optimization. Ain Shams Eng. J. 2021, 12, 1143–1152. (in press). [CrossRef]
- Liu, G.; Müller, D.B. Addressing sustainability in the aluminum industry: A critical review of life cycle assessments. J. Clean. Prod. 2012, 35, 108–117. [Google Scholar] [CrossRef]
- Raj, V.; Mumjitha, M. Comparative study of formation and corrosion performance of porous alumina and ceramic nanorods formed in different electrolytes by anodization. Mater. Sci. Eng. B Solid-State Mater. Adv. Technol. 2014, 179, 25–35. [Google Scholar] [CrossRef]
- Cerchier, P.; Pezzato, L.; Gennari, C.; Moschin, E.; Moro, I.; Dabalà, M. PEO coating containing copper: A promising anticorrosive and antifouling coating for seawater application of AA 7075. Surf. Coat. Technol. 2020, 393, 125774. [Google Scholar] [CrossRef]
- Martínez-Viademonte, M.P.; Abrahami, S.T.; Hack, T.; Burchardt, M.; Terryn, H. A review on anodizing of aerospace aluminum alloys for corrosion protection. Coatings 2020, 10, 1106. [Google Scholar] [CrossRef]
- Osborne, J.H. Observations on chromate conversion coatings from a sol-gel perspective. Prog. Org. Coat. 2001, 41, 280–286. [Google Scholar] [CrossRef]
- Xia, L.; McCreery, R.L. Chemistry of a chromate conversion coating on aluminum alloy AA2024-T3 probed by vibrational spectroscopy. J. Electrochem. Soc. 1998, 145, 3083–3089. [Google Scholar] [CrossRef]
- Cabral, J.; Gaona, C.; Estupinán, F.; Lara, M.; Zambrano, P.; Nieves, D.; Maldonado, E.; Chacón, J.; Almeraya, F. Corrosion resistance of hard coat anodized AA 6061 in citric-sulfuric solutions. Coatings 2020, 10, 601. [Google Scholar] [CrossRef]
- Boisier, G.; Pébère, N.; Druez, C.; Villatte, M.; Suel, S. FESEM and EIS study of sealed AA2024 T3 anodized in sulfuric acid electrolytes: Influence of tartaric acid. J. Electrochem. Soc. 2008, 155, C521. [Google Scholar] [CrossRef]
- Vignoli Machado, T.; Atz Dick, P.; Knörnschild, G.H.; Dick, L.F.P. The effect of different carboxylic acids on the sulfuric acid anodizing of AA2024. Surf. Coat. Technol. 2020, 383, 125283. [Google Scholar] [CrossRef]
- Stepniowski, W.J.; Michalska, M.; Norek, M.; Twardosz, E.; Florkiewicz, W.; Polkowski, W.; Zasada, D.; Bojar, Z. Anodization of cold deformed technical purity aluminum (AA1050) in oxalic acid. Surf. Coat. Technol. 2014, 258, 268–274. [Google Scholar] [CrossRef]
- Sulka, G.D.; Stepniowski, W.J. Structural features of self-organized nanopore arrays formed by anodization of aluminum in oxalic acid at relatively high temperatures. Electrochim. Acta 2009, 54, 3683–3691. [Google Scholar] [CrossRef]
- Lu, J.; Wei, G.; Yu, Y.; Guo, C.; Jiang, L. Aluminum alloy AA2024 anodized from the mixed acid system with enhanced mechanical properties. Surf. Interfaces 2018, 13, 46–50. [Google Scholar] [CrossRef]
- Nayeem, N.; Smb, A.; Salem, H.; Ahel-Alfqy, S. Gallic acid: A promising lead molecule for drug development. J Appl. Pharm. 2016, 8, 1–4. [Google Scholar] [CrossRef]
- Friedemann, W.; Germscheid, H.G. Sealing anodized aluminum. U.S. Patent US3838023A, 24 September 1974. [Google Scholar]
- Schaedel, F.C. Aerospace Anodizing Total Quality Improvement (TQI) Activation-Protection-Promotion with the Complete Spectrum Plus System. In Proceedings of the 2015 Anodizing Conference, San Diego, CA, USA, 15–17 September 2015. [Google Scholar]
- Ali, E.H.; Himdan, T.A.; Ahmed, Z.W. Gallic acid as corrosion inhibitor for aluminum 6061 in alkali solutions. Ibn AL-Haitham J. Pure Appl. Sci. 2019, 32, 16. [Google Scholar] [CrossRef]
- Keny, S.J.; Kumbhar, A.G.; Thinaharan, C.; Venkateswaran, G. Gallic acid as a corrosion inhibitor of carbon steel in chemical decontamination formulation. Corros. Sci. 2008, 50, 411–419. [Google Scholar] [CrossRef]
- Obot, I.B.; Madhankumar, A. Enhanced corrosion inhibition effect of tannic acid in the presence of gallic acid at mild steel/HCl acid solution interface. J. Ind. Eng. Chem. 2015, 25, 105–111. [Google Scholar] [CrossRef]
- Long, J.; Borissova, A.; Wilson, A.D.; Avelar-Batista Wilson, J.C. Sample preparation of anodised aluminium oxide coatings for scanning electron microscopy. Micron 2017, 101, 87–94. [Google Scholar] [CrossRef][Green Version]
- Chung, I.C.; Chung, C.K.; Su, Y.K. Effect of current density and concentration on microstructure and corrosion behavior of 6061 Al alloy in sulfuric acid. Surf. Coat. Technol. 2017, 313, 299–306. [Google Scholar] [CrossRef]
- Ono, S.; Asoh, H. Mechanism of hot water sealing of anodic films formed on aluminum. Corros. Sci. 2021, 181, 109221. [Google Scholar] [CrossRef]
- Poinern, G.E.J.; Ali, N.; Fawcett, D. Progress in nano-engineered anodic aluminum oxide membrane development. Materials 2011, 4, 487–526. [Google Scholar] [CrossRef] [PubMed]
- Suzuki, Y.; Kawahara, K.; Kikuchi, T.; Suzuki, R.O.; Natsui, S. Corrosion-resistant porous alumina formed via anodizing aluminum in etidronic acid and its pore-sealing behavior in boiling water. J. Electrochem. Soc. 2019, 166, C261–C269. [Google Scholar] [CrossRef]
- Vrublevsky, I.; Parkoun, V.; Sokol, V.; Schreckenbach, J. Study of chemical dissolution of the barrier oxide layer of porous alumina films formed in oxalic acid using a re-anodizing technique. Appl. Surf. Sci. 2004, 236, 270–277. [Google Scholar] [CrossRef]
- Usman, B.J.; Scenini, F.; Curioni, M. Corrosion testing of anodized aerospace alloys: Comparison between immersion and salt spray testing using electrochemical impedance spectroscopy. J. Electrochem. Soc. 2020, 167, 041505. [Google Scholar] [CrossRef]
- Huang, Y.; Shih, H.; Huang, H.; Daugherty, J.; Wu, S.; Ramanathan, S.; Chang, C.; Mansfeld, F. Evaluation of the corrosion resistance of anodized aluminum 6061 using electrochemical impedance spectroscopy (EIS). Corros. Sci. 2008, 50, 3569–3575. [Google Scholar] [CrossRef]
- Moutarlier, V.; Gigandet, M.P.; Pagetti, J.; Ricq, L. Molybdate/sulfuric acid anodising of 2024-aluminium alloy: Influence of inhibitor concentration on film growth and on corrosion resistance. Surf. Coat. Technol. 2003, 173, 87–95. [Google Scholar] [CrossRef]
- Bouchama, L.; Azzouz, N.; Boukmouche, N.; Chopart, J.P.; Daltin, A.L.; Bouznit, Y. Enhancing aluminum corrosion resistance by two-step anodizing process. Surf. Coat. Technol. 2013, 235, 676–684. [Google Scholar] [CrossRef]
- González-Rovira, L.; González-Souto, L.; Astola, P.J.; Bravo-Benítez, C.; Botana, F.J. Assessment of the corrosion resistance of self-ordered anodic aluminum oxide (AAO) obtained in tartaric-sulfuric acid (TSA). Surf. Coat. Technol. 2020, 399, 126131. [Google Scholar] [CrossRef]
- Zhao, X.H.; Zuo, Y.; Zhao, J.M.; Xiong, J.P.; Tang, Y.M. A study on the self-sealing process of anodic films on aluminum by EIS. Surf. Coat. Technol. 2006, 200, 6846–6853. [Google Scholar] [CrossRef]
- Suay, J.J.; Giménez, E.; Rodríguez, T.; Habbib, K.; Saura, J.J. Characterization of anodized and sealed aluminium by EIS. Corros. Sci. 2003, 45, 611–624. [Google Scholar] [CrossRef]
- Moutarlier, V.; Gigandet, M.P.; Normand, B.; Pagetti, J. EIS characterisation of anodic films formed on 2024 aluminium alloy, in sulphuric acid containing molybdate or permanganate species. Corros. Sci. 2005, 47, 937–951. [Google Scholar] [CrossRef]
- Vrublevsky, I.; Parkoun, V.; Sokol, V.; Schreckenbach, J.; Marx, G. The study of the volume expansion of aluminum during porous oxide formation at galvanostatic regime. Appl. Surf. Sci. 2004, 222, 215–225. [Google Scholar] [CrossRef]
- Ma, Y.; Zhou, X.; Liao, Y.; Chen, X.; Zhang, C.; Wu, H.; Wang, Z.; Huang, W. Effect of anodizing parameters on film morphology and corrosion resistance of AA2099 aluminum-lithium alloy. J. Electrochem. Soc. 2016, 163, C369–C376. [Google Scholar] [CrossRef]
- Ó’Coinceanainn, M.; Hynes, M.J. The kinetics and mechanisms of the reactions of aluminium(III) with gallic acid, gallic acid methyl ester and adrenaline. J. Inorg. Biochem. 2001, 84, 1–12. [Google Scholar] [CrossRef]
- García-Rubio, M.; de Lara, M.P.; Ocón, P.; Diekhoff, S.; Beneke, M.; Lavía, A.; García, I. Effect of postreatment on the corrosion behaviour of tartaric-sulphuric anodic films. Electrochim. Acta 2009, 54, 4789–4800. [Google Scholar] [CrossRef]
- Ezuber, H.; El-Houd, A.; El-Shawesh, F. A study on the corrosion behavior of aluminum alloys in seawater. Mater. Des. 2008, 29, 801–805. [Google Scholar] [CrossRef]
- Toshev, Y.; Mandova, V.; Boshkov, N.; Stoychev, D.; Petrov, P.; Tsvetkova, N.; Raichevski, G.; Tsvetanov, C.; Gabev, A.; Velev, R.; et al. Protective coating of zinc and zinc alloys for industrial applications. In Proceedings of the 4M 2006—Second International Conference on Multi-Material Micro Manufacture; Elsevier: Amsterdam, Netherlands, 2006; pp. 323–326. [Google Scholar]
Publisher’s Note: MDPI stays neutral with regard to jurisdictional claims in published maps and institutional affiliations. |
© 2021 by the authors. Licensee MDPI, Basel, Switzerland. This article is an open access article distributed under the terms and conditions of the Creative Commons Attribution (CC BY) license (https://creativecommons.org/licenses/by/4.0/).