
Software (GUI/APP) for Developing AI-Based Models Capable of Predicting Load-Displacement Curve and AFM Image during Nanoindentation


Abstract

1. Introduction
1.1. Modeling and Simulations: Current State of the Art
1.2. Challenges: Experiments, Modeling, and Simulations
1.2.1. Proposed Computational Platform/Software
1.2.2. Problem Formulation for Software Development
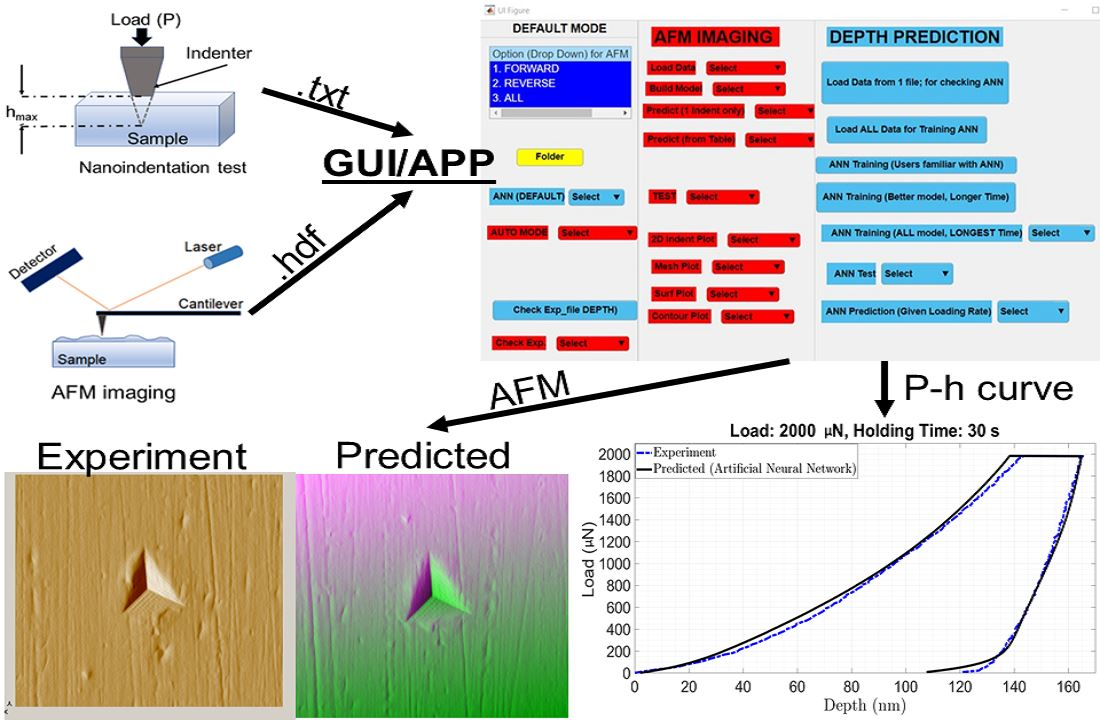
- Software (GUI/APP) has independent modules for developing predictive models for indentation depth/load displacement curve and AFM indent image.
- Software (GUI/APP) can predict the outcomes of a nanoindentation test for new test conditions in form of indentation depth (load-displacement curve) and indent image (AFM).
- Software (GUI/APP) can be used on a regular desktop and laptop, thus avoiding significant investments in purchasing new computers.
- Computation time must be reasonable. We defined an upper limit of one hour for model development and prediction of nanoindentation test results for new test conditions.
- Develop a version of software that can be used for free.
- Software (GUI/APP) must have options for users who are experimentalists with limited exposure to AI algorithms, and also for users who are expert in AI.
- Provision for plotting load-displacement curve and AFM image from machine generated files in text and HDF format [32] respectively without pre-processing or even opening these files.
1.2.3. Software Testing: Case Studies
1.3. Main Objective and Outcomes
Novelty
2. Materials and Methods
2.1. Machine Generated Data
2.1.1. Indentation Depth Data in Text (.txt) Format
2.1.2. AFM Image Data in HDF (.hdf) Format
2.2. Case Studies
2.2.1. Cold Sprayed Aluminum-Based Bulk Metallic Glass (AL-BMG) Coating
- Indentation depth prediction and plotting load-displacement curve: a total of 24 indentation experiments were performed and 24 text files were generated.
- Indentation image prediction using image files in HDF (.hdf) format: a total of 24 indentation experiments were performed. Out of which, AFM indentation imaging was performed in 18 of these indentation tests. Imaging was performed in both FORWARD and REVERSE direction. Thus, there were 18 HDF files for each of GF, GR, TF, and TR corresponding to each of these indents.
2.2.2. Al-5CNT Coating
- Indentation depth prediction and plotting load-displacement curve: a total of nine indentation experiments were performed and nine text files were generated.
2.2.3. Spark-Plasma-Sintered Hydroxyapatite (HA) Sample
- Indentation depth prediction and plotting load-displacement curve: a total of 10 indentation experiments were performed and 10 text files were generated for each matrix. Separate load-displacement curves were plotted for each matrix.
2.3. Software Development
- Processor (CPU): Intel® Core™ i7-4980HQ
- CPU Speed: 2.8 to 4 GHz w/Turbo Boost
- Cores: 4
- Memory: 32 GB DDR3L 1600 MHz.
2.3.1. Execution Time
Indentation Depth and Plotting Load-Displacement Curve
- Development of one artificial neural network (ANN) model: varies between 1 to 10 min (maximum).
- Prediction of depth: maximum 1 min.
AFM Indent Imaging
- Development of model for AFM indent image:
- ○
- Maximum 30–35 min if all 4 HDF files are used, GF, GR, TF, and TR. That is when imaging was performed in both FORWARD and REVERSE direction.
- ○
- Maximum 15–20 min (maximum) if 2 HDF files are used (GF, TF) or (GR, TR). This is for the case when imaging was performed in either only FORWARD direction or only REVERSE direction.
- Prediction of an AFM indent image:
- ○
- Maximum 3–4 min for all 4 HDF files, GF, GR, TF, and TR.
- ○
- Maximum 2–3 min if 2 HDF files are used (GF, TF) or (GR, TR).
2.3.2. File Name
- TEXT files generated from the machine: the name of the file must include the load and holding time, like ABCD-2000-30-XX.TXT, for maximum applied load of 2000 µN, and holding time of 30 s.
- HDF files generated from the machine: name of the file must include the load and holding time, like ABCD-2000-30-XX-GF.HDF, ABCD-2000-30-XX-GR.HDF, ABCD-2000-30-XX-TF.HDF, and ABCD-2000-30-XX-TR.HDF for maximum applied load of 2000 µN, and holding time of 30 s.
- The numerical value of any other parameters can be similarly added to the file name.
- This format of file name will be helpful, and the software will directly extract the parameter values or test condition values from the name of these files. This way a user will not have to put extra effort in preparing a separate sheet with test conditions for the experiments performed.
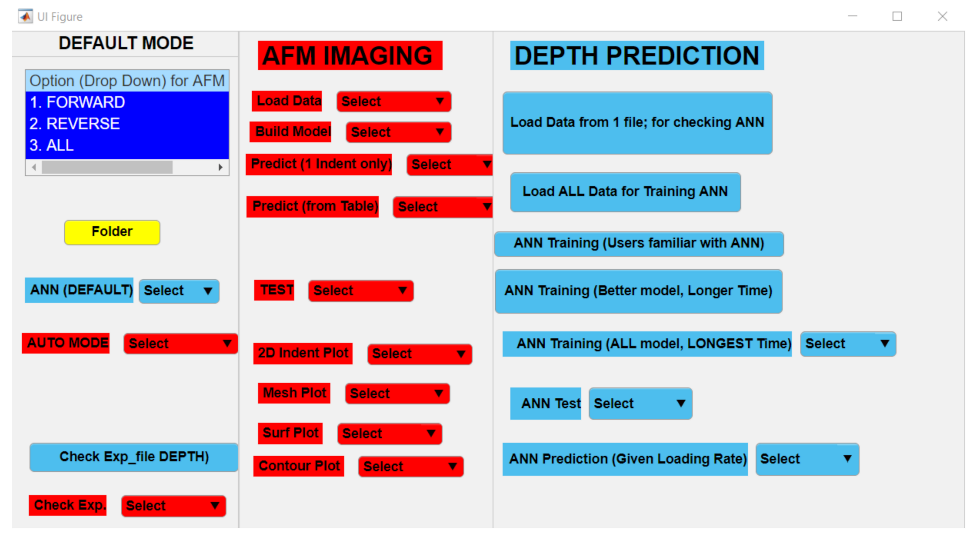
2.3.3. Software Layout
3. Results
- Indentation depth (load-displacement curve) prediction
- Prediction of indent image (AFM).
3.1. Indentation Depth (Load-Displacement Curve) Prediction
3.1.1. ANN Model Development in This Work
3.1.2. Discussions on ANN Model
- Error metrics reported in Table 1: here, 15% of the data were assigned to the testing set. Data included in the testing set were not introduced to the ANN model during its development, but the ANN model performed well on the testing set as error metrics are similar for training, validation, and testing set reported in Table 1.
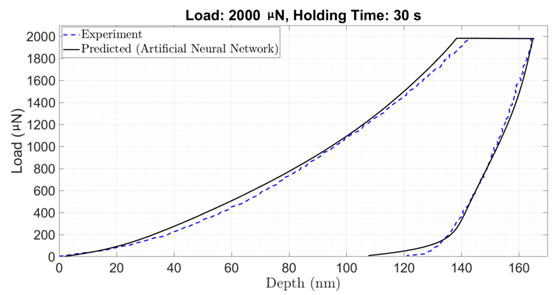
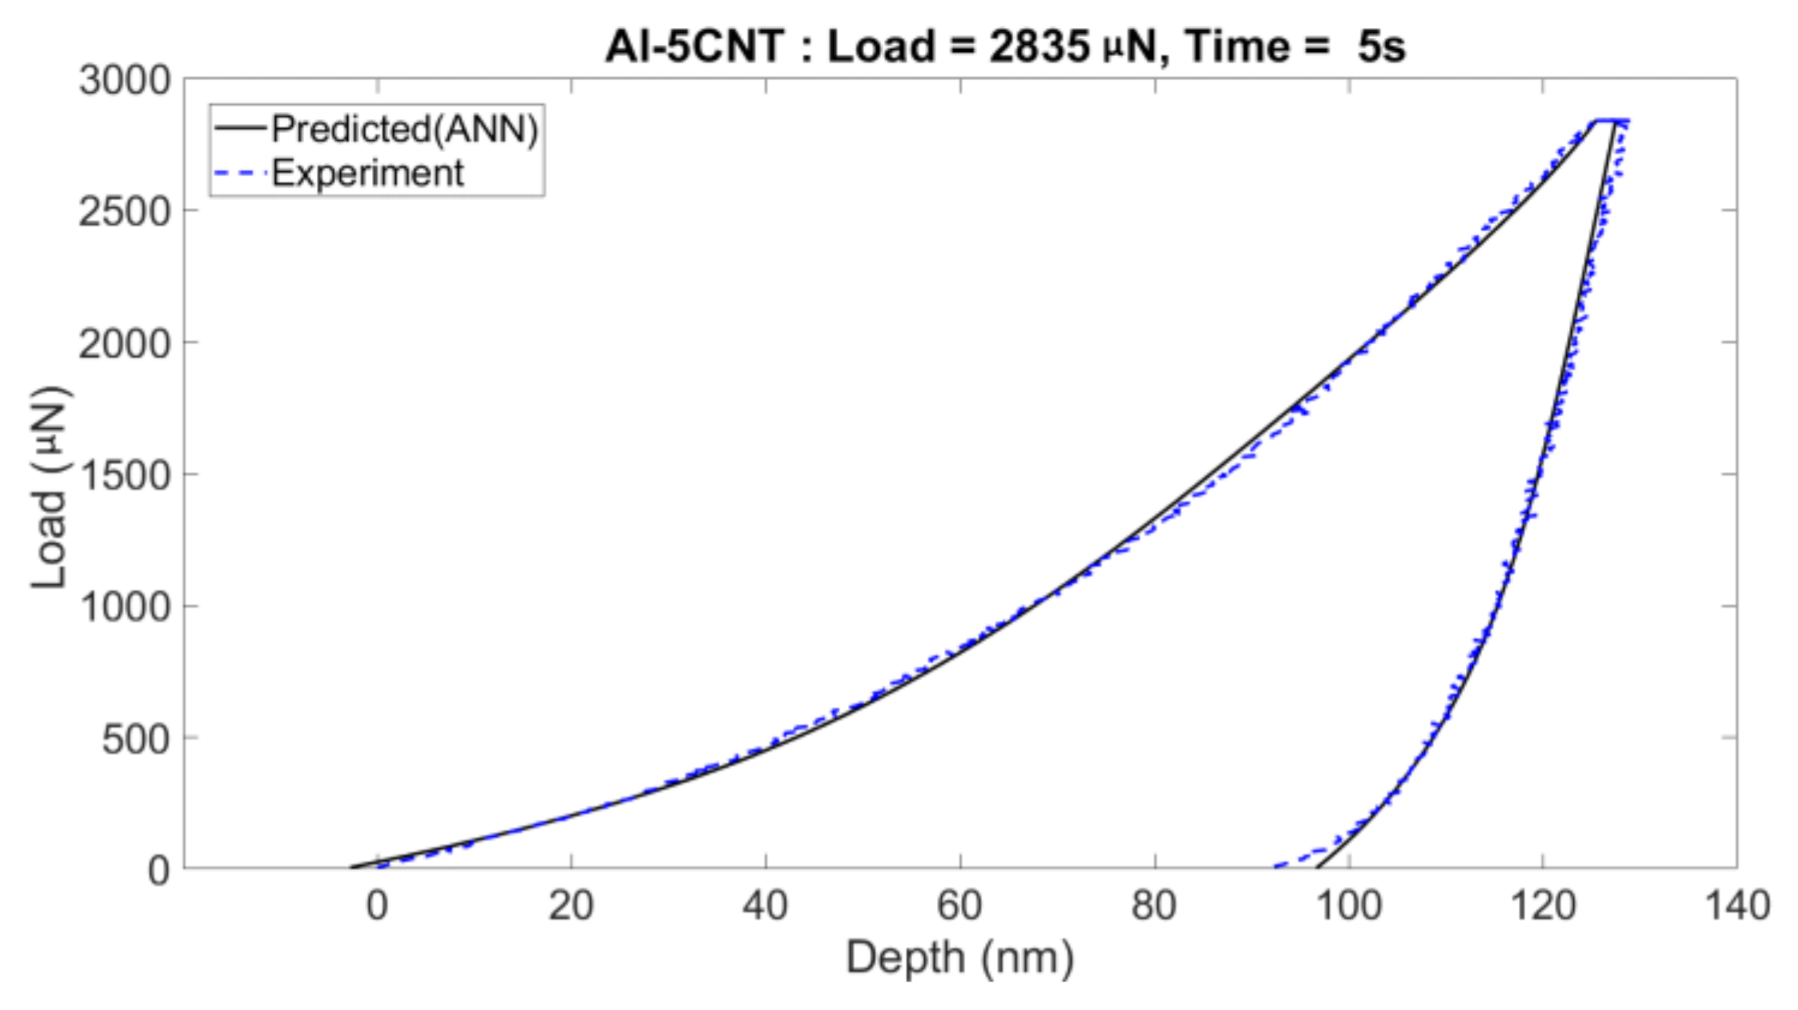
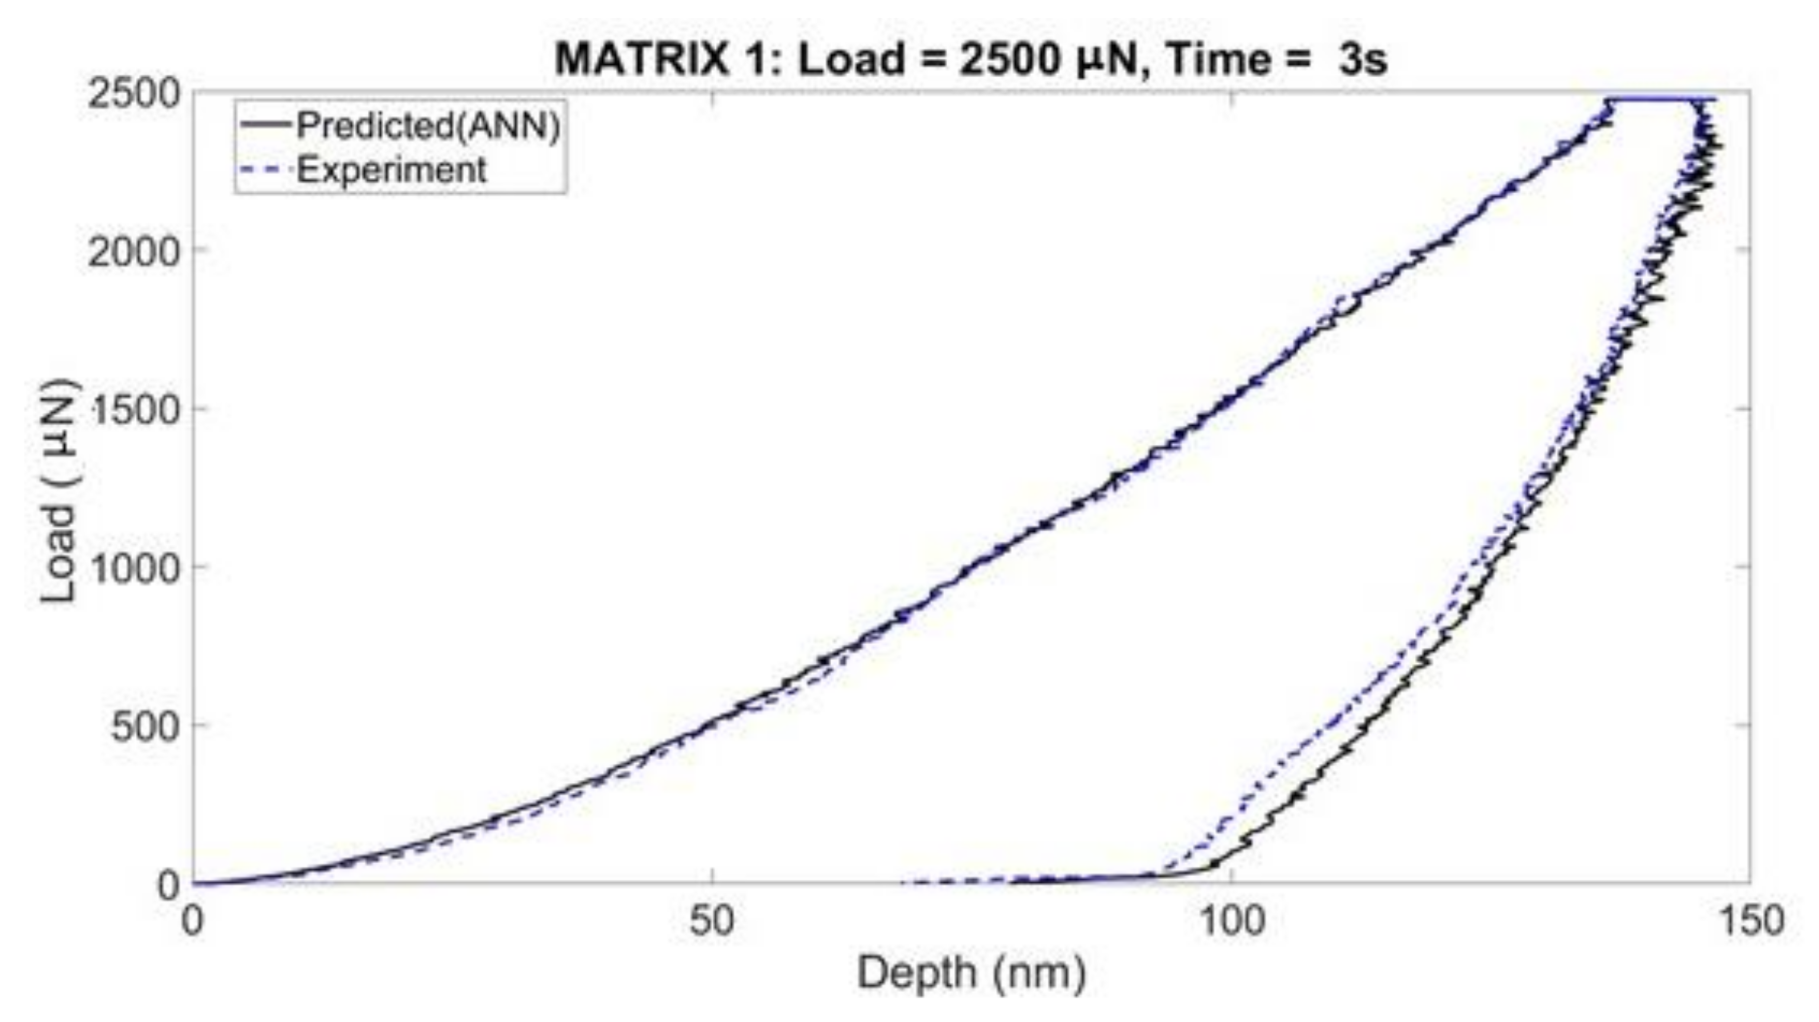
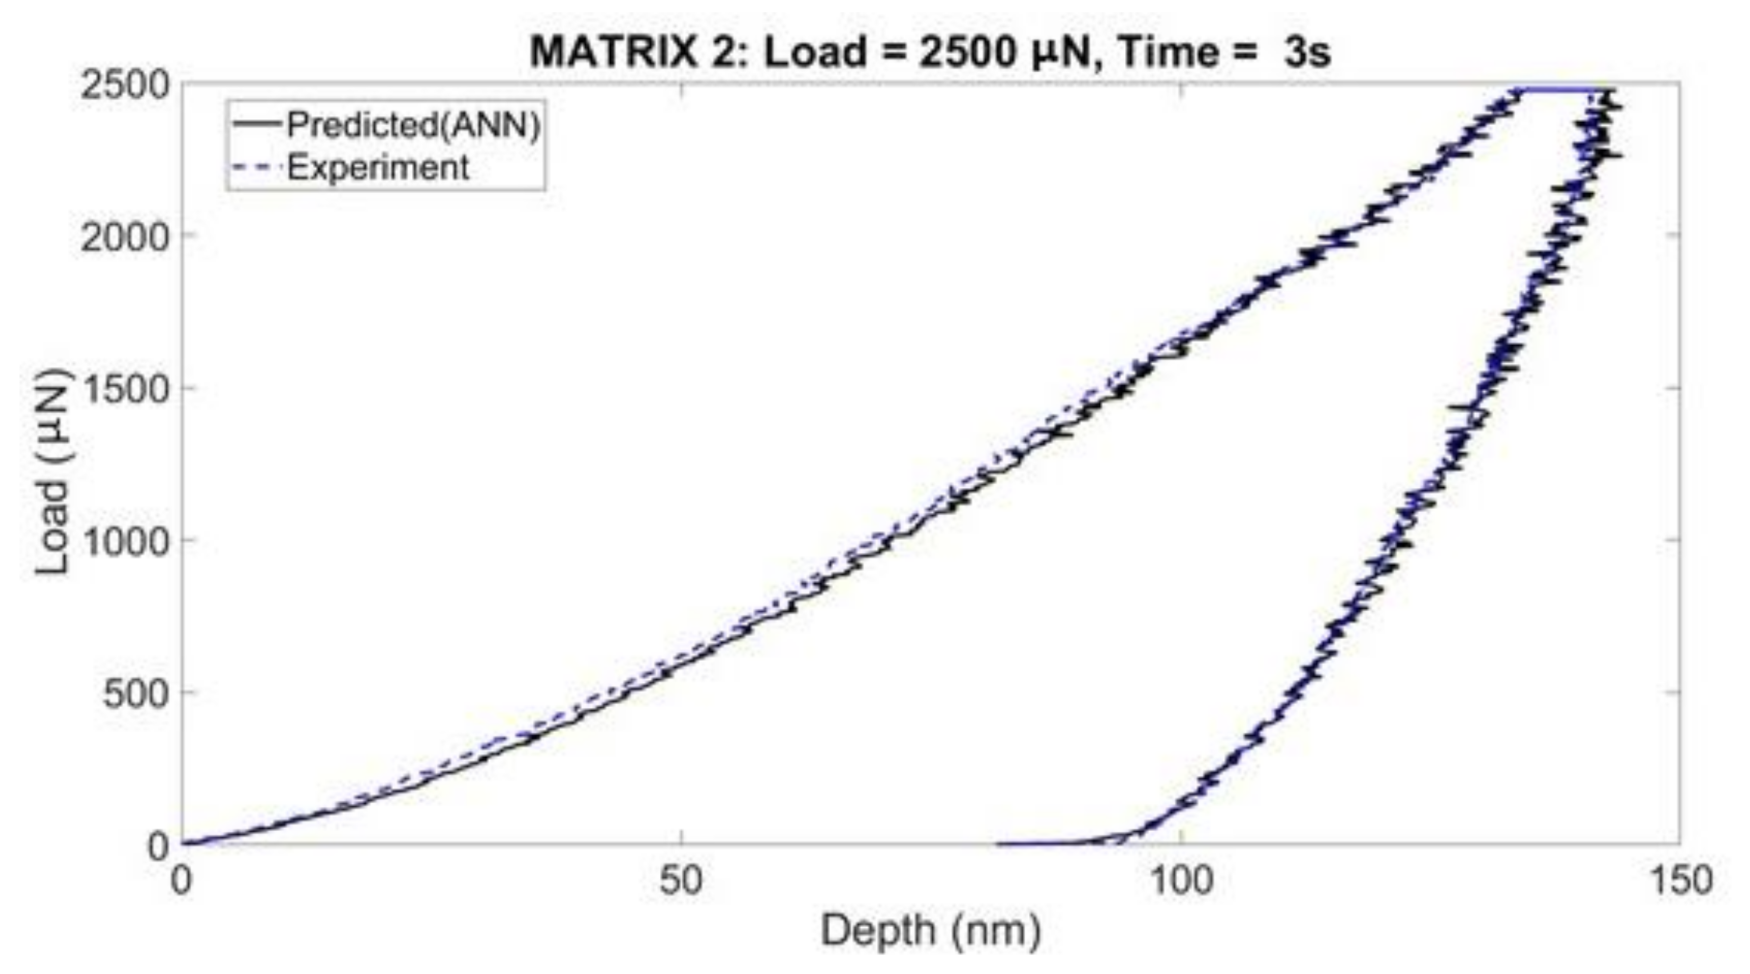
- Comparison between load-displacement curves obtained from the experiment and the curve predicted by ANN model: in this case too, these data were not introduced to the ANN model during training, but the ANN model performs well as it was able to capture the trends shown by the experiments (Figure 3). (We had 24 text files out of which 1 text file was separated in the beginning for this comparison. We mentioned that 23 files were used for model development).
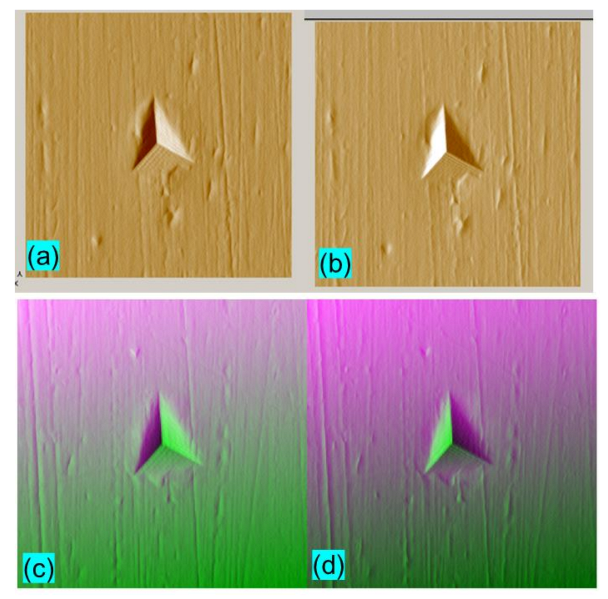
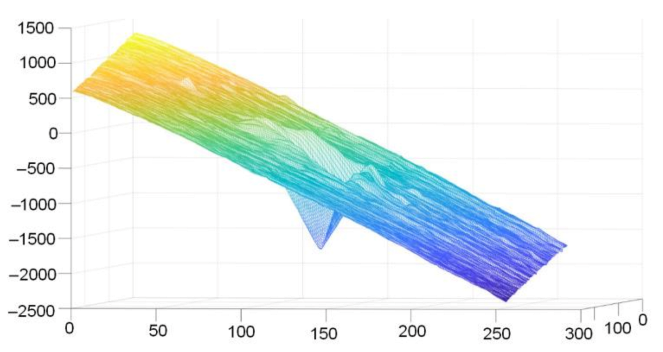
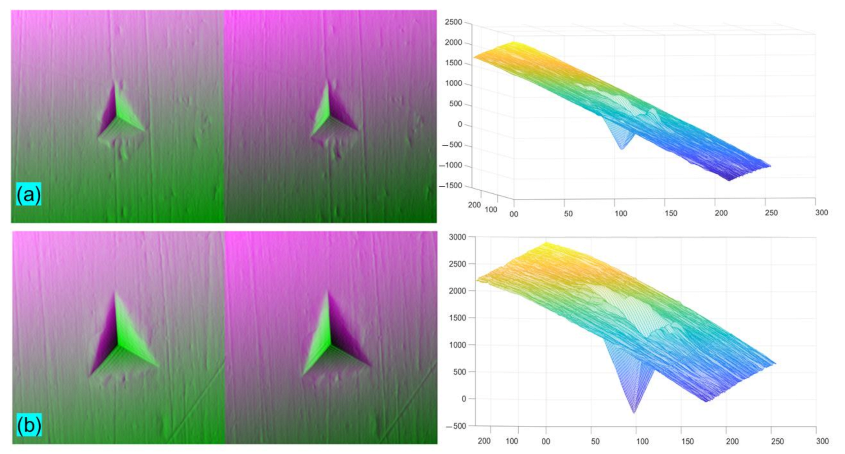
3.2. Prediction of Indent Image (AFM)
3.2.1. Model Development for AFM Image
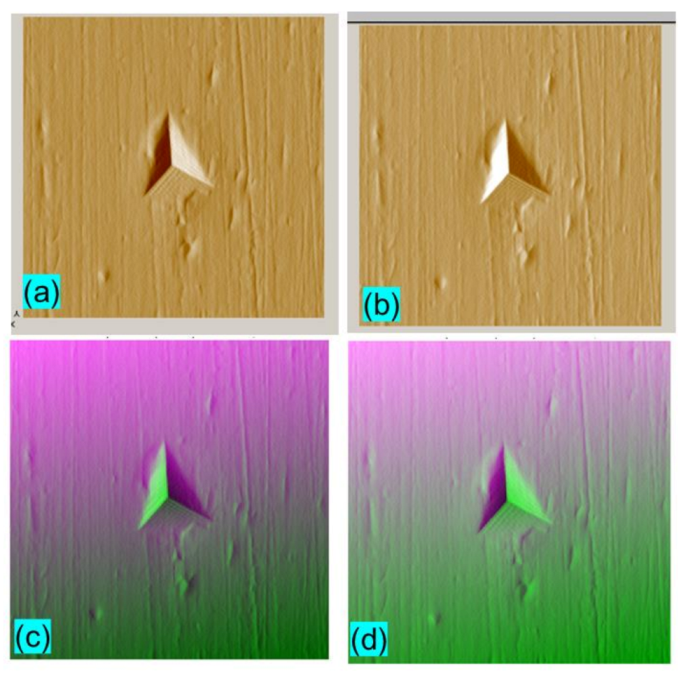
3.2.2. Testing an AFM Image Model for New Test Condition
4. Discussion
4.1. AI-Based Models for Indentation Depth
- ○
- MSE ~4.5 and correlation (R-value) ~0.9999.
- ○
- Nice fitting
- ○
- In this case, “maximum applied load” and “holding time” were used as model parameters. There were three different “maximum applied loads” and eight different “holding times”. The randomness of experimental parameters is average when compared with other case studies. Thus, fitting is nice, but average, when compared with other case studies.
- ○
- Fitting is acceptable. Though MSE can be reduced by re-training the model with the same model parameters or using a different set of parameters, number of neurons in the hidden layer, training, validation, and testing set size also affect the model accuracy and can be changed.
- ○
- MSE ~1.0 and correlation (R-value) ~0.9999.
- ○
- Best fitting among the three case studies.
- ○
- In this case, “maximum applied load” and “loading rate” were used as model parameters. There were nine different “maximum applied loads” and nine different “loading rates”. The randomness of experimental parameters is best when compared with other case studies. Thus, fitting is best when compared with other case studies.
- ○
- Fitting is acceptable. Retraining the model is not needed as error values are quite low. MSE can be reduced and a value of zero means “no error”. Since ANN models are prone to “overfitting”, one must avoid trying to reach a value of zero for MSE.
- Case study 2.2.3. spark-plasma-sintered hydroxyapatite (HA) sample [28] in Appendix A:
- ○
- MSE ~10.0 and correlation (R-value) ~0.995.
- ○
- Comparatively bad fitting when compared among the three case studies.
- ○
- In this case, “maximum applied load” and “loading rate” are identical in all the cases. There is no randomness for these two model parameters. Thus, fitting is comparatively bad, when compared with other case studies. Fitting is acceptable as we are dealing with a noisy data set. There is scope of improvement in fitting and can be done by working on reducing MSE. However, the problem is lack of randomness of two of the experimental test parameters. Due to lack of randomness of experimental parameter, combined with noisy nature of the dataset, there will not be any significant improvement in the fitting. For this type of dataset, “overfitting” is a major concern.
4.2. AI-Based Models for AFM Indent Image
5. Conclusions
- Predictive models were developed by application of concepts of artificial intelligence on raw data files generated by the nanoindentation machine (data are in .txt and .hdf format).
- We have successfully tested our approach on three different coatings/materials. Predicted results have been presented in the form of a load-displacement curve and AFM indent image. Predicted results are in good agreement with the experimental findings.
- In this work, we used data from 9, 10, and 24 indentation experiments. Properly planned, nine experiments can be used for analyzing nanomechanical properties of a material like Case study 2.2.2.: carbon nanotube reinforced aluminum composite (Al-5CNT) coating. Properly planned here means randomized experimental test conditions like “maximum applied load”, “holding time”, and “loading rate”. The more randomized the values of these test conditions, the better the prediction capability of the model.
- Model development for indentation depth and AFM image is less than an hour. Model execution time for indentation depth in less than a minute, while for AFM image, it varies between 2–4 min. Thus, a user can develop AI-based models and perform a few simulations within an hour.
- This work can be helpful for experimentalists in significantly reducing the number of experiments performed by them while characterizing a coating/material through nanoindentation.
- We can easily adapt our platform for incorporating additional test conditions/parameters.
- If a user names the files as per our instructions, a user just needs to place all the files in a folder and can try our “DEFAULT” option. This makes our method extremely simple for experienced experimentalists who do not need or want to invest time in understanding artificial intelligence algorithms. This software (GUI/APP) can be used as a screening tool prior to performing experiments. We have added options for users with AI expertise too.
- All of this work was performed on a laptop. Thus, a user can use their current computer/laptop for this work.
5.1. Recommendations/Suggestions
5.2. Future Work
6. Patents
Supplementary Materials
Author Contributions
Funding
Institutional Review Board Statement
Informed Consent Statement
Data Availability Statement
Conflicts of Interest
Appendix A


References
- Oliver, W.; Pharr, G. An improved technique for determining hardness and elastic modulus using load and displacement sensing indentation experiments. J. Mater. Res. 1992, 7, 1564–1583. [Google Scholar] [CrossRef]
- Chu, Q.; Xu, S.; Zhu, X.; Zhu, Z.; Zhang, H.; Bai, R.; Lei, Z.; Yan, C. Effects of testing conditions on the deformation behaviour of a Ti-based bulk metallic glass. Mater. Sci. Eng. A 2019, 766, 138404. [Google Scholar] [CrossRef]
- Liu, H.; Wei, Y.; Liang, L.; Wang, Y.; Song, J.; Long, H.; Liu, Y. Microstructure observation and nanoindentation size effect characterization for micron-/nano-grain TBCs. Coatings 2020, 10, 345. [Google Scholar] [CrossRef]
- Qian, L.; Zhao, H. Nanoindentation of soft biological materials. Micromachines 2018, 9, 654. [Google Scholar] [CrossRef] [PubMed]
- Staszczyk, A.; Sawicki, J.; Kołodziejczyk, Ł.; Lipa, S. Nanoindentation study of intermetallic particles in 2024 Aluminum alloy. Coatings 2020, 10, 846. [Google Scholar] [CrossRef]
- Zhang, W.; Li, J.; Xing, Y.; Nie, X.; Lang, F.; Yang, S.; Hou, X.; Zhao, C. Experimental study on the thickness-dependent hardness of SiO2 thin films using nanoindentation. Coatings 2021, 11, 23. [Google Scholar] [CrossRef]
- Xu, K.W.; Hou, G.L.; Hendrix, B.C.; He, J.W.; Sun, Y.; Zheng, S.; Bloyce, A.; Bell, T. Prediction of nanoindentation hardness profile from a load-displacement curve. J. Mater. Res. 1998, 13, 3519. [Google Scholar] [CrossRef]
- SPM Modi and Measurement Methods. Available online: https://www.dme-spm.com/spmmodi.html (accessed on 20 February 2021).
- Gibson, R.F. A review of recent research on nanoindentation of polymer composites and their constituents. Compos. Sci. Technol. 2014, 105, 51–65. [Google Scholar] [CrossRef]
- Khezri, M.; Bradford, M.A.; Vrcelj, Z. Application of RKP-FSM in the buckling and free vibration analysis of thin plates with abrupt thickness changes and internal supports. Int. J. Numer. Methods Eng. 2015, 104, 125–156. [Google Scholar] [CrossRef]
- Khosravania, M.R.; Nasiri, S.; Weinber, K. Prediction of fracture in sandwich-structured composite joints using CBR approach. Procedia Struct. Integr. 2018, 13, 168–173. [Google Scholar] [CrossRef]
- Hu, J.; Sun, S.; Zhang, W.; Peng, G.; Han, S.; Sun, X.; Zhang, Y.; Zhang, T. Softening behaviors of severely deformed Zn alloy studied by the nanoindentation. Coatings 2020, 10, 803. [Google Scholar] [CrossRef]
- Ye, D.; Wang, W.; Xu, Z.; Yin, C.; Zhou, H.; Li, Y. Prediction of thermal barrier coatings microstructural features based on support vector machine optimized by cuckoo search algorithm. Coatings 2020, 10, 704. [Google Scholar] [CrossRef]
- Hufnagel, T.C.; Schuh, C.A.; Falk, M.L. Deformation of metallic glasses: Recent developments in theory, simulations, and experiments. Acta Mater. 2016, 109, 375–393. [Google Scholar] [CrossRef]
- Horstemeyer, M.F. Integrated Computational Materials Engineering (ICME) for Metals: Using Multiscale Modeling to Invigorate Engineering Design with Science; John Wiley & Sons, Inc.: Hoboken, NJ, USA, 2012. [Google Scholar]
- Lu, L.; Dao, M.; Kumar, P.; Ramamurty, U.; Karniadakis, G.E.; Suresh, S. Extraction of mechanical properties of materials through deep learning from instrumented indentation. PNAS USA 2020, 117, 7052–7062. [Google Scholar] [CrossRef] [PubMed]
- Koumoulos, E.; Konstantopoulos, G.; Charitidis, C. Applying machine learning to nanoindentation data of (Nano-) enhanced composites. Fibers 2020, 8, 3. [Google Scholar] [CrossRef]
- Lee, H.; Huen, W.Y.; Vimonsatit, V.; Mendis, P. An Investigation of nanomechanical properties of materials using nanoindentation and artificial neural network. Sci. Rep. 2019, 9, 13189. [Google Scholar] [CrossRef]
- Konstantopoulos, G.; Koumoulos, E.P.; Charitidis, C.A. Testing novel portland cement formulations with carbon nanotubes and intrinsic properties revelation: Nanoindentation analysis with machine learning on microstructure identification. Nanomaterials 2020, 10, 645. [Google Scholar] [CrossRef] [PubMed]
- Germanicus, R.C.; Mercier, D.; Agrebi, F.; Fèbvre, M.; Mariolle, D.; Descamps, P.; Leclère, P. Quantitative mapping of high modulus materials at the nanoscale: Comparative study between atomic force microscopy and nanoindentation. J. Microsc. 2020, 280, 51–62. [Google Scholar] [CrossRef] [PubMed]
- Becker, B.; Hintsala, E.; Stadnick, B.; Stauffer, D.; Hangen, U. Evaluating Uncertainty in Clustering of Nanoindentation Mapping Data, TMS Virtual 2021. In Proceedings of the Symposium “AI/Data informatics: Design of Structural Materials—Poster Session”, Pittsburgh, PA, USA, 15–18 March 2021. [Google Scholar]
- Hintsala, E.D.; Hangen, U.; Stauffer, D.D. High-throughput nanoindentation for statistical and spatial property determination. JOM 2018, 70, 494–503. [Google Scholar] [CrossRef]
- Karimzadeh, A.R.; Koloor, S.S.; Ayatollahi, M.R.; Bushroa, A.R.; Yahya, M.Y. Assessment of nano-indentation method in mechanical characterization of heterogeneous nanocomposite materials using experimental and computational approaches. Sci. Rep. 2019, 9, 15763. [Google Scholar] [CrossRef]
- Chen, Y.; Bakshi, S.R.; Agarwal, A. Correlation between nanoindentation and nanoscratch properties of carbon nanotube reinforced aluminum composite. Surf. Coat. Tech. 2010, 204, 2709–2715. [Google Scholar] [CrossRef]
- Bakshi, S.R.; Lahiri, D.; Patel, R.R.; Agarwal, A. Nanoscratch behavior of carbon nanotube reinforced aluminum composite coatings. Thin Solid Films 2010, 58, 1703–1711. [Google Scholar] [CrossRef]
- Pitchuka, S.B.; Lahiri, D.; Sundararajan, G.; Agarwal, A. Scratch induced deformation behavior of cold sprayed aluminum amorphous/nanocrystalline coatings at multiple load scales. J. Therm. Spray Technol. 2014, 23, 502–513. [Google Scholar] [CrossRef]
- Pitchuka, S.B.; Jha, R.; Guzman, M.; Sundararajan, G.; Agarwal, A. Indentation creep behavior of cold sprayed aluminum amorphous/nano-crystalline coatings. Mater. Sci. Eng. A 2016, 658, 415–421. [Google Scholar]
- Lahiri, D.; Singh, V.; Keshri, A.K.; Seal, S.; Agarwal, A. Carbon nanotube toughened hydroxyapatite by spark plasma sintering: Microstructural evolution and multi-scale tribological properties. Carbon 2010, 48, 3103–3120. [Google Scholar] [CrossRef]
- Jha, R.; Dulikravich, G.S. Discovery of new Ti-based alloys aimed at avoiding/minimizing formation of α” and ω-phase using CALPHAD and artificial intelligence. Metals 2021, 11, 15. [Google Scholar] [CrossRef]
- Jha, R.; Chakraborti, N.; Diercks, D.R.; Stebner, A.P.; Ciobanu, C.V. Combined machine learning and CALPHAD approach for discovering processing-structure relationships in soft magnetic alloys. Comput. Mater. Sci. 2018, 150, 202–211. [Google Scholar] [CrossRef]
- MATLAB and Statistics Toolbox Release 2019b; The MathWorks, Inc.: Natick, MA, USA, 2019.
- The HDF Group. Available online: https://www.hdfgroup.org/about-us/ (accessed on 26 September 2020).
- MATLAB and Deep Learning Toolbox™ (Formerly Neural Network Toolbox™) Release 2019b; The MathWorks, Inc.: Natick, MA, USA, 2019.
- TI 950 TriboIndenter User Manual. Available online: https://engineering.unl.edu/downloads/files/UserManual-HystrionTriboIndenter-sm.pdf (accessed on 26 September 2020).


| Data Set | Samples | MSE | R |
|---|---|---|---|
| Training | 16,394 | 4.52912 | 0.999321 |
| Validation | 3513 | 4.58823 | 0.999311 |
| Testing | 3513 | 4.48478 | 0.999306 |
Publisher’s Note: MDPI stays neutral with regard to jurisdictional claims in published maps and institutional affiliations. |
© 2021 by the authors. Licensee MDPI, Basel, Switzerland. This article is an open access article distributed under the terms and conditions of the Creative Commons Attribution (CC BY) license (http://creativecommons.org/licenses/by/4.0/).
Share and Cite
Jha, R.; Agarwal, A. Software (GUI/APP) for Developing AI-Based Models Capable of Predicting Load-Displacement Curve and AFM Image during Nanoindentation. Coatings 2021, 11, 299. https://doi.org/10.3390/coatings11030299
Jha R, Agarwal A. Software (GUI/APP) for Developing AI-Based Models Capable of Predicting Load-Displacement Curve and AFM Image during Nanoindentation. Coatings. 2021; 11(3):299. https://doi.org/10.3390/coatings11030299
Chicago/Turabian StyleJha, Rajesh, and Arvind Agarwal. 2021. "Software (GUI/APP) for Developing AI-Based Models Capable of Predicting Load-Displacement Curve and AFM Image during Nanoindentation" Coatings 11, no. 3: 299. https://doi.org/10.3390/coatings11030299
APA StyleJha, R., & Agarwal, A. (2021). Software (GUI/APP) for Developing AI-Based Models Capable of Predicting Load-Displacement Curve and AFM Image during Nanoindentation. Coatings, 11(3), 299. https://doi.org/10.3390/coatings11030299