Article

Surface Characteristic Function of Al Alloy after Shot Peening

School of Mechanical and Electronic Engineering, Central South University of Forestry and Technology, Changsha 410083, China
*
Author to whom correspondence should be addressed.
Coatings 2021, 11(2), 160; https://doi.org/10.3390/coatings11020160
Submission received: 22 December 2020 / Revised: 15 January 2021 / Accepted: 27 January 2021 / Published: 29 January 2021
(This article belongs to the Section Surface Characterization, Deposition and Modification)

Abstract

:
The work aims to study the change rule of the surface properties of aluminum (Al) alloy after shot peening (SP), and obtain the corresponding relationship between the surface material characteristics and SP parameters. Firstly, the Finite Element Model (FEM) of multi-projectile impact Al alloy specimen was established by ANSYS/LS-DYNA (Version: Ansys15.0). Box-Benhnken design method (BBD) was used to design 3-level and 3-factor shot peening experiment with shot peening pressure. Projectile size, jet distance, the surface residual stress, as well as deformation were taken as responses. The surface stress and the deformation at the crater were obtained according to the experiments. Then, Design-Expert software was adopted to fit the values to attain the multiple regression quadratic equations, and the response surface methodology (RSM) was applied to analyse the interaction between the various factors. The degree of model-fitting was simultaneously identified in accordance with an analysis of variance of the function models. Finally, the shot peening test was carried out using 7075-T651 Al alloy as the specimen. Combined with the X-ray diffraction (XRD) stress test and the optical microscopic observation of the crater section, the value of stress and deformation value could be determined to verify the accuracy of the model. The adjusted R2 of the stress function model and the deformation function model were 94.85% and 95.08%, respectively. The deviation between calculated stress value and the experimental value was less than 5.5%. The deformation of the section showed that the deformed layer of the specimen was approximately the same as calculation value. The result indicated the function model had high accuracy. The analysis suggested that the function model could quickly and precisely deduce the parameter combination of the SP from the surface stress or deformation of the material, which provided a diversity reference for the surface stress and hardness strengthening of SP.

1. Introduction

7075-T651 Al alloy is extensively used in the components (cabin frame, plane’s wings, the skin of wings, and bearing beam) of automotive and aerospace components, which gives rise on superior performances such as the low density, high specific strength, strong corrosion-resistance, good fracture toughness [1,2,3]. However, the component has different degrees of deformation due to the stress distribution and materials surface hardness change after shot peening (SP), which may lead to surface stress reorganization [4] and affect the performance [5,6]. How to accurately control the surface characteristics of materials such as stress and hardness by shot peening has become a research hotspot [7,8,9,10].
The SP introduces a certain depth of residual compressive stress on the surface of the material to adjust the stress distribution to achieve the deformation control, improvement of the fatigue performance and the corrosion resistance of the component. SP strengthening is a complex process including projectile size, pressure, distance, etc., which will affect the results of surface characteristics. In fact, given an arbitrary SP process parameters, it is not easy to know the accurate surface stress and hardness of materials, vice versa. However, in the past, many discrete parameters and corresponding results can be obtained by using FEM and experiment, but this method has uncertainty [11,12]. Pham et al. [13] used FEM to research the residual stress distribution of AISI 4340 steel after SP with coverage, projectile velocity and projectile size. Xiao et al. [14] proposed a method for deriving the shot peening stress from the bending curvature of the part to guide the shot peening process based on ABAQUS finite element simulation software and experiments. Zhang et al. [15] studied the effect of SP coverage on the shape stability of the 7075 thin-walled Al alloy frame components. The results showed that the multiple coverages could significantly improve the microhardness of the material surface, and resist plastic deformation, as well as ensure the shape stability of the component. Hassani-Gangaraj [16] studied the residual stress distribution of high-strength low-alloy steel after shot peening from the perspective of microstructure through experimental and simulation. Maleki et al. [17,18] analysed the effect of coverage on residual stress distribution and surface roughness from a micro perspective. These studies show that, on the one hand, finite element analysis can help to summarize the influence of SP parameter diversification on the results; on the other hand, experiments usually describe the impact of a single factor on the surface characteristics, but the comprehensive influence of multiple factors is not considered enough.
Recently, more attention has been paid to the effect of shot peening on the mechanical properties of materials, and this effect is mainly determined by the surface characteristics. After high-energy SP, the ultimate tensile strength and yield strength increased by 27% and 40%, respectively. By contrast, the elongation rate was reduced by 64% [19]. This conclusion shows that the surface compressive stress increases the strength of the material after SP strengthening, while the hardening weakens the elongation of the material, which is the necessity of establishing the correlation between SP and surface characteristics. Based on experiment and simulation, the Box-Behnken Method (BBD) and FEM can help find a comprehensive method to carry out the function between SP processing parameters and surface characteristics, which means that the determined process parameters can be selected for the specific stress or hardness [20]. This correlation can improve the efficiency of SP strengthening.
In this study, the construction of the function model is a novel method that helps the precise control of surface characteristics under SP strengthening [21,22,23]. This method gets the experimental scheme and data collection by BBD and FEM, and then sort out the experimental results and obtain the multiple quadratic regression function by Design-Expert software. Finally, the rationality of the constant term of the function is tested by the analysis of variance and Response Surface Methodology (RSM).

2. Numerical Analysis Model

2.1. FEM

Based on the uniformity and symmetry of the SP impact on the material surface, it is necessary to simplify the actual SP processing. More specifically, the research focuses on the effect of multiple projectiles on the surface mechanical behavior within small area. The established multi-projectile finite element model target was segmented, and the mesh of the impact region was refined. The mesh size was 0.02 mm, which was less than one-tenth of the diameter of the projectile. Hence it was easy to analyse the trend of stress against the depth [18]. The mesh size of the non-impact area was 0.1 mm, and the grid was divided by the mapped mesh. The shot peening speed (v) was estimated using a semi-empirical formula derived from Dr. Kiemenz, et al. [24] due to the inconvenience of shot peening.
v = 16.35 × p 1.53 × m + p + 29.50 × p 0.598 × d + p + 4.83 × p
where p, m, and d represent the injection pressure (bar), the shot flow rate (kg/min), and the shot size (mm), respectively. Weigh 2 kg of the projectile (d = 0.5mm) with an electronic scale was used to measure the shot peening flow. Put the projectile into the abrasive blasting machine and open the switch, and adjusted the injection pressure to 0.3 MPa until the pressure was stable. After that, peening was started, and the timing was synchronized. The ejected projectiles were collected in a collection box to avoid entering the injection cycle again to minimize the error. Five repetitive experiments were carried out: the injection of 2 kg of projectiles was 197–266 s, and the flow rate of the projectiles was 0.90–0.92 m/s.
Using solid164 units was suitable for solid models, and the initial velocity load of 55 mm/s in the negative direction of the Z-axis was applied to the projectile. The injection angle was 90°, and the projectile was 100 mm away from the target. Finally, the stress after impact was calculated by the computer based on the strain of the grid. Since the projectile was not the main object of discussion, the projectile was divided by free mesh. The contact analysis was complex during the collision process. Therefore, explicit automatic algorithms and face-to-face contact types were taken into consideration to adapt to the real contact situation. Figure 1 shows the multi- projectile impact finite element model.

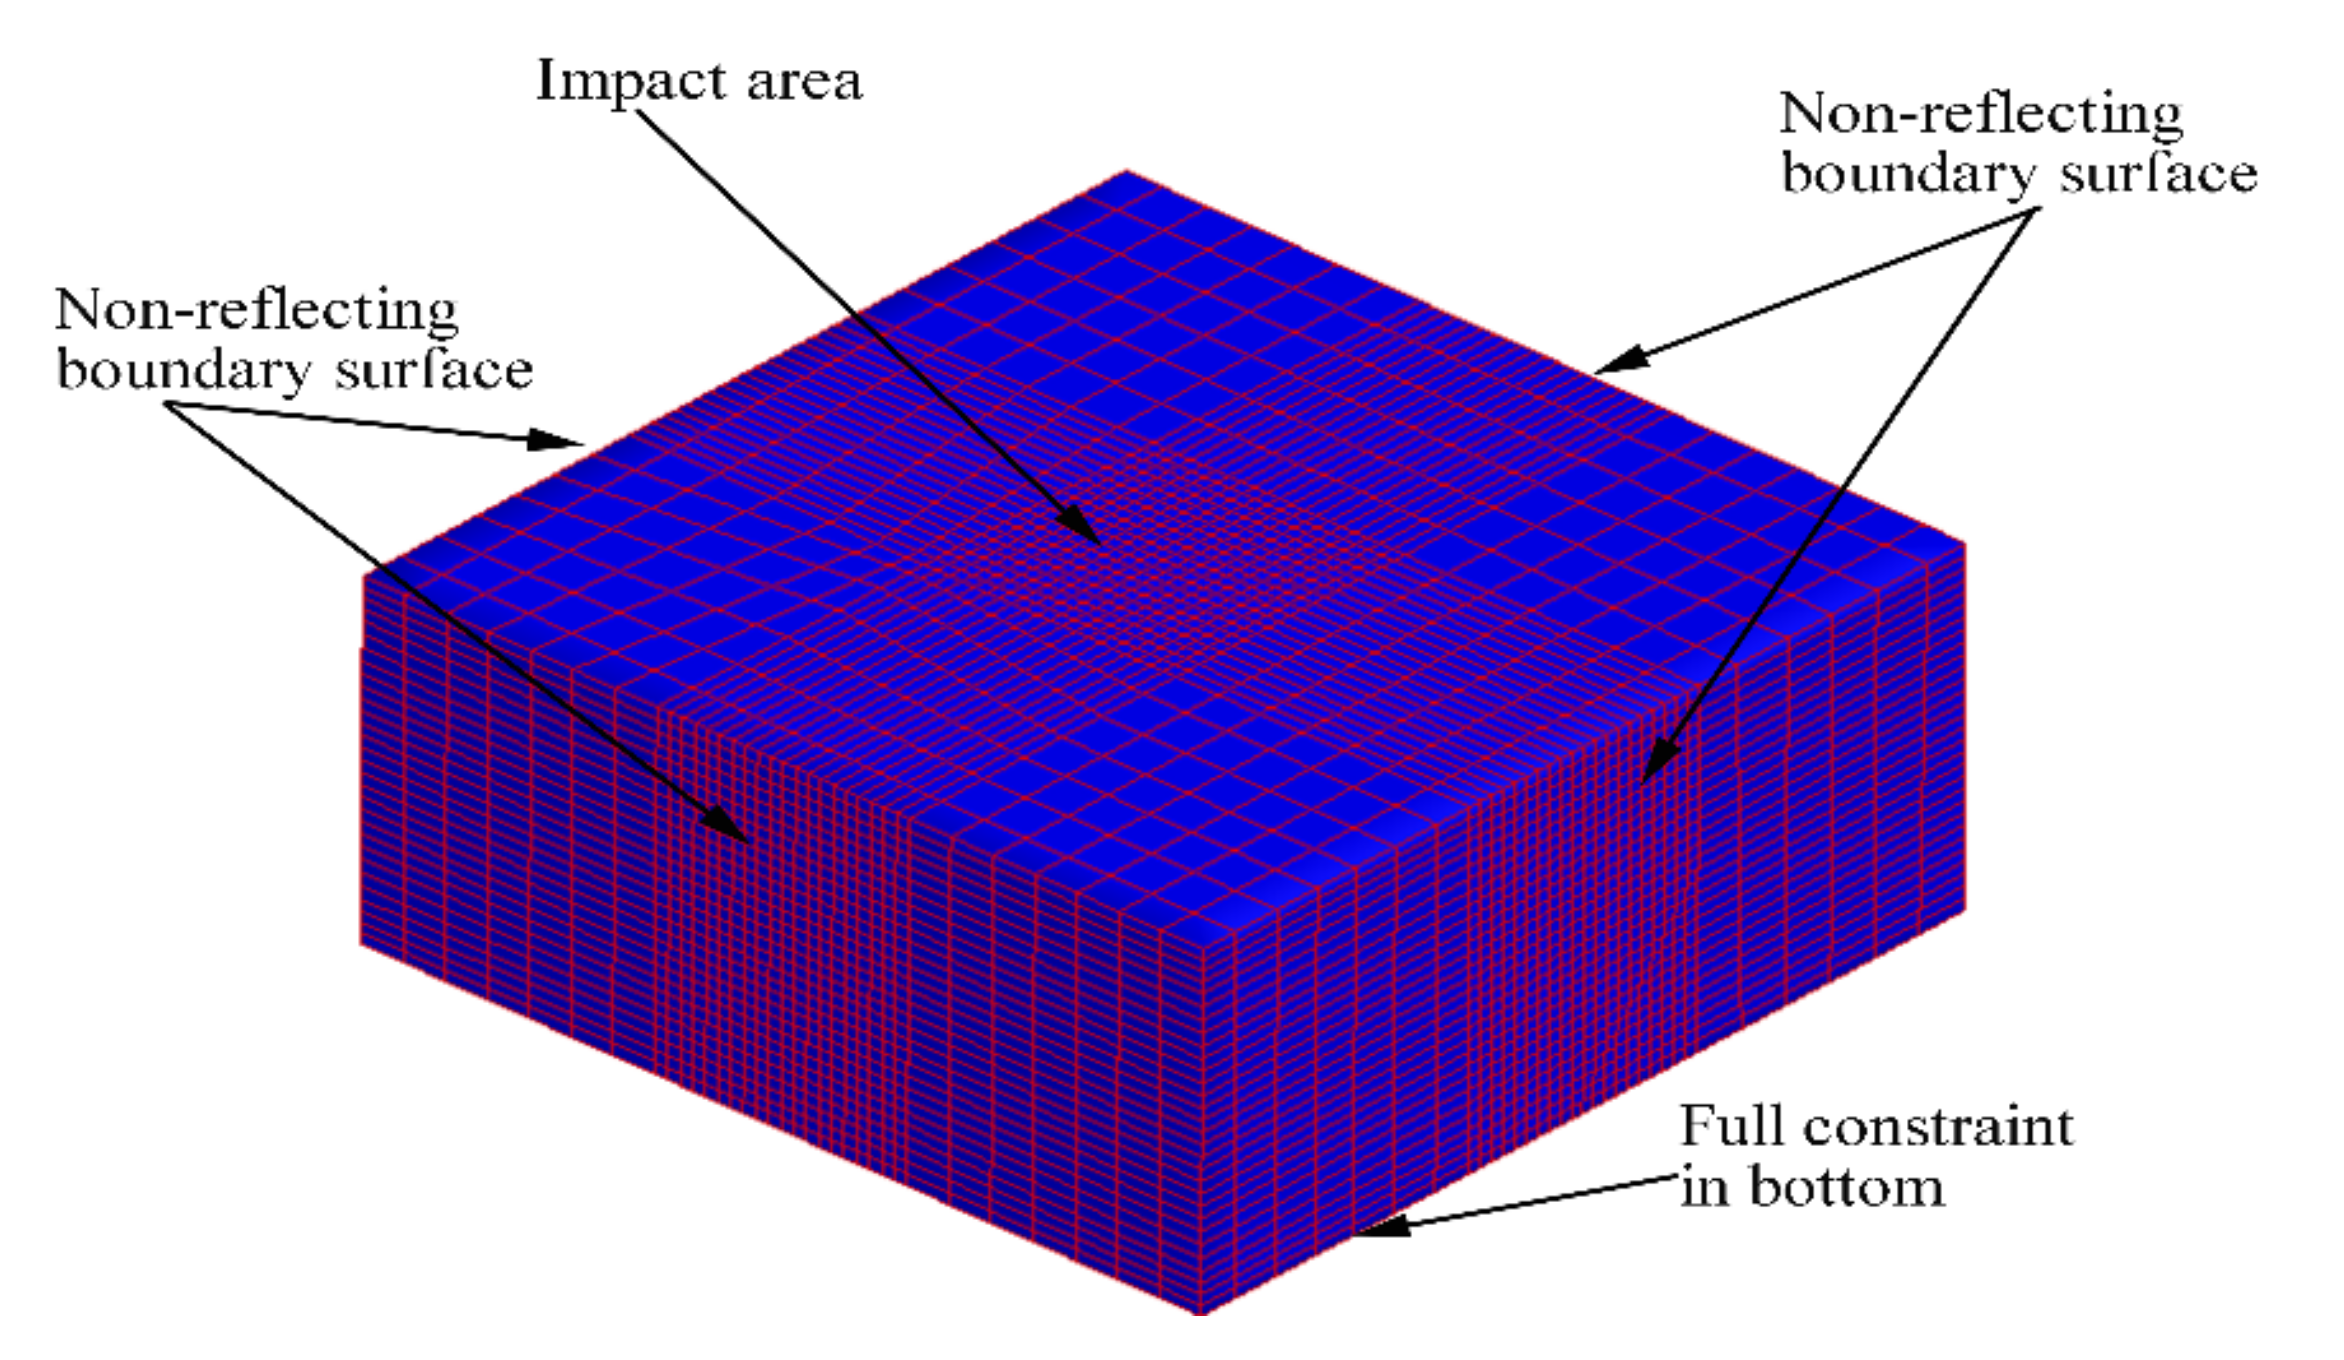
2.2. Boundary Conditions

The Al alloy material had elastoplasticity, and the deformation of the Al alloy target was micron-scale after the shot peening impact according to the experimental measurement. Hence the bilinear kinematic model in the ANSYS/LS-DYNA (Version: Ansys15.0) material library was selected. This model was suitable for small strain problems of isotropic materials, and this was the reason why uses bilinear to represent stress-strain curves. There were two slopes, elastic slope and plastic slope, which could significantly reflect the properties of Al alloy materials [11]. Table 1 shows the mechanical properties of Al alloy materials.
The strength of the projectile was higher than that of the target, and therefore the diameter of the selected steel projectile was 0.3 mm. The projectile was a rigid body and rigid constitutive relation model in the ANSYS/LS-DYNA material library was selected. The displacement and full rotation of the XY plane of the projectile model were limited to prevent the projectile from shifting out of the target range during the movement. A non-reflective boundary condition was applied on the side of the model for the simulation of an infinitely large solid model. The stress wave would not be reflected and re-entered into the model at the boundary, which affected the accuracy of the experimental results. The target was subjected to a good impact of the projectile and a maximum constraint was applied to the bottom of the target to guarantee as veritable as possible to the actual shot peening [13]. Figure 2 shows the setting conditions of the model boundary conditions.

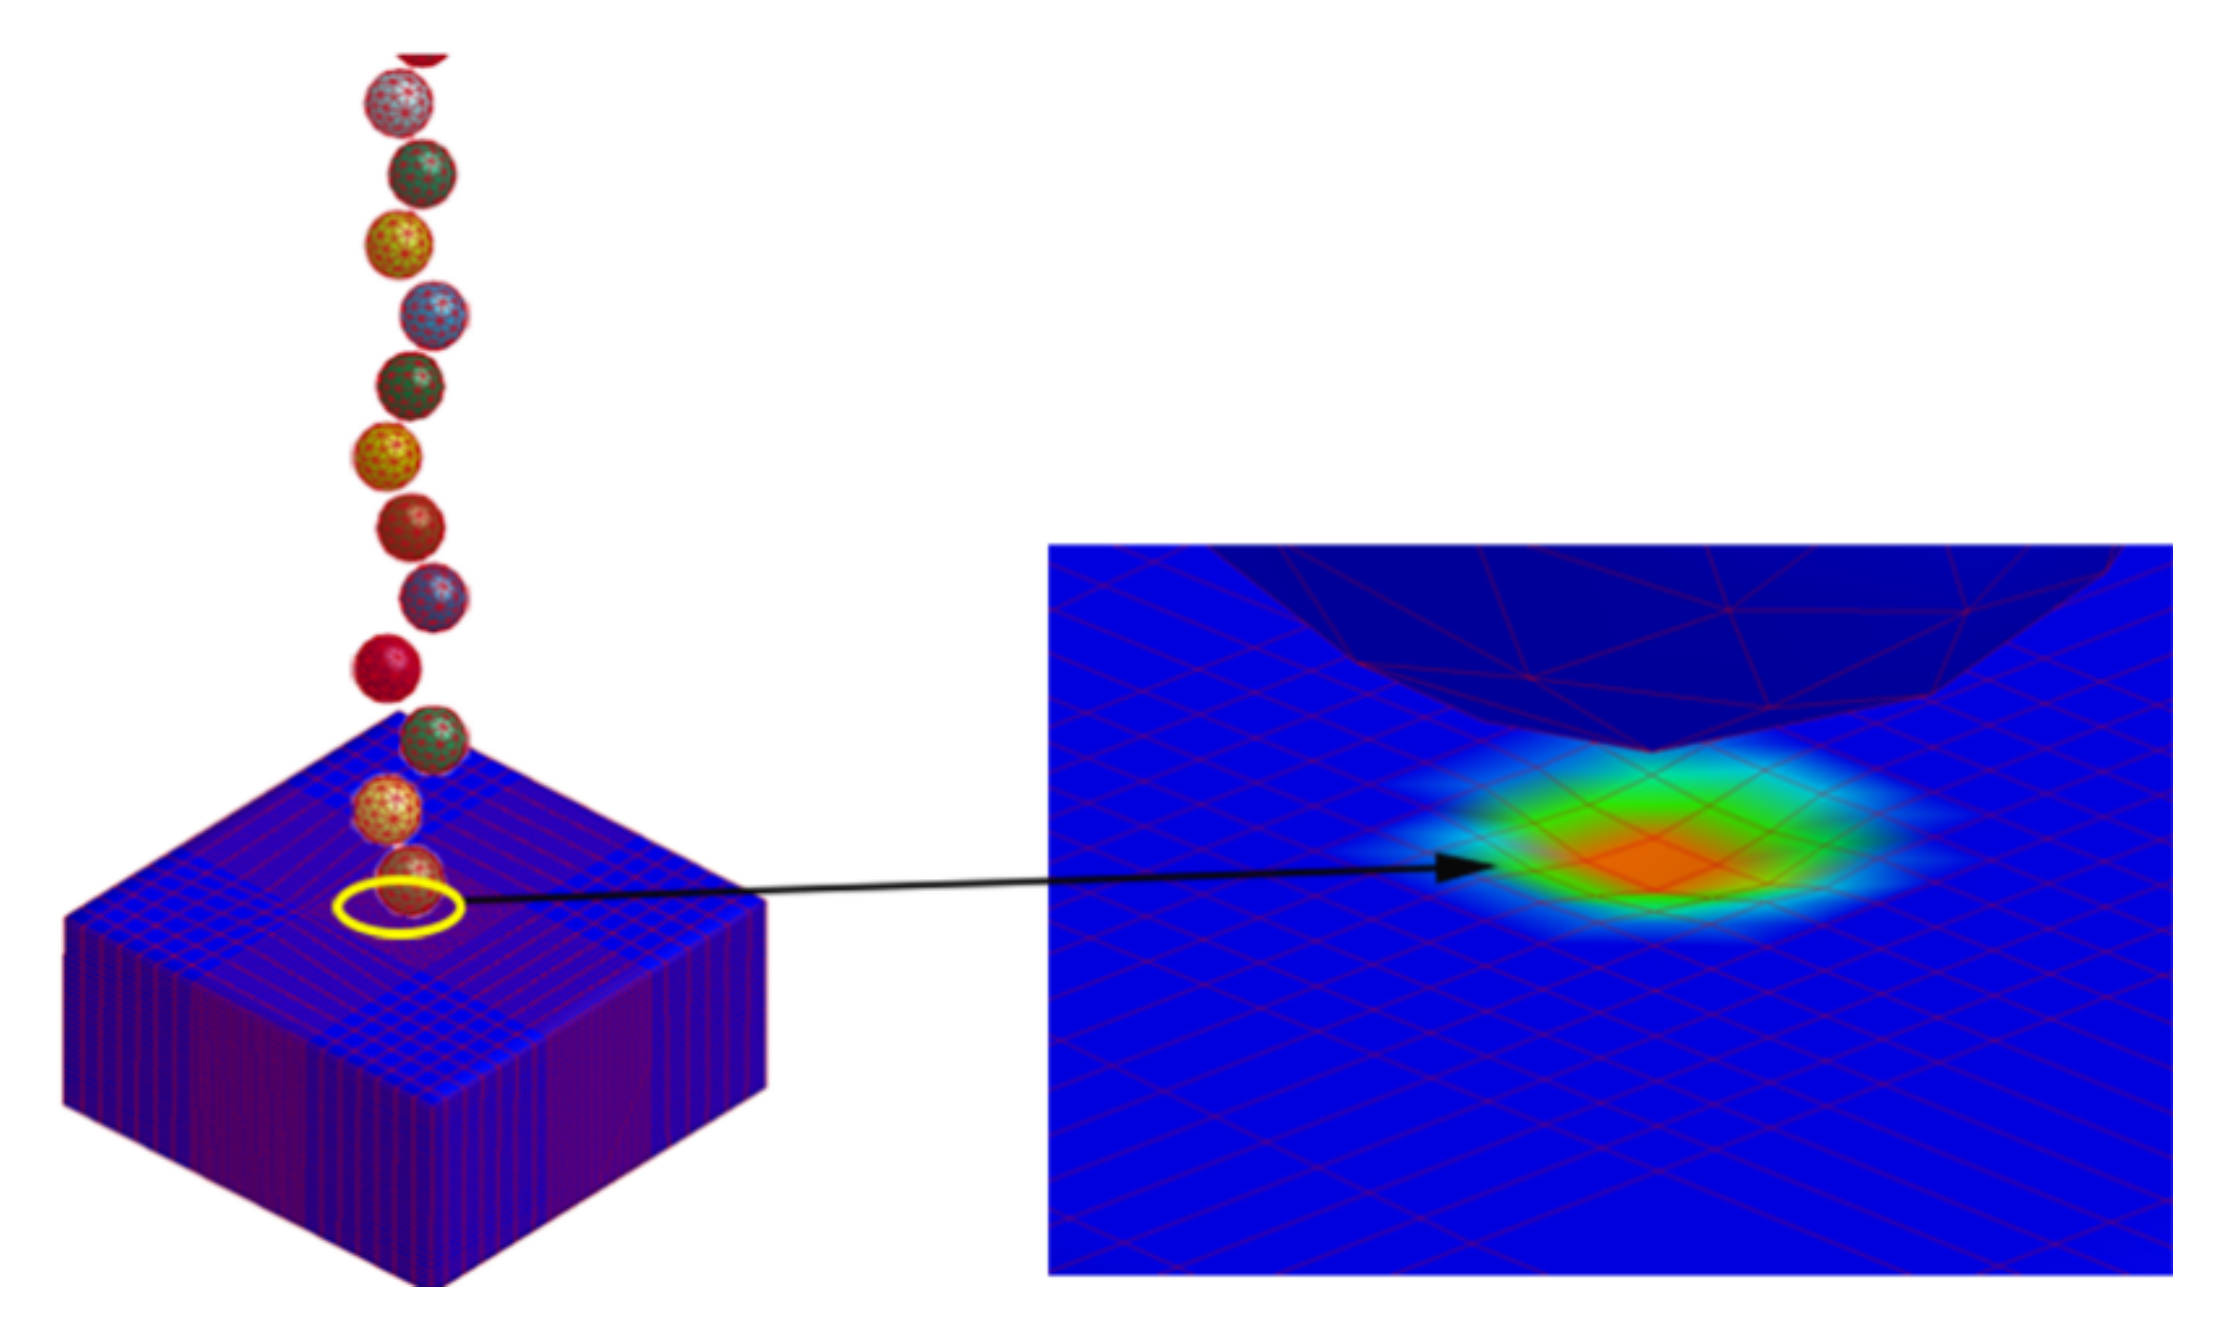
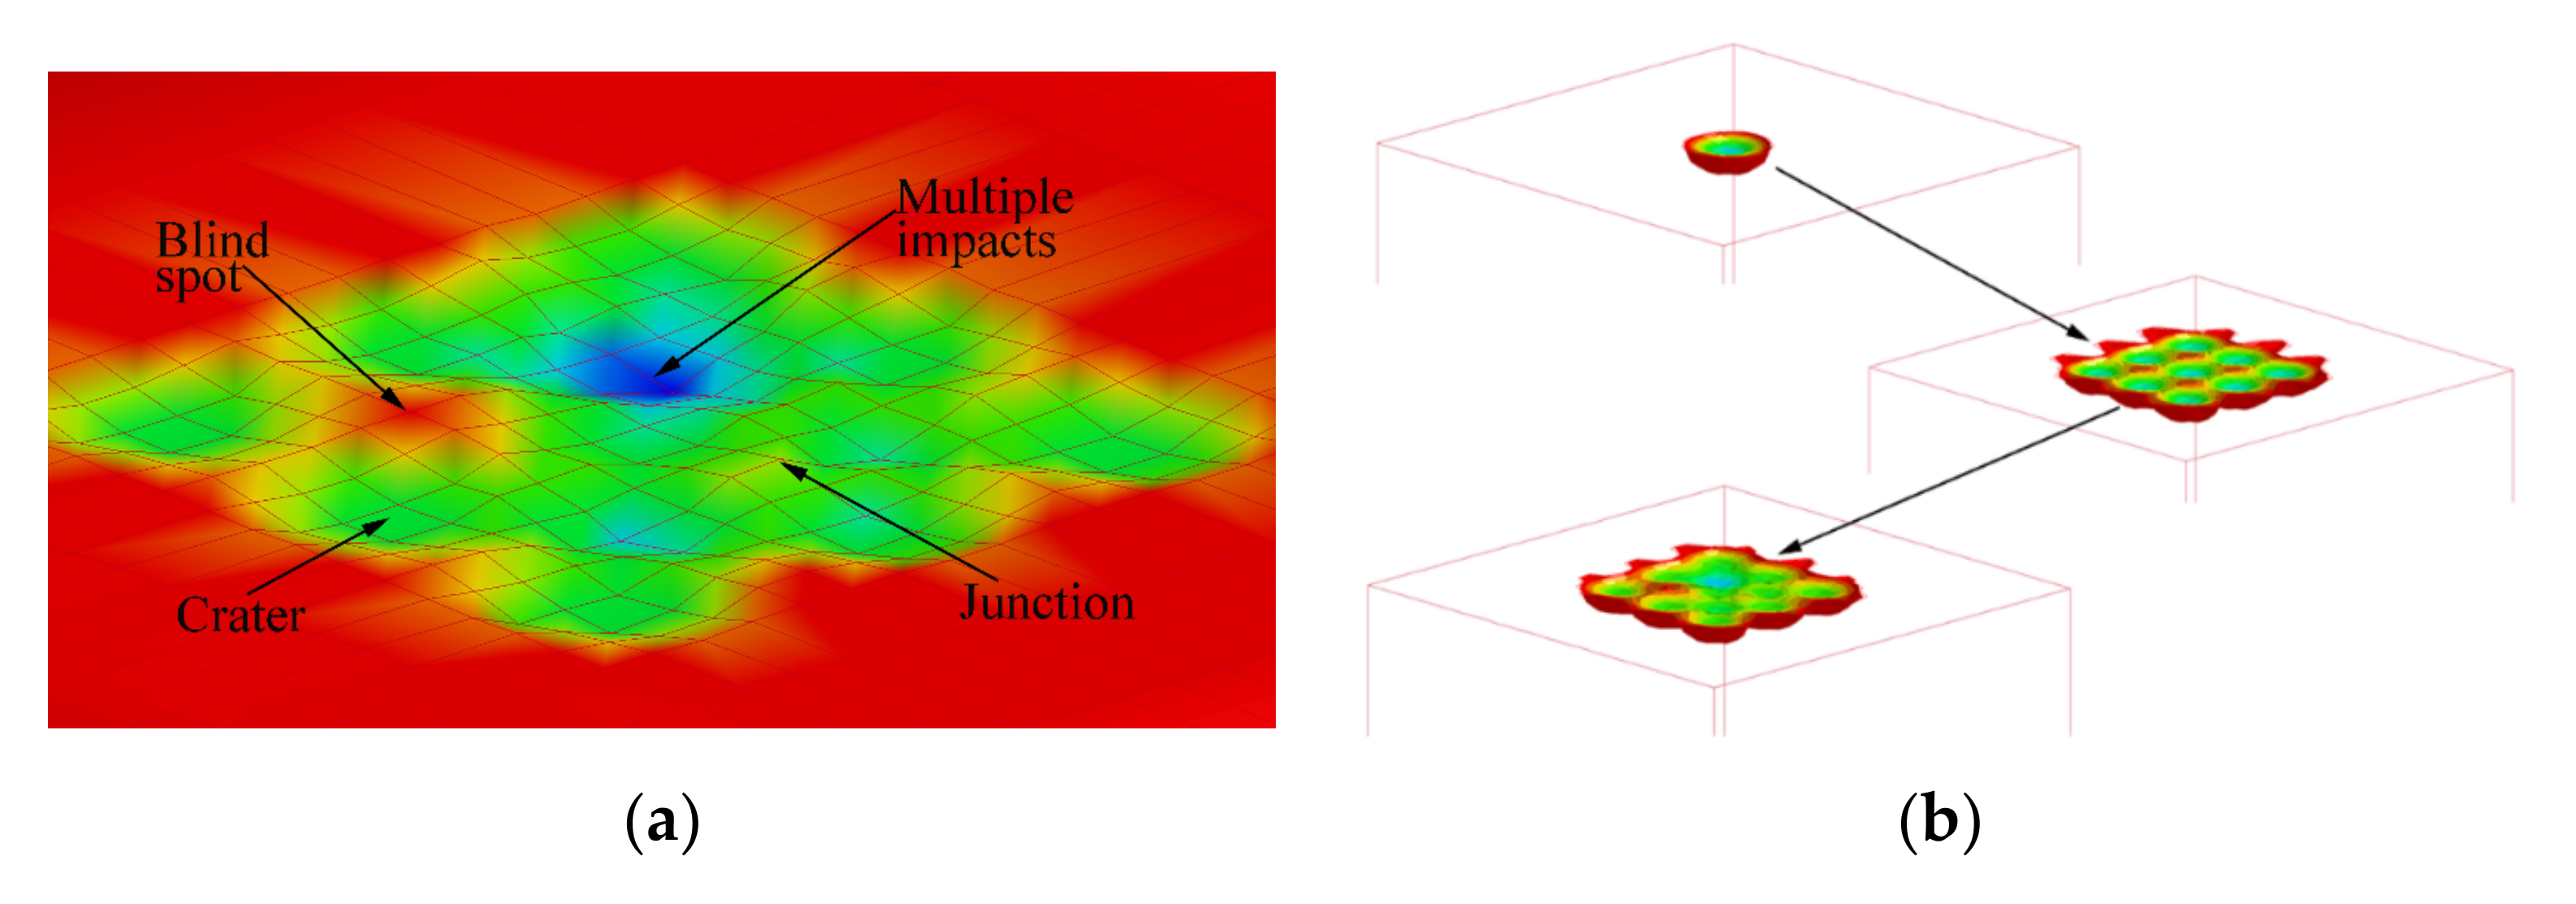
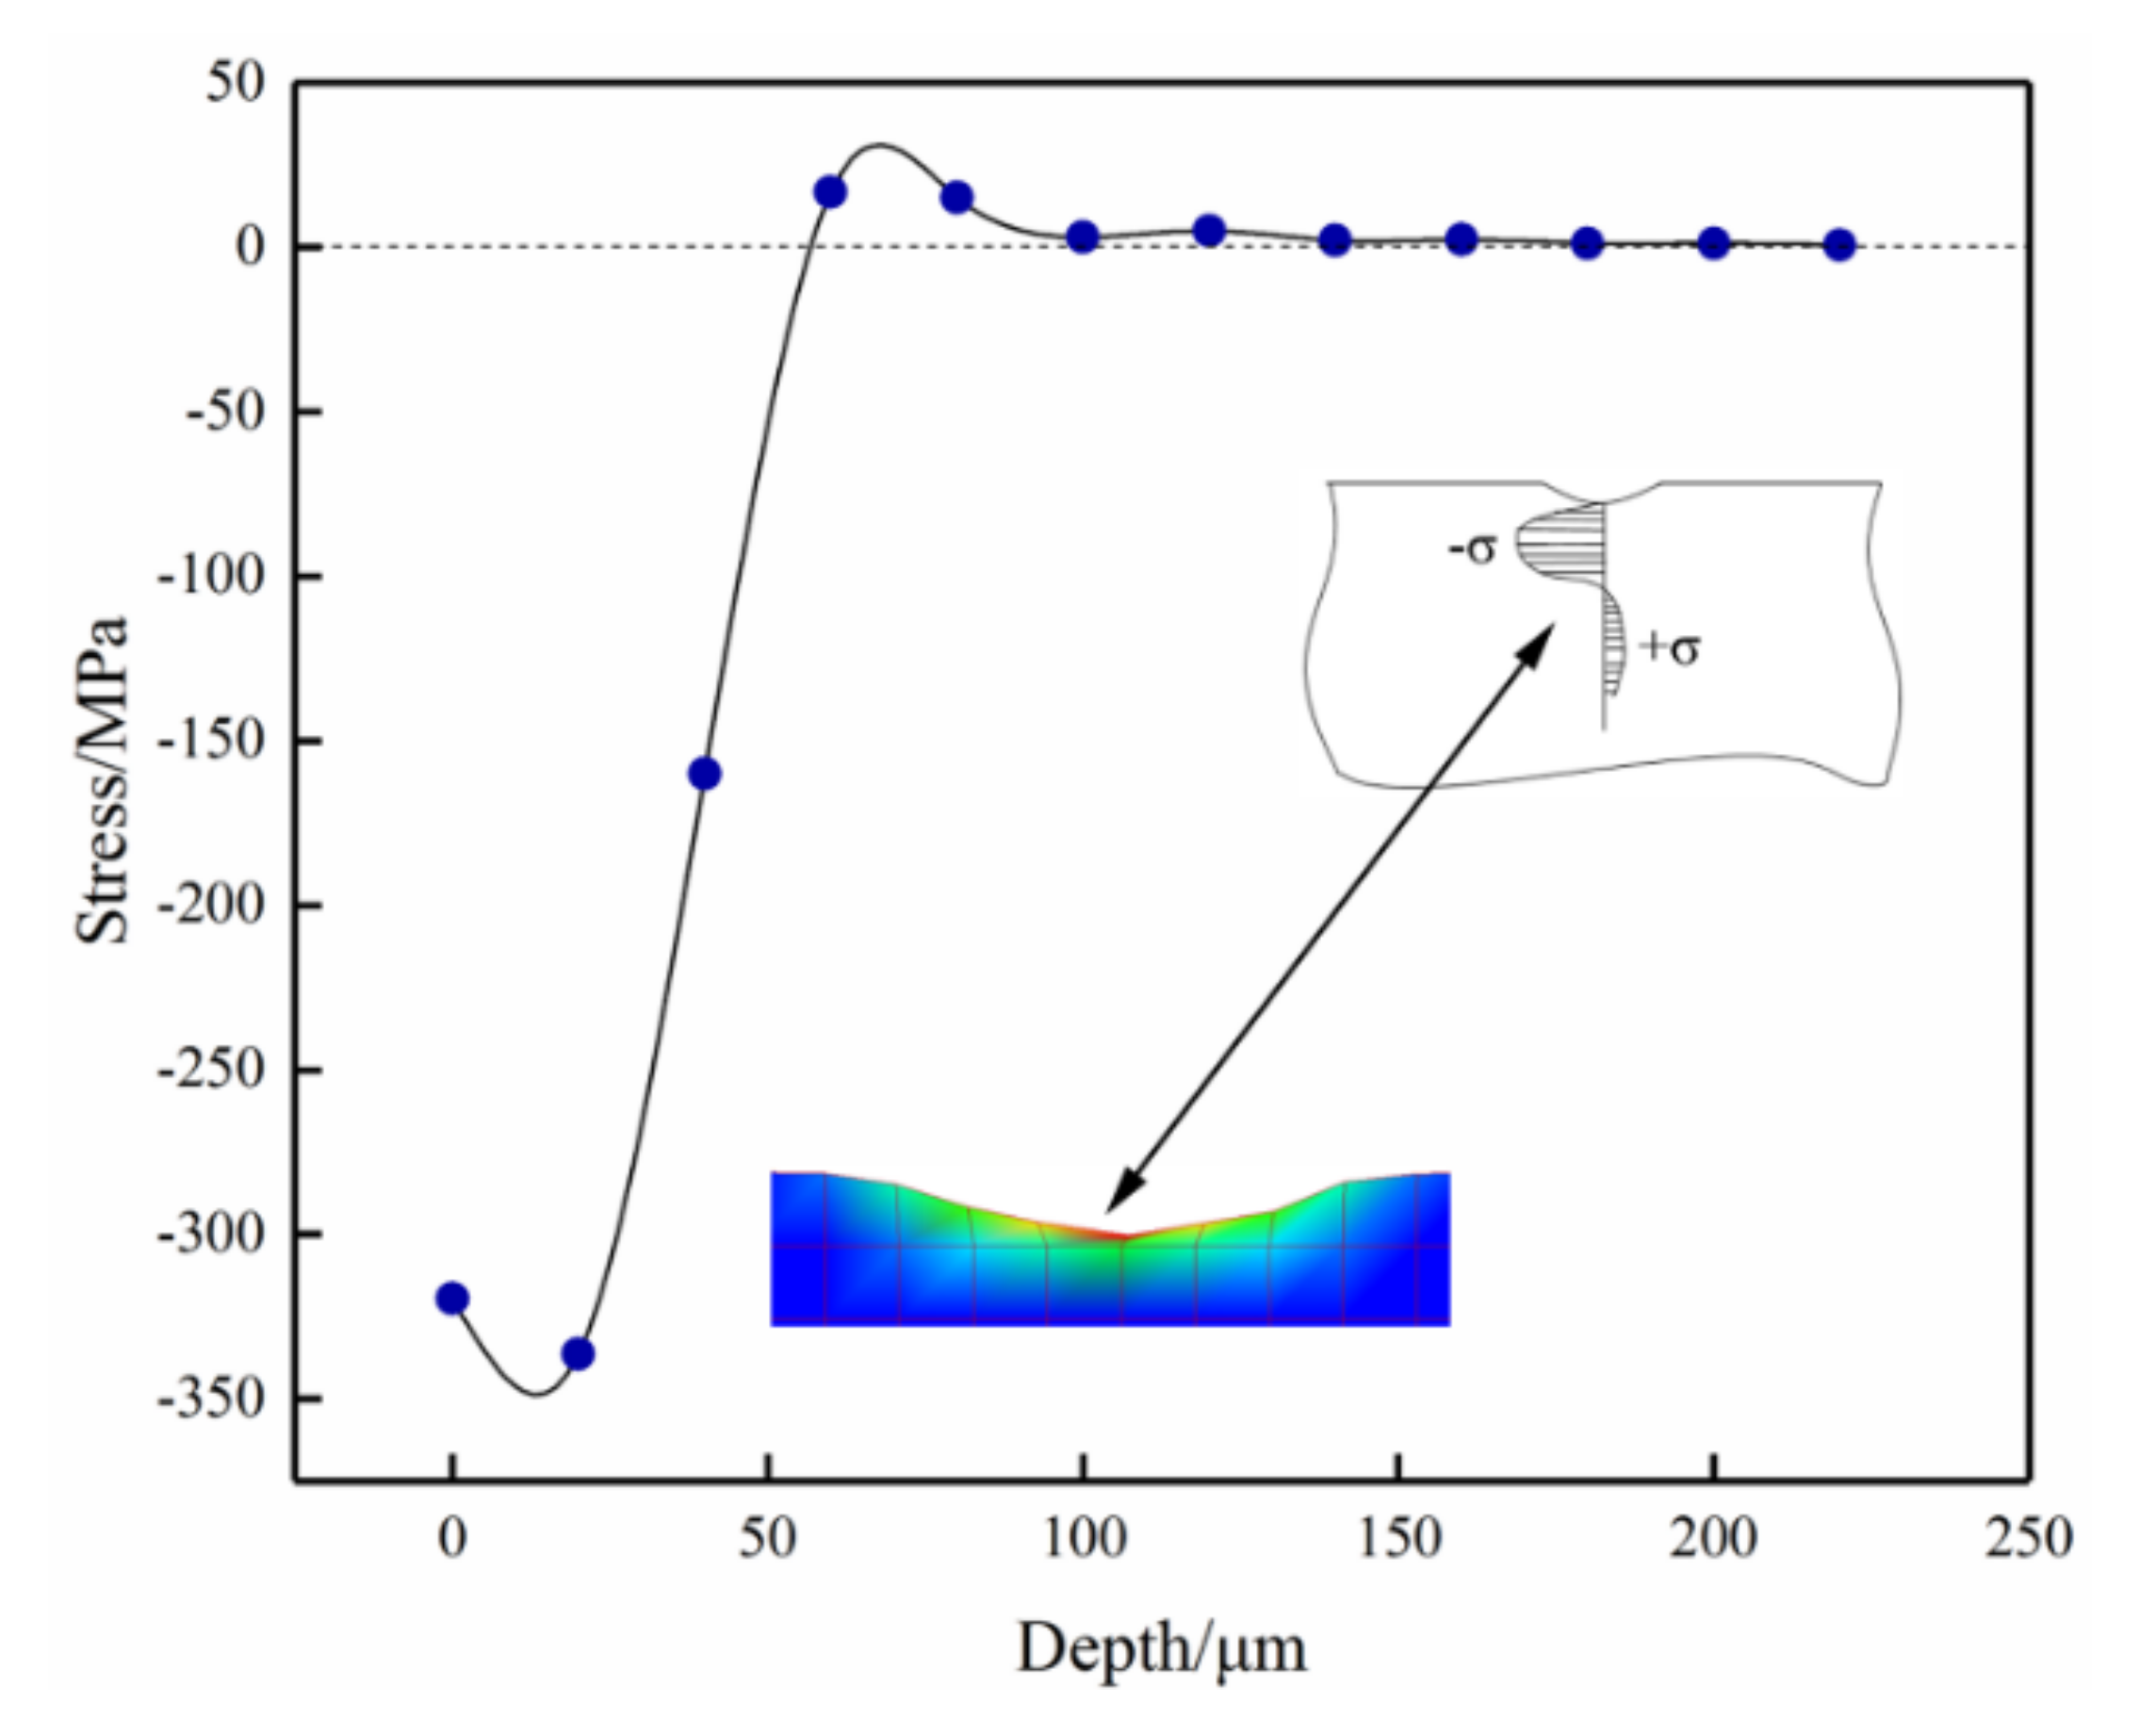
2.3. Simulation Result

The simulation results were solved by ANSYS solver, and the solution time was set to 0.01 s. The output control set the output step size to 100. The post-processing file output format was set to LS-DYNA, and the d3plot file was run in LS-PREPOST (Version: 4.0-X64) to show the calculation result. Figure 3b shows the crater left by the single pellet including 9 pellets and 13 pellets impact. It could be known from Figure 3a that after the impact, the surface of the target had different depths of craters. The craters were nearly circular, and the craters’ junction was raised. The deformation of the multiple impact area was significantly larger than the single impact area. In the shot peening area, there were uneven conditions, and the blind spots, craters as well as multiple impact points coexisted, which demonstrated that the random arrangement of the projectile space position was close to the actual shot peening situation. The phenomenon illustrated two points: First, the impact centre was completely different from the edge stress state, and stress concentration was likely to occur around the impact area; Second, the impact causes plastic deformation at the crater, resulting in an uneven surface. According to the analysis, the actual shot peening was a multi-projectile impact. The single multi-projectile impact was only an ideal condition. To reduce the stress concentration on the surface of the material and to smooth and deform the surface, it needed to be improved under multiple shot peening. Therefore, shot peening required 100% full surface coverage. Related research was also reflected in the work of Qiang et al. [25].
Figure 4 illustrates that the compressive stress distribution is shallow and large, and the maximum stress appears below the surface layer. The stress changed drastically in the depth range of 0–100 μm, and then tended to be stable. The stress influence depth was about 200 μm, and this range approximately reflected the depth of the strengthening area [18].

2.4. Box-Benhnken Experimental Design

Box-Benhnken Design (BBD) was one of the most commonly used second-order response surface designs. This method had the following advantages: (1) It could estimate the interaction among the factors; (2) Fewer experiments were required to achieve the desired results compared to orthogonal experiments; (3) Provided the best combination of factors and the conclusions were universal. Each factor of the BBD method used three levels, and the method did not arrange all the factors simultaneously as a high-level combination, avoiding the occurrence of maxima and minima in the result as well as improving the reliability.
Different shot peening parameters have different influences on the surface quality of the material. Generally, the five factors of pellet size, injection pressure, jet distance, spray angle and coverage are studied. Previous studies have shown that when the coverage rate exceeds 100%, the coverage rate is increased, and the shot peening process is less efficient [17]. The spray angle is mainly to avoid the interference of the pellet during the shot peening. Therefore the size of the pellet is selected in this study (X1), while injection pressure (X2) and injection distance (X3) are three factors. The residual stress value (YRS) and the crater deformation (YH) after shot peening are the response values. The Design-Expert software is used to select the Box-Benhnken experimental design method for three-factor and three-level experiments, coded at −1, 0, 1. The specific experimental scheme is shown in Table 2.
Considering the linear effects of the influence of each parameter on the response value, the impact of the secondary effect and the interaction between the parameters, the original function model is selected as follows:
Y = b 0 + b 1 X 1 + b 2 X 2 + b 3 X 3 + b 4 X 1 X 2 + b 5 X 1 X 3 + b 6 X 2 X 3 + b 7 X 1 2 + b 8 X 2 2 + b 9 X 3 2
where Y represents the response value, and b0b9 represents the constant coefficient. The least squares linear regression method was used to fit the experimental data, and the constant coefficients were obtained. Finally, the rationality of the constant b0b9 was determined by combining the analysis of variance and RSM.

3. Result and Analysis

3.1. Experimental Design

According to the three-level and three-factor design of Design-Expert software (Version: V8.0.6.1), 17 sets of simulation models were established in turn using ANSYS/LS-DYNA, and the stress and deformation results were observed by post-processing software LS-PREPOST. The specific experiments and results are shown in Table 3.

3.2. Function Model and Analysis

When there are interactions between factors, it is necessary to explore the impact of these factors at different levels. In this study, three-dimensional maps and contour maps of stress and deformation were given, and response surface analysis (RSM) was performed to demonstrate whether the effects between parameters had significant interaction effects. Figure 5 reflects the influence of factors on the surface stress, in which the slope of the surface in Figure 5a is steep and the contours in Figure 5b are gradually denser. The contour distribution shows that the size of the projectile and the jetting distance have a great influence on the stress, the stress changes sharply with the jet distance and the pellet size at a certain scale. For example, 0.4 mm projectile whose stress fluctuates by more than 100 MPa over a 50–150 mm jet distance, indicates that stress is sensitive to the interaction of projectile size and jet distance, and the interaction between projectile size and jet distance is significant.
Through the above graphical analysis combined with the study of variance, it could comprehensively expound the linearity of parameters and their interactions, the secondary effect and the degree of significance of the model. The variance results of the stress model are shown in Table 4, including the coefficients of each corresponding term, the standard deviation (Standard Error, SE), the F value and the p value. The magnitude of the standard deviation of the coefficients indicates the accuracy of the coefficients, and the F value indicates the mean square between the groups. If the F value is much larger than 1, the difference between the means is statistically significant; The p value indicates the significance of the coefficient, and the smaller the p value is, the more remarkable the coefficient could be. P value of less than 0.01 illustrates that the term is extremely notable, and a p value of less than 0.05 indicates that the term is significant. Otherwise, the term is not significant. For example, the p value of X1 in Table 4 is 0.0247, meaning that the term is extremely significant, and the p value of X12 is 0.7395. Explain that the item is not significant. The model determines the coefficient R2 = 0.9485. The closer R2 is to 1, the better the model predictive response is, and the smaller the calculated value and the actual value are, as well as the better the model fits. Non-significant items in the model will affect the size of R2. The model is usually adjusted to improve its accuracy. In the adjusted stress model, the correction coefficient is Adjusted R2 = 0.8823, indicating that the model can explain 88.23% of the change in the response value.
The stress function model is as follows:
Y R S = 275.60 + 13.00 X 1 4.88 X 2 31.13 X 3 12.50 X 1 X 2 + 37.50 X 1 X 3 + 31.75 X 2 X 3 + 2.18 X 1 2 + 2.43 X 2 2 21.08 X 3 2
where X1, X2 and X3 are the horizontally encoded values against which the corresponding parameters are compared.
As shown in Table 5, the coefficient of determination R2 = 0.9508. After adjusting the deformation regression model, the correction coefficient Adjusted R2 = 0.8876, indicating that the model can explain the change of the 88.76% response value.
The deformation function model is as follows:
Y = 114.60 3.25 X 1 5.50 2 X 2 0.75 3 X 3 8.00 X 1 X 2 + 14.00 X 1 X 3 + 4.50 X 2 X 3 8.95 X 1 2 1.45 X 2 2 6.45 X 3 2
where X1, X2 and X3 are the horizontally encoded values against which the corresponding parameters are compared.
To visually reflect the degree of agreement between the experimental and calculated values, a scatter plot is introduced to analyze the closeness of the actual value and the calculated value. As shown in Figure 6, the abscissa represents the actual stress value, and the ordinate represents the function to calculate the stress value; In Figure 7, the abscissa represents the real deformation, and the ordinate represents the function which calculates the deformation, and the scatter of the two graphs is linear, indicating that the model has better processing effect on the data, which means that the fitting function can explain the tendency of all data to change.

4. Verification

To verify the accuracy of the model, the surface stress target value was set to −270 Mpa. Through the stress function model, several sets of process parameters could be solved. Three parameter combinations can be selected, and the deformation function model can be used to calculate the deformation of the crater corresponding to the three combinations, respectively. Then, the 7075-T651 Al alloy is used as the target material with the size of 90 mm × 32 mm × 9 mm. The projectile was a steel shot, and the shot peening verification test was performed. The experimental equipment was ST-1960 sandblasting machine with a nozzle diameter of 5 mm. The machine adopts suction blasting of which the compressed gas formed by the air compressor flows at high speed in the spray gun to form a negative pressure to generate suction and spray. The projectile in the reservoir was drawn into the spray gun and sprayed onto the target at high speed. The target was subjected to shot peening treatment, and a red powder was applied to the sprayed surface of the target. It was regarded as 100% complete coverage when the powder is substantially disappeared. As shown in Figure 8, the surface of the Al alloy after covering was changed from silvery white to gray.
As shown in Figure 9, the stress value of the target was measured by XRD method, and the surface stress of the material after shot peening was tested using a Proto iXRD (Proto Manufacturing Ltd., Windsor, Canada) combining with stress meter. The XRD target is Co K-Alpha, and the instrument power was 20 kV/4 mA. The optical microscope obtained a picture of the target profile and measures the thickness of the deformed layer of the target. Finally, the experimental value was compared with the predicted value. As shown in Table 6, ES, CD, EP represent the experimental stress, calculated value of the deformation, the error percentage between the calculated value of the stress and experimental value of stress. The maximum error of the two is less than 5.5%, verifying the accuracy of the function model again.
The thickness of the deformed layer is obtained by Figure 10. Compared with the calculated deformation, it is found that the experimental value and the calculated value are basically consistent, indicating that the deformation function model has good accuracy.

5. Discussion

The experimental results demonstrated the accuracy of the function model. Compared with the work of Qiang et al. [25], this study discussed the influence of various process parameters on the surface features, and had a greater reference and guiding significance for practical engineering applications. Compared with the work of Hassani-Gangaraj et al. [16], this paper not only discussed the material surface residual stress after shot peening but also summarized the relationship between pressure, jet distance, projectile diameter, residual stress and the deformation in the form of function. This study adopted the BBD method to design experiments and effectively reduced the experimental batches and increased efficiency. Moreover, the nonlinear effects of process parameters were evaluated by BBD experimental results, and the interaction between process parameters was analyzed. The stress and deformation function models could provide different combinations of process parameters for various shot peening deformations. The stress value - deformation amount was cross-combined, and the diversity was greatly improved, leading to the more extensive applicability. Related research was also reflected in the work of Pham et al. [13].

6. Conclusions

In this study, two prediction function models were constructed and verified by XRD experiments and profile pictures. The function model provided cross-selection of the stress and the deformation. After determining the expected stress value, the appropriate deformation can be selected according to the comparison of different process parameter combinations (the deformation amount indirectly reflects the hardness value, and the deformation amount is large and the hardness is high), and then the best SP process plan was confirmed. The accuracy rate of the stress function model was 94.85%, and the accuracy of the deformation function model was 95.08%, and the deviation rate from the experiment was less than 5.5%. The research results are helpful to realize the expected strengthening of the material surface and to provide SP processing reference for engineering application.

Author Contributions

Conceptualization, Z.G. and K.L.; methodology, Z.G. and J.C.; validation, J.C. and K.L.; formal analysis, Z.G.; investigation, Z.G. and J.C.; resources, J.C. and K.L.; writing—original draft preparation, Z.G.; writing—review and editing, K.L.; supervision, K.L.; project administration, K.L.; funding acquisition, K.L. All authors have read and agreed to the published version of the manuscript.

Funding

This research was funded by National Natural Science Foundation of China (Grant No. 51475483), Key Research and Development Program of Hunan Province (Grant No. 2018NK2065, 2019NK2022).

Data Availability Statement

The data that support the findings of this study are available from the corresponding author upon reasonable request.

Conflicts of Interest

The authors declare no conflict of interest.

References

  1. Feng, Y.; Luo, Z.; Li, Y.; Ling, Z. A novel method for resistance plug welding of 7075 aluminum alloy. Mater. Manuf. Process. 2016, 31, 2077–2083. [Google Scholar] [CrossRef]
  2. Robinson, J.S.; Pirling, T.; Truman, C.E.; Panzner, T. Residual stress relief in the aluminium alloy 7075. Mater. Sci. Technol. 2017, 33, 1765–1775. [Google Scholar] [CrossRef]
  3. Shen, Z.; Ding, Y.; Chen, J.; Fu, L.; Liu, X.; Chen, H.; Guo, W.; Gerlich, A.P. Microstructure, static and fatigue properties of refill friction stir spot welded 7075-T6 aluminium alloy using a modified tool. Sci. Technol. Weld. Join. 2019, 24, 587–600. [Google Scholar] [CrossRef]
  4. Mahmoudi, A.; Ghasemi, A.; Farrahi, G.; Sherafatnia, K. A comprehensive experimental and numerical study on redistribution of residual stresses by shot peening. Mater. Des. 2016, 90, 478–487. [Google Scholar] [CrossRef]
  5. Robinson, J.; Wimpory, R.C. Influence of low magnitude plastic strains on residual stress in 7075 aluminium alloy. Mater. Sci. Technol. 2019, 35, 1381–1391. [Google Scholar] [CrossRef]
  6. Hutsaylyuk, V. The peculiarity of cyclic elastic-plastic deformation of aluminum alloys D16ChATV under the conditions of the previous combined load. Mech. Adv. Mater. Struct. 2019, 27, 1246–1255. [Google Scholar] [CrossRef]
  7. Satish, D.R.; Feyissa, F.; Kumar, D.R. Cryorolling and warm forming of AA6061 aluminum alloy sheets. Mater. Manuf. Process. 2017, 32, 1345–1352. [Google Scholar] [CrossRef]
  8. Tomasz, T.; Przemyslaw, S.; Borek, W. Strength and structure of AlMg3 alloy after ECAP and post-ECAP processing. Mater. Manuf. Process. 2017, 32, 1368–1374. [Google Scholar]
  9. Uematsu, Y.; Kakiuchi, T.; Mizutani, Y.; Ishida, Y.; Fukunaga, K. Fatigue behaviour of dissimilar friction stir welds between wrought and cast aluminium alloys. Sci. Technol. Weld. Join. 2017, 23, 219–226. [Google Scholar] [CrossRef]
  10. Rakhimyanov, K.M.; Semenova, I.S. Surface state control by ultrasonic plastic deformation at the final machining stage. Mater. Manuf. Process. 2019, 31, 764–769. [Google Scholar] [CrossRef]
  11. Ahmadi, M.; Sadeghi, B.M.; Irani, M.; Rahimi, F. Finite element simulation of shot peening of an aluminum alloy considering hardening models. Russ. J. Non-Ferrous Met. 2016, 57, 565–571. [Google Scholar] [CrossRef]
  12. Wu, G.; Wang, Z.; Gan, J.; Yang, Y.; Meng, Q.; Wei, S.; Huang, H. FE analysis of shot-peening-induced residual stresses of AISI 304 stainless steel by considering mesh density and friction coefficient. Surf. Eng. 2019, 35, 242–254. [Google Scholar] [CrossRef]
  13. Pham, T.Q.; Khun, N.W.; Butler, D.L. New approach to estimate coverage parameter in 3D FEM shot peening simulation. Surf. Eng. 2017, 33, 687–695. [Google Scholar] [CrossRef]
  14. Xiao, X.; Tong, X.; Li, Y.; Wei, S.; Gao, G. Automatic numerical determination of peening stress from objective shape. Inverse Probl. Sci. Eng. 2018, 26, 1633–1655. [Google Scholar] [CrossRef]
  15. Zhang, X.; Liao, K.; Ji, V.; Chen, H.; Hu, L. Effect of the shot peening on the deformation of Al alloy component. Surf. Eng. 2018, 34, 946–953. [Google Scholar] [CrossRef]
  16. Hassani-Gangaraj, M.; Cho, K.S.; Voigt, H.-J.L.; Guagliano, M.; Schuh, C.A. Experimental assessment and simulation of surface nanocrystallization by severe shot peening. Acta Mater. 2015, 97, 105–115. [Google Scholar] [CrossRef]
  17. Maleki, E.; Unal, O. Roles of surface coverage increase and re-peening on properties of AISI 1045 carbon steel in conventional and severe shot peening processes. Surf. Interfaces 2018, 11, 82–90. [Google Scholar] [CrossRef]
  18. Ghasemi, A.; Hassani-Gangaraj, S.M.; Mahmoudi, A.H.; Farrahi, G.H.; Guagliano, M. Shot peening coverage effect on residual stress profile by FE random impact analysis. Surf. Eng. 2016, 32, 861–870. [Google Scholar] [CrossRef]
  19. Dai, S.; Zhu, Y.; Huang, Z. Microstructure and tensile behaviour of pure titanium produced after high-energy shot peening. Mater. Sci. Technol. 2016, 32, 1323–1329. [Google Scholar] [CrossRef]
  20. Lago, J.; Guagliano, M.; Bokůvka, O.; Trško, L.; Řidký, O.; Nový, F.; Závodská, D. Improvement of fatigue endurance of welded S355 J2 structural steel by severe shot peening. Surf. Eng. 2017, 33, 715–720. [Google Scholar] [CrossRef]
  21. Wang, Z.-M.; Jia, Y.-F.; Zhang, X.-C.; Fu, Y.; Zhang, C.-C.; Tu, S.-T. Effects of different mechanical surface enhancement techniques on surface integrity and fatigue properties of Ti–6Al–4V: A review. Crit. Rev. Solid State Mater. Sci. 2019, 44, 445–469. [Google Scholar] [CrossRef]
  22. Grell, D.; Gibmeier, J.; Dietrich, S.; Silze, F.; Böhme, L.; Schulze, V.; Kühn, U.; Kerscher, E. Influence of shot peening on the mechanical properties of bulk amorphous Vitreloy 105. Surf. Eng. 2017, 33, 1–10. [Google Scholar] [CrossRef]
  23. Nishikawa, S.; Ooi, K.; Takahashi, M.; Furukawa, T. Influence of shot peening and thermal ageing treatment on resistance to intergranular corrosion in shielded metal arc weld metal for type 600 nickel base alloy. Weld. Int. 2017, 31, 837–845. [Google Scholar] [CrossRef]
  24. Klemenz, M.; Schulze, V.; Rohr, I.; Löhe, D. Application of the FEM for the prediction of the surface layer characteristics after shot peening. J. Mater. Process. Technol. 2009, 209, 4093–4102. [Google Scholar] [CrossRef]
  25. Qiang, B.; Li, Y.; Yao, C.; Wang, X. Effect of shot peening coverage on residual stress field and surface roughness. Surf. Eng. 2017, 34, 1–8. [Google Scholar] [CrossRef]
Figure 1. FEM model of multi-projectile impacts and partial enlarged diagram.
Coatings 11 00160 g001
Figure 2. Boundary conditions in FEM model.
Coatings 11 00160 g002
Figure 3. (a) Stress contour; (b) Impact process.
Coatings 11 00160 g003
Figure 4. Stress distribution in the crater.
Coatings 11 00160 g004
Figure 5. (a) Contour and 3D surface plot of stress in terms of projectile size and distance; (b) Contour.
Coatings 11 00160 g005
Figure 6. Scatter plot between the actual and predicted stress.
Coatings 11 00160 g006
Figure 7. Scatter plot between the actual and predicted deformation.
Coatings 11 00160 g007
Figure 8. Sample before and after SP.
Coatings 11 00160 g008
Figure 9. Stress measurement by XRD.
Coatings 11 00160 g009
Figure 10. Profile of Al-alloy by optical microscope.
Coatings 11 00160 g010
Table 1. Mechanical properties of materials.
Objectλρ (g/cm3)Ε (GPa)σs(MPa)G (MPa)
Projectile0.317.85206
Target0.332.81715101027
Table 2. Factor levels for the experiment.
LevelDistance to Target (mm)Pressure (MPa)Projectile Size (mm)
−1500.20.3
01000.30.4
11500.40.5
Table 3. Box-Behnken design matrix and data.
Run OrderX1X2X3YRS (MPa)YH (μm)
110−1−272−152
2−1−10−285−128
30−1−1−231−112
4000−278−115
5000−281−117
60−11−343−121
7011−294−124
8−101−392−136
9000−276−112
10101−273−121
111−10−252−112
12110−282−138
13000−275−114
14−110−265−122
15000−268−115
16−10−1−241−111
1701−1−309−133
Table 4. Statistical analysis results of BBD data for stress.
TermCoefficientsSE (Coef.)F Valuep Value
Constant−275.605.7714.330.0010
X113.004.568.130.0247
X2−4.884.561.140.3205
X3−31.134.5646.590.0002
X1X2−12.506.453.760.0938
X1X337.506.4533.810.0007
X2X331.756.4524.240.0017
X122.186.290.120.7395
X222.436.290.150.7111
X32−21.086.2911.240.0122
R2 = 0.9485; Adjusted R2 = 0.8823
Table 5. Statistical analysis results of BBD data for deformation.
TermCoefficientsSE (Coef.)F Valuep Value
Constant−114.601.7315.030.0009
X1−3.251.365.680.0487
X2−5.501.3616.260.0050
X30.751.360.300.5995
X1X2−8.001.9317.200.0043
X1X314.001.9352.670.0002
X2X34.501.935.440.0524
X12−8.951.8822.660.0021
X22−1.451.880.590.4658
X32−6.451.8811.770.0110
R2 = 0.9508; Adjusted R2 = 0.8876
Table 6. Comparison of stress between experimental and calculated.
Target Stress/MPaProjectile Size/mmPressure/MPaDistance to Target/mmES/MPaEPCD/μm
0.430.3183.61−279.6 ± 8.63.6%−119.7
−2700.480.37108.48−284.2 ± 6.05.3%−129.6
0.320.2190.20−263.5 ± 7.32.4%−117.2
Publisher’s Note: MDPI stays neutral with regard to jurisdictional claims in published maps and institutional affiliations.

