Article

Chitosan Coated Luteolin Nanostructured Lipid Carriers: Optimization, In Vitro-Ex Vivo Assessments and Cytotoxicity Study in Breast Cancer Cells

by
Sadaf Jamal Gilani
1,*,
May Bin-Jumah
2,
Md. Rizwanullah
3,
Syed Sarim Imam
4,*,
Khalid Imtiyaz
5,
Sultan Alshehri
4,6 and
Mohd. Moshahid Alam Rizvi
5
1
Department of Basic Health Sciences, Preparatory Year, Princess Nourah bint Abdulrahman University, Riyadh 11671, Saudi Arabia
2
Biology Department, College of Science, Princess Nourah bint Abdulrahman University, Riyadh 11474, Saudi Arabia
3
Department of Pharmaceutics, School of Pharmaceutical Education and Research, Jamia Hamdard, New Delhi 110062, India
4
Department of Pharmaceutics, College of Pharmacy, King Saud University, Riyadh 11451, Saudi Arabia
5
Department of Biosciences, Faculty of Natural Sciences, Jamia Millia Islamia, New Delhi 110025, India
6
Department of Pharmaceutical Sciences, College of Pharmacy, Almaarefa University, Riyadh 11597, Saudi Arabia
*
Authors to whom correspondence should be addressed.
Coatings 2021, 11(2), 158; https://doi.org/10.3390/coatings11020158
Submission received: 27 December 2020 / Revised: 21 January 2021 / Accepted: 25 January 2021 / Published: 29 January 2021

Abstract

:
In the present study, luteolin (LTN)-encapsulated chitosan (CS) coated nanostructured lipid carriers (NLCs) were formulated using the melt emulsification ultrasonication technique. NLCs were optimized by using the 33-QbD approach for improved in vitro efficacy against breast cancer cell lines. The optimized LTN-CS-NLCs were successfully characterized by different in vitro and ex vivo experiments as well as evaluated for cytotoxicity in MDA-MB-231 and MCF-7 cell lines. The prepared LTN-CS-NLCs showed particle size (PS), polydispersity index (PDI), and entrapment efficiency (%EE) in the range between 101.25 nm and 158.04 nm, 0.11 and 0.20, and 65.55% and 95.37%, respectively. Coating of NLCs with CS significantly increased the particle size, encapsulation efficiency, and zeta potential changes positively. Moreover, slow-release rate of LTN was achieved during 24 h of study for LTN-CS-NLCs. In addition, optimized LTN-CS-NLCs showed significantly higher mucoadhesion, gastrointestinal stability, and intestinal permeation compared to non-coated LTN-NLCs and LTN suspension. Furthermore, LTN-CS-NLCs showed statistically enhanced antioxidant potential as well as dose and time-dependent cytotoxicity against MDA-MB-231 and MCF-7 cells compared to uncoated LTN-NLCs and pure LTN. On the basis of the above findings, it may be stated that chitosan-coated LTN-NLCs represents a great potential for breast cancer management.

1. Introduction

Breast cancer (BC) is the most frequently diagnosed solid tumor and the second leading cause of cancer death after lung cancer. Among women, breast cancer accounts for almost 30% of all newly diagnosed cancer cases [1,2]. The uncontrolled malignant cell growth at the inner lining of breast ducts leads to the development of BC. Age, sex, breast condition, estrogen level, and family history are the major factors related to a higher risk for the development of BC [3]. Furthermore, postmenopausal women are considered to have more risk. Up to 7 per cent of breast cancers are diagnosed in women under 40 years of age and less than 4 per cent in women under 35 years of age [4]. At present, the primary treatment for breast cancer is surgical resection, and it is supplemented by other treatments including radiotherapy, chemotherapy, endocrine therapy, and biological therapy. Unfortunately, the efficacy of both conventional and biological therapies is stymied by factors including poor pharmacokinetics, drug instability, low selectivity, dose-limiting toxicities, and the development of resistance [5,6,7]. Therefore, the development of new chemotherapy agents remains an important priority for the treatment of BC.
Luteolin (LTN) is a light yellow-colored crystalline flavonoid present in a number of medicinal plants. Many biological activities like antimicrobial, antioxidant, anticancer, anti-inflammatory, antiviral, and heart-protective effects have been reported [8,9]. Antibacterial activity against several organisms like Bacillus subtilis, Escherichia coli, and Staphylococcus aureus has also been reported. It inhibits nucleic acid and protein synthesis, and damage to the bacterial cell wall, as it inhibits biofilm formation [10,11]. Recently, LTN has shown excellent anticancer activity in a variety of solid tumors by induction of apoptosis and cell cycle arrest, and by inhibiting cell proliferation [12]. However, its application in delivery systems is limited due to limited aqueous solubility and stability in gastrointestinal media as well as low bioavailability [13].
In the last 3 decades, a variety of nanoparticles as drug delivery systems have been extensively employed for the oral delivery of different phytochemicals owing to their unique characteristics and advantages [14,15]. Among them, nanostructured lipid carriers (NLCs) are considered to be the best drug delivery system for improved oral drug delivery. NLCs are solid matrix-based nanocarriers prepared with biodegradable and biocompatible materials and help to improve the oral bioavailability of the encapsulated drug by improving its gastrointestinal stability, drug loading, and drug release [16]. NLCs surfaces can be modified with the cationic charged mucoadhesive polymer to get distinctive mucoadhesion with absorption enhancing characteristics.
Chitosan (CS) is a natural, non-toxic, biodegradable, and biocompatible cationic polymer extensively used for oral delivery systems. It has unique physicochemical characteristics such as its mucoadhesive as well as intestinal permeability enhancing properties. In addition, CS has shown excellent stability in hostile gastrointestinal fluids [17,18]. Surface modification of NLCs with CS offers various unique advantages, such as provide a positive charge to the NLCs that enhances adhesion to the intestinal mucosa and also increases the drug retention on the target site [19]. CS also helps to open the tight junction of the intestinal membrane which promotes drug absorption. Therefore, a CS coating significantly increases the residence time of NLCs at the target site which leads to enhanced bioavailability of encapsulated drugs [20].
Therefore, the present study was designed to formulate and optimize LTN-NLCs on the basis of particle size, polydispersity index (PDI), and entrapment efficiency. Optimization of LTN-CS-NLCs was conducted by 33-Box–Behnken Design (BBD). The optimized formulation (LTN-NLCs) was further coated with cationic charged chitosan (LTN-CS-NLCs) and evaluated for drug release, permeation study, surface morphology, stability study, and mucoadhesive study. Finally, the anticancer activity of optimized LTN-CS-NLCs, LTN-NLCs, and pure LTN was assessed in human MDA-MB-231 and MCF-7 breast cancer cell lines by MTT assay.

2. Materials and Methods

2.1. Materials

Luteolin (LTN) was procured from Beijing Mesochem Technology Co. Pvt. Ltd. (Beijing, China)”. Chitosan (MW- 100,000–300,000 Da; degree of deacetylation 85%; viscosity 20 cp) and tocopheryl polyethylene glycol succinate (TPGS) were procured from Sigma-Aldrich, Saint Louis, USA. Glyceryl monostearate (GMS; solid lipid), and Capryol 90 (liquid lipid) was provided by Gattefosse (Saint-Priest, France) as a gift sample. Poloxamer-188 (P-188; surfactant) was received as a gift sample from BASF Corporation, Mumbai, India. The experiment was performed with Milli Q water obtained from the laboratory. All other chemicals and reagents used were of AR grade.

2.2. Cell Lines

The cell line study was performed on MDA-MB-231and MCF-7 breast cell lines. The cells were procured from the National Centre for Cell Science, Pune, India. The cells were cultured in streptomycin (100 mg/mL) with Dulbecco’s Modified Eagle Medium (DMEM), fetal bovine serum (FBS; 10%), penicillin 100 U/mL in a specific condition. Finally, the cells were sub-cultured to get 80–90% growth for the experiments.

2.3. Experimental Design

In the present study, LTN-NLCs were optimized by 33-BBD technique to get a robust composition. The software (Design Expert 12.0; Stat-Ease Inc., Minneapolis, MN, USA) was used to optimize the prepared NLCs (i.e., LTN-CS-NLCs). The three independent factors used for the study were lipid (X1; 2–4% w/v), P-188 (X2; 1–2% w/v), and sonication time (ST) (X3; 3–5 min) as depicted in Table 1. The impact of three independent variables was examined by the dependent variables [(particle size (PS) in nm as Y1), (PDI as Y2), and (entrapment efficiency (EE) in % as Y3)]. The formulation design showed fifteen experimental compositions with three center points. The point prediction method was used to select the optimized LTN-CS-NLCs. Based on the minimum PS, PDI, and maximum EE. The statistical analysis was used to assess the independent variables affecting the responses as well as the interaction between the factors.

2.4. Formulation of LTN-CS-NLCs

LTN-CS-NLCs were formulated by the melt emulsification ultrasonication technique as per the reported procedure with slight modification [21]. Glyceryl monostearate (solid lipid; melting point: 66 °C) and Capryol 90 (liquid lipid) were selected to make the lipid matrix. Accurately weighed lipid (X1; 2–4% w/v) was melted at 70 °C and LTN (20 mg) was added to prepare homogeneous and uniform lipid phase. The aqueous phase was prepared with P-188 (as a surfactant; X2; 1–2% w/v), and TPGS (0.25% w/v as a stabilizer) in 10 mL of previously prepared 0.2% w/v CS and heated to the same temperature. CS solution (0.2% w/v) was prepared by dissolving 20 mg of CS in 10 mL of 1% acetic acid solution (pH 5.0) with continuous stirring for 30 min. The surfactant solution was added dropwise to the melted lipid phase with constant stirring at 750 rpm. The prepared sample was stirred for 30 min to get a transparent emulsion. In the end, the obtained transparent emulsion was further probe sonicated (Hielscher, Ultrasound UP-50 H, Teltow, Germany) (X3; 3–5 min) to obtain nanosized NLCs. LT-NLCs were prepared with the same composition and condition without the addition of chitosan (CS).

2.5. Characterization

2.5.1. Particle Characterization

The prepared LTN-CS-NLCs and LTN-NLCs were characterized for PS, PDI, and zeta potential (ZP). The size of diluted samples (100 fold) were measured in zeta sizer (Malvern Instruments, Worcestershire, UK). ZP of optimized nanoparticles was assessed to determine the charge on NPs surface. The surface morphology of selected LTN-CS-NLCs and LTN-NLCs was evaluated on transmission electron microscope (TEM, JEO-1010, Tokyo, Japan)) at 160 kV voltage. The samples were stained with phosphotungstic acid and visualized under the microscope at high resolution. The micrographs were captured and visualized with the help of imaging viewer software.

2.5.2. Entrapment Efficiency (%EE) and Drug Loading (%DL)

%EE and %DL of optimized LTN-CS-NLCs and LTN-NLCs were determined by the direct method as per the reported procedure with slight modification [18]. Free LTN was collected after precipitation of the NPs using acetonitrile, followed by centrifugation at 20,000 rpm for 10 min at 4 °C. The pellets containing the entrapped LTN were dissolved in dimethylsulfoxide (DMSO) and methanol solution in the ratio of 1:1 and heated at 70 °C. The quantity of LTN encapsulated within the NLCs matrix was determined by UV spectrophotometer (Shimadzu 1700, Shimadzu Corp., Kyoto, Japan). The %EE and %DL of prepared NLCs were calculated by the following equations:
% EE = Weight   of   LTN   in   pellete Weight   of   LTN   in   the   NLCs × 100
% DL = Weight   of   LTN   in   pellete Weight   of   pellets × 100

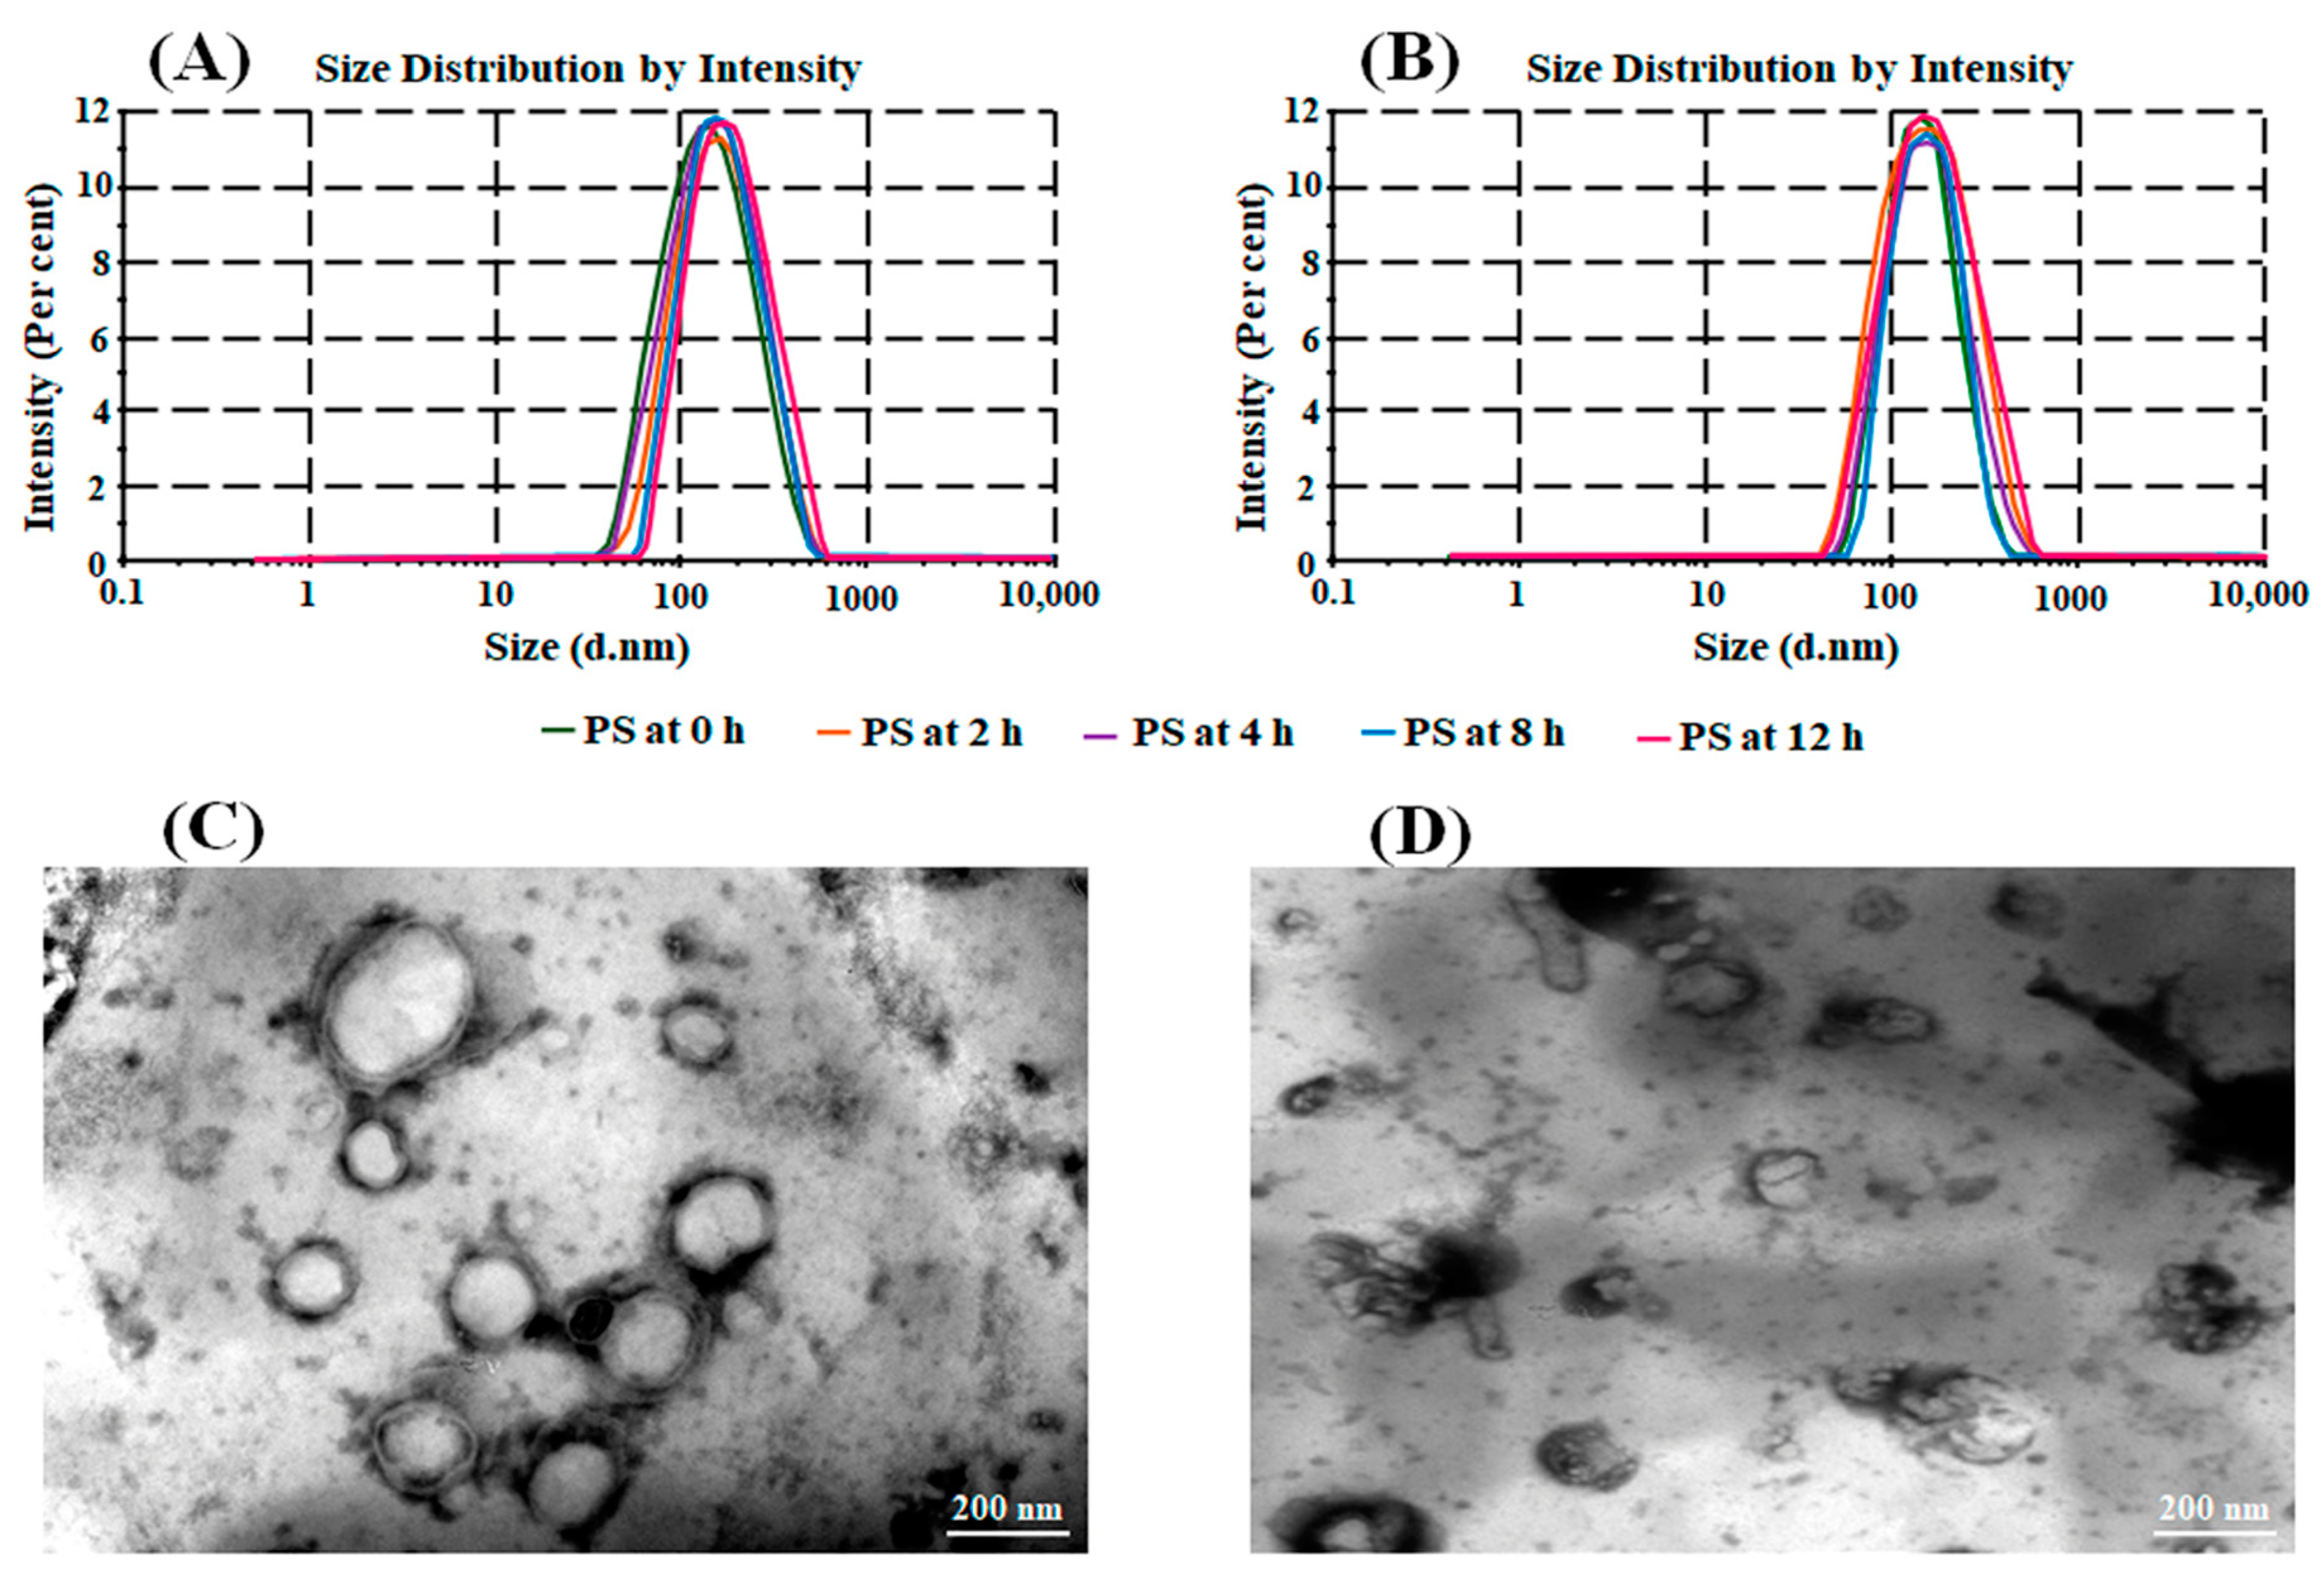
2.6. In Vitro Gastrointestinal Stability Study

The selected optimized LTN-CS-NLCs was evaluated for gastrointestinal stability as per the published procedure [22,23]. The stability in simulated intestinal fluid (SIF) and gastric fluid (SGF) was assessed. SGF was prepared by dissolving 100 mg of pepsin in 5 mL of water containing 0.35 mL concentrated HCl followed by the addition of sodium chloride (100 mg) and volume adjustment (up to 50 mL) with water. Finally, the pH of the solution was modified to 1.2 by the addition of concentrated HCl. SIF was prepared by dissolving 340 mg of monobasic potassium phosphate in 10 mL of water followed by the addition of 3.85 mL of 0.2 M NaOH and 500 mg of pancreatin. Finally, the volume was increased to 50 mL, and the pH was adjusted to 6.8 by NaOH [22]. LTN-CS-NLCs (0.1 mL) were withdrawn and diluted up to 5 mL (1 in 50) in SIF and SGF and incubated at 37 °C. At a specific time (0, 2, 4, 8, 12 h) the sample was evaluated for PS, PDI, EE, and surface morphology.

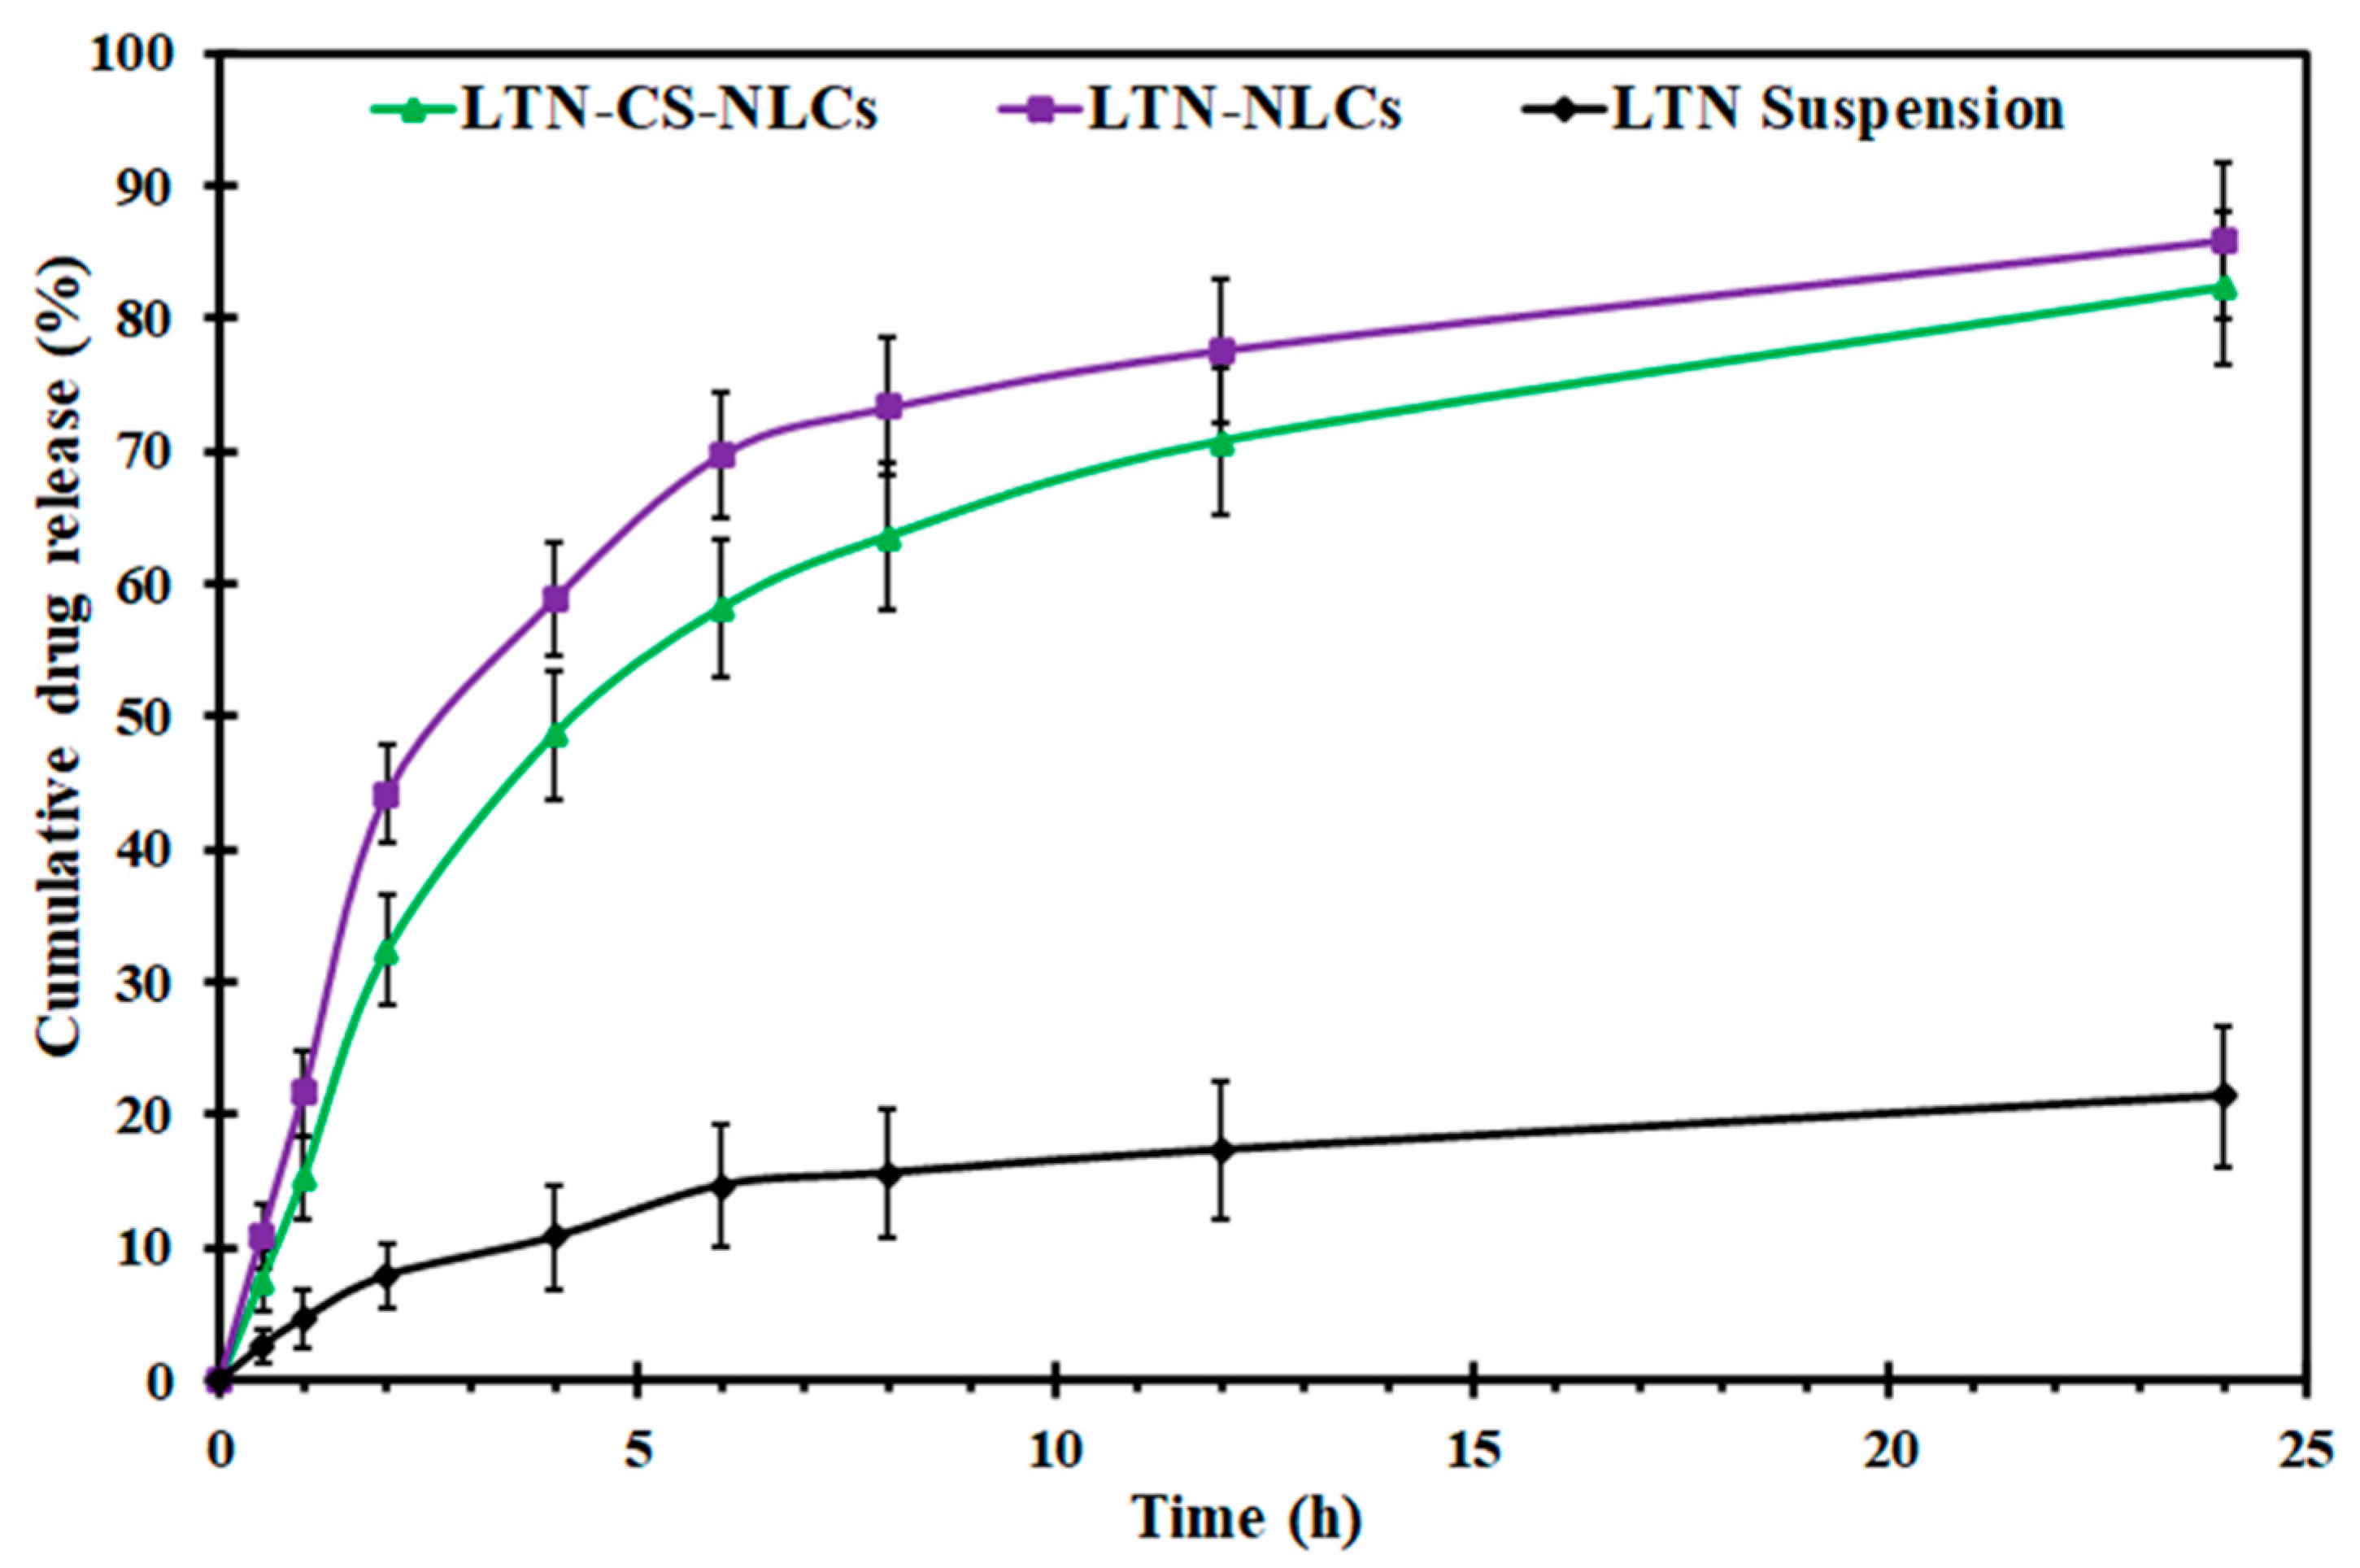
2.7. LTN Release Study

LTN release study was performed for LTN-CS-NLCs, LTN-NLCs, and LTN suspension (control) in release medium SIF (900 mL, pH 6.8) at 37 °C. Optimized LTN-CS-NLCs and LTN-NLCs (~5 mg of LTN) was placed in the dialysis bag (MW 12,000 g/mole) and dipped into release medium with stirring speed of 100 rpm. At a specific time point, the released content (5 mL) was withdrawn and replaced with the same volume. The collected samples were filtered, diluted, and analyzed to quantify LTN content using UV spectrophotometer (Shimadzu 1700, Shimadzu Corp., Kyoto, Japan). Further, the released data was fitted into various kinetic models to analyze the mechanism of LTN release [24].

2.8. Mucoadhesion Study

The optimized LTN-CS-NLCs, LTN-NLCs, and LTN suspensions were evaluated for mucoadhesion study to check the adsorption of mucin on the NLCs [25]. The mucin solution (1 mg/mL) was prepared and mixed with the prepared formulations in 1:1 ratio. The mixture was incubated at 37 °C for 2 h and then centrifuged at 13,000 rpm for 60 min. The supernatant was taken, diluted appropriately, and analyzed spectrophotometrically (Shimadzu 1700, Shimadzu Corp., Kyoto, Japan) at 258 nm to calculate the free mucin content. The formula used to calculate as given below [26].
Mucoadhesive   efficiency = C 0   C f C 0   × 100
where C0 = initial mucin content and Cf = free mucin content.

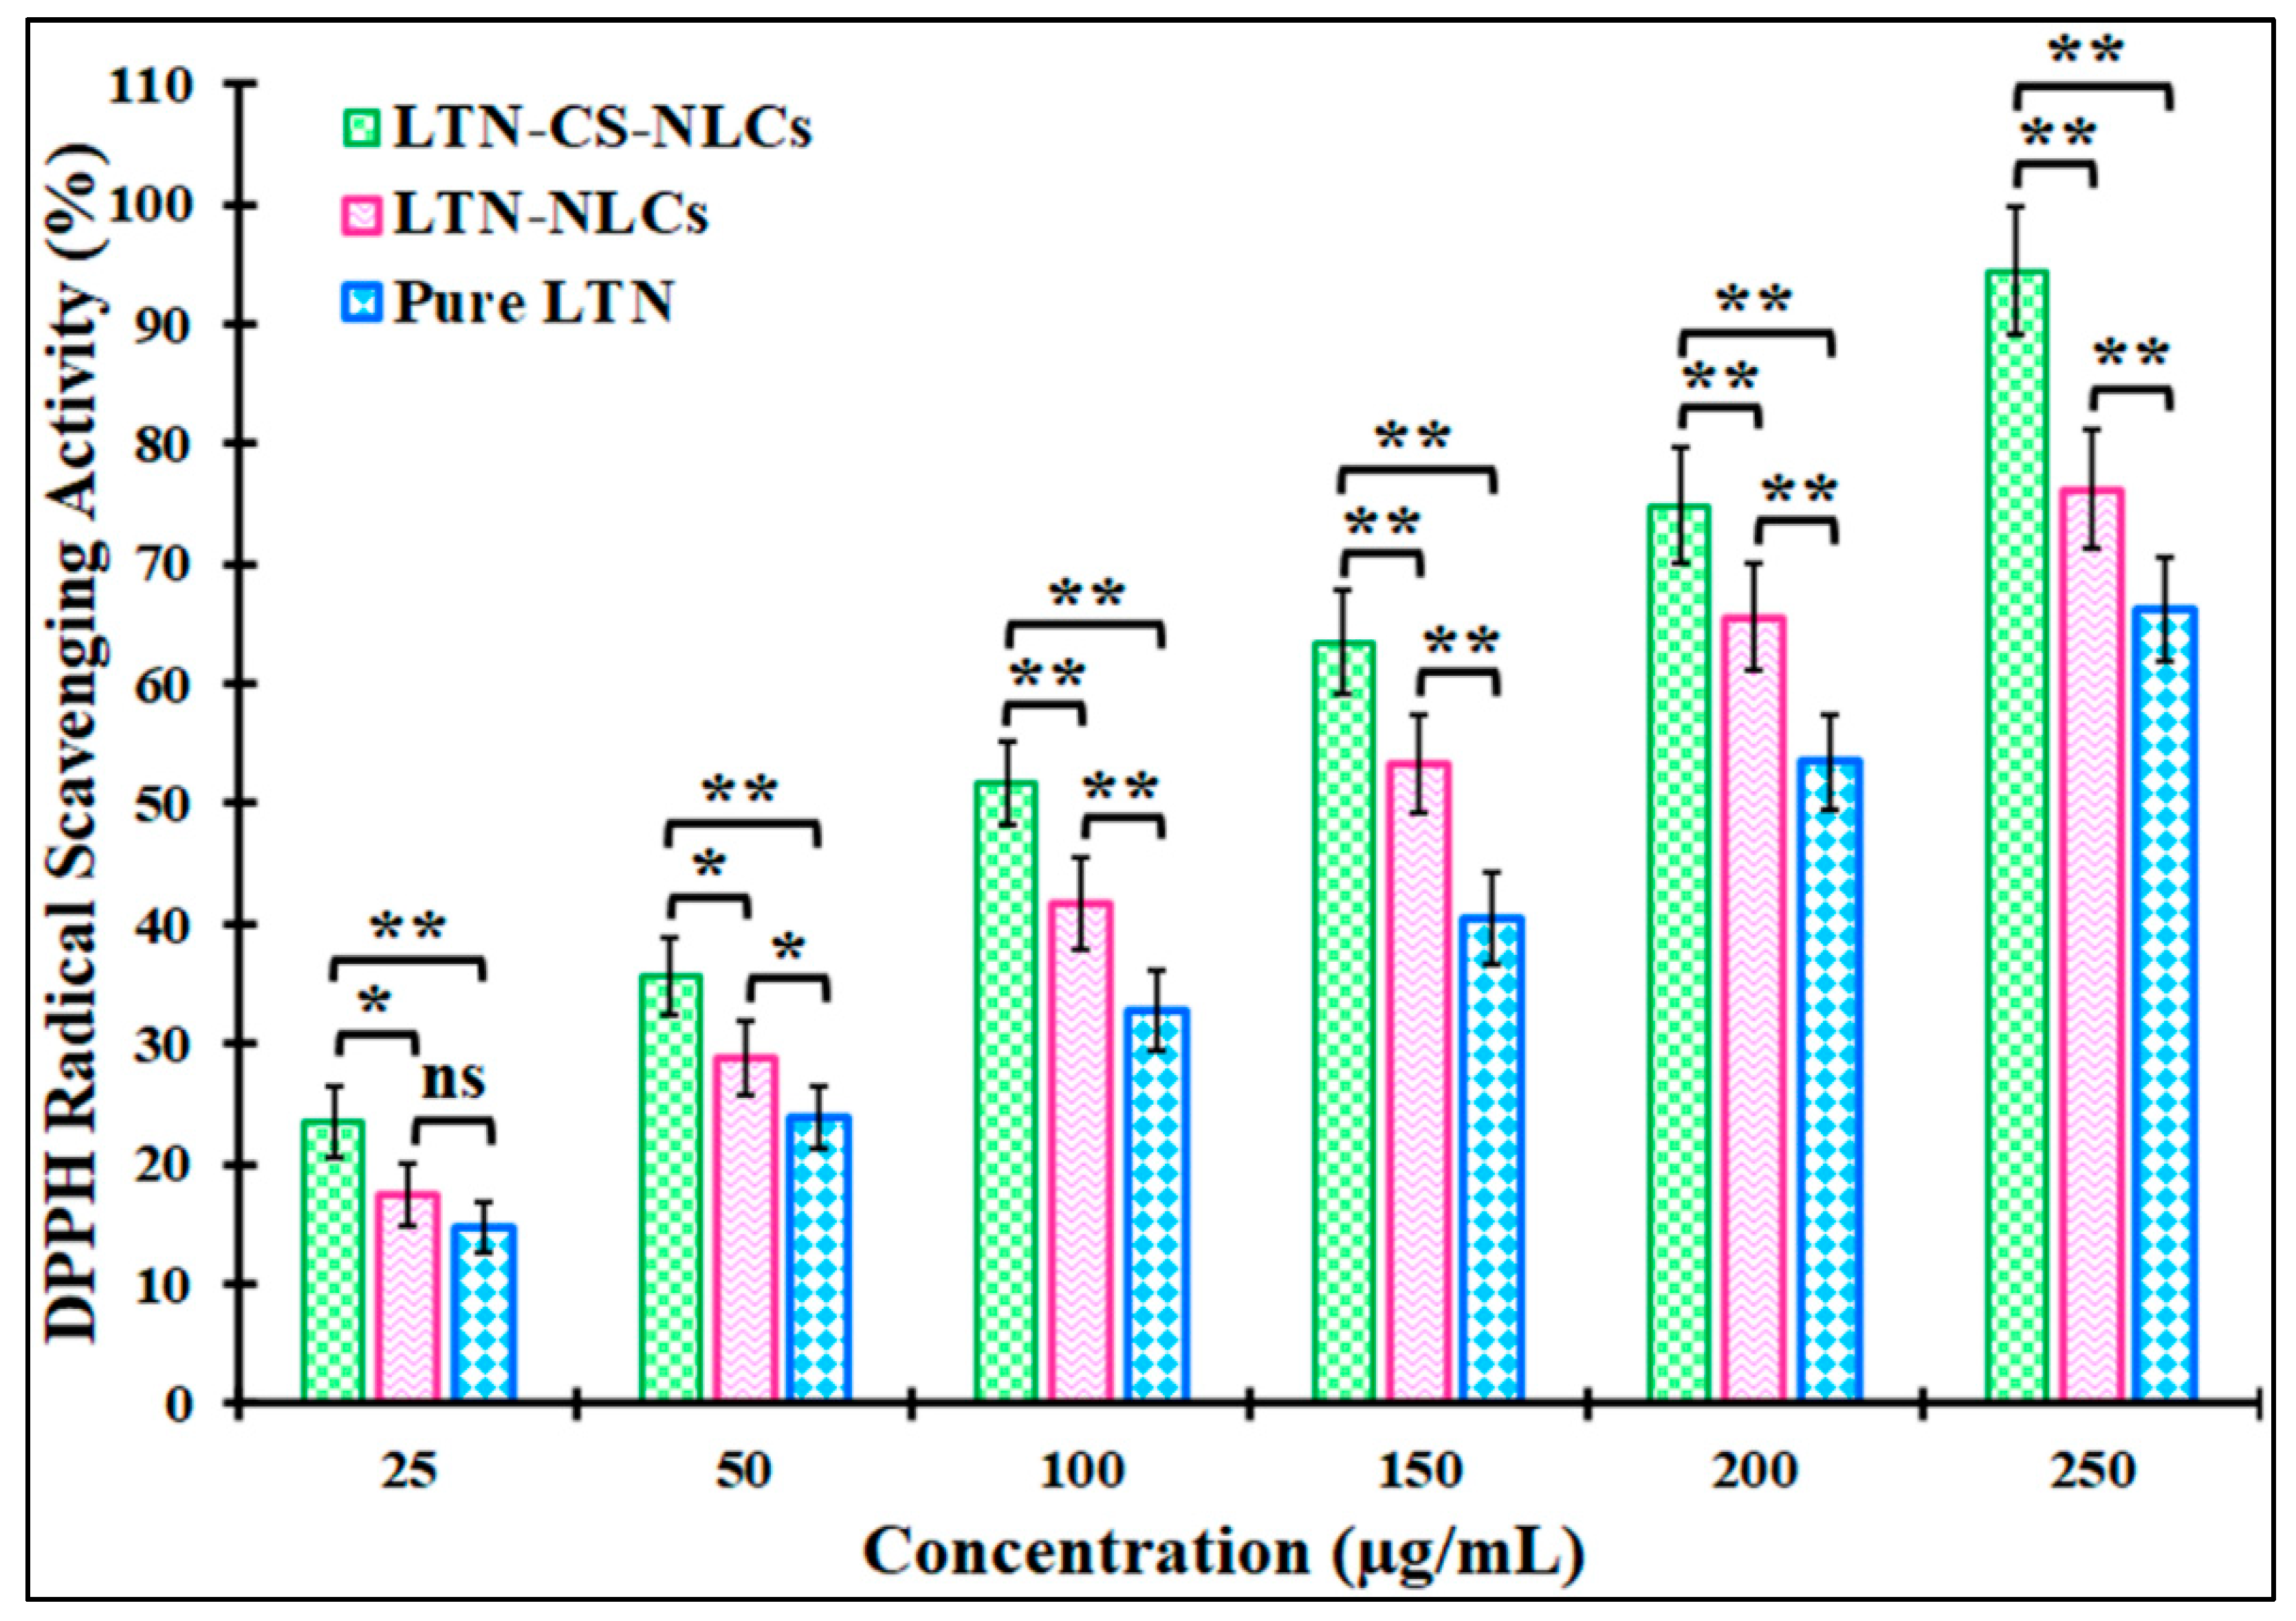
2.9. Antioxidant Activity

The study was performed for optimized LTN-CS-NLCs, LTN-NLCs, and LTN suspension to check the antioxidant potential by the reported procedure with slight modification [27]. The stock solution (10 mg/mL) was prepared for all three samples in ethanol and further diluted to make the concentration of 25–250 µg/mL. All the samples (500 µL) were taken and transferred to 2,2-diphenyl-1-picrylhydrazyl (DPPH) solution (0.02% in ethanol). The samples were shaken for complete reaction and placed in the dark at 25 °C for 1 h. The reaction took place between violet color DPPH and antioxidants. The violet color of the solution turns colorless after the completion of the reaction. Similarly, this experiment was repeated for placebo NLCs. The samples were examined spectrophotometrically (Shimadzu 1700, Shimadzu Corp., Kyoto, Japan) at 517 nm, and calculation was done using the formula:
Radical   Scavenging   ( % ) =   Absorbance   of   control Absorbance   of   test Absorbance   of   control   × 100

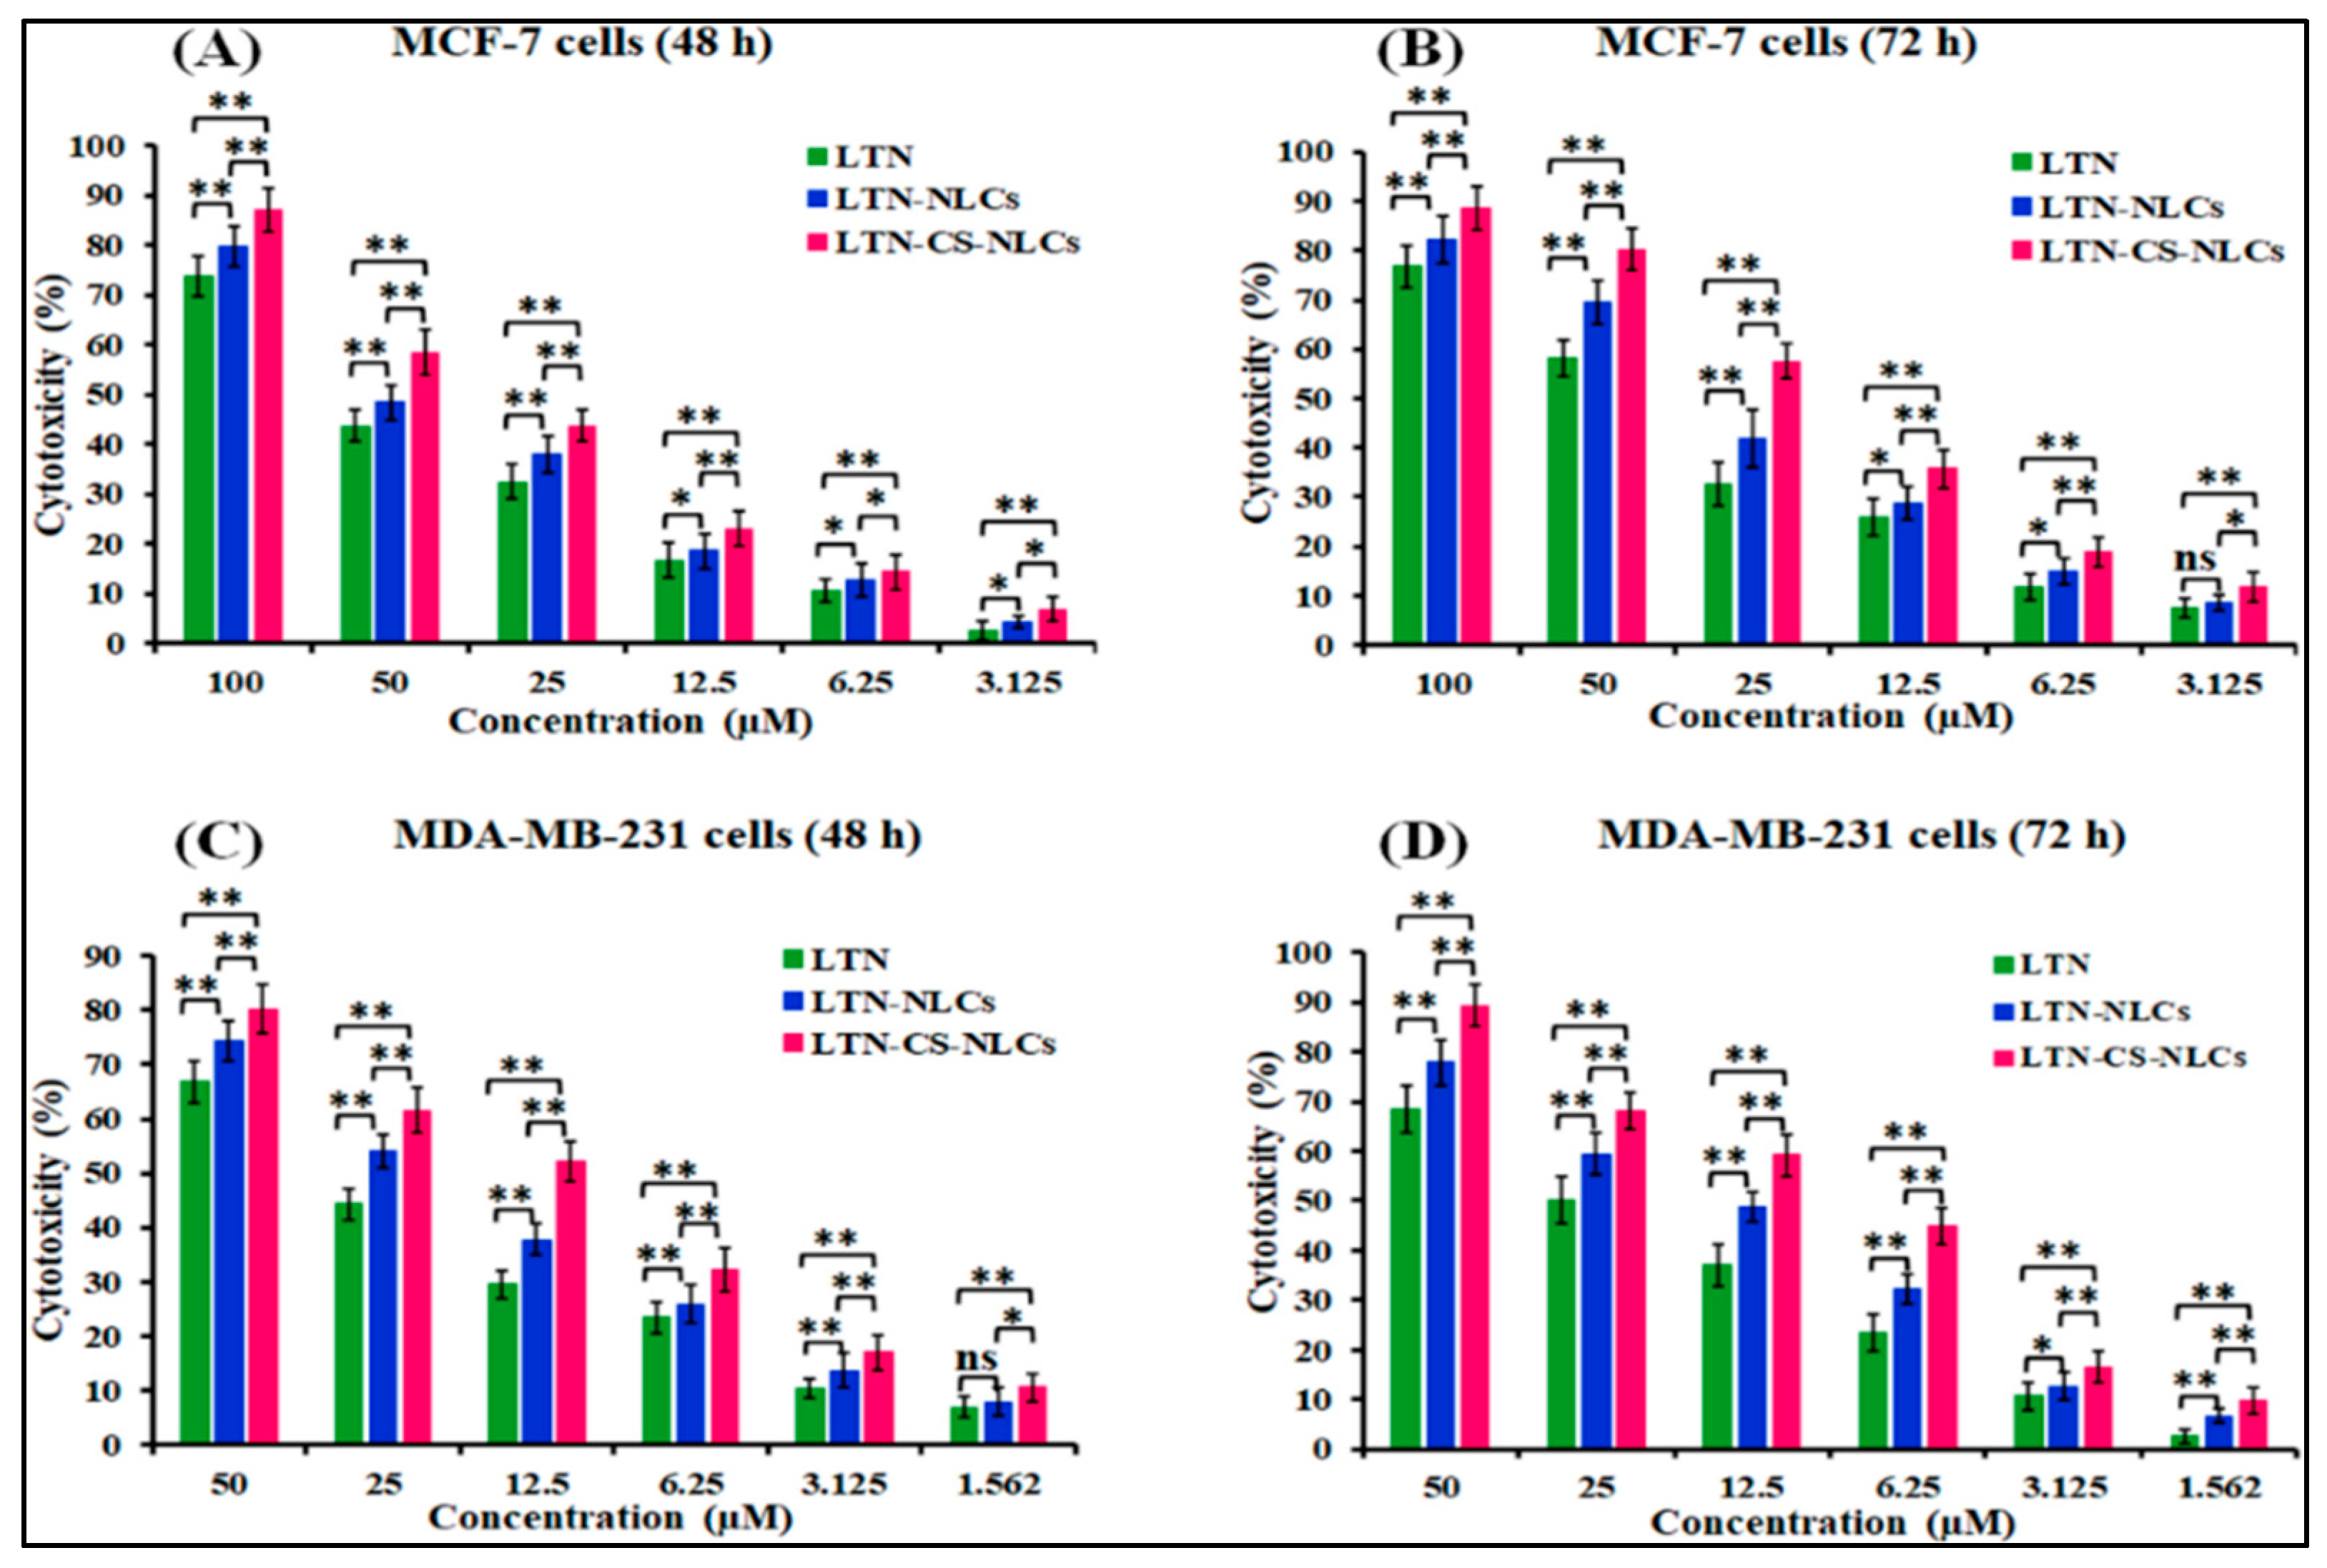
2.10. Cytotoxicity Study

MTT assays of LTN-CS-NLCs, LTN-NLCs, and LTN suspension were performed to check the per cent cytotoxicity [28]. This test works on the mechanism of the formation of yellow tetrazolium salt to insoluble purple formazan crystals [29]. Both MDA-MB-231 and MCF-7 cells were seeded 24 h before the study. The cell counts 1 × 10⁵/well were taken for the study, and different concentrations of each sample were incubated for 48 h and 72 h, respectively. After that, cells were incubated with MTT (20 µL, 5 mg/mL in phosphate buffer saline- PBS) in a fresh medium for 4 h under CO2 incubator. The formed formazan crystal was solubilized in DMSO (150 µL/well). The absorbance was noted at 570 nm on a microplate reader (Bio Tek Instruments, Mumbai, India).

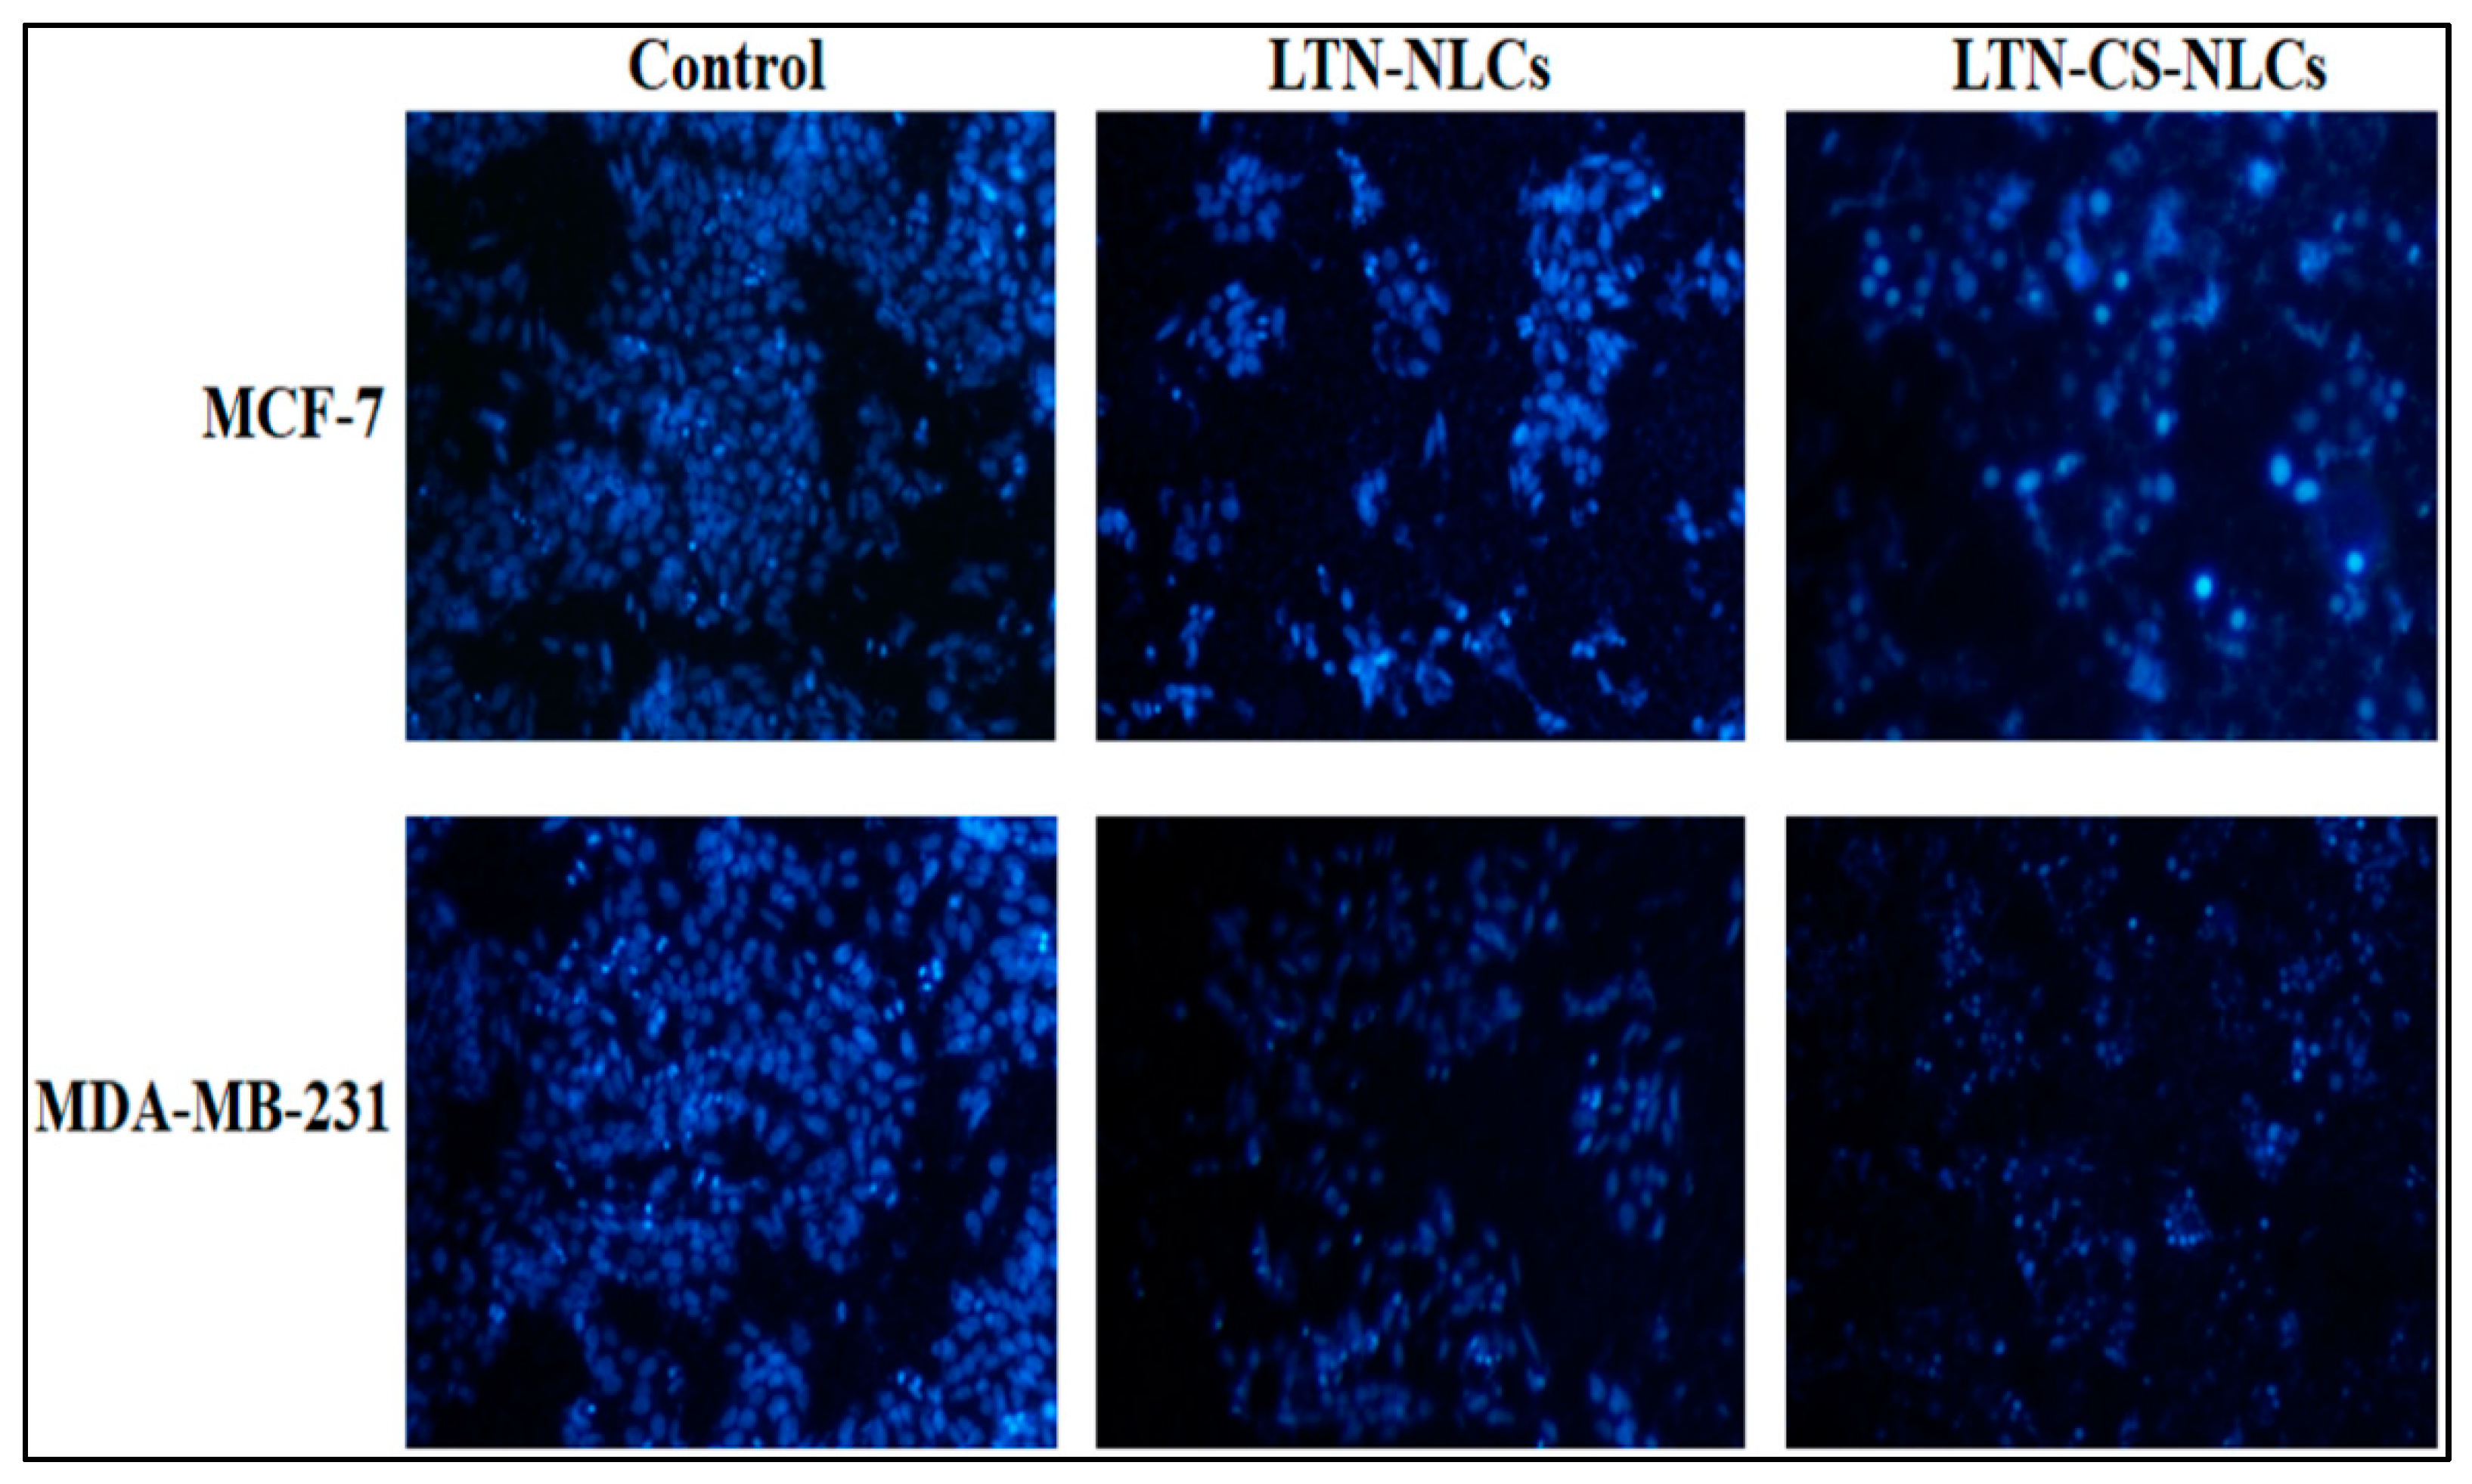
2.11. DAPI for Nuclear Staining

MDA-MB-231 and MCF-7 cells (105 cells/well) were cultured, treated with LTN-CS-NLCs as well as LTN-NLCs, and incubated for 48 h. Following incubation, DMSO control and treated cells were washed twice with PBS and fixed in glutaraldehyde (2.5%) for 20 min. Subsequently, the cells were permeabilized in Triton X-100 (0.1%) for 15 min and stained with DAPI (4′,6-diamidino-2-phenylindole) for 20 min in the dark. After being washed 3 times with PBS, the nuclear morphology of cells was observed by fluorescence microscopy (Olympus, Japan) [30].

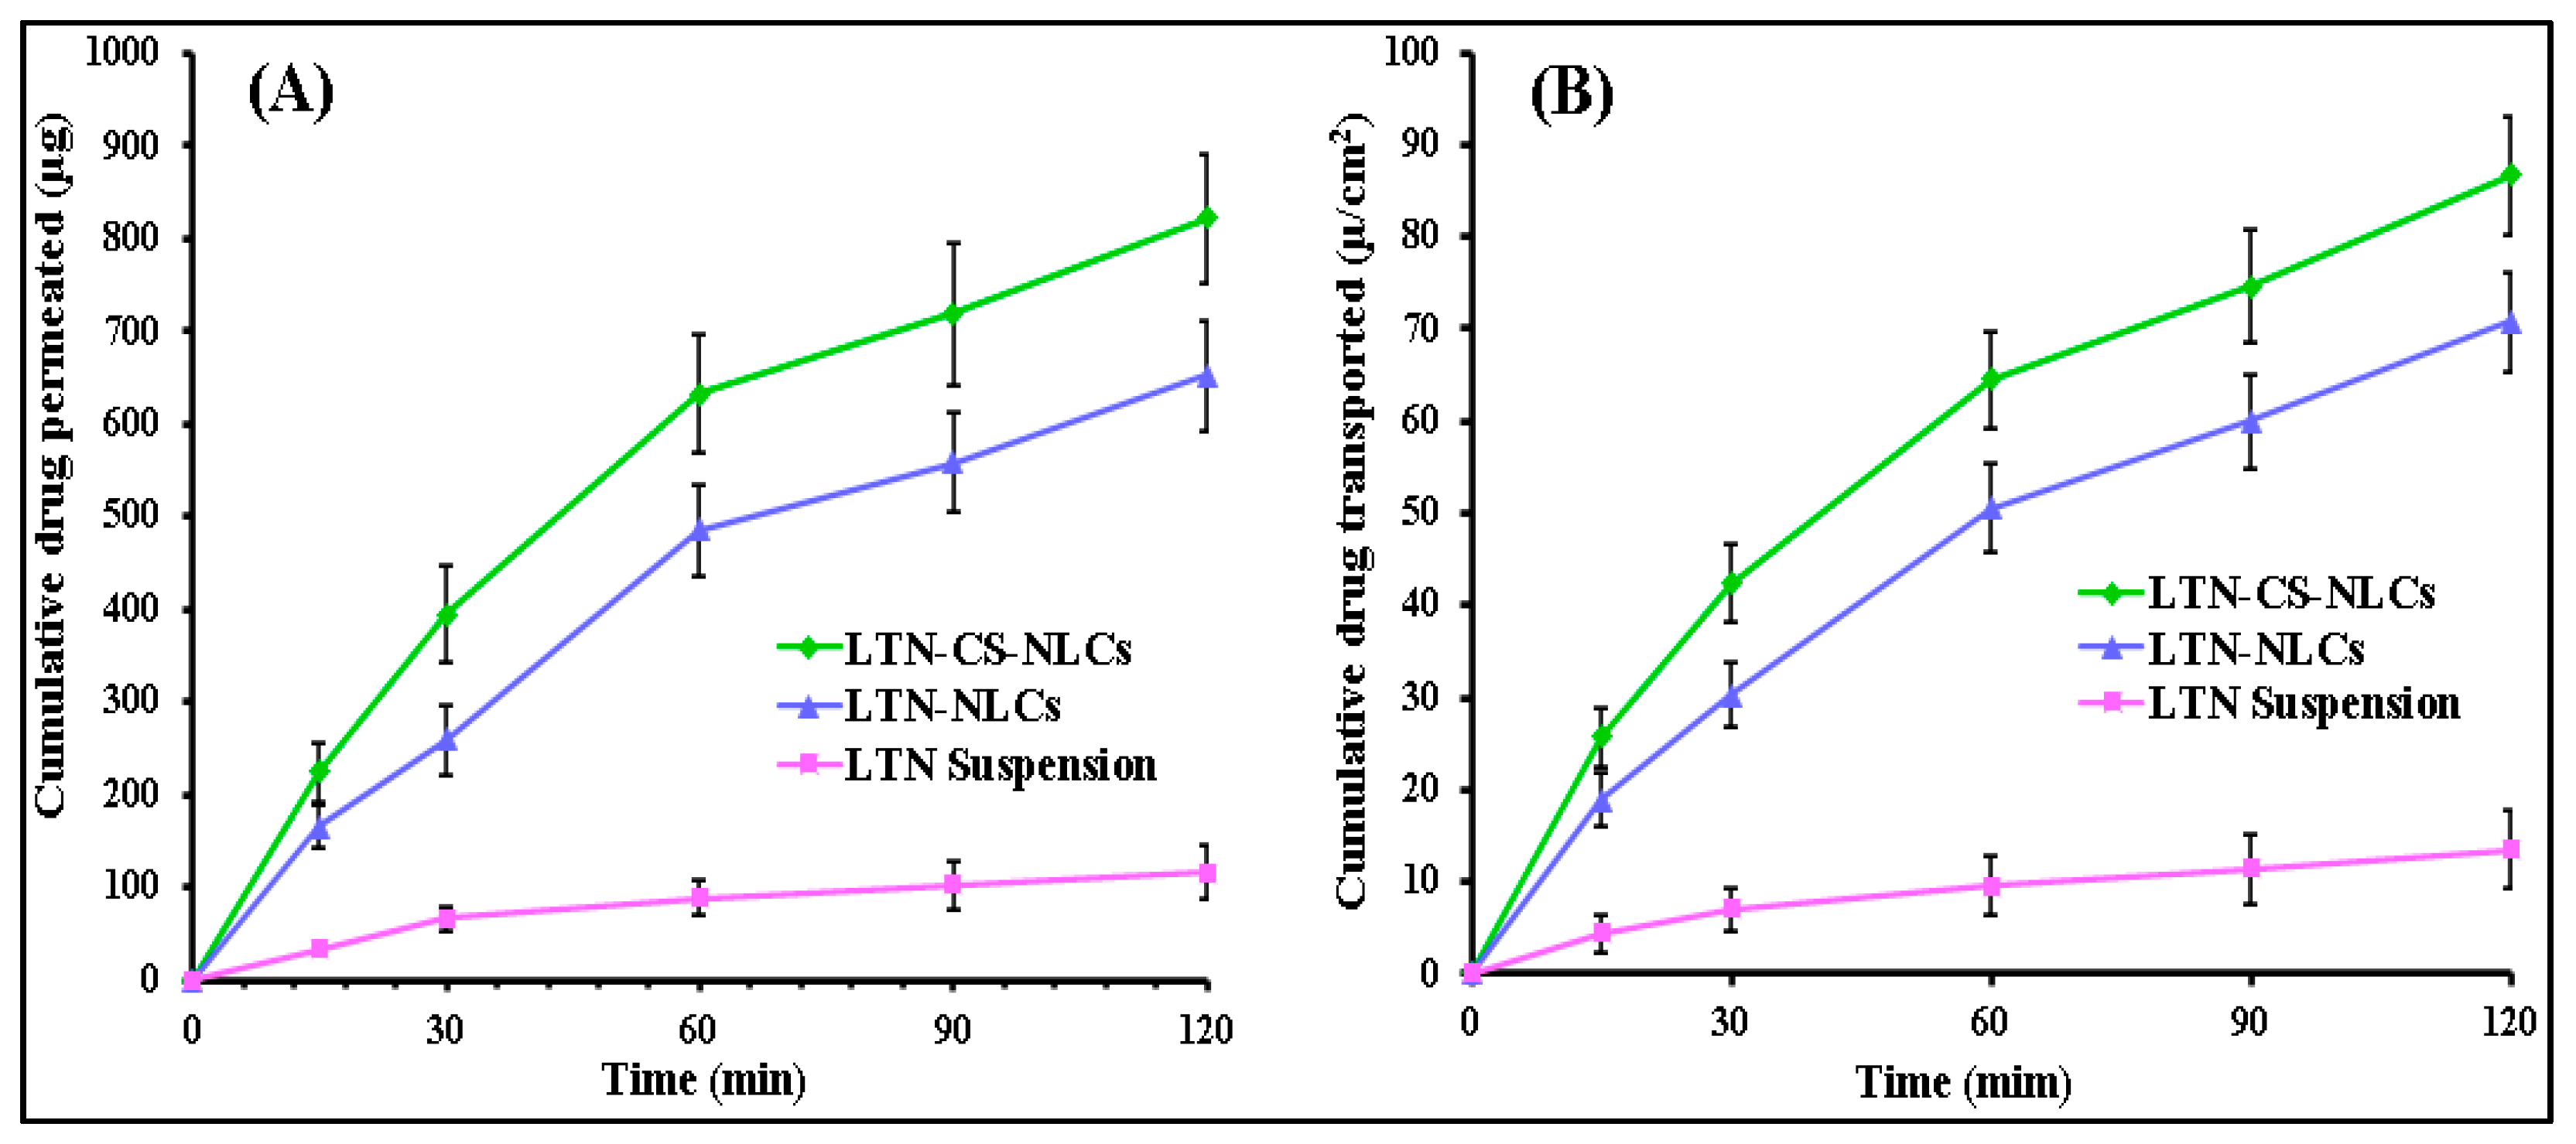
2.12. Intestinal Permeation Study

The permeation experiment of LTN-CS-NLCs, LTN-NLCs, and LTN suspension was conducted to determine the amount of drug permeated at specific times. The study was performed on the goat intestine by the reported procedure with slight modification [31]. The fresh goat intestine was collected from the local slaughterhouse at an abattoir in a sterile beaker and washed with Kreb’s solution to remove the food residues. The formulations (~5 mg of LTN) were carefully placed in the intestinal sac, and both ends were ligated tightly. The samples were placed in a beaker containing Kreb’s solution (250 mL) and regularly oxygenated with 95% oxygen using an aerator. The released content (2 mL) was taken at a specific time point and replaced with the same volume. The samples were filtered, diluted, and quantified by using UV spectrophotometer (Shimadzu 1700, Shimadzu Corp., Kyoto, Japan). The permeation flux and apparent permeability coefficient (APC; Papp) and were determined for the formulations by the following equation.
APC =   Permeation   flux Surface   area   ×   Initial   LTN   content   ( C 0 )   cm / min

2.13. Statistical Analysis

Experiments were conducted 3 times, and their findings were represented as average ± SD. Statistical analysis was performed with GraphPad Prism (version 7). Furthermore, the data were analyzed statistically using ANOVA and Tukey’s test with the help of GraphPad Prism, version 7. The differences were considered significantly or highly significantly different from the control group when p < 0.05 and p < 0.01, respectively.

3. Results and Discussion
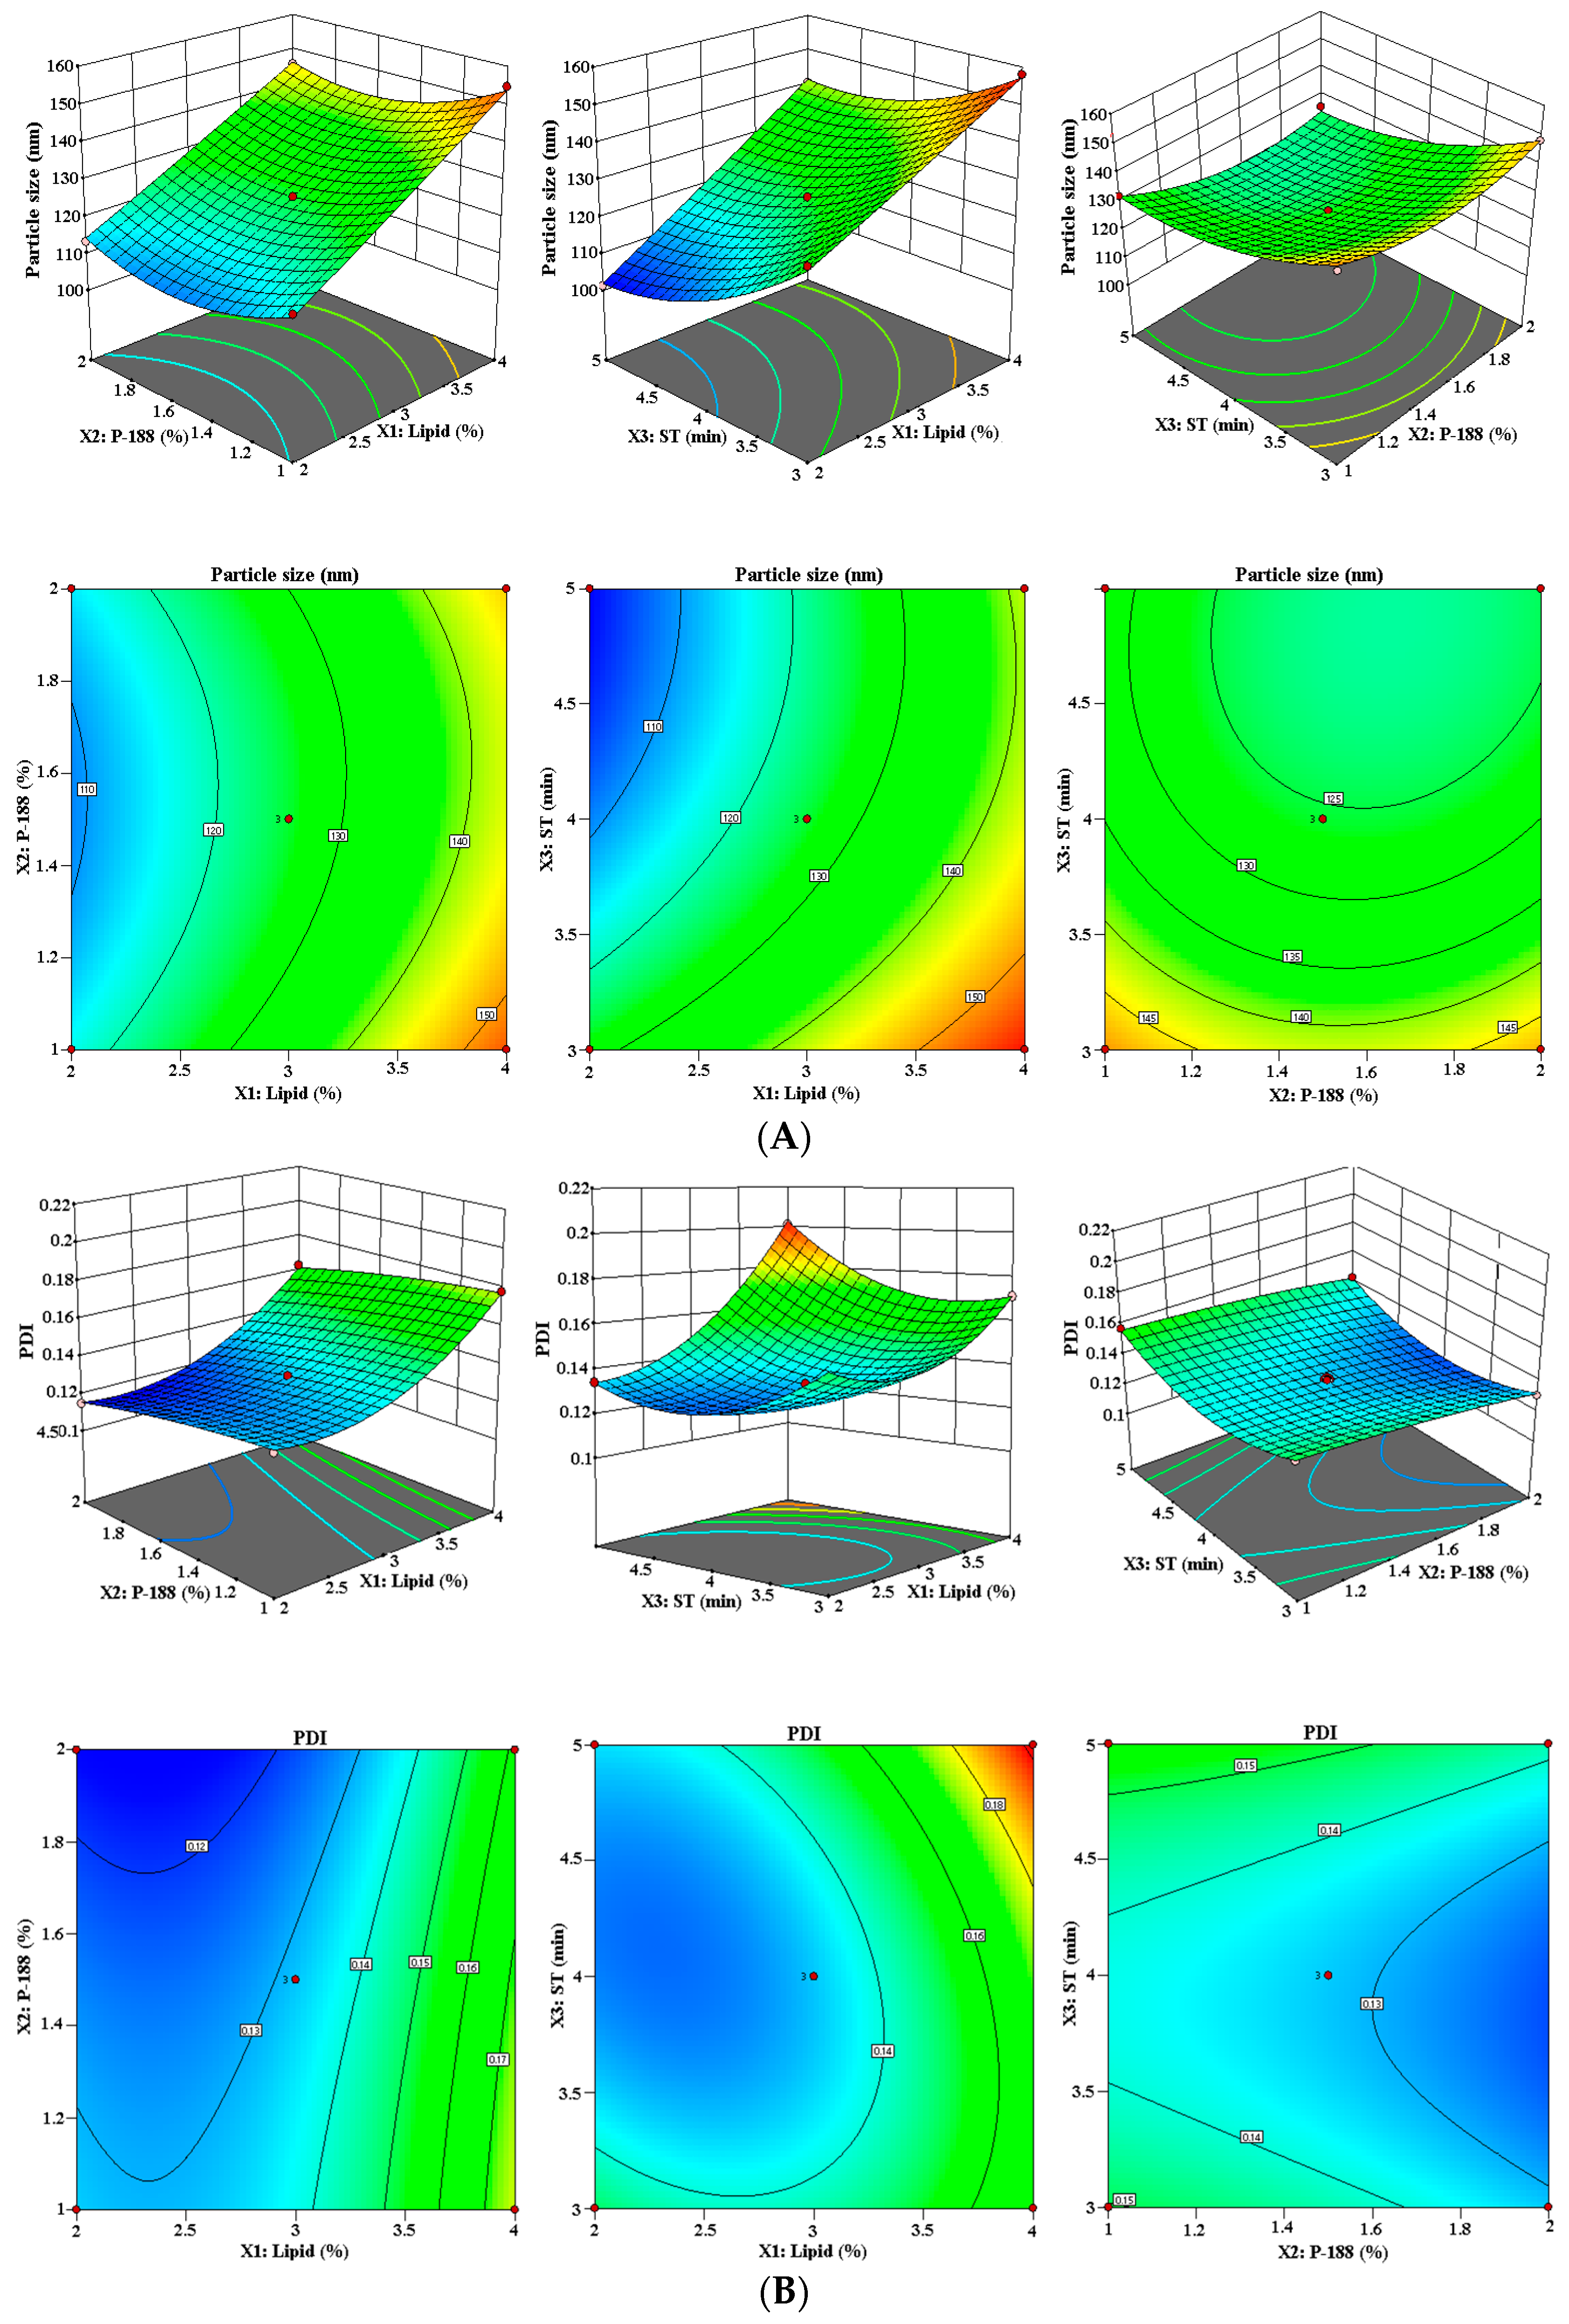
3.1. Optimization

The developed LTN-CS-NLCs were statistically optimized with 33-Box–Behnken design. The impact of independent variables (X1, X2, and X3) was evaluated on the dependent variables (Y1, Y2, and Y3) using 3D response surface plot and contour plot (Figure 1). Polynomial equations are used to assess the individual as well as the combined impact of all three independent variables. The quadratic model is the ideal model for the selected variables to show the effect individually as well as combinedly.
The independent variables lipid (% w/v, X1); P-188 (% w/v, X2) and ST (min, X3) were taken at three levels {low (−1), medium (0), and high (+1)} to optimize LTN-CS-NLCs. The concentration range taken to develop LTN-CS-NLCs as lipid (X1) as 2% (−1) to 4% (+1), P-188 (X2) as 1% (−1) to 2% (+1) and ST 3 min (−1) to 5 min (+1). The design represented 15 formulations with 3 center points to analyze the error in the result of the same three compositions. The minimal PS (Y1) was observed to be 101.25 nm (F14), and the maximal PS was observed to be 158.04 nm (F8). The PDI (Y2) was obtained in the range of 0.115 (F2) to 0.201 (F12), and the %EE (Y3) was obtained in the range of 65.55% (F14) to 95.37% (F8). The results obtained from the experiment, in other words, actual values, were observed to be much closer to the predicted values, as represented in Table 2.

3.1.1. Effect of Lipid (X1), P-188 (X2), and ST (X3) on PS (Y1)

The polynomial equation indicating the relationship between the factors on PS (Y1) is presented as follows:
Particle size (Y1) = +125.72 + 17.21X1 − 2.43X2 − 10.49X3 − 1.24X1X2 + 2.58X1X3 − 1.70X2X3 + 0.3513X12 + 6.77X22 + 6.15X32
The impact of all three independent variables (X1, X2, and X3) have been illustrated in the 3D and contour plots as depicted in Figure 1A. As per the polynomial equation and Figure 1A, a considerable impact of each independent variable on PS (Y1) can be observed. Gradual increment in the PS was observed with the increase in lipid (X1) concentration. As the lipid concentration increases the emulsifying capacity of surfactant decreases, which results in the aggregation of particles. The second variable P-188 (X2) has depicted a negative impact of the PS. The increase in P-188 concentration from 1% to 2% w/v significantly (p < 0.05) decreases the PS. P-188 is a surfactant and stabilizer that significantly decreases the interfacial tension between lipid and aqueous phases, and helps to get small-sized emulsion [32]. At higher surfactant concentration, there was effective stability of NLCs achieved due to a steric barrier to the NLCs surface. It protects small NLCs particles by preventing aggregation [33]. Another probable elucidation for such reduction in the PS might happen from ST (X3), which has a direct impact on PS. It helps to reduce PS during the development of LTN-CS-NLCs.

3.1.2. Effect of Lipid (X1), P-188 (X2), and ST (X3) on PDI (Y2)

The polynomial equation indicating the relationship between the factors on PDI (Y2) is presented as follows:
Polydispersity index (Y2) = +0.1320 + 0.0227X1 − 0.0081X2 + 0.0041X3 + 0.0003X1X2 + 0.0117X1X3 + 0.0010X2X3 + 0.0168X12 − 0.002X22 + 0.0155X32
The impact of all three independent variables (X1, X2, and X3) has been illustrated in the response surface plot as depicted in Figure 1B. As per the polynomial equation and Figure 1B, a considerable impact of each independent variable was observed on PDI (Y2). As the concentration of lipids (X1) increased, PDI also significantly increased. The enhancement in PDI might be due to an increase in the heterogeneity of particles. Moreover, P-188 (X2) showed a strong negative impact on the PDI. The surfactant significantly reduces the interfacial tension between the lipid and aqueous phase that leads to the development of uniform primary emulsion during the development of LTN-CS-NLCs. The third variable ST (X3), is further responsible for an increase in the PDI due to the development of particles of different sizes.

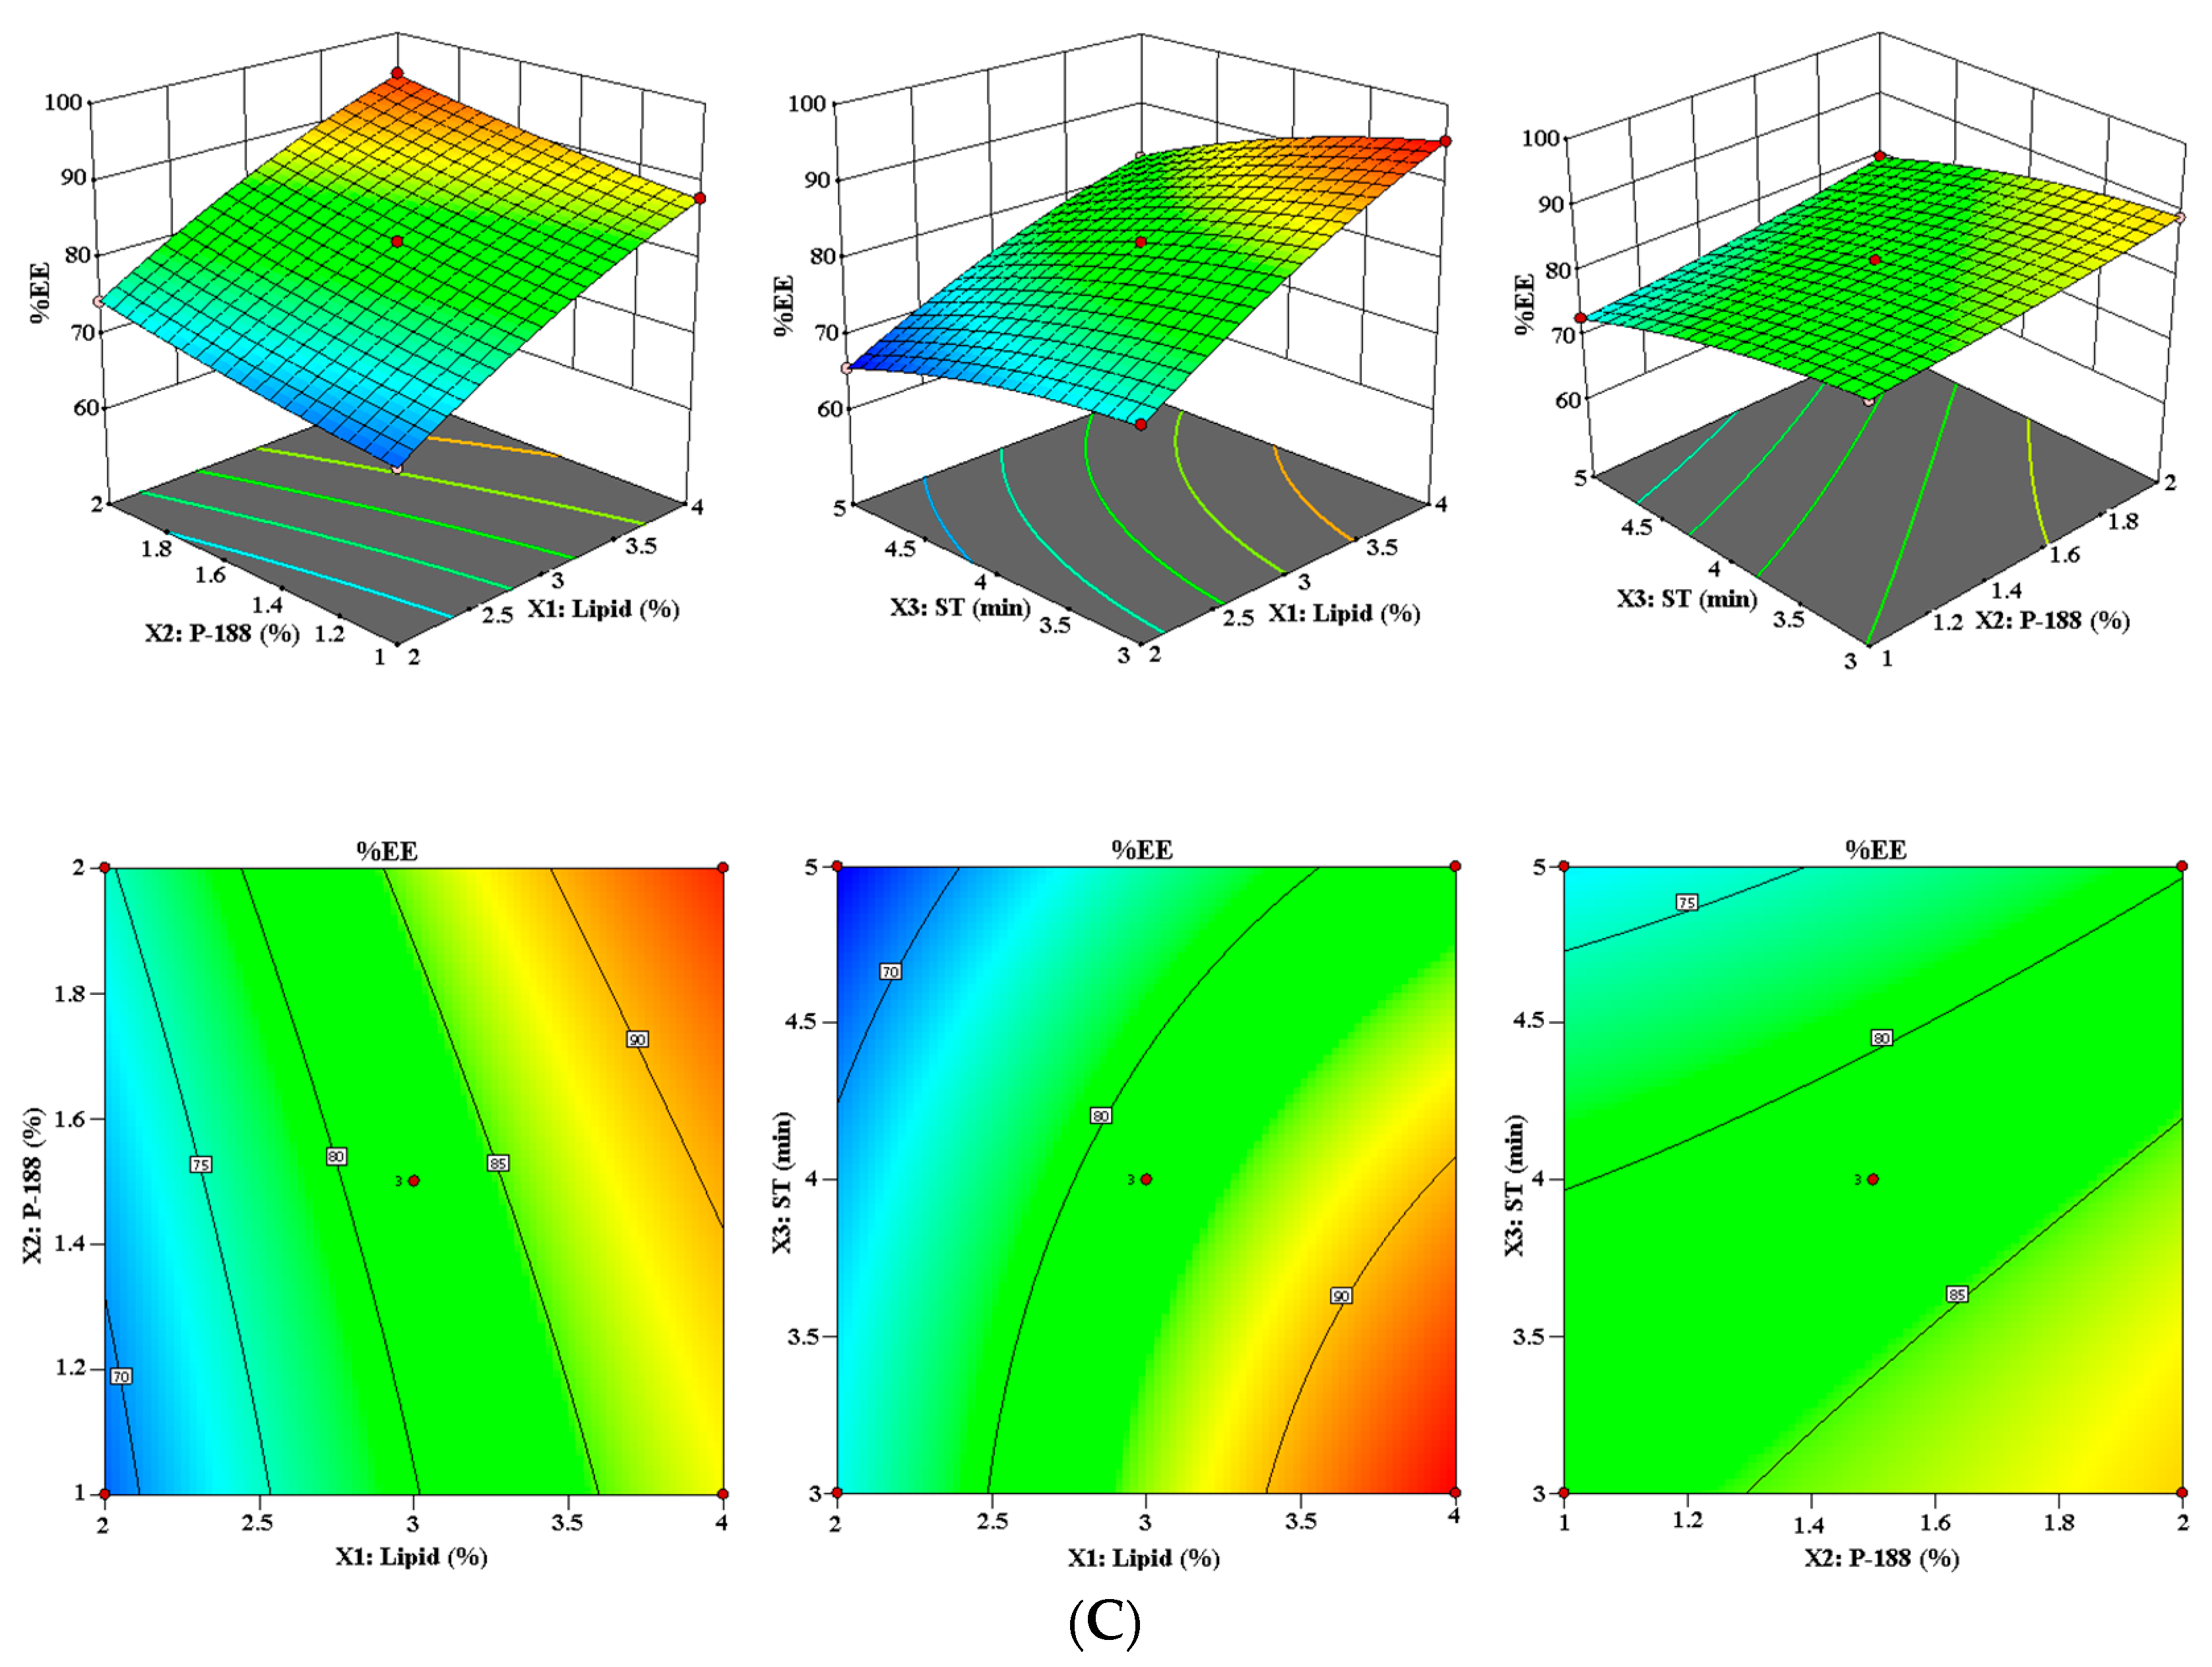
3.1.3. Effect of Lipid (X1), P-188 (X2), and ST (X3) on %EE (Y3)

The polynomial equation indicating the relationship between the factors on %EE (Y3) is presented as follows:
Entrapment efficiency (Y3) = +82.36 + 9.72X1 + 3.08X2 − 5.15X3 + 0.09X1X2 − 1.20X1X3 + 0.3675X2X3 − 1.61X12 + 0.5425X22 − 1.49X32
The impact of all 3 independent variables (X1, X2, and X3) has been illustrated in the response surface plot as depicted in Figure 1C. As per the polynomial equation and Figure 1C, a considerable impact of each independent variable on %EE (Y3) was observed. The gradual enhancement in the %EE was observed with the increase in lipid (X1) concentration. The increase in the lipid content provided more space for encapsulation of the drug into the lipid matrix [34]. Similarly, an increment in P-188 (X2) concentration gradually improves the %EE. The increment in the concentration of P-188 led to an increase in the tendency of the drug to be entrapped in the lipid matrix resulting in improved %EE. Furthermore, with an increase in ST (X3), %EE decreased significantly due to the reduction in PS.

3.1.4. Optimization by Point Prediction

The optimized LTN-CS-NLCs was selected on the criteria of small PS, PDI, and high EE among 15 compositions. Upon “trading off” different responses (Y1, Y2, and Y3) using numerical desirability function, the optimized formulation composition (LTN-CS-NLCs) prepared with lipid (X1; 3% w/v), P-188 (X2; 2% w/v), and ST (X3; 3 min) exhibited particle size of 123.84 ± 3.72 nm, PDI of 0.13 ± 0.01, and EE of 83.74 ± 4.68%, respectively. The software examined an analysis of variance (ANOVA) for all three responses (Y1, Y2, and Y3), and the obtained data indicated that the quadratic model was well fitted (Table 3). The selected formulation was further evaluated for drug release, permeation study, and cell line evaluation.

3.2. Characterization

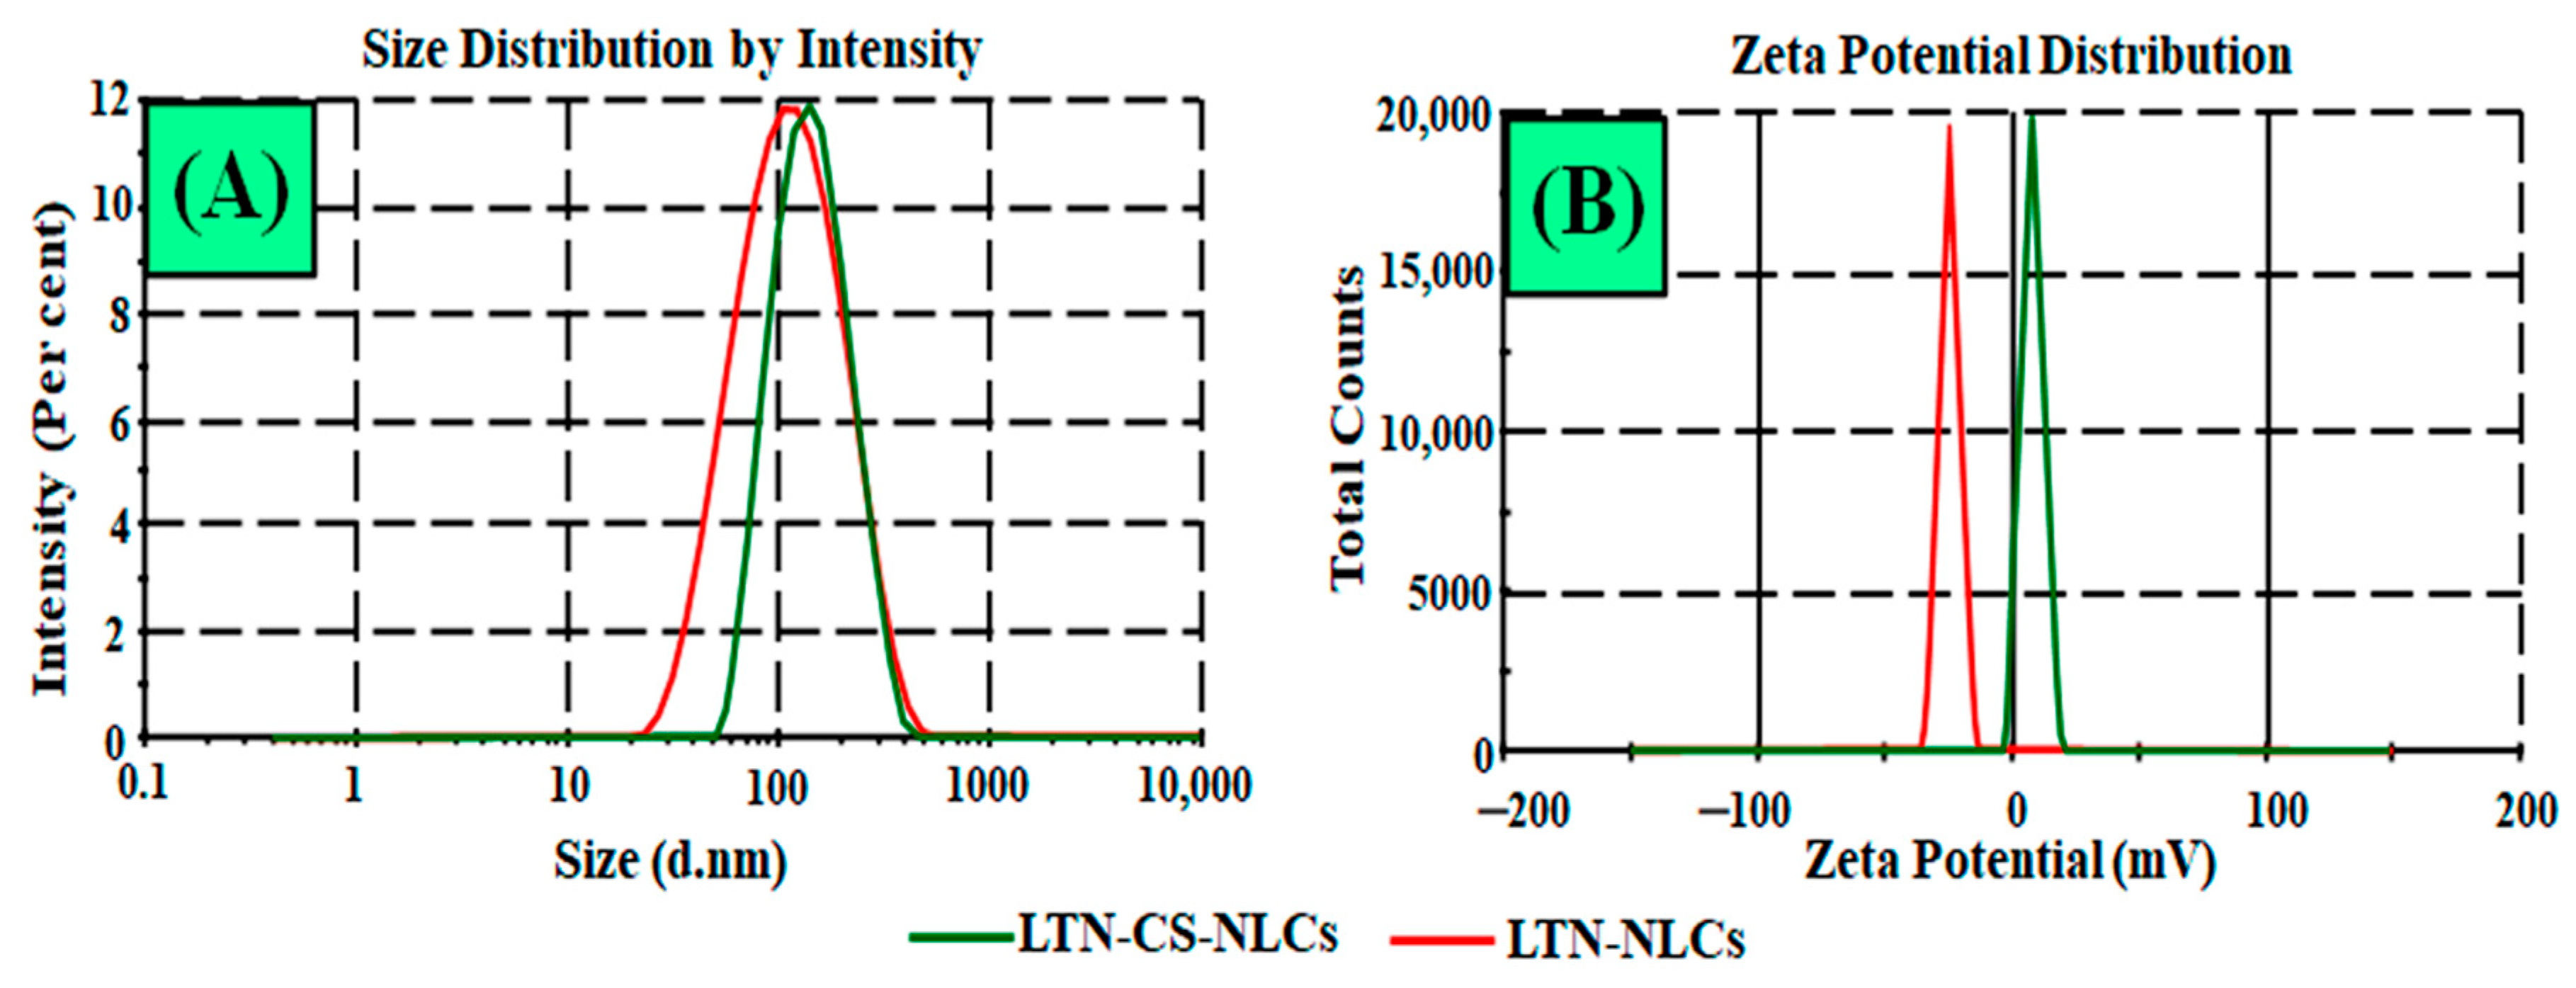
3.2.1. Particle Characterization

The PS, PDI, and ZP of the optimized LTN-CS-NLCs were observed to be 123.84 ± 3.72 nm, 0.13 ± 0.01, and +10.46 ± 1.84 mV, respectively (Figure 2A,B). While uncoated LTN-NLCs showed PS of 103.62 ± 5.76 nm, PDI of 0.11 ± 0.012, and ZP of −30.56 ± 4.32 mV, respectively. The small PS and PDI are one of the crucial properties for improved oral delivery. The low PDI value indicates a remarkable homogeneity of NPs. An insignificant increase in PS was noticed while developing LTN-CS-NLCs due to CS coating. Furthermore, CS coating leads to positive ZP from the negative ZP because of the cationic nature of CS (Figure 2B). The coating of NPs with CS is a well-established technique to improve the oral delivery of drugs [35].

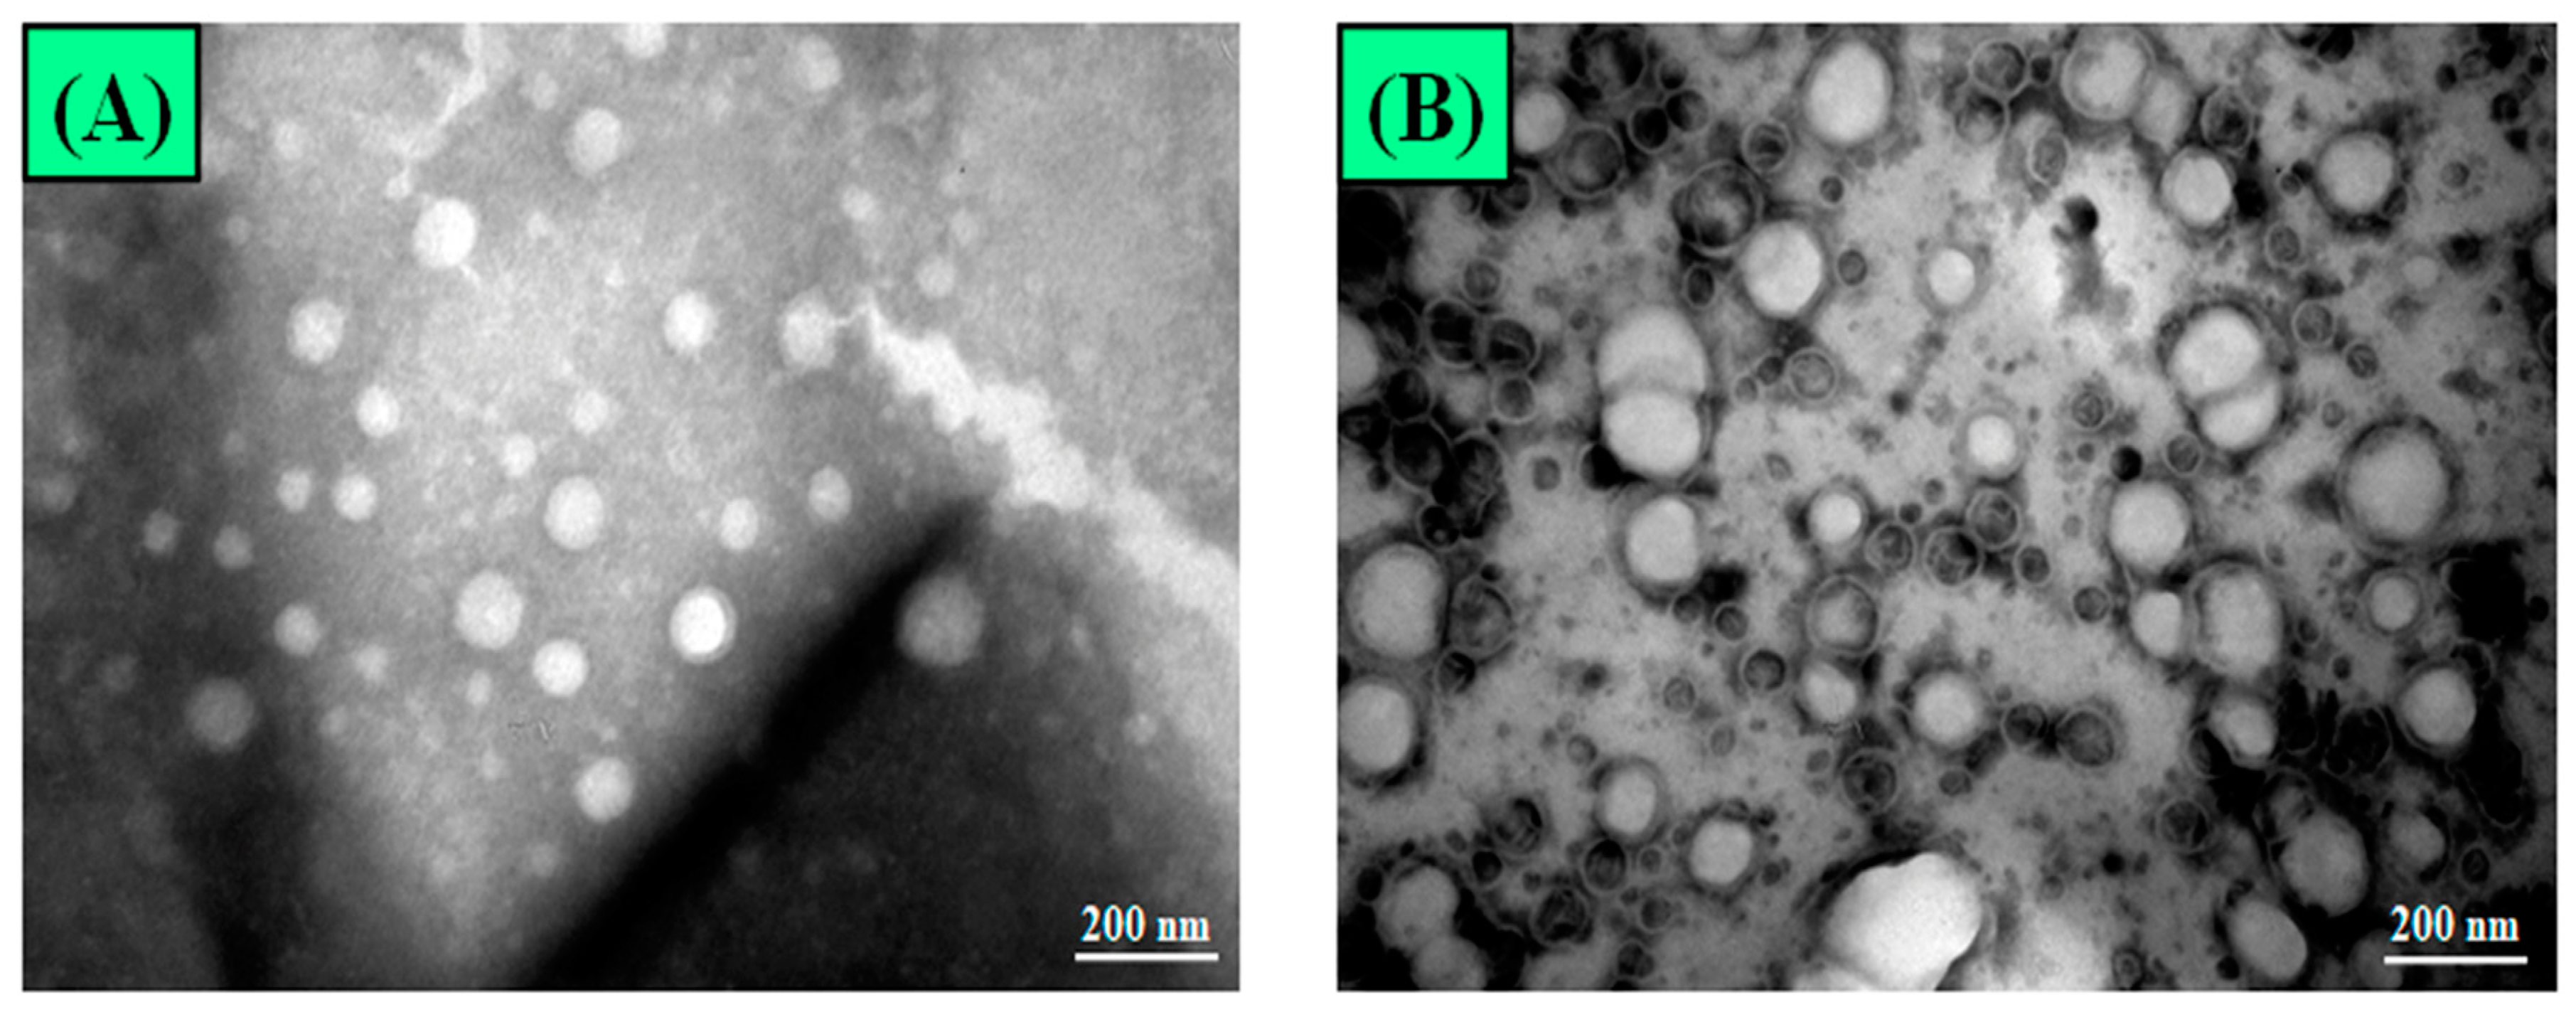
3.2.2. Surface Morphology

TEM also confirmed the surface morphology of LTN-CS-NLCs (Figure 3). The prepared delivery systems showed spherical shape particles with a smooth surface.

3.2.3. %EE and %DL

LTN-CS-NLCs showed significantly higher %EE and %DL compared to uncoated LTN-NLCs due to coating with CS. The optimized LTN-CS-NLCs and uncoated LTN-NLCs showed encapsulation efficiencies of 83.74 ± 4.68% and 75.58 ± 3.76%, respectively. Whereas, the %DL was found to be 11.48 ± 1.26% and 8.76 ± 0.94% for LTN-CS-NLCs and LTN-NLCs, respectively.

3.3. In Vitro Gastrointestinal Stability Study

The potential impact of SGF and SIF on the stability of LTN-CS-NLCs is depicted in Table 4 and Figure 4. Results of stability study of LTN-CS-NLCs in SIF demonstrated excellent stability with insignificant change in PS, PDI, and %EE. However, changes in PS, PDI, and %EE were observed in SGF after 12 h. In CS-NLCs, LTN could be continuously released or accumulated in the intestine region of gastrointestinal tract (GIT), which might lead to an increase in epithelial permeability, thereby promoting enhanced drug absorption [36].

3.4. LTN Release Study

The release profiles of LTN from different formulations are depicted in Figure 5. LTN-CS-NLCs and LTN-NLCs revealed a biphasic release behavior. A rapid release in 2 h was found, after that a sustained LTN release up to 24 h was observed. The rapid LTN release in the initial 2 h could be due to the faster dissolution of LTN adsorbed on the NLCs surface [37]. The sustained release was due to the encapsulated LTN in the inner core of the lipid matrix that was released slowly by diffusion. Furthermore, LTN-CS-NLCs showed a much-delayed LTN release in comparison to the uncoated LTN-NLCs due to the CS coating. It protects the drug from desorption and diffusion [38]. The mechanism of LTN release was analyzed by fitting the data into the different release kinetic models. The Korsmeyer–Peppas model showed the highest correlation coefficient (R2 = 0.9848). Therefore, the Korsmeyer–Peppas kinetic model was considered as the best-fitted model to explain the LTN release kinetics from LTN-CS-NLCs. Moreover, the exponent “n” of the release mechanism from the Korsmeyer–Peppas model was calculated, and the value was found to be 0.35, which stipulates Fickian diffusion mechanism from CS-NLCs.

3.5. Mucoadhesion Study

LTN-CS-NLCs revealed the higher mucoadhesive efficiency (70.46 ± 3.32%) compared to LTN-NLCs (22.58 ± 1.86%) and LTN suspension (14.67 ± 1.24%). The coating of NLCs with CS provided a significantly higher binding efficiency to mucin because of the electrostatic interactions between the positive charged CS and negatively charged mucin. Furthermore, hydrogen bonding as well as hydrophobic interactions between CS and mucin are also responsible for improved binding efficiency [39]. The higher mucoadhesive nature helps to achieve a longer residence time in GIT, therefore it will help to get the better therapeutic efficacy of the drug.

3.6. Antioxidant Activity

DPPH is utilized to assess the antioxidant potential of a variety of drugs and drug delivery systems [27]. The DPPH changes color when it reacts with proton donor groups. Figure 6 represents the comparative antioxidant activity of LTN-CS-NLCs, LTN-NLCs, and pure LTN suspensions. The antioxidant potential of all the samples is directly dependent upon the LTN concentration. As the concentration of LTN increases, the antioxidant potential of LTN-CS-NLCs, LTN-NLCs, and pure LTN also statistically increases. LTN-CS-NLCs showed a maximum activity of 94.38 ± 5.34%, while LTN-NLCs and pure LTN depicted 76.24 ± 4.94% and 66.28 ± 4.28%, respectively. As per the observation, LTN-CS-NLCs represented statistically (p < 0.05) elevated antioxidant activity in comparison to both uncoated LTN-NLCs and pure LTN at all the tested concentrations. However, uncoated LTN-NLCs also showed excellent antioxidant activity compared to pure LTN. The higher antioxidant activity achieved by LTN-CS-NLCs and LTN-NLCs was due to the higher solubility of LTN in lipid present in the NLCs.

3.7. Cytotoxicity Study

The potential outcomes of cytotoxicity study in MDA-MB-231 and MCF-7 cells are represented in Figure 7.
It clearly demonstrated that LTN-CS-NLCs and LTN-NLCs showed statistically higher concentration and time-dependent cytotoxicity compared to pure LTN at 48 h and 72 h of study. The IC50 value of LTN-CS-NLCs, LTN-NLCs, and pure LTN was found to be 35.66 ± 4.24 µM, 52.59 ± 5.47 µM, and 60.48 ± 5.83 µM, respectively, after 48 h of treatment against MCF-7 cells (Figure 7A). After 72 h of treatment, the IC50 value of LTN-CS-NLCs, LTN-NLCs, and pure LTN was found to be 20.65 ± 2.56 µM, 32.38 ± 3.72 µM, and 41.61 ± 4.58 µM, respectively (Figure 7B). The IC50 value of the LTN-CS-NLCs, LTN-NLCs, and pure LTN was found to be 11.48 ± 2.38 µM, 22.15 ± 3.96 µM, and 29.64 ± 3.84 µM respectively, after 48 h of treatment in MDA-MB-231 cells (Figure 7C). After 72 h of treatment, the IC50 value of LTN-CS-NLCs, LTN-NLCs, and pure LTN was found to be 7.12 ± 1.89 µM, 12.57 ± 3.12 µM, and 24.53 ± 4.64 µM, respectively (Figure 7D). As per the MTT assay study, a much better result was found in LTN-CS-NLCs treated cells. This can be explained by the fact that LTN-CS-NLCs revealed significantly higher delayed LTN release as compare to LTN-NLCs that produces excellent cellular response [40].

3.8. DAPI for Nuclear Staining

The toxic effect of LTN-CS-NLCs on MDA-MB-231 and MCF-7 cells was also examined by DAPI staining (Figure 8). DAPI is a nuclear stain that stains the unwound and damaged DNA in the nucleus. The exposure of cancer cells to LTN-NLCs and LTN-CS-NLCs resulted in significant changes in the morphology of the cell nucleus. It is clear from Figure 6 that the control cells stained negative with DAPI and the cells treated with LTN-NLCs and LTN-CS-NLCs emitted bright blue fluorescence which shows condensed and fragmented chromatin. In DAPI staining, the treated cells which are membrane-permeable selectively stain the nuclear material emitting fluorescence of apoptotic cells leaving the viable cells intact [41]. From the results obtained, it is can be concluded that LTN-CS-NLCs can serve as a potential candidate in the management of breast cancer.

3.9. Ex Vivo Intestinal Permeation Study

Figure 9A,B clearly revealed a significantly higher amount of LTN permeated and transported through the intestinal sac from optimized LTN-CS-NLCs and LTN-NLCs in comparison to LTN suspension. As per our findings, LTN-CS-NLCs exhibited about 1.5- and 4.3-fold higher P app compared to LTN-NLCs and LTN suspension. The reason for the enhancement in P app was due to the presence of nonionic surfactant (P-188) in the NLCs as an excipient, which is a potent P-glycoprotein efflux pump inhibitor that was present on the mucous membrane of GIT. Furthermore, the mucoadhesive nature of LTN-CS-NLCs is also led to the disruption in the tight junctions of the gastrointestinal mucosa. The positive charge of CS-NLCs interacts with negatively charged gastrointestinal mucosa that helps to the opening of tight junctions. Therefore, a significantly higher quantity of drug permeated across the mucosa.

4. Conclusions

In summary, LTN-CS-NLCs were prepared and optimized for improved LTN delivery and efficacy against breast cancer cells. The PS, PDI, and EE of the developed LTN-CS-NLCs were found to be satisfactory. LTN-CS-NLCs showed excellent gastrointestinal stability. TEM micrographs showed a spherical shape with a smooth surface. The CS coating provided modulation in LTN release from the NLCs and exhibited a sustained release profile for up to 24 h. There was significantly higher antioxidant activity found with LTN-CS-NLCs as compared to LTN-NLCs and pure LTN. LTN-CS-NLCs exhibited enhanced dose and time-dependent cytotoxicity in breast cancer cells compared to LTN-NLCs and pure LTN. Furthermore, LTN-CS-NLCs also depicted higher intestinal permeation compared to LTN-NLCs and pure LTN suspension. Therefore, our developed CS-NLCs of LTN represents excellent mucoadhesive nanoformulations to combat the challenges of LTN for improved delivery and therapeutic efficacy against breast cancer.

Author Contributions

Conceptualization, K.I.; M.R.; and S.S.I.; Project Administration, M.R.; Resources, S.J.G.; and M.M.A.R.; Supervision, S.J.G.; and M.M.A.R., Visualization, M.M.A.R.; Writing—original draft, M.R.; K.I.; and S.S.I.; Writing—review & editing, M.B.-J.; and S.A.; Funding acquisition, S.J.G. All authors have read and agreed to the published version of the manuscript.

Funding

This research was funded by the Deanship of Scientific Research at Princess Nourah bint Abdulrahman University, through the Fast-track Research Funding Program.

Institutional Review Board Statement

Not applicable.

Informed Consent Statement

Not applicable.

Data Availability Statement

Data is contained within the article.

Acknowledgments

This research was funded by the Deanship of Scientific Research at Princess Nourah bint Abdulrahman University, through the Fast-track Research Funding Program.

Conflicts of Interest

The authors declare no conflict of interest.

References

  1. Siegel, R.L.; Miller, K.D.; Jemal, A. Cancer statistics, 2018. CA Cancer J. Clin. 2018, 68, 7–30. [Google Scholar] [CrossRef] [PubMed]
  2. Khan, M.A.; Jain, V.K.; Rizwanullah, M.; Ahmad, J.; Jain, K. PI3K/AKT/mTOR pathway inhibitors in triple-negative breast cancer: A review on drug discovery and future challenges. Drug Discov. Today 2019, 24, 2181–2191. [Google Scholar] [CrossRef]
  3. Kamaruzman, N.I.; Aziz, N.A.; Poh, C.L.; Chowdhury, E.H. Oncogenic signaling in tumorigenesis and applications of siRNA nanotherapeutics in breast cancer. Cancers 2019, 11, 632. [Google Scholar] [CrossRef] [Green Version]
  4. Sharma, A.; Jain, N.; Sareen, R. Nanocarriers for diagnosis and targeting of breast cancer. Biomed Res. Int. 2013, 2013, 960821. [Google Scholar] [CrossRef] [PubMed]
  5. Rizwanullah, M.; Alam, M.; Mir, S.R.; Rizvi, M.M.A.; Amin, S. Polymer-lipid hybrid nanoparticles: A next-generation nanocarrier for targeted treatment of solid tumors. Curr. Pharm. Des. 2020, 26, 1206–1215. [Google Scholar] [CrossRef]
  6. Du, M.; Ouyang, Y.; Meng, F.; Ma, Q.; Liu, H.; Zhuang, Y.; Pang, M.; Cai, T.; Cai, Y. Nanotargeted agents: An emerging therapeutic strategy for breast cancer. Nanomedicine 2019, 14, 1771–1786. [Google Scholar] [CrossRef]
  7. Haider, N.; Fatima, S.; Taha, M.; Rizwanullah, M.; Firdous, J.; Ahmad, R.; Mazhar, F.; Khan, M.A. Nanomedicines in Diagnosis and Treatment of Cancer: An Update. Curr. Pharm. Des. 2020, 26, 1216–1231. [Google Scholar] [CrossRef] [PubMed]
  8. Adamczak, A.; Ożarowski, M.; Karpiński, T.M. Antibacterial activity of some flavonoids and organic acids widely distributed in plants. J. Clin. Med. 2020, 9, e109. [Google Scholar] [CrossRef] [Green Version]
  9. Manzoor, M.F.; Ahmad, N.; Ahmed, Z.; Siddique, R.; Zeng, X.A.; Rahaman, A.; Muhammad Aadil, R.; Wahab, A. Novel extraction techniques and pharmaceutical activities of luteolin and its derivatives. J. Food Biochem. 2019, 43, e12974. [Google Scholar]
  10. Lv, P.C.; Li, H.Q.; Xue, J.Y.; Shi, L.; Zhu, H.L. Synthesis and biological evaluation of novel luteolin derivatives as antibacterial agents. Eur. J. Med. Chem 2009, 44, 908–914. [Google Scholar] [CrossRef] [PubMed]
  11. Qian, W.; Liu, M.; Fu, Y.; Zhang, J.; Liu, W.; Li, J.; Li, X.; Li, Y.; Wang, T. Antimicrobial mechanism of luteolin against Staphylococcus aureus and Listeria monocytogenes and its antibiofilm properties. Microb. Pathog. 2020, 142, 104056. [Google Scholar] [CrossRef] [PubMed]
  12. Imran, M.; Rauf, A.; Abu-Izneid, T.; Nadeem, M.; Shariati, M.A.; Khan, I.A.; Imran, A.; Orhan, I.E.; Rizwan, M.; Atif, M.; et al. Luteolin, a flavonoid, as an anticancer agent: A review. Biomed. Pharmacother. 2019, 112, 108612. [Google Scholar] [CrossRef]
  13. Alshehri, S.; Imam, S.S.; Altamimi, M.A.; Hussain, A.; Shakeel, F.; Elzayat, E.; Mohsin, K.; Ibrahim, M.; Alanazi, F. Enhanced dissolution of luteolin by solid dispersion prepared by different methods: Physicochemical characterization and antioxidant activity. ACS Omega 2020, 5, 6461–6471. [Google Scholar] [CrossRef] [PubMed] [Green Version]
  14. Han, X.; Lu, Y.; Xie, J.; Zhang, E.; Zhu, H.; Du, H.; Wang, K.; Song, B.; Yang, C.; Shi, Y.; et al. Zwitterionic micelles efficiently deliver oral insulin without opening tight junctions. Nat Nanotechnol. 2020, 15, 605–614. [Google Scholar] [CrossRef] [PubMed]
  15. Tong, T.; Wang, L.; You, X.; Wu, J. Nano and microscale delivery platforms for enhanced oral peptide/protein bioavailability. Biomater. Sci. 2020, 8, 5804–5823. [Google Scholar] [CrossRef] [PubMed]
  16. Rizwanullah, M.; Amin, S.; Ahmad, J. Improved pharmacokinetics and antihyperlipidemic efficacy of rosuvastatin-loaded nanostructured lipid carriers. J. Drug Target. 2017, 25, 58–74. [Google Scholar]
  17. Eid, R.K.; Ashour, D.S.; Essa, E.A.; El Maghraby, G.M.; Arafa, M.F. Chitosan coated nanostructured lipid carriers for enhanced in vivo efficacy of albendazole against Trichinella spiralis. Carbohydr. Polym. 2020, 232, 115826. [Google Scholar] [CrossRef]
  18. Ling Tan, J.S.; Roberts, C.J.; Billa, N. Mucoadhesive chitosan-coated nanostructured lipid carriers for oral delivery of amphotericin B. Pharm. Dev. Technol. 2019, 24, 504–512. [Google Scholar] [CrossRef]
  19. Ling, J.T.S.; Roberts, C.J.; Billa, N. Antifungal and Mucoadhesive Properties of an Orally Administered Chitosan-Coated Amphotericin B Nanostructured Lipid Carrier (NLC). AAPS PharmSciTech. 2019, 20, 136. [Google Scholar] [CrossRef]
  20. Liu, M.; Zhong, X.; Yang, Z. Chitosan functionalized nanocochleates for enhanced oral absorption of cyclosporine A. Sci. Rep. 2017, 7, 41322. [Google Scholar] [CrossRef]
  21. Gartziandia, O.; Herran, E.; Pedraz, J.L.; Carro, E.; Igartua, M.; Hernandez, R.M. Chitosan coated nanostructured lipid carriers for brain delivery of proteins by intranasal administration. Colloids Surf. B Biointerfaces 2015, 134, 304–313. [Google Scholar] [CrossRef]
  22. Kaithwas, V.; Dora, C.P.; Kushwah, V.; Jain, S. Nanostructured lipid carriers of olmesartan medoxomil with enhanced oral bioavailability. Colloids Surf. B Biointerfaces 2017, 154, 10–20. [Google Scholar] [CrossRef]
  23. Dalmoro, A.; Bochicchio, S.; Nasibullin, S.F.; Bertoncin, P.; Lamberti, G.; Barba, A.A.; Moustafine, R.I. Polymer-lipid hybrid nanoparticles as enhanced indomethacin delivery systems. Eur. J. Pharm. Sci. 2018, 121, 16–28. [Google Scholar]
  24. Son, G.H.; Lee, B.J.; Cho, C.W. Mechanisms of drug release from advanced drug formulations such as polymeric-based drug-delivery systems and lipid nanoparticles. J. Pharm. Investig. 2017, 47, 287–296. [Google Scholar] [CrossRef]
  25. Khalifa, A.Z.M.; Rasool, B.K.A. Optimized Mucoadhesive Coated Niosomes as a Sustained Oral Delivery System of Famotidine. AAPS Pharm. Sci. Tech. 2017, 18, 3064–3075. [Google Scholar] [CrossRef] [PubMed]
  26. Fakhria, A.; Gilani, S.J.; Imam, S.S. Formulation of thymoquinone loaded chitosan nano vesicles: In-vitro evaluation and in-vivo anti-hyperlipidemic assessment. J. Drug Deliv. Sci. Tech. 2019, 50, 339–346. [Google Scholar] [CrossRef]
  27. Zarai, Z.; Boujelbene, E.; Ben Salem, N.; Gargouri, Y.; Sayari, A. Antioxidant and antimicrobial activities of various solvent extracts, piperine and piperic acid from Piper nigrum. LWT Food Sci. Technol. 2013, 50, 634–641. [Google Scholar] [CrossRef]
  28. Alshehri, S.; Imam, S.S.; Rizwanullah, M.; Fakhri, K.U.; Rizvi, M.; Alam, M.; Mahdi, W.; Kazi, M. Effect of Chitosan Coating on PLGA Nanoparticles for Oral Delivery of Thymoquinone: In Vitro, Ex Vivo, and Cancer Cell Line Assessments. Coatings 2021, 11, e6. [Google Scholar]
  29. Al-Joudi, F.S.; Alias, I.Z.; Samsudin, A.R. The effects of chemotherapeutic drugs on viabilty, apoptosis, and survivin expression in MCF-7 cells. Acta Histochem. Cytochem. 2005, 38, 323–330. [Google Scholar] [CrossRef] [Green Version]
  30. Dadashpour, M.; Firouzi-Amandi, A.; Pourhassan-Moghaddam, M.; Maleki, M.J.; Soozangar, N.; Jeddi, F.; Nouri, M.; Zarghami, N.; Pilehvar-Soltanahmadi, Y. Biomimetic synthesis of silver nanoparticles using Matricaria chamomilla extract and their potential anticancer activity against human lung cancer cells. Mater. Sci. Eng. C Mater. Biol. Appl. 2018, 92, 902–912. [Google Scholar] [CrossRef]
  31. Saifi, Z.; Rizwanullah, M.; Mir, S.R.; Amin, S. Bilosomes nanocarriers for improved oral bioavailability of acyclovir: A complete characterization through in vitro, ex-vivo and in vivo assessment. J. Drug Deliv. Sci. Tech. 2020, 57, 101634. [Google Scholar] [CrossRef]
  32. Rizwanullah, M.; Ahmad, J.; Amin, S. Nanostructured lipid carriers: A novel platform for chemotherapeutics. Curr. Drug Deliv. 2016, 13, 4–26. [Google Scholar] [CrossRef] [PubMed]
  33. Rahman, Z.; Zidan, A.S.; Khan, M.A. Non-destructive methods of characterization of risperidone solid lipid nanoparticles. Eur. J. Pharm. Biopharm. 2010, 76, 127–137. [Google Scholar] [CrossRef] [PubMed]
  34. Patil, T.S.; Deshpande, A.S. Design, development, and characterisation of clofazimine-loaded mannosylated nanostructured lipid carriers: 33-Box-Behnken design approach. Mater. Technol. 2020, 36, 1–16. [Google Scholar] [CrossRef]
  35. Fonte, P.; Nogueira, T.; Gehm, C.; Ferreira, D.; Sarmento, B. Chitosan-coated solid lipid nanoparticles enhance the oral absorption of insulin. Drug Deliv. Transl. Res. 2011, 1, 299–308. [Google Scholar] [CrossRef]
  36. Venishetty, V.K.; Chede, R.; Komuravelli, R.; Adepu, L.; Sistla, R.; Diwan, P.V. Design and evaluation of polymer coated carvedilol loaded solid lipid nanoparticles to improve the oral bioavailability: A novel strategy to avoid intraduodenal administration. Colloids Surf. B Biointerfaces 2012, 95, 1–9. [Google Scholar]
  37. Ramalingam, P.; Ko, Y.T. Improved oral delivery of resveratrol from N-trimethyl chitosan-g-palmitic acid surface-modified solid lipid nanoparticles. Colloids Surf. B Biointerfaces 2016, 139, 52–61. [Google Scholar] [CrossRef]
  38. Shi, L.L.; Lu, J.; Cao, Y.; Liu, J.Y.; Zhang, X.X.; Zhang, H.; Cui, J.H.; Cao, Q.R. Gastrointestinal stability, physicochemical characterization and oral bioavailability of chitosan or its derivative-modified solid lipid nanoparticles loading docetaxel. Drug. Dev. Ind. Pharm. 2017, 43, 839–846. [Google Scholar] [CrossRef]
  39. Sogias, I.A.; Williams, A.C.; Khutoryanskiy, V.V. Why is chitosan mucoadhesive? Biomacromolecules 2008, 9, 1837–1842. [Google Scholar]
  40. Kamel, K.M.; Khalil, I.A.; Rateb, M.E.; Elgendy, H.; Elhawary, S. Chitosan-coated cinnamon/oregano-loaded solid lipid nanoparticles to augment 5-fluorouracil cytotoxicity for colorectal cancer: Extract standardization, nanoparticle optimization, and cytotoxicity evaluation. J. Agric. Food Chem. 2017, 65, 7966–7981. [Google Scholar] [CrossRef]
  41. Suganya, K.S.U.; Govindaraju, K.; V. Ganesh Kumar, V.G.; Prabhu, D.; Arulvasu, C.; Dhas, T.S.; Karthick, V.; Changmai, N. Anti-proliferative effect of biogenic gold nanoparticles against breast cancer cell lines (MDA-MB-231 & MCF-7). Appl. Sur. Sci. 2016, 371, 415–424. [Google Scholar]
Figure 1. (A) Effect of independent variables lipid (X1), P-188 (X2), and sonication time (X3) on particle size (Y1). (B) Effect of independent variables lipid (X1), P-188 (X2), and sonication time (X3) on PDI (Y2). (C) Effect of independent variables lipid (X1), P-188 (X2), and sonication time (X3) on encapsulation efficiency (Y3).
Coatings 11 00158 g001aCoatings 11 00158 g001b
Figure 2. Particle characterization of LTN-CS-NLCs and LTN-NLCs (A) size and (B) zeta potential.
Coatings 11 00158 g002
Figure 3. Particle surface morphology of (A) LTN-CS-NLCs and (B) LTN-NLCs.
Coatings 11 00158 g003
Figure 4. Images showing the gastrointestinal stability of LTN-CS-NLCs gastrointestinal fluids. Particle size distribution of LTN-CS-NLCs in (A) SIF (pH 6.8) and (B) SGF (pH 1.2) at different time points. TEM micrographs of LTN-CS-NLCs in (C) SIF (pH 6.8) and (D) SGF (pH 1.2) after 12 h.
Coatings 11 00158 g004
Figure 5. Release profiles of LTN-CS-NLCs, LTN-NLCs, and LTN suspension.
Coatings 11 00158 g005
Figure 6. Comparative antioxidant activity of LTN-CS-NLCs, LTN-NLCs, and pure LTN. Results are expressed as percentage mean ± SD (n = 3). (ns- not significant, * represents p < 0.05 and ** represents p < 0.01).
Coatings 11 00158 g006
Figure 7. Comparative cytotoxicity study of LTN-CS-NLCs, LTN-NLCs, and pure LTN against (A) MDA-MB-231 cells after 24 h; (B) MDA-MB-231 cells after 48 h; (C) MCF-7 cells after 24 h; (D) MCF-7 cells after 48 h. Results are expressed as percentage mean ± SD (n = 3). (ns- not significant, * represents p < 0.05 and ** represents p < 0.01).
Coatings 11 00158 g007
Figure 8. Image showing DAPI staining of control, LTN-NLCs, and LTN-CS-NLCs treated MCF-7 cells, and MDA-MB-231 cells (Magnification 10×).
Coatings 11 00158 g008
Figure 9. Ex vivo intestinal permeation profile of LTN-CS-NLCs, LTN-NLCs, and pure LTN suspension: (A) cumulative amount of drug permeated (µg) vs. time, (B) cumulative drug transported (µg cm−2) vs. time.
Coatings 11 00158 g009
Table 1. Various independent and dependent variables used in the Box–Behnken design for the preparation of chitosan coated luteolin nanostructured lipid carriers (LTN-CS-NLCs).
FactorsLevels Used, Actual (Coded Factor)
Independent variablesLow (−1)Medium (0)High (+1)
X1 = Concentration of lipid (%)234
X2 = Concentration of P-188 (%)11.52
X3 = Sonication time (min)345
Dependent VariablesGoal
Y1 = Particle size (PS; nm)Minimize
Y2 = Polydispersity index (PDI)Minimize
Y3 = Entrapment efficiency (EE; %)Maximize
Table 2. Observed Box–Behnken experimental runs of LTN-NLCs with their actual and predicted experimental value.
RunsIndependent VariablesDependent Variables
X1X2X3Y1Y2Y3
ActualPredictedActualPredictedActualPredicted
F131.54126.84125.720.1310.13283.4682.36
F2224113.43114.440.1150.11674.4573.57
F3414154.73153.730.1780.17787.9688.84
F431.54124.42125.720.1310.13282.6481.36
F5313148.16149.860.1500.15183.6881.85
F621.53129.14128.080.1510.14973.7772.50
F7214117.46116.820.1310.13268.4869.59
F841.53158.04157.350.1710.17295.3796.19
F9424145.75146.390.1630.16194.2995.19
F1031.54122.48125.720.1320.13284.1282.36
F11315132.35132.290.1580.15672.9672.11
F1241.55140.47141.530.2010.20282.3681.63
F13325125.72124.020.1430.14279.8878.71
F1421.55101.25101.940.1340.13365.5564.59
F15323148.35148.410.1310.13289.1390.28
X1 = concentration of lipid (%); X2 = concentration of P-188 (%); X3 = sonication time (min); Y1 = particle size (nm); Y2 = polydispersity index; Y3 = entrapment efficiency (%).
Table 3. Summary of regression analysis for fitting data to different models.
ModelR2Adjusted R2Predicted R2SDR2Adjusted R2Predicted R2SDR2Adjusted R2Predicted R2SD
ResponseParticle Size (Y1)PDI (Y2)Encapsulation Efficiency (Y3)
Linear0.90540.87960.83845.60.66440.57290.38860.0140.97640.96990.95461.52
2F10.91760.85580.73366.10.74140.54740.07360.0150.98230.96900.92731.54
Quadratic0.99680.99090.94811.50.99790.99410.96630.0020.99970.99920.99550.24
R2 = coefficient of correlation; SD = standard deviation.
Table 4. Gastrointestinal stability of LTN-CS-NLCs in simulated intestinal fluid (SIF) (pH 6.8) and simulated gastric fluid (SGF) (pH 1.2). (Mean ± SD, n = 3).
Time (h)Simulated Intestinal Fluids
(SIF; pH 6.8)
Simulated Gastric Fluids
(SGF; pH 1.2)
PS (nm)PDI%EEPS (nm)PDI%EE
0123.84 ± 3.720.132 ± 0.0283.74 ± 4.68123.84 ± 3.720.132 ± 0.0283.74 ± 4.68
2125.21 ± 4.540.135 ± 0.0282.98 ± 5.14129.97 ± 4.540.137 ± 0.0381.91 ± 6.14
4126.46 ± 5.820.139 ± 0.0282.72 ± 5.36136.78 ± 4.820.141 ± 0.0380.17 ± 4.98
8128.25 ± 5.280.144 ± 0.0382.57 ± 6.35142.54 ± 5.280.154 ± 0.0477.15 ± 5.46
12131.38 ± 6.460.151 ± 0.0381.91 ± 5.77148.04 ± 5.860.182 ± 0.0573.74 ± 5.76
Publisher’s Note: MDPI stays neutral with regard to jurisdictional claims in published maps and institutional affiliations.

