Article

Effect of Pressure on the Film Deposition during RF Magnetron Sputtering Considering Charged Nanoparticles

Department of Materials Science and Engineering, College of Engineering at Seoul National University, 1 Gwanak-ro, Gwanak-gu, Seoul 08826, Korea
*
Author to whom correspondence should be addressed.
Coatings 2021, 11(2), 132; https://doi.org/10.3390/coatings11020132
Submission received: 27 November 2020 / Revised: 9 January 2021 / Accepted: 13 January 2021 / Published: 26 January 2021
(This article belongs to the Section Thin Films)

Abstract

:
Non-classical crystallization, in which charged nanoparticles (NPs) are the building blocks of film growth, has been extensively studied in chemical vapor deposition (CVD). Recently, a similar mechanism of film growth has been reported during radio frequency (RF) sputtering with a Ti target and DC magnetron sputtering using an Ag target. In this study, the effect of pressure on the generation of Ti NPs and on the film deposition was studied during RF sputtering with a Ti target. Ti NPs were captured on transmission electron microscopy (TEM) membranes with the electric biases of −30, 0, and +50 V under 20 and 80 mTorr. The number densities of the Ti NPs were 134, 103, and 21 per 100 × 100 nm2, respectively, with the biases of −30, 0, and +50 V under 20 mTorr and were 196, 98, and 0 per 100 × 100 nm2, respectively, with the biases of −30, 0, and +50 V under 80 mTorr, which was analyzed by TEM. The growth rate of Ti films deposited on Si substrates was insensitive to the substrate bias under 20 mTorr but was sensitive under 80 mTorr, with the thicknesses of 132, 133, 97, and 29 nm, respectively, after being deposited for 15 min with the substrate biases of −30, −10, 0, and +50 V. This sensitive dependence of the film growth rate on the substrate bias under 80 mTorr is in agreement with the sensitive dependence of the number density of Ti NPs on the substrate bias under 80 mTorr.

1. Introduction

Ti thin films have good biocompatibility and are widely used in biomedical applications [1,2,3]. Additionally, they have outstanding thermal and chemical stability [4] and are widely used in microelectronics [5,6]. Ti thin films are prepared by direct current (DC) sputtering [7,8,9,10,11], radio frequency (RF) sputtering [12], and high-power impulse magnetron sputtering (HiPIMS) [13,14,15] because of their high reproducibility and growth rate.
Meanwhile, according to classical crystallization, the deposition of thin films has been believed to occur by an individual atom, ion, or molecule. However, there are some phenomena that cannot be explained by the classical crystallization. Such phenomena can be successfully explained by a new growth mechanism in which thin films grow by a building block of nanoparticles (NPs). This new growth mechanism was supported by many experimental evidences. This new mechanism is referred to as “non-classical crystallization” [16,17,18,19,20,21,22,23].
Hwang et al. [23] have extensively studied the nonclassical crystallization of thin films and nanostructures in the chemical vapor deposition (CVD) process. They reported many experimental results showing that electrically charged NPs are spontaneously generated in the gas phase in many conventional CVD processes. Most importantly, these charged NPs become a building block of thin films and nanostructures. Hwang et al. emphasized that the charge carried by the NPs played a critical role in the deposition of thin films [24,25,26] and nanostructures [27]. They suggested that neutral NPs undergo random Brownian coagulation and produce a porous structure, whereas charged NPs self-assemble and undergo epitaxial recrystallization, consequently producing a dense and crystalline structure [23]. The epitaxial recrystallization indicates that charged NPs undergo liquid-like coalescence, which implies that the bond strength of the NPs should be weakened by the charge carried by the NPs. According to the ab initio calculation of Clare et al. [28], positive or negative charge in silane (SiH4) and disilane (Si2H6) molecules significantly weakens the bond strength of Si–H and Si–Si. This new film growth mechanism is called the “theory of charged NPs” (TCN), which turns out to be applicable to many CVD systems. For instance, a negative substrate bias favored the growth of a homoepitaxial SiC film on a SiC substrate during hot wire CVD [29]. Additionally, a negative substrate bias favored the growth of a fully epitaxial Si film on a Si substrate at a substrate temperature of 550 °C during radio frequency plasma-enhanced CVD [30].
Until now, the generation of charged NPs and their contribution to film growth have been studied mainly in CVD systems. Recently, the generation of negatively charged NPs and their contribution to film growth were studied during DC sputtering of Ag [31]. Only one paper was published on the generation of positively charged NPs and their contribution to film growth during RF sputtering of Ti [32]. Thus, a more systematic study is needed concerning how the generation of charged NPs is affected by processing parameters such as pressure in the sputtering process.
The purpose of this study is to confirm how the generation of charged NPs depends on pressure and affects the film deposition during RF sputtering using a Ti target. To identify the polarity of charged NPs, the electric bias was applied to amorphous carbon membranes on the transmission electron microscopy (TEM) grid. The effect of charged NPs on the film deposition was also studied by applying the electric bias to the p-type Si (100) substrate. The growth rate of the films was determined by the cross-section image of field-emission scanning electron microscopy (FESEM) and the crystallinity and orientation of the films were analyzed by X-ray diffraction (XRD).

2. Materials and Methods

Figure 1a is a schematic of the RF sputtering system used in this study. A 4-inch Ti target was used and the distance from the target to sample stage was 7 cm. An amorphous carbon TEM membrane (Ted Pella, Inc., Redding, CA, USA) was used as a substrate for capturing NPs and a p-type silicon (100) wafer was used as a substrate for film deposition. The substrate was placed on an insulating polymer sheet for electrical isolation from the sample stage which is grounded. A DC bias device was connected to the substrate to apply the electric bias. In order for the electrical potential of the substrate not to interact with the plasma, a grounded mesh, which is shown in Figure 1b, was installed 1–2 mm above the substrate. This grounded mesh had a hole size less than the Debye length of the plasma [33]. Thus, the same plasma condition could be maintained regardless of the electrical potential of the substrate. In order to capture NPs on a carbon TEM membrane, a round-shaped shutter with diameter of 5 cm was installed above the grounded mesh as shown in Figure 1a. For capturing NPs, the TEM membrane was exposed to plasma for a few seconds. The exposure time was controlled by the shutter.
Prior to the experiment, the sputtering chamber was evacuated to be less than 1 × 10⁻⁶ Torr. For sputtering, RF power was kept at 160 W and Ar gas was used for plasma generation. Pressure was varied from 20 to 80 mTorr. The parameters chosen in this study are those commonly used in the RF sputtering process [34,35,36]. Since the number density of captured Ti NPs under 80 mTorr was smaller than that under 20 mTorr, the exposure time under 80 mTorr was 8 s and that under 20 mTorr was 5 s to control the number density of NPs appropriate for TEM observation.
To confirm whether the Ti NPs were charged or not, the number density of captured Ti NPs was examined at various electric biases of −30, 0, and +50 V applied to the TEM membrane. Additionally, to confirm how the pressure affects the ratio of charged to neutral Ti NPs as well as the deposition behavior of Ti films, the pressure was varied at 20, 40, 60, and 80 mTorr and the electrical bias applied to the Si substrates was varied at −30, −10, 0, and +50 V with the other conditions being the same as those for capturing Ti NPs.
Ti NPs captured on the TEM membrane were analyzed by TEM (FEI, Tecnai F20, Hillsboro, OR, USA). Additionally, we investigated the microstructure of the films by FESEM (Carl Zeiss, SUPRA, Oberkochen, Germany). The accelerating voltages of TEM and FESEM were 200 and 2 kV, respectively. The crystallinity and orientation of the films were analyzed by XRD (PANalytical, X’pert-Pro, Almelo, The Netherlands) at 2-theta ranges of 20°–60° using Cu-Kα wavelength of 0.154 nm.

3. Results and Discussion

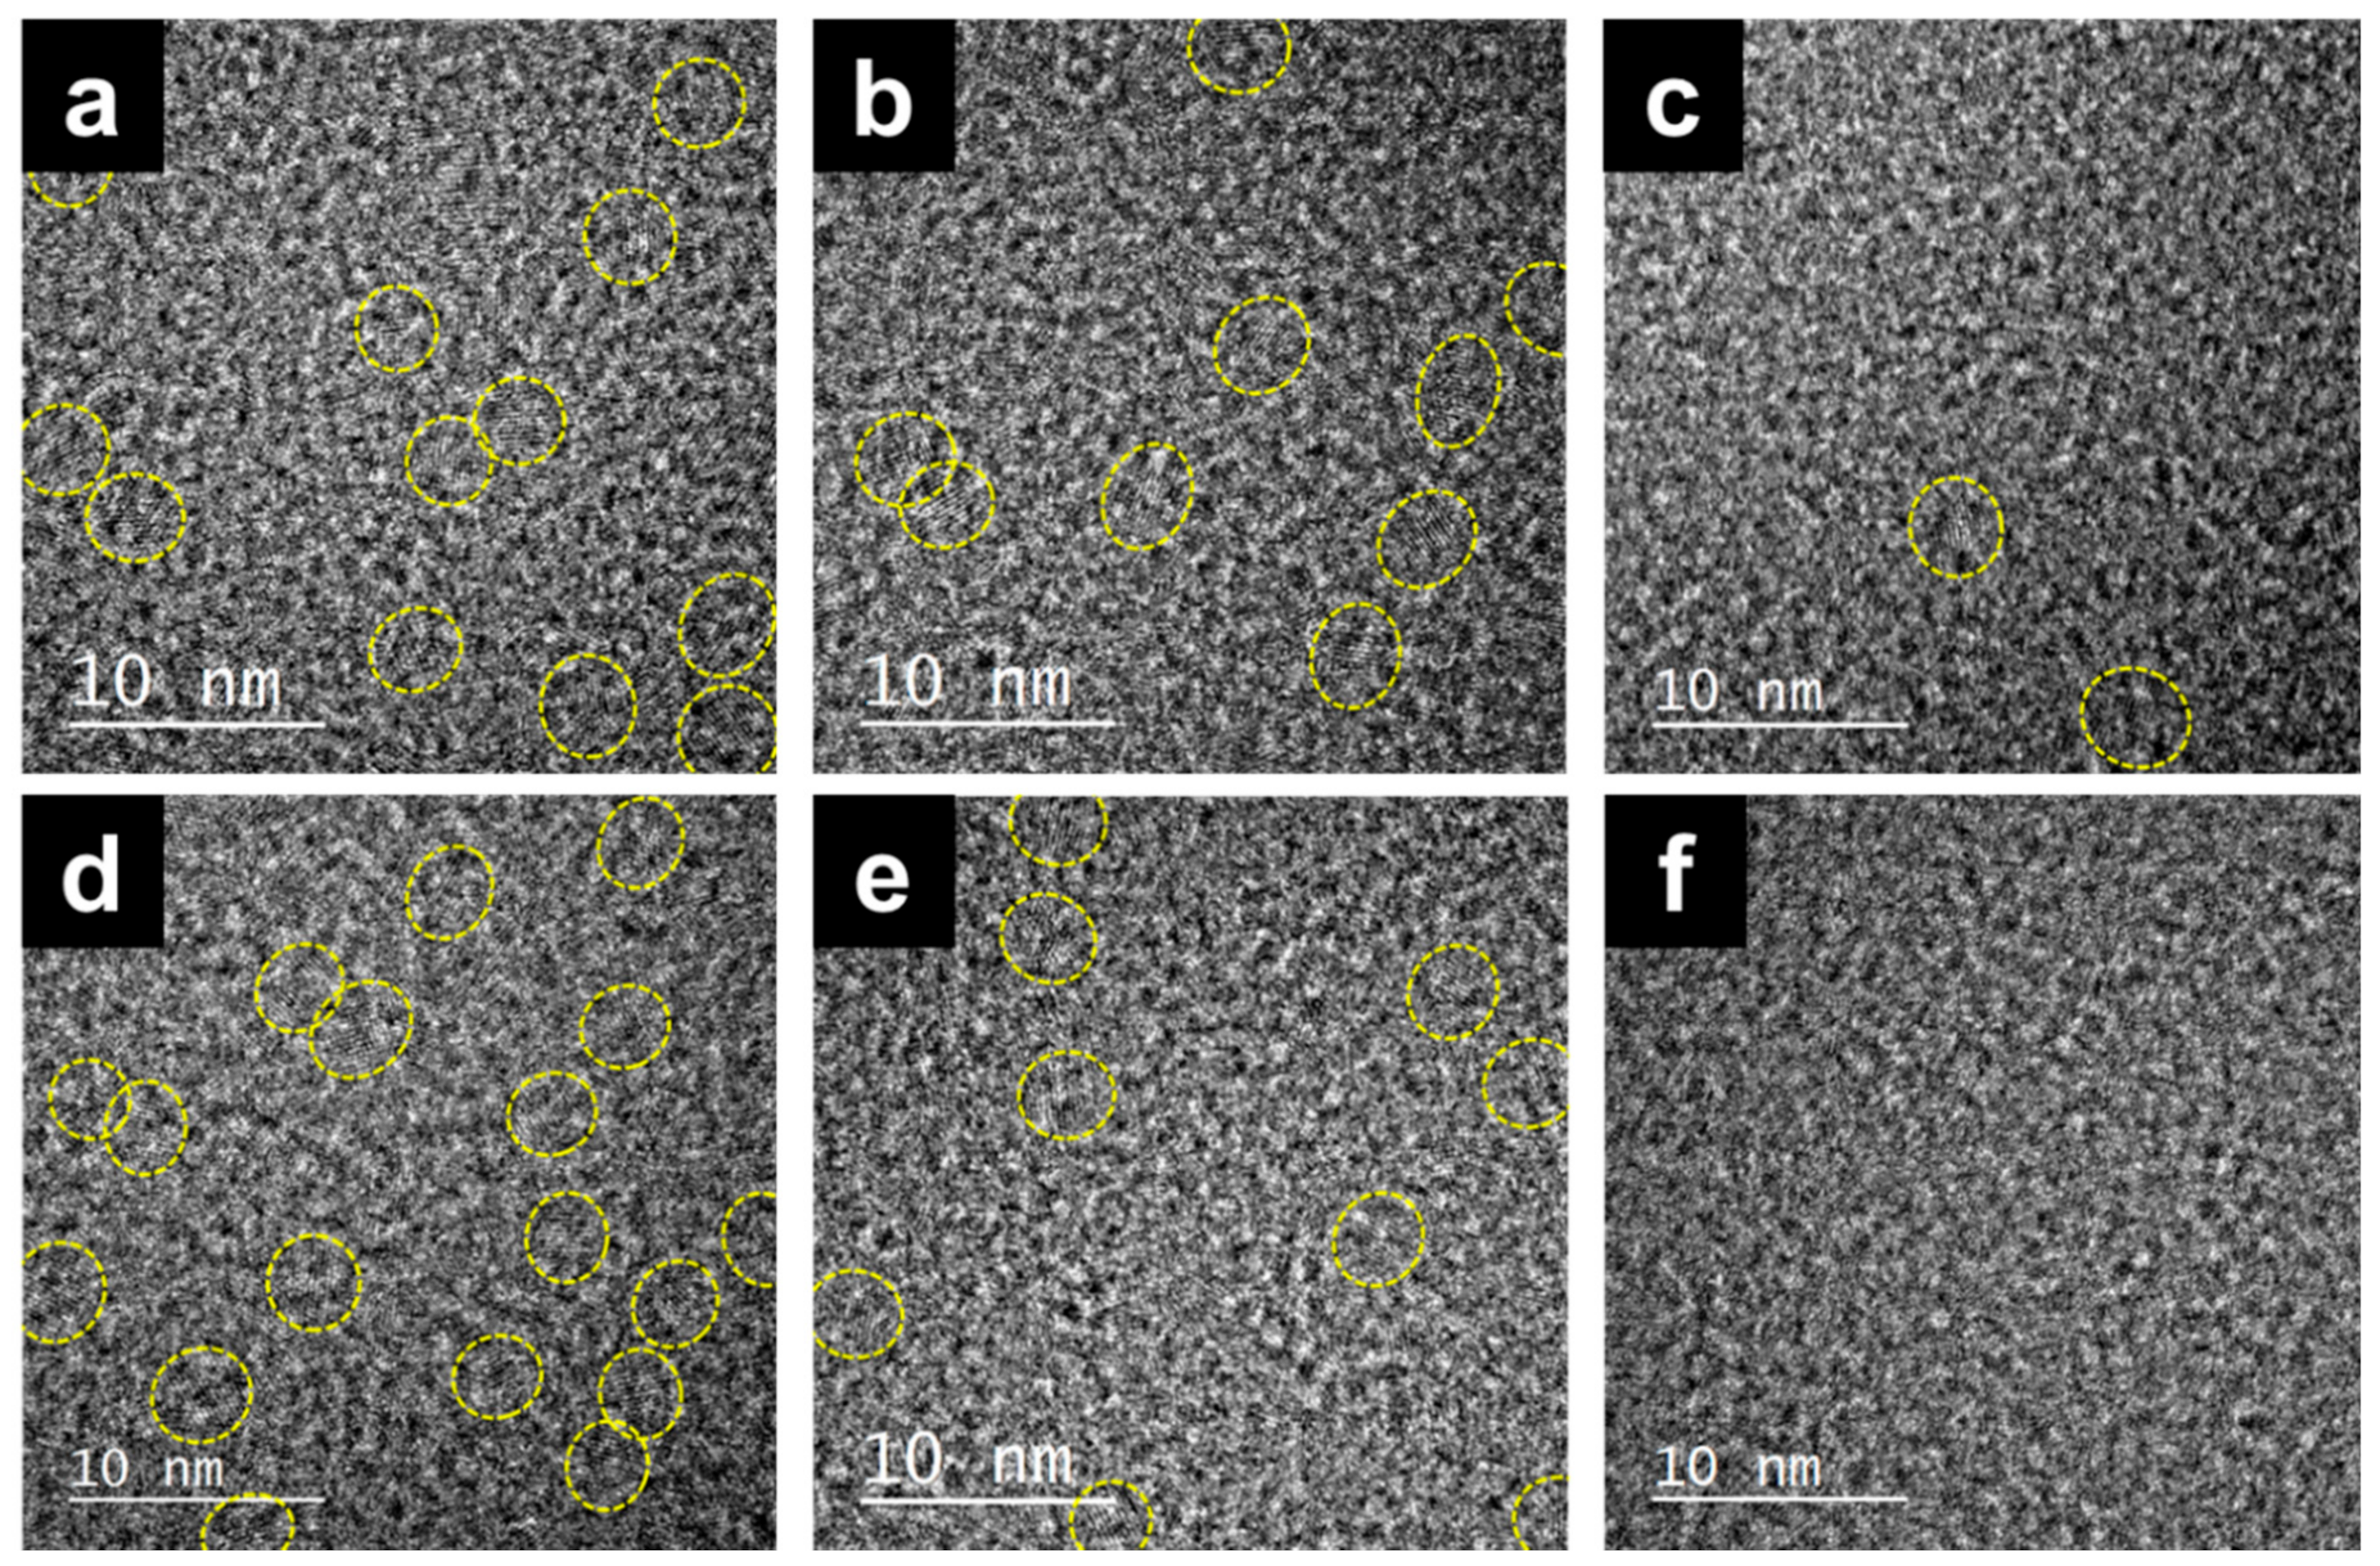
3.1. Capturing Charged NPs with Various Pressure during RF Sputtering with a Ti Target

To capture and observe charged Ti NPs, a TEM membrane was used as a substrate. Figure 2 presents high-resolution TEM (HRTEM) images showing Ti NPs captured on the amorphous carbon membrane without the substrate bias. Ti NPs in Figure 2a,b were captured, respectively, for 5 s under 20 mTorr and for 8 s under 80 mTorr. Crystalline Ti NPs in Figure 2 are enclosed by dashed ovals to distinguish them from the other area. Crystalline Ti NPs enclosed by dashed ovals were identified by crystalline peaks in the fast Fourier transformation (FFT) image shown in the inset of Figure 2.
The majority of the NPs in Figure 2 had an average size of ~3 nm. The d-spacing values of the NPs determined by the FFT image are mainly 0.212 and 0.216 nm, respectively, for 20 and 80 mTorr, both of which correspond to the d-spacing values of titanium carbide (TiC). This result indicates that Ti NPs became carbonized. In relation to the possible cause of carbonization, our previous experiments showed that Ti NPs captured on the SiO and SiN membranes were also carbonized during TEM observation. Therefore, Ti NPs in Figure 2 seemed to be carbonized by carbon contaminants in the TEM chamber when exposed to electron beams.
When electric bias was applied to the substrate, an electric field would be generated between the substrate and the grounded mesh. This electric field would interact with Ti NPs, if charged, which passed through the grounded mesh toward the membrane. Figure 3 shows HRTEM images of NPs captured under 20 and 80 mTorr at various substrate biases of −30, 0, and +50 V. It should be noted that to compare the number density of Ti NPs between electrical biases of −30, 0, and +50 V, Figure 3 has a lower magnification than Figure 2. Each crystalline Ti NP was marked by dashed ovals in Figure 3.
In Figure 3, the number density of NPs is higher at the negative bias of −30 V than that at 0 V under both pressures. In contrast, it is lower at the positive bias of +50 V than that at 0 V under both pressures. These results indicate that some of the Ti NPs are positively charged. The positively charged NPs would be attracted to the substrate with the bias of −30 V, increasing the number density of Ti NPs captured on the TEM membrane (Figure 3a,d). At the same time, they will be repelled by the substrate with the bias of +50 V, decreasing the number density of Ti NPs captured on the TEM membrane (Figure 3c,f). In agreement with these results, Kwon et al. reported that the positively charged Ti NPs were generated during Ti RF sputtering [32]. The strong dependence of the number density of Ti NPs on the electrical bias in Figure 3 indicates not only that some of the Ti NPs are electrically charged but also that they were formed in the gas phase instead of being nucleated on the TEM membrane. Their formation in the gas phase was further supported by the fact that most NPs in Figure 3 had the similar size of ~3 nm regardless of the substrate bias. If NPs are nucleated on the TEM membrane, they should have a size distribution instead of the similar size of ~3 nm.
As shown in Figure 3, the dependence of the number density on the substrate bias is greater under 80 mTorr than under 20 mTorr. When counted from HRTEM images, the number density under 20 mTorr at the substrate biases of −30, 0, and +50 V was 134, 103, and 21 per 100 × 100 nm2, respectively, whereas those under 80 mTorr at the substrate biases of −30, 0, and +50 V were 196, 98, and 0 per 100 × 100 nm2, respectively. No Ti NP was observed in Figure 3f at the bias of +50 V. In the other area also, NPs were hardly observed under 80 mTorr at the substrate biases of +50 V.
It should be noted that no observation of crystalline Ti NPs in Figure 3f does not mean the absence of Ti NPs. If neutral Ti NPs exist, they would not be affected by the electric bias and could land on the TEM membrane regardless of the electric bias. Thus, there could be neutral Ti NPs that had too small a size to be detected by TEM. If the small neutral Ti NPs exist, it is difficult to estimate their contribution to film deposition in comparison with the contribution of neutral atoms to film deposition. One possible way to determine which of the small neutral NPs and atoms is a dominant flux for film deposition would be studying the crystallinity of the film deposited under the positive bias. A similar study was conducted by Kwon et al. [32]. The results will be shown later.
The ratios of the number density for biases of −30 and 0 V were 1.30 (Figure 3a,b) and 2.02 (Figure 3d,e), respectively, under 20 and 80 mTorr. The larger ratio under 80 mTorr indicates that the percentage of positively charged Ti NPs is higher under 80 mTorr than under 20 mTorr. One reason might be that the collision frequency of NPs with Ar+ ions or other positively charged species in the plasma would be higher under 80 mTorr because the mean free path under 80 mTorr is shorter than that under 20 mTorr.
As Figure 3 indicates that the percentage of positively charged NPs is higher under 80 mTorr than under 20 mTorr, the bias effect on the film growth rate would be more pronounced with increasing pressure. To check this possibility, Ti films were deposited on a Si substrate at substrate biases of −30, −10, 0, and +50 V under 20, 40, 60, and 80 mTorr.

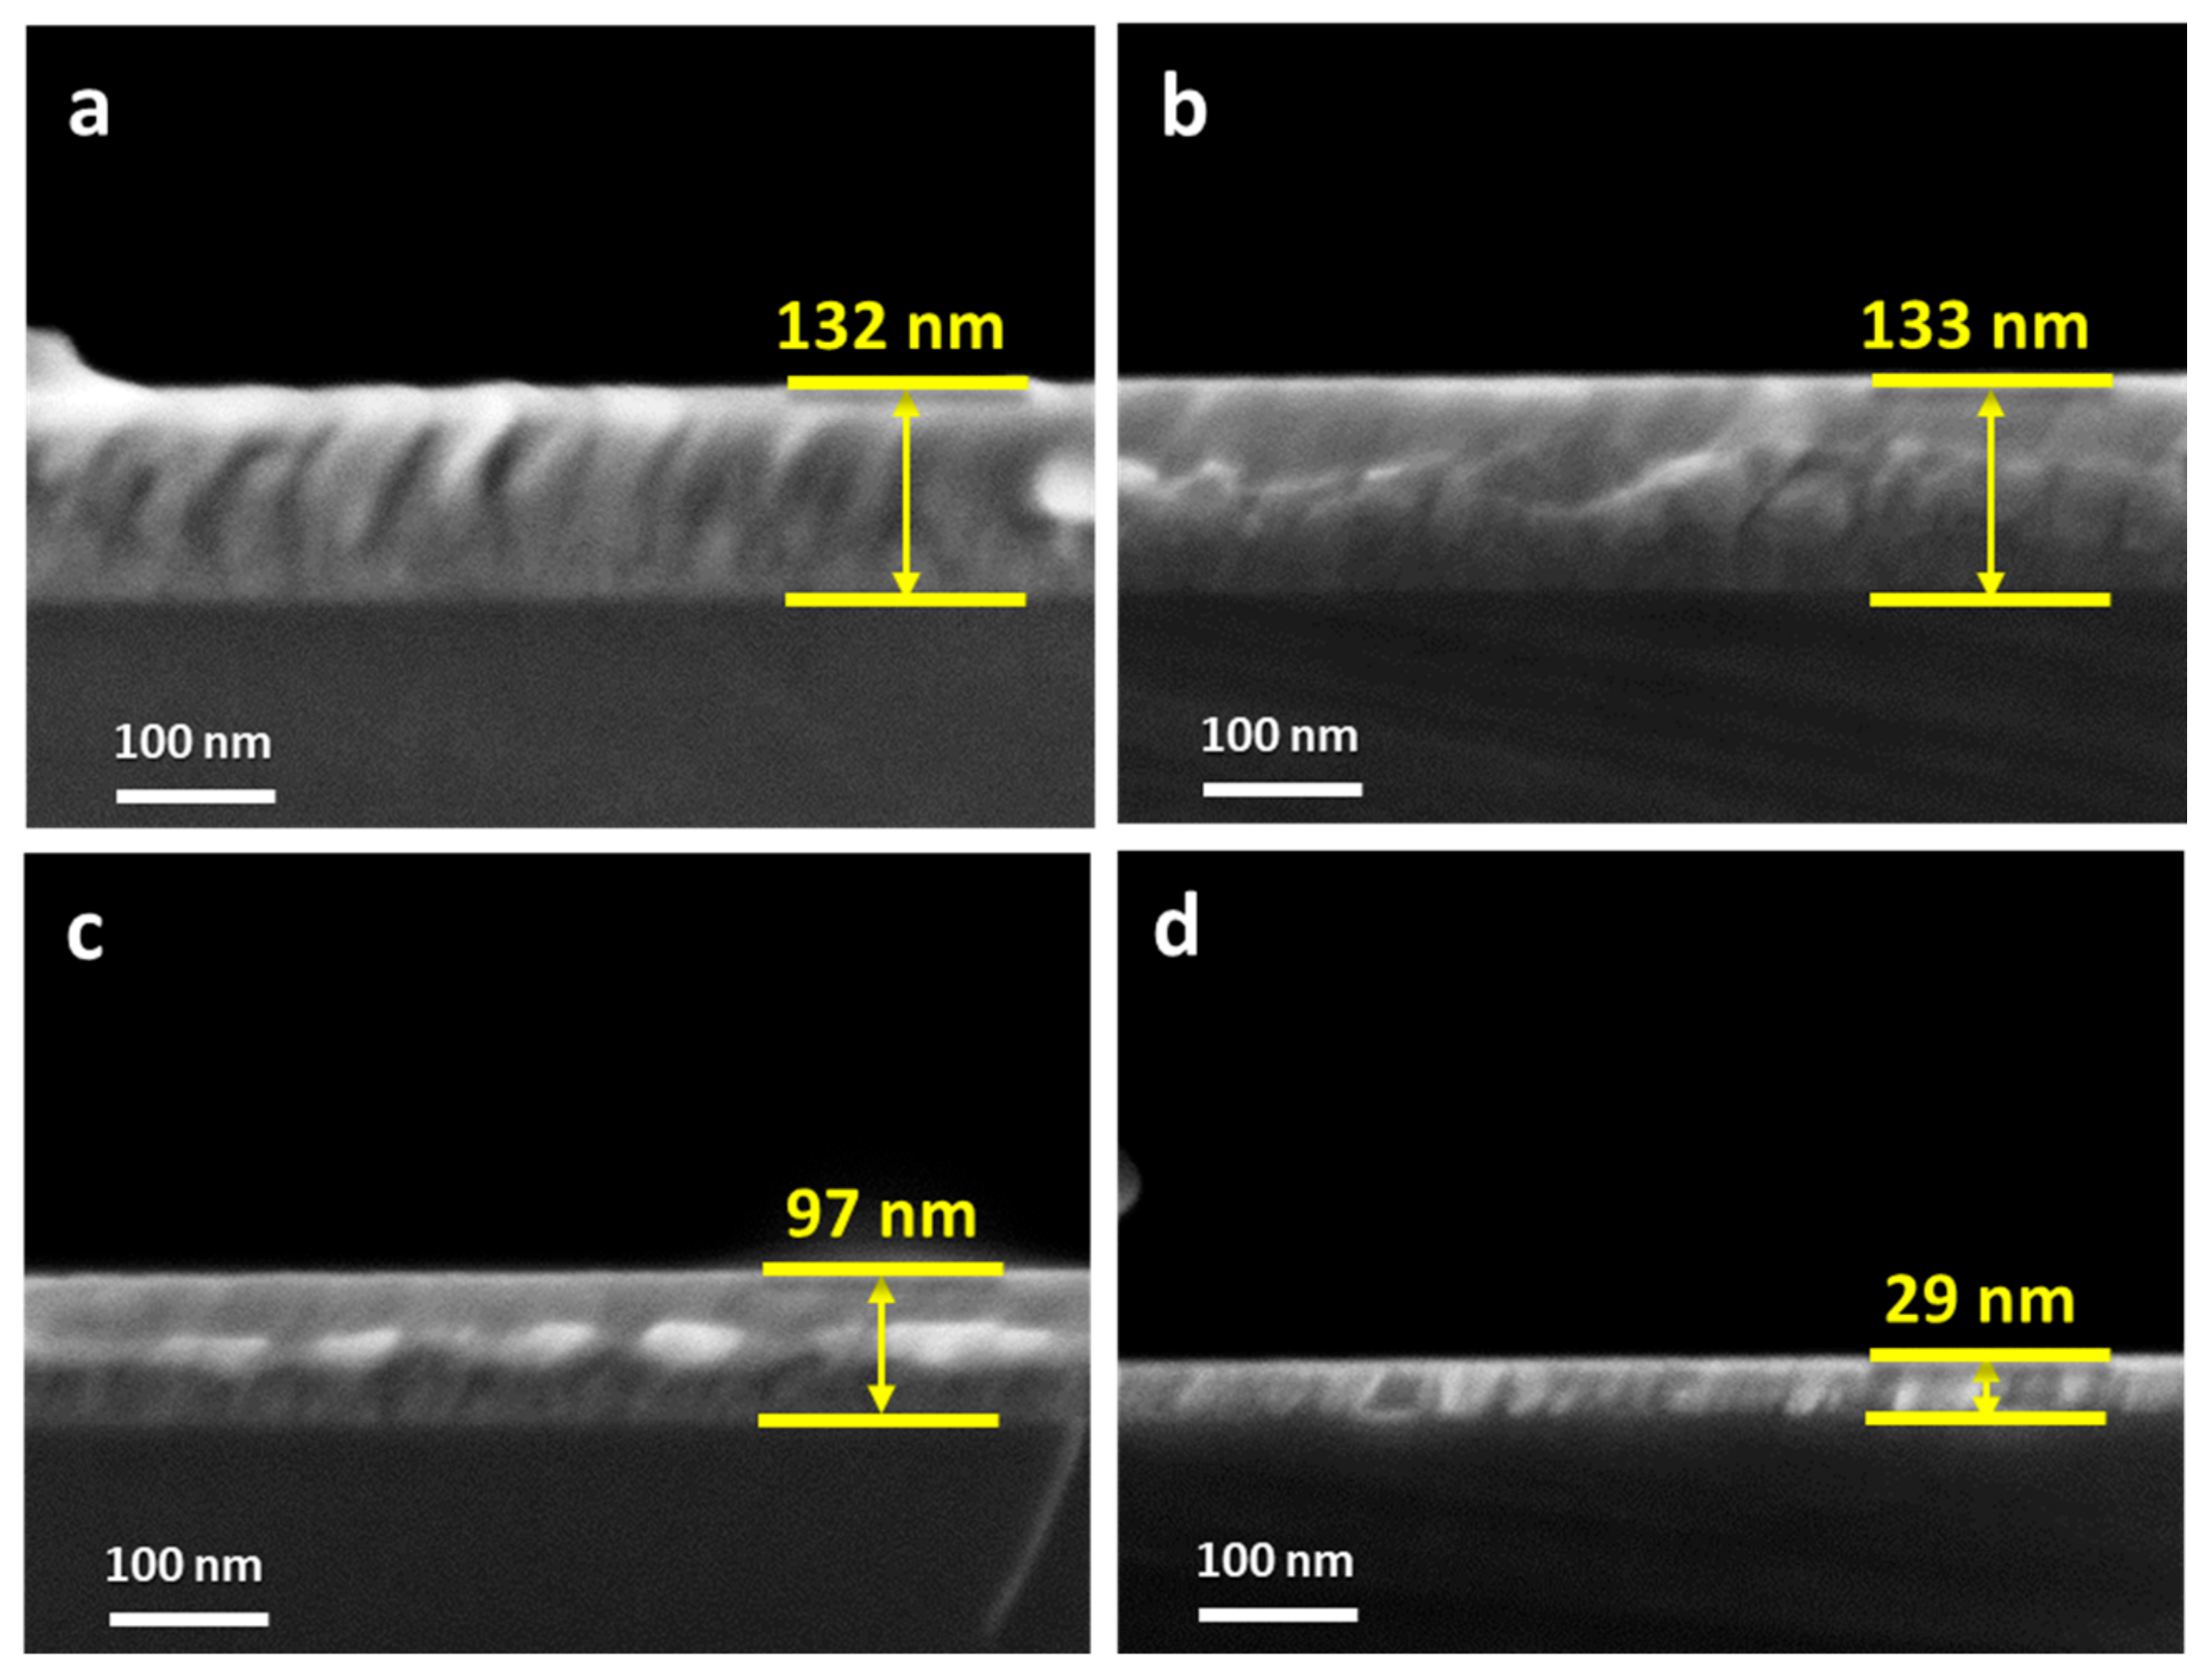
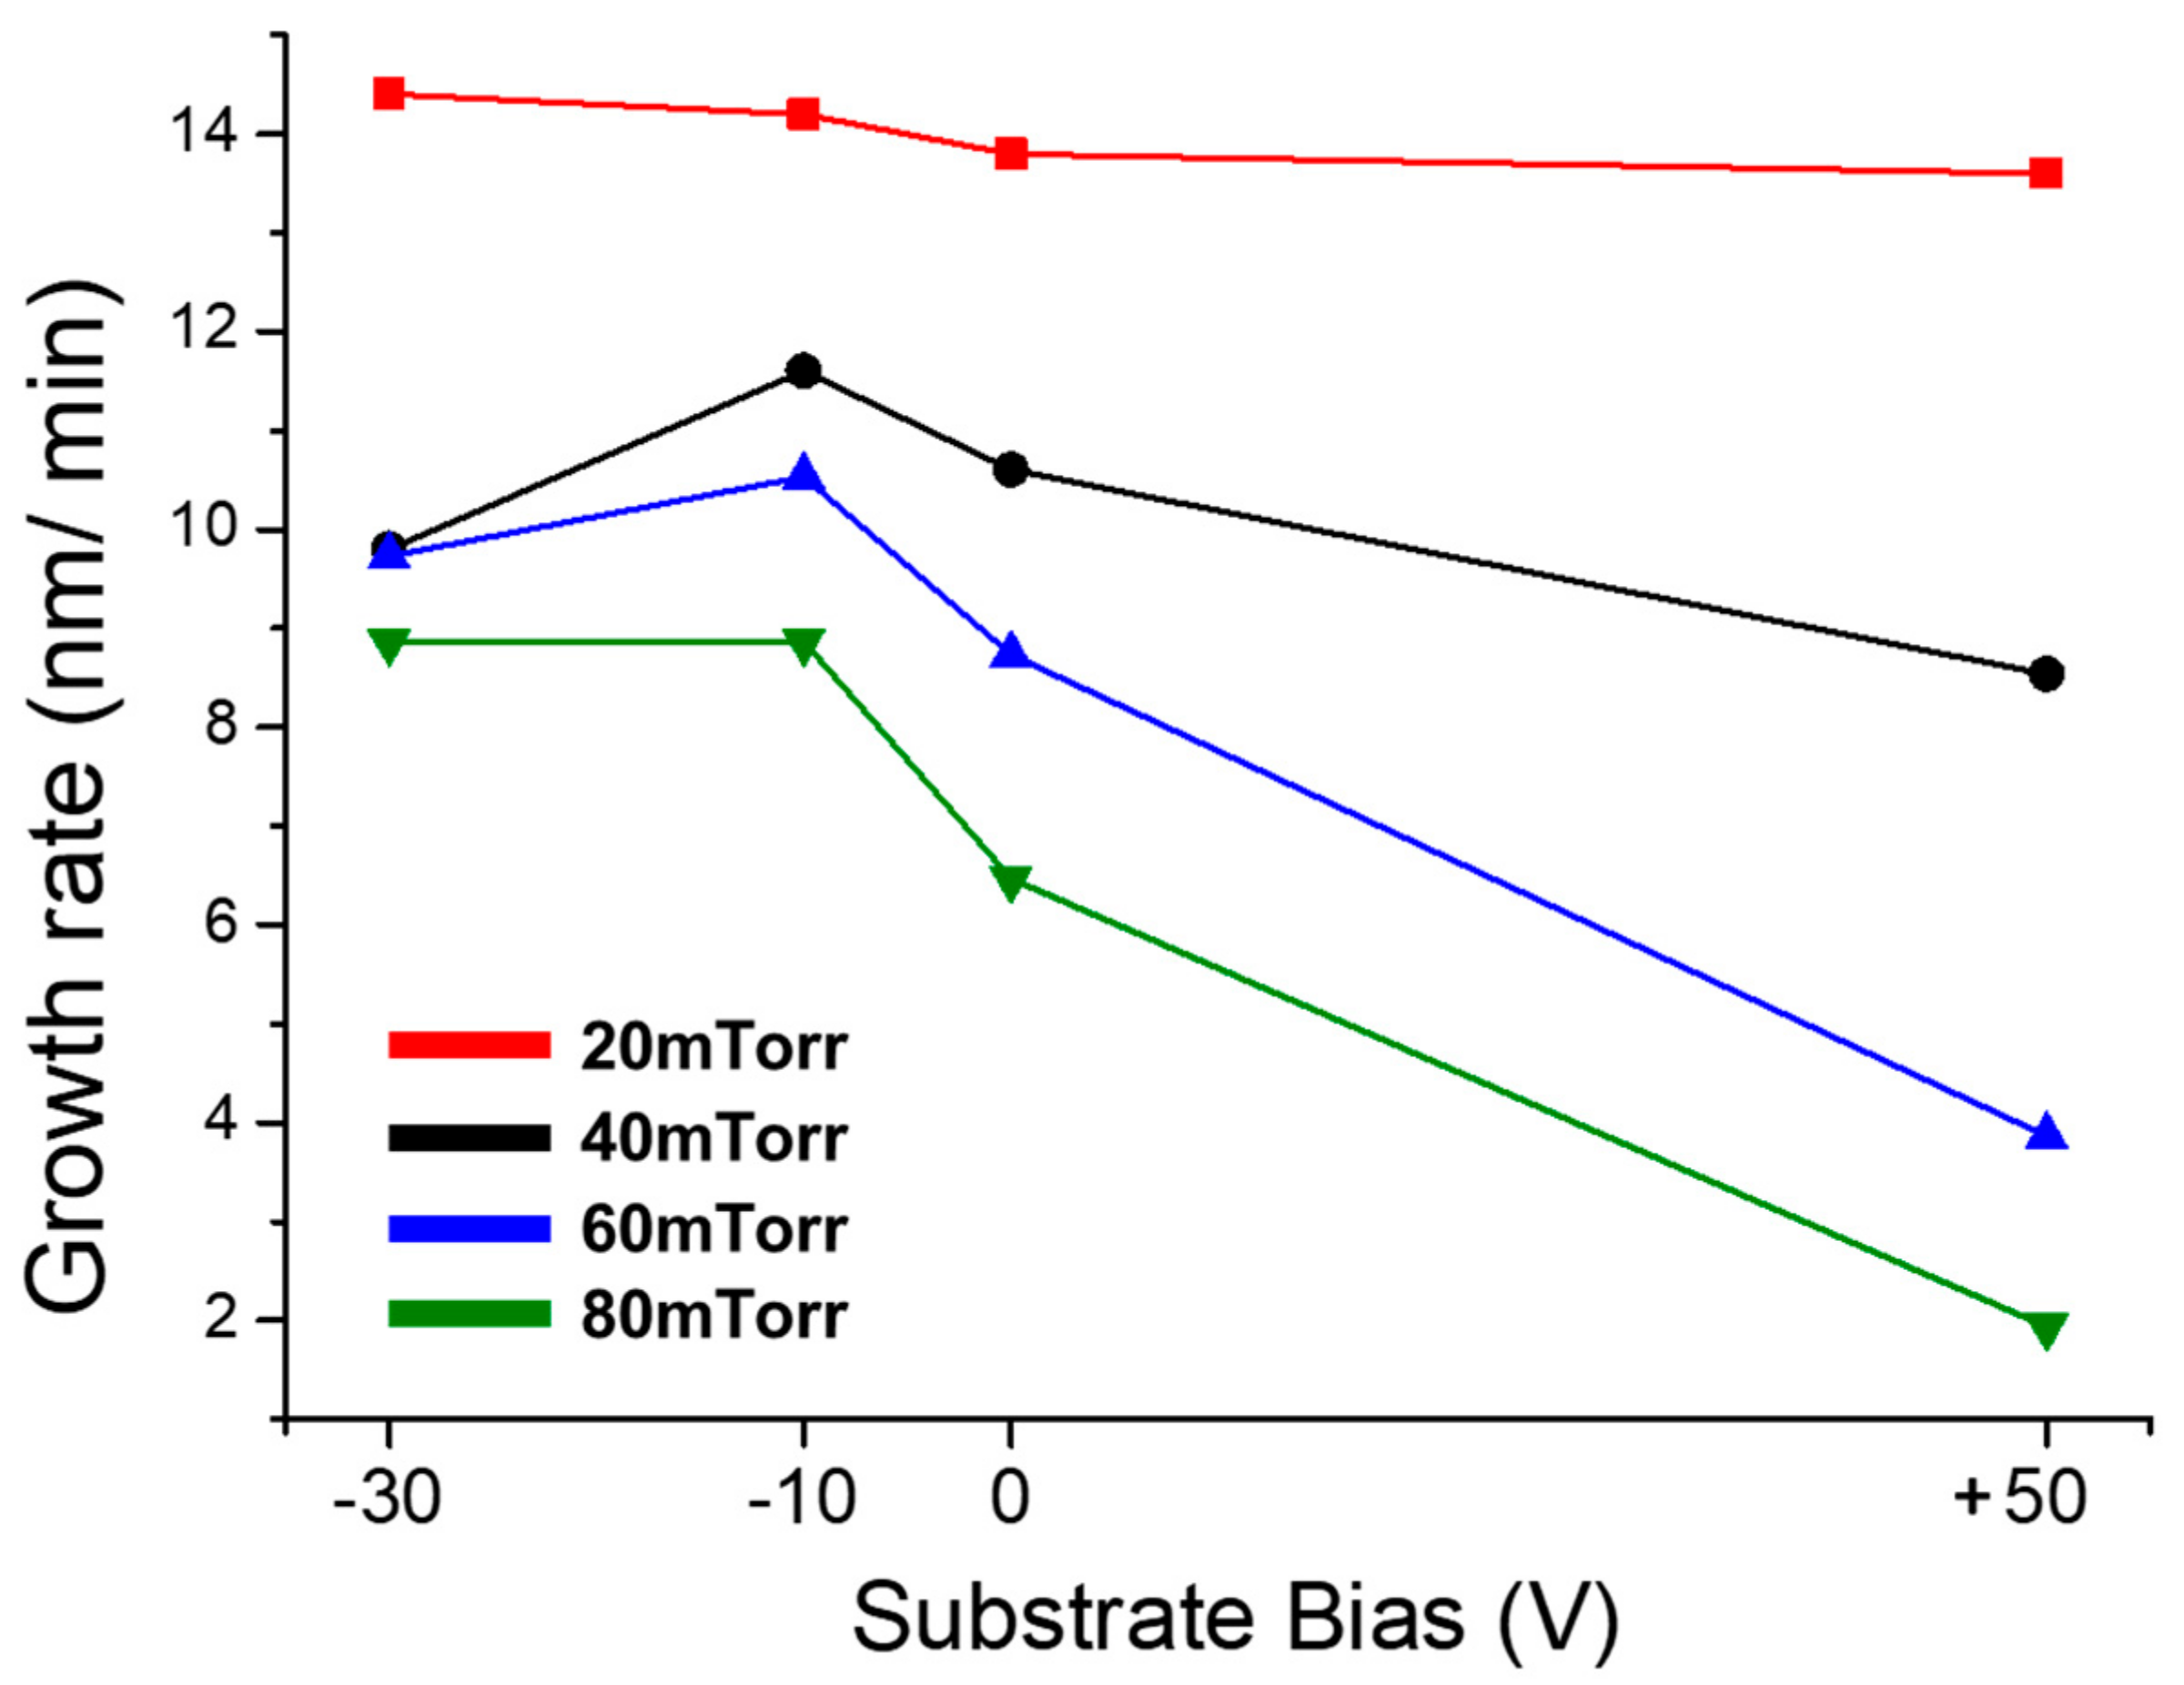
3.2. Deposition of Ti Thin Films under Various Pressures

Figure 4 shows the images of FESEM showing cross-sections of Ti films deposited for 15 min under 80 mTorr at biases of −30, −10, 0, and +50 V. The film thicknesses of Figure 4a–d are, respectively, 132, 133, 97, and 29 nm. The film thickness drastically decreased as the bias increased from −30 to +50 V, indicating that an appreciable percentage of NPs are positively charged. At substrate biases of −30 and −10 V, positively charged Ti NPs would be attracted toward the substrate, increasing the film growth rate. At the substrate bias of +50 V, however, positively charged Ti NPs would be repelled from the substrate, decreasing the film growth rate. The effect of the substrate bias was most pronounced under 80 mTorr and became less pronounced with decreasing pressure.
Figure 5 shows the growth rate of the films deposited under varying biases and varying pressures. The growth rate of films deposited at −10 V is higher than that deposited at 0 V under all pressures. The reason would be the attraction of the positively charged Ti NPs to the Si substrate applied with the bias of −10 V. However, the growth rate of films deposited at −30 V was lower than that deposited at −10 V under all pressures except 20 mTorr. Although more Ti NPs would be attracted to the substrate at −30 V than at −10 V, the incident energy of Ar+ ions on the growing surface would be so high at −30 V that the bombardment of Ar+ ions would resputter the Ti film, decreasing the growth rate.
On the other hand, the growth rate of films deposited at +50 V is the lowest under all pressures. The reason would be that the substrate bias of +50 V repelled the positively charged Ti NPs from the substrate.
As shown in Figure 5, the bias effect on the film growth rate becomes more pronounced as pressure increases. The reason would be that as the pressure increases, the mean free path decreases and the collision frequency of NPs with Ar+ and other positively charged species increases; as a result, the percentage of positively charged NPs increases as discussed in Section 3.1.
It should be noted that although Ti NPs were absent at the substrate bias of +50 V in Figure 3f, the film growth rate was appreciable at the bias of +50 V in Figure 5. Considering Figure 3f, the film growth at +50 V in Figure 5 comes entirely from the deposition of neutral atoms or small neutral NPs. If the film was deposited mainly by neutral atoms at +50 V, it would have higher crystallinity than other films, whereas if the film was deposited mainly by neutral NPs at +50 V, it would have lower crystallinity. Jeon et al. [26] reported that porous films with a rough surface morphology were obtained under the condition in which neutral NPs were generated, whereas dense films with a smooth morphology were obtained under the condition in which charged NPs were generated during the thermal evaporation of copper. This aspect was also studied by Kwon et al. [32], who reported that neutral NPs produce not only films of poor crystallinity but also films of low density. To determine whether neutral atoms or neutral NPs are the main flux, the crystallinity of films, which can be analyzed by XRD, should be examined.
Figure 6 shows XRD data of the films deposited at various substrate biases under various pressures. Under all pressures, the films deposited at the substrate bias of +50 V do not show any clear peak in contrast to the films deposited at the substrate biases of −30, −10, and 0 V. It did not show clear peaks even measured by grazing incidence XRD, which has higher sensitivity than conventional XRD. These results indicate that the films deposited at +50 V are almost amorphous or nanocrystalline. These results indicate that the films were most probably deposited not only by neutral atoms but also by neutral clusters.
Meanwhile, the films deposited at the substrate biases of −30 and −10 V show XRD peaks with (100) orientations of Ti under all pressures, whereas the films deposited at 0 V show either (100) or (002) orientations. This difference is thought to come from the difference in the incident energy of sputtered species on the substrates. According to Kwon et al. [37], the different incident energy on floating and grounded substrates during Ti RF sputtering affected the orientations of the films. The (100)-oriented Ti films were obtained with high incident energy, whereas the (002)-oriented Ti films were obtained with low incident energy. In this experiment, the positively charged NPs would be accelerated by the substrate biases of −30 and −10 V, resulting in the high incident energy and (100) orientation of the films. In contrast, in the case of 0 V, the incident energy was relatively low, resulting in either (100) or (002) orientation.
This new understanding that charged NPs are generated during RF sputtering and contribute to film growth can be applied in various ways. For example, using the fact that charged NPs are generated in the gas phase, NPs using RF sputtering can be synthesized. By increasing the relative amount of charged NPs, selective deposition can be made. Furthermore, utilizing the fact that RF sputtering generates a much larger relative amount of charged NPs than DC sputtering, RF sputter-deposited metal films are expected to have much lower resistivity than DC sputter-deposited ones.

4. Conclusions

Positively charged Ti NPs were spontaneously generated during the RF sputtering process. The ratio of charged to neutral Ti NPs increased as the pressure increased. The negative substrate bias increased the growth rate of the films, which is attributed to attracting of positively charged Ti NPs, whereas the positive substrate bias decreased the growth rate of the films, which is attributed to repelling of them. Such a bias effect became pronounced as the pressure increased.

Author Contributions

Conceptualization, D.-Y.K., J.-H.K., and N.-M.H.; methodology, D.-Y.K. and J.-H.K.; formal analysis, D.-Y.K. and G.-S.J.; investigation, D.-Y.K. and G.-S.J.; data curation, D.-Y.K. and G.-S.J.; writing—original draft preparation, D.-Y.K. and N.-M.H.; writing—review and editing, D.-Y.K. and N.-M.H.; supervision, N.-M.H. All authors have read and agreed to the published version of the manuscript.

Funding

This research was funded by the Global Frontier Program through the Global Frontier Hybrid Interface Materials (GFHIM) of the National Research Foundation of Korea (NRF) funded by the Ministry of Science, ICT and Future Planning (MSIT) (number NRF-2013M3A6B1078874) and the National Research Foundation of Korea (NRF) grant funded by the Korea government (MSIT) (number 2020R1A5A6017701) and BK21PLUS SNU Materials Division for Educating Creative Global Leaders (21A20131912052).

Institutional Review Board Statement

Not applicable.

Informed Consent Statement

Not applicable.

Data Availability Statement

Not applicable.

Conflicts of Interest

The authors declare no conflict of interest.

References

  1. Boyer, R. An overview on the use of titanium in the aerospace industry. Mater. Sci. Eng. A 1996, 213, 103–114. [Google Scholar] [CrossRef]
  2. Elias, C.N.; Lima, J.H.C.; Valiev, R.; Meyers, M.A. Biomedical applications of titanium and its alloys. JOM 2008, 60, 46–49. [Google Scholar] [CrossRef]
  3. Kaur, M.; Singh, K. Review on titanium and titanium based alloys as biomaterials for orthopaedic applications. Mater. Sci. Eng. C 2019, 102, 844–862. [Google Scholar] [CrossRef]
  4. Ting, C.; Wittmer, M. The use of titanium-based contact barrier layers in silicon technology. Thin Solid Film. 1982, 96, 327–345. [Google Scholar] [CrossRef]
  5. Huang, L.; Liu, B.; Zhu, Q.; Chen, S.; Gao, M.; Qin, F.; Wang, D. Low resistance Ti Ohmic contacts to 4H–SiC by reducing barrier heights without high temperature annealing. Appl. Phys. Lett. 2012, 100, 263503. [Google Scholar] [CrossRef]
  6. Suzuki, M.; Kawakami, T.; Arai, T.; Kobayashi, S.; Koide, Y.; Uemura, T.; Shibata, N.; Murakami, M. Low-resistance Ta/Ti Ohmic contacts for p-type GaN. Appl. Phys. Lett. 1999, 74, 275–277. [Google Scholar] [CrossRef]
  7. Chawla, V.; Jayaganthan, R.; Chawla, A.K.; Chandra, R. Morphological study of magnetron sputtered Ti thin films on silicon substrate. Mater. Chem. Phys. 2008, 111, 414–418. [Google Scholar] [CrossRef]
  8. Chawla, V.; Jayaganthan, R.; Chawla, A.K.; Chandra, R. Microstructural characterizations of magnetron sputtered Ti films on glass substrate. J. Mater. Process. Technol. 2009, 209, 3444–3451. [Google Scholar] [CrossRef]
  9. Chen, A.Y.; Bu, Y.; Tang, Y.; Wang, Y.; Liu, F.; Xie, X.; Gu, J.; Pan, D. Deposition-rate dependence of orientation growth and crystallization of Ti thin films prepared by magnetron sputtering. Thin Solid Film. 2015, 574, 71–77. [Google Scholar] [CrossRef]
  10. Jeyachandran, Y.L.; Karunagaran, B.; Narayandass, S.; Mangalaraj, D. The effect of thickness on the properties of titanium films deposited by dc magnetron sputtering. Mater. Sci. Eng. A 2007, 458, 361–365. [Google Scholar] [CrossRef]
  11. Miyoshi, T.; Haga, Y.; Nittono, O. Microstructure and preferred orientation in pure titanium films deposited by two-facing-target-type DC sputtering. Thin Solid Film. 1996, 281, 128–131. [Google Scholar] [CrossRef]
  12. Muslim, N.; Soon, Y.W.; Lim, C.M.; Voo, Y.N. Influence of sputtering power on properties of titanium thin films deposited by RF magnetron sputtering. ARPN J. Eng. Appl. Sci. 2015, 10, 7148–7189. [Google Scholar]
  13. Audronis, M.; Bellido-Gonzalez, V. The effect of Ti sputter target oxidation level on reactive high power impulse magnetron sputtering process behaviour. Surf. Coat. Technol. 2011, 205, S322–S325. [Google Scholar] [CrossRef]
  14. Wu, B.; Yu, Y.; Wu, J.; Shchelkanov, I.; Ruzic, D.N.; Huang, N.; Leng, Y. Tailoring of titanium thin film properties in high power pulsed magnetron sputtering. Vacuum 2018, 150, 144–154. [Google Scholar] [CrossRef]
  15. Ghasemi, S.; Seyfi, P.; Farhadizadeh, A.; Ghomi, H. The experimental approach into the influence of external inductance on the discharge characteristic of HiPIMS. J. Theor. Appl. Phys. 2019, 13, 289–297. [Google Scholar] [CrossRef] [Green Version]
  16. Aizenberg, J.; Braun, P.V.; Wiltzius, P. Patterned colloidal deposition controlled by electrostatic and capillary forces. Phys. Rev. Lett. 2000, 84, 2997–3000. [Google Scholar] [CrossRef] [Green Version]
  17. Demortière, A.; Snezhko, A.; Sapozhnikov, M.V.; Becker, N.; Proslier, T.; Aranson, I.S. Self-assembled tunable networks of sticky colloidal particles. Nat. Commun. 2014, 5, 3117. [Google Scholar] [CrossRef] [Green Version]
  18. Ferrar, J.A.; Solomon, M.J. Kinetics of colloidal deposition, assembly, and crystallization in steady electric fields. Soft Matter 2015, 11, 3599–3611. [Google Scholar] [CrossRef]
  19. Sadri, B.; Pernitsky, D.J.; Sadrzadeh, M. Aggregation and deposition of colloidal particles: Effect of surface properties of collector beads. Colloids Surf. A Physicochem. Eng. Asp. 2017, 530, 46–52. [Google Scholar] [CrossRef]
  20. Wang, Z.; He, B.; Xu, G.; Wang, G.; Wang, J.; Feng, Y.; Su, D.; Chen, B.; Li, H.; Wu, Z.; et al. Transformable masks for colloidal nanosynthesis. Nat. Commun. 2018, 9, 563. [Google Scholar] [CrossRef] [Green Version]
  21. Kim, D.-S.; Hwang, N.-M. Synthesis of nanostructures using charged nanoparticles spontaneously generated in the gas phase during chemical vapor deposition. J. Phys. D Appl. Phys. 2018, 51, 463002. [Google Scholar] [CrossRef]
  22. Kim, C.-S.; Chung, Y.-B.; Youn, W.-K.; Hwang, N.-M. Generation of charged nanoparticles during synthesis of ZnO nanowires by carbothermal reduction. Aerosol Sci. Technol. 2009, 43, 120–125. [Google Scholar] [CrossRef]
  23. Hwang, N.M. Non-Classical Crystallization of Thin Films and Nanostructures in CVD and PVD Processes; Springer Netherlands: Dordrecht, The Netherlands, 2016; Volume 60, pp. 1–332. ISBN 978-94-017-7616-5. [Google Scholar]
  24. Jung, J.-S.; Lee, S.-H.; Kim, D.-S.; Kim, K.-S.; Park, S.-W.; Hwang, N.-M. Non-classical crystallization of silicon thin films during hot wire chemical vapor deposition. J. Cryst. Growth 2017, 458, 8–15. [Google Scholar] [CrossRef]
  25. Youn, W.-K.; Lee, S.-S.; Lee, J.-Y.; Kim, C.-S.; Hwang, N.-M.; Iijima, S. Comparison of the deposition behavior of charged silicon nanoparticles between floating and grounded substrates. J. Phys. Chem. C 2014, 118, 11946–11953. [Google Scholar] [CrossRef]
  26. Jeon, I.-D.; Barnes, M.; Kim, D.-Y.; Hwang, N.M. Origin of positive charging of nanometer-sized clusters generated during thermal evaporation of copper. J. Cryst. Growth 2003, 247, 623–630. [Google Scholar] [CrossRef]
  27. Park, S.-H.; Park, J.-W.; Yang, S.-M.; Kim, K.-H.; Hwang, N.-M. Effect of electric bias on the deposition behavior of ZnO nanostructures in the chemical vapor deposition process. J. Phys. Chem. C 2015, 119, 25047–25052. [Google Scholar] [CrossRef]
  28. Clare, B.W.; Talukder, G.; Jennings, P.J.; Cornish, J.C.L.; Hefter, G. Effect of charge on bond strength in hydrogenated amorphous silicon. J. Comput. Chem. 1994, 15, 644–652. [Google Scholar] [CrossRef]
  29. Kim, D.; Kim, D.Y.; Kwon, J.H.; Kim, K.-S.; Hwang, N.-M. Generation of charged SiC nanoparticles during HWCVD process. Electron. Mater. Lett. 2020, 16, 498–505. [Google Scholar] [CrossRef]
  30. Park, S.-W.; Jung, J.-S.; Kim, K.-S.; Kim, K.-H.; Hwang, N.-M. Effect of bias applied to the substrate on the low temperature growth of silicon epitaxial films during RF-PECVD. Cryst. Growth Des. 2018, 18, 5816–5823. [Google Scholar] [CrossRef]
  31. Jang, G.-S.; Kim, D.Y.; Hwang, N.-M. The effect of charged Ag nanoparticles on thin film growth during DC magnetron sputtering. Coatings 2020, 10, 736. [Google Scholar] [CrossRef]
  32. Kwon, J.H.; Kim, D.Y.; Hwang, N.-M. Generation of charged Ti nanoparticles and their deposition behavior with a substrate bias during RF magnetron sputtering. Coatings 2020, 10, 443. [Google Scholar] [CrossRef]
  33. Chapman, B.N. Glow Discharge Processes: Sputtering and Plasma Etching; Wiley: New York, NY, USA, 1980; pp. 1–406. ISBN 978-04-710-7828-9. [Google Scholar]
  34. Briot, O.; Moret, M.; Barbier, C.; Tiberj, A.; Peyre, H.; Sagna, A.; Contreras, S. Optimization of the properties of the molybdenum back contact deposited by radiofrequency sputtering for Cu(In1−xGax)Se2 solar cells. Sol. Energy Mater. Sol. Cells 2018, 174, 418–422. [Google Scholar] [CrossRef]
  35. Kampylafka, V.; Kostopoulos, A.; Modreanu, M.; Schmidt, M.; Gagaoudakis, E.; Tsagaraki, K.; Kontomitrou, V.; Konstantinidis, G.; Deligeorgis, G.; Kiriakidis, G.; et al. Long-term stability of transparent n/p ZnO homojunctions grown by rf-sputtering at room-temperature. J. Mater. 2019, 5, 428–435. [Google Scholar] [CrossRef]
  36. Acosta, M.; Méndez, R.A.; Riech, I.; Rodríguez-Pérez, M.; Rodríguez-Gattorno, G. Structural, optical and photoelectrochemical properties of tungsten oxide thin films grown by non-reactive RF-sputtering. Superlattices Microstruct. 2019, 127, 123–127. [Google Scholar] [CrossRef]
  37. Kwon, J.H.; Kim, D.Y.; Kim, K.-S.; Hwang, N.-M. Preparation of highly (002) oriented Ti films on a floating Si (100) substrate by RF magnetron sputtering. Electron. Mater. Lett. 2019, 16, 14–21. [Google Scholar] [CrossRef]
Figure 1. Schematics of system. (a) Radio frequency (RF) sputtering chamber. (b) Grounded mesh.
Coatings 11 00132 g001
Figure 2. HRTEM images and FFT information (inset of the lower right in the image) with the d-spacing value of NPs at the substrate bias of 0 V under (a) 20 mTorr and (b) 80 mTorr.
Coatings 11 00132 g002
Figure 3. HRTEM images of NPs at the substrate bias of (a) −30 V, (b) 0 V, and (c) +50 V under 20 mTorr and (d) −30 V, (e) 0 V, and (f) +50 V under 80 mTorr.
Coatings 11 00132 g003
Figure 4. SEM images of the Ti films deposited on Si substrates under 80 mTorr at biases of (a) −30 V (b) −10 V (c) 0 V, and (d) +50 V.
Coatings 11 00132 g004
Figure 5. Growth rate of the Ti films deposited at the substrate bias of −30, −10, 0, and +50 V under 20, 40, 60, and 80 mTorr.
Coatings 11 00132 g005
Figure 6. XRD data of the Ti films deposited at the substrate bias of −30, −10, 0, and +50 V under (a) 20 mTorr, (b) 40 mTorr, (c) 60 mTorr, and (d) 80 mTorr.
Coatings 11 00132 g006
Publisher’s Note: MDPI stays neutral with regard to jurisdictional claims in published maps and institutional affiliations.

