Impaired Proliferation, Apoptosis, and Angiogenesis of Adipose-Derived Stem Cells Isolated from Rats during the Course of Diabetes


Abstract
:1. Introduction
2. Materials and Methods
2.1. T1DM Rat Models and Grouping
2.2. Histological Observation
2.3. ASC Extraction
2.4. Flow Cytometry
2.5. Cell Proliferation
2.6. TUNEL Staining
2.7. Immunofluorescence for VEGF and bFGF
2.8. Real-Time Quantitative PCR
2.9. Statistical Analysis
3. Results
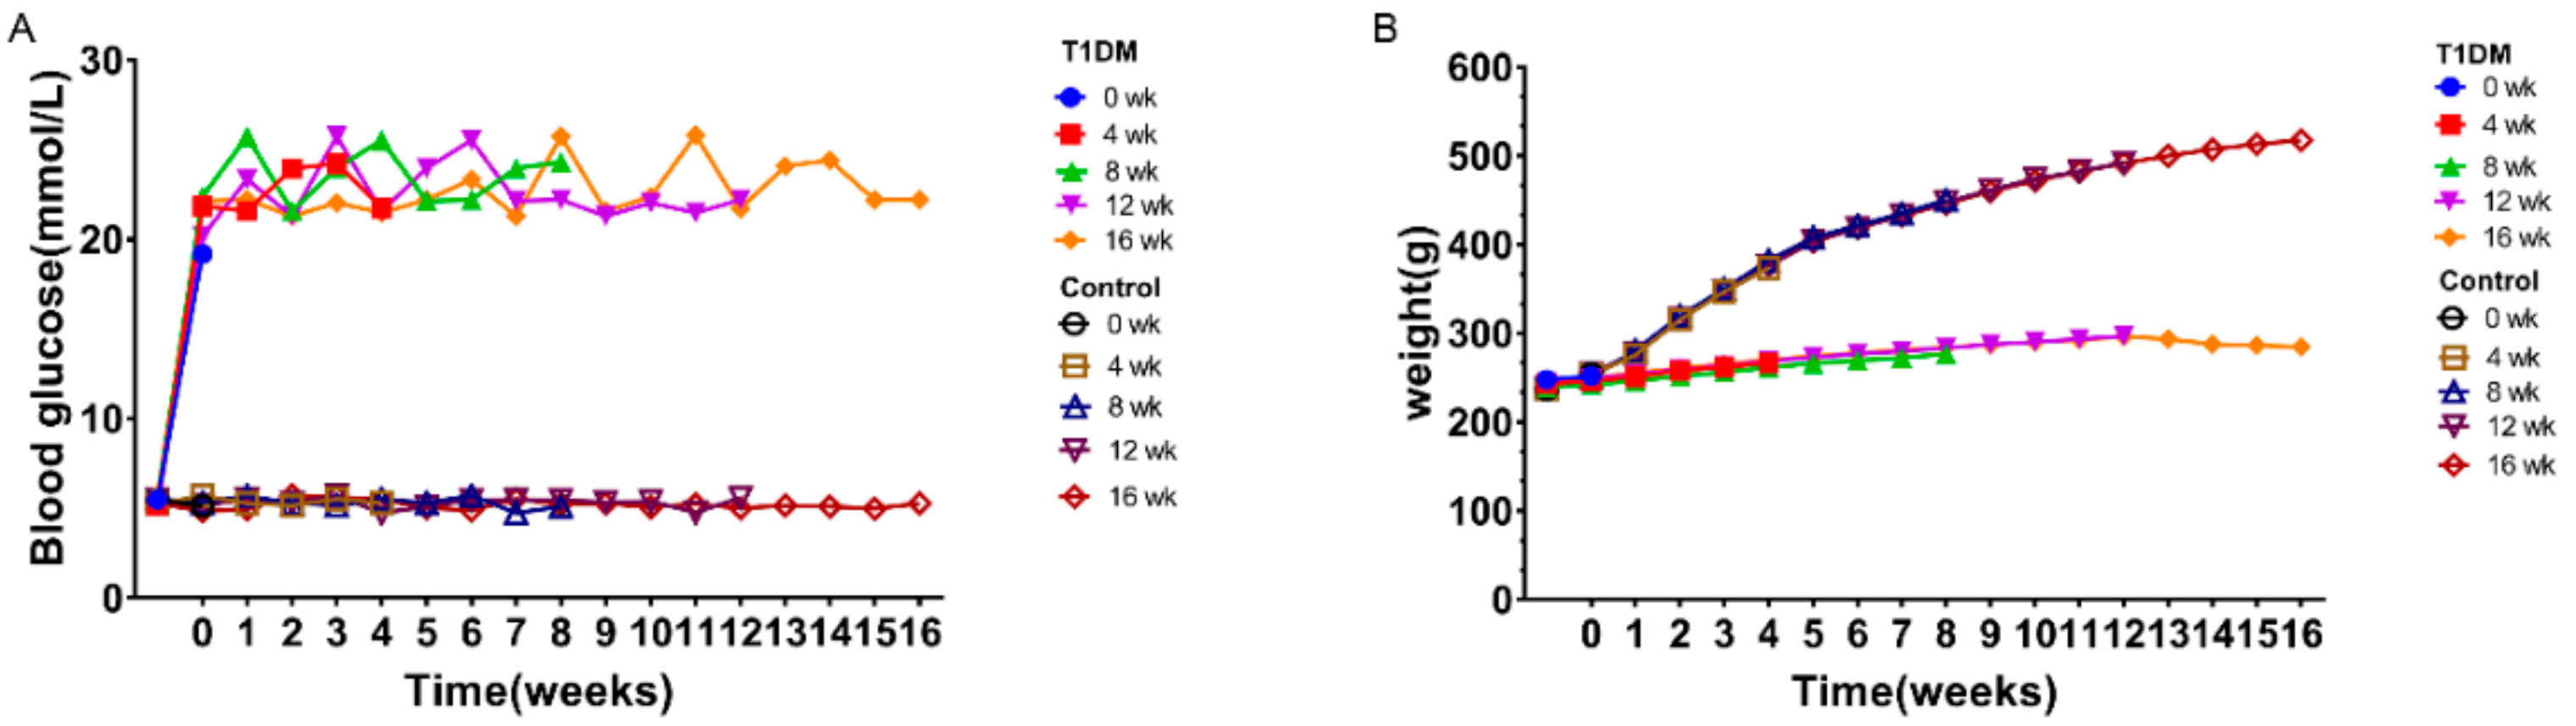
3.1. Model Success
3.2. Histological Observation of Adipose Tissue
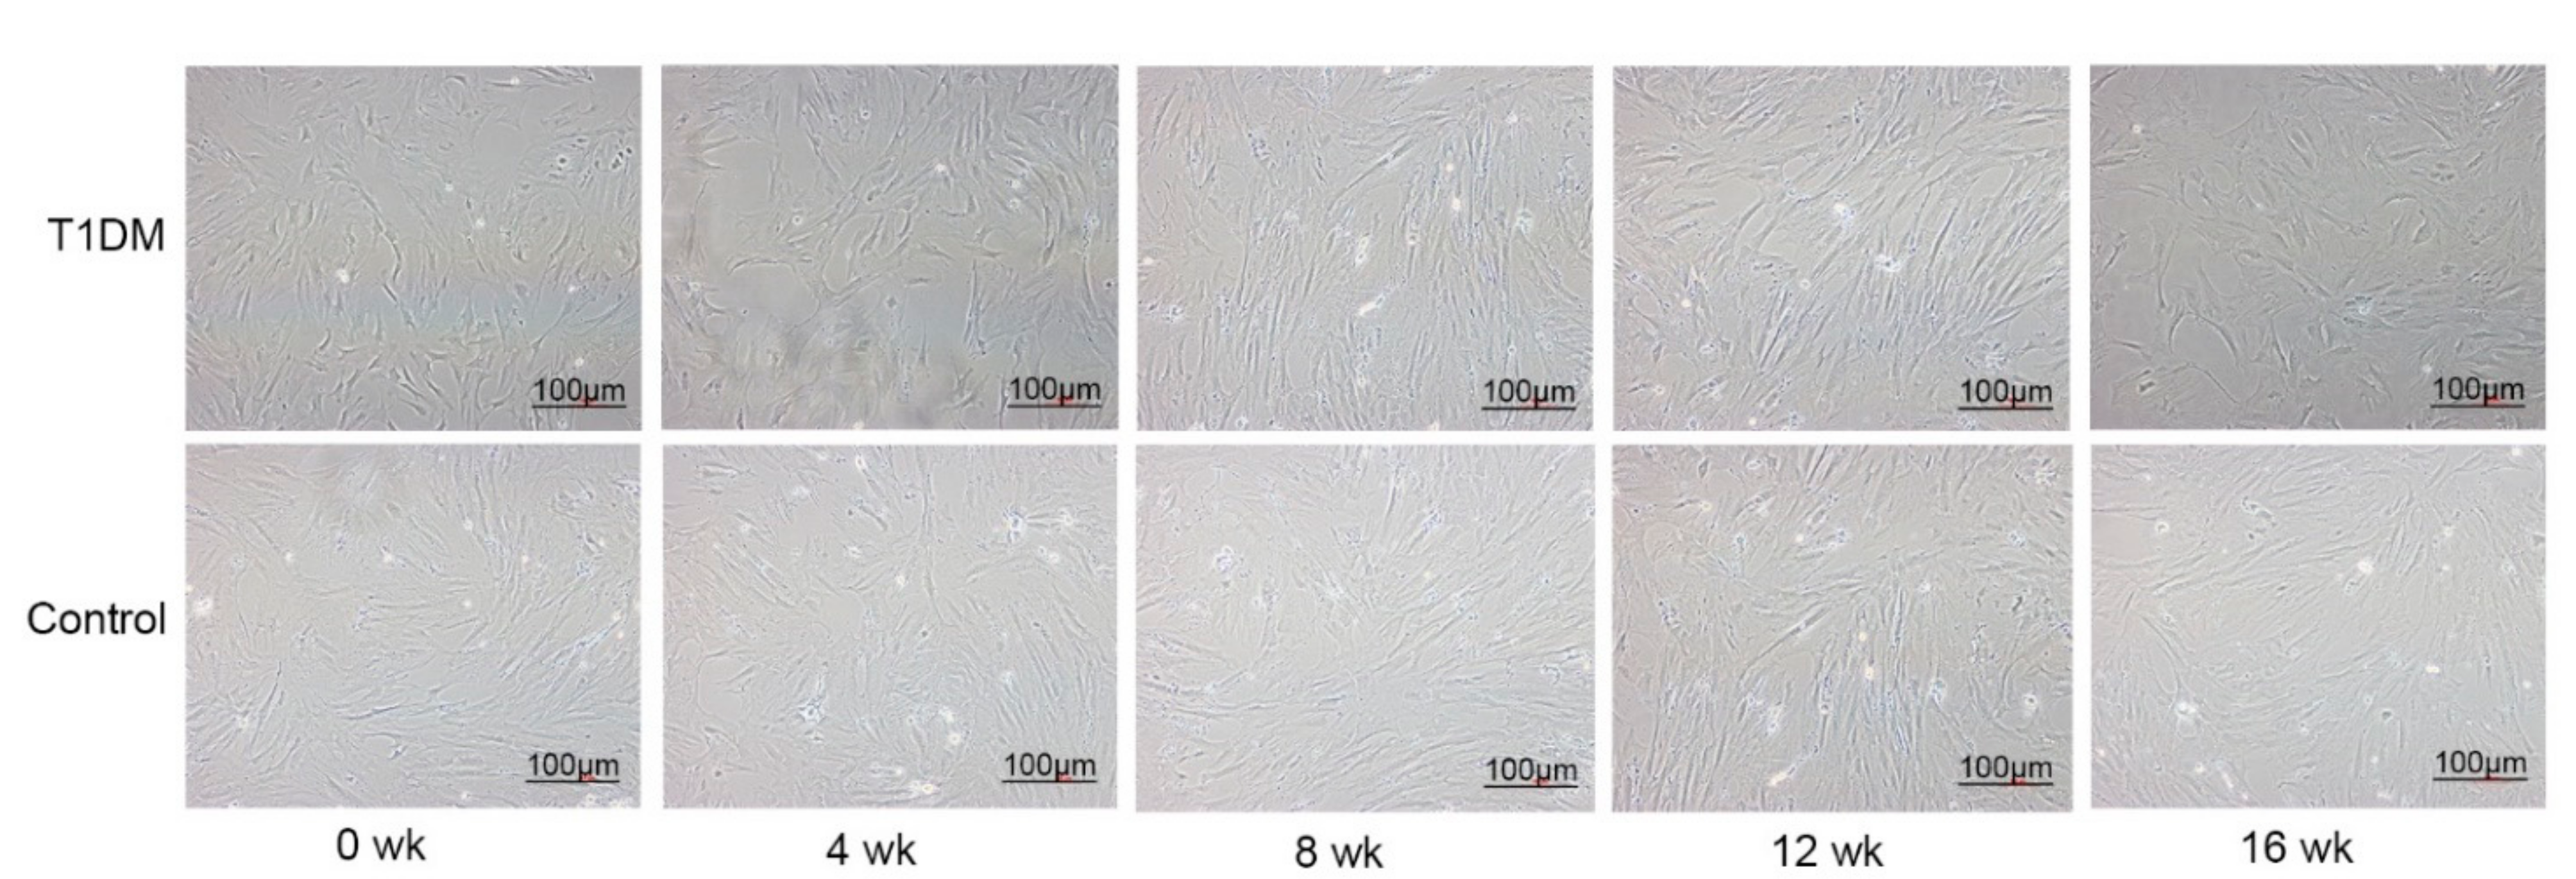
3.3. Morphology of the ASCs
3.4. Flow Cytometric Detection of CD Molecules on the Surface of ASCs
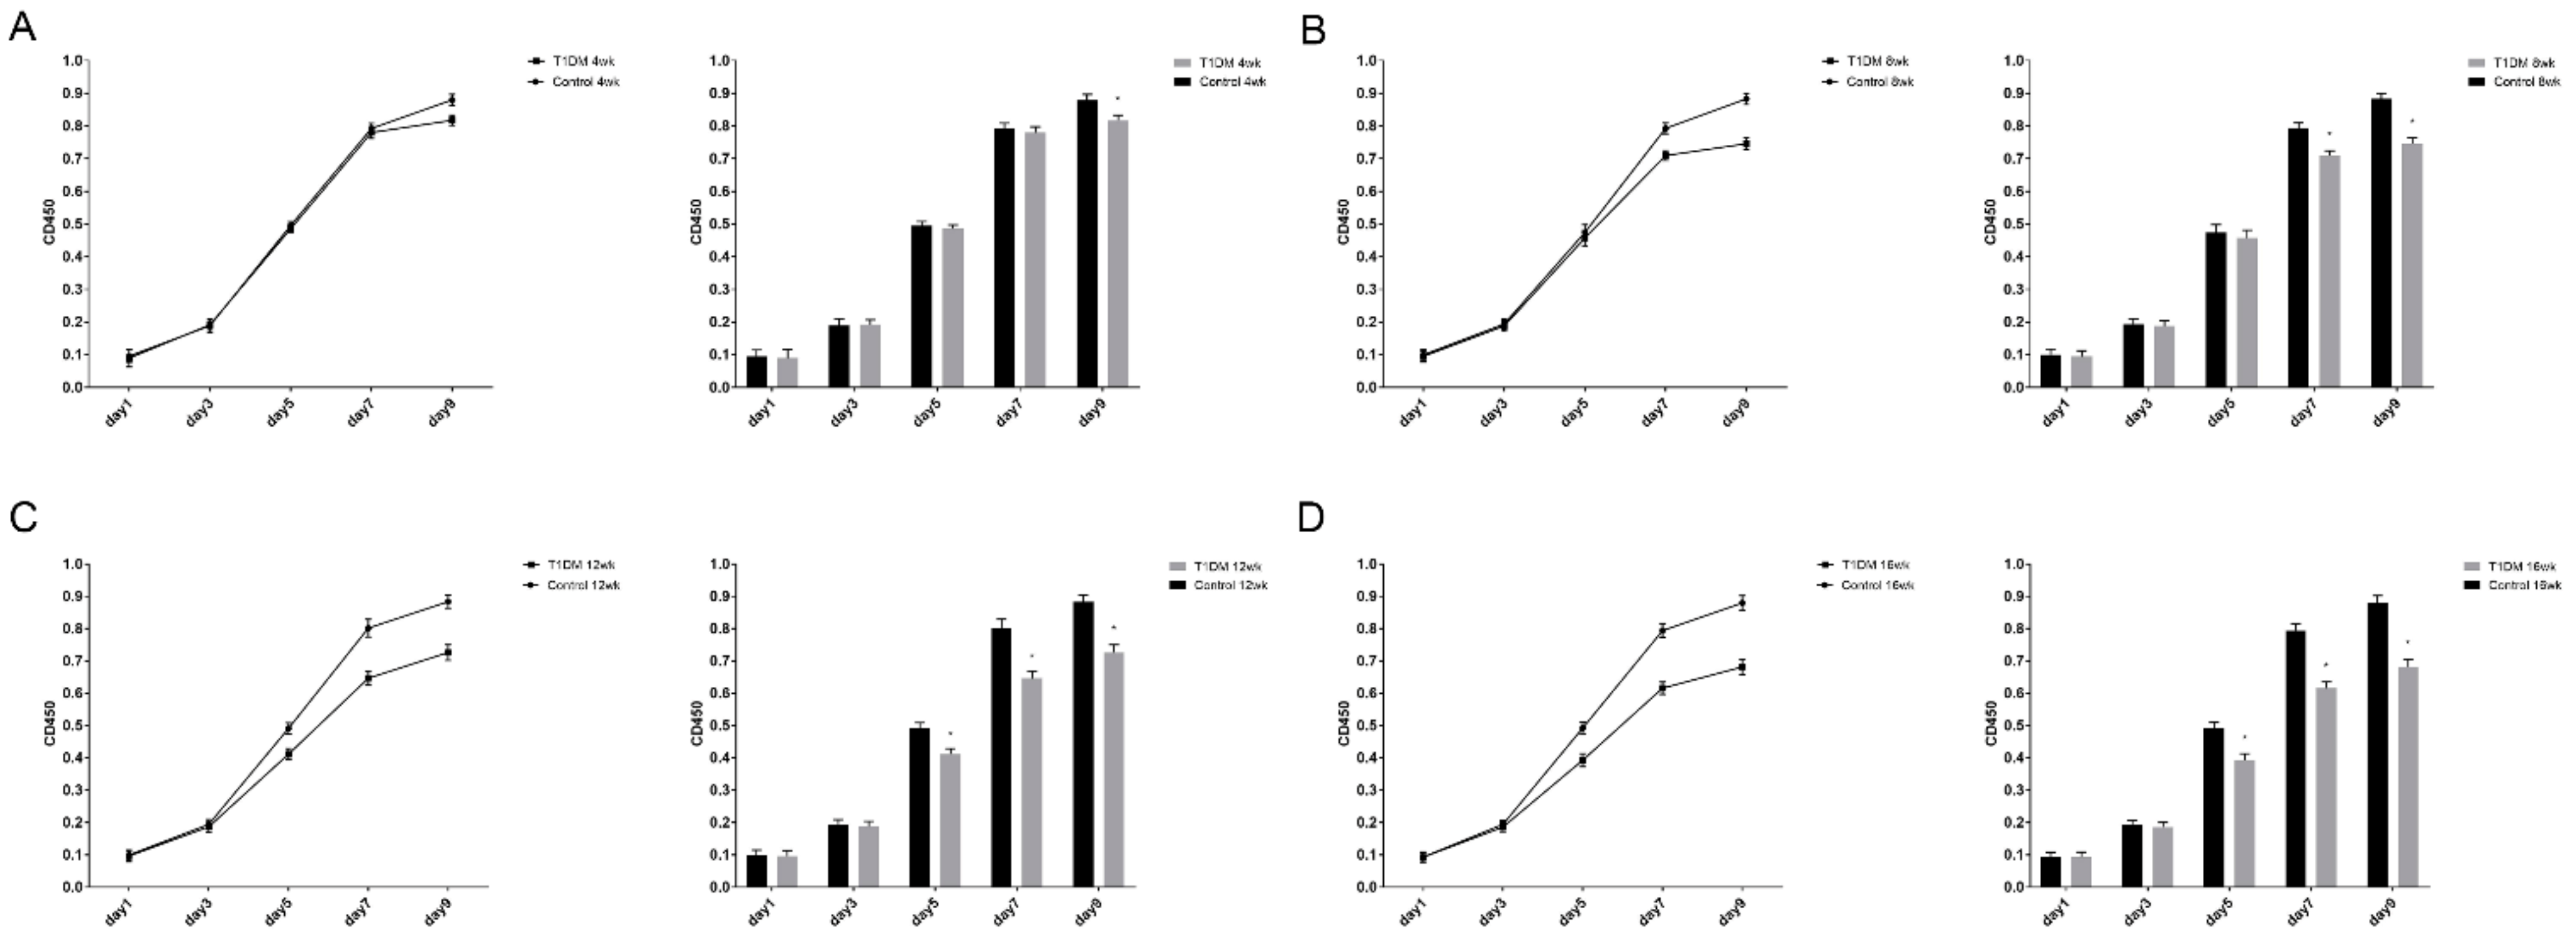
3.5. ASC Proliferation
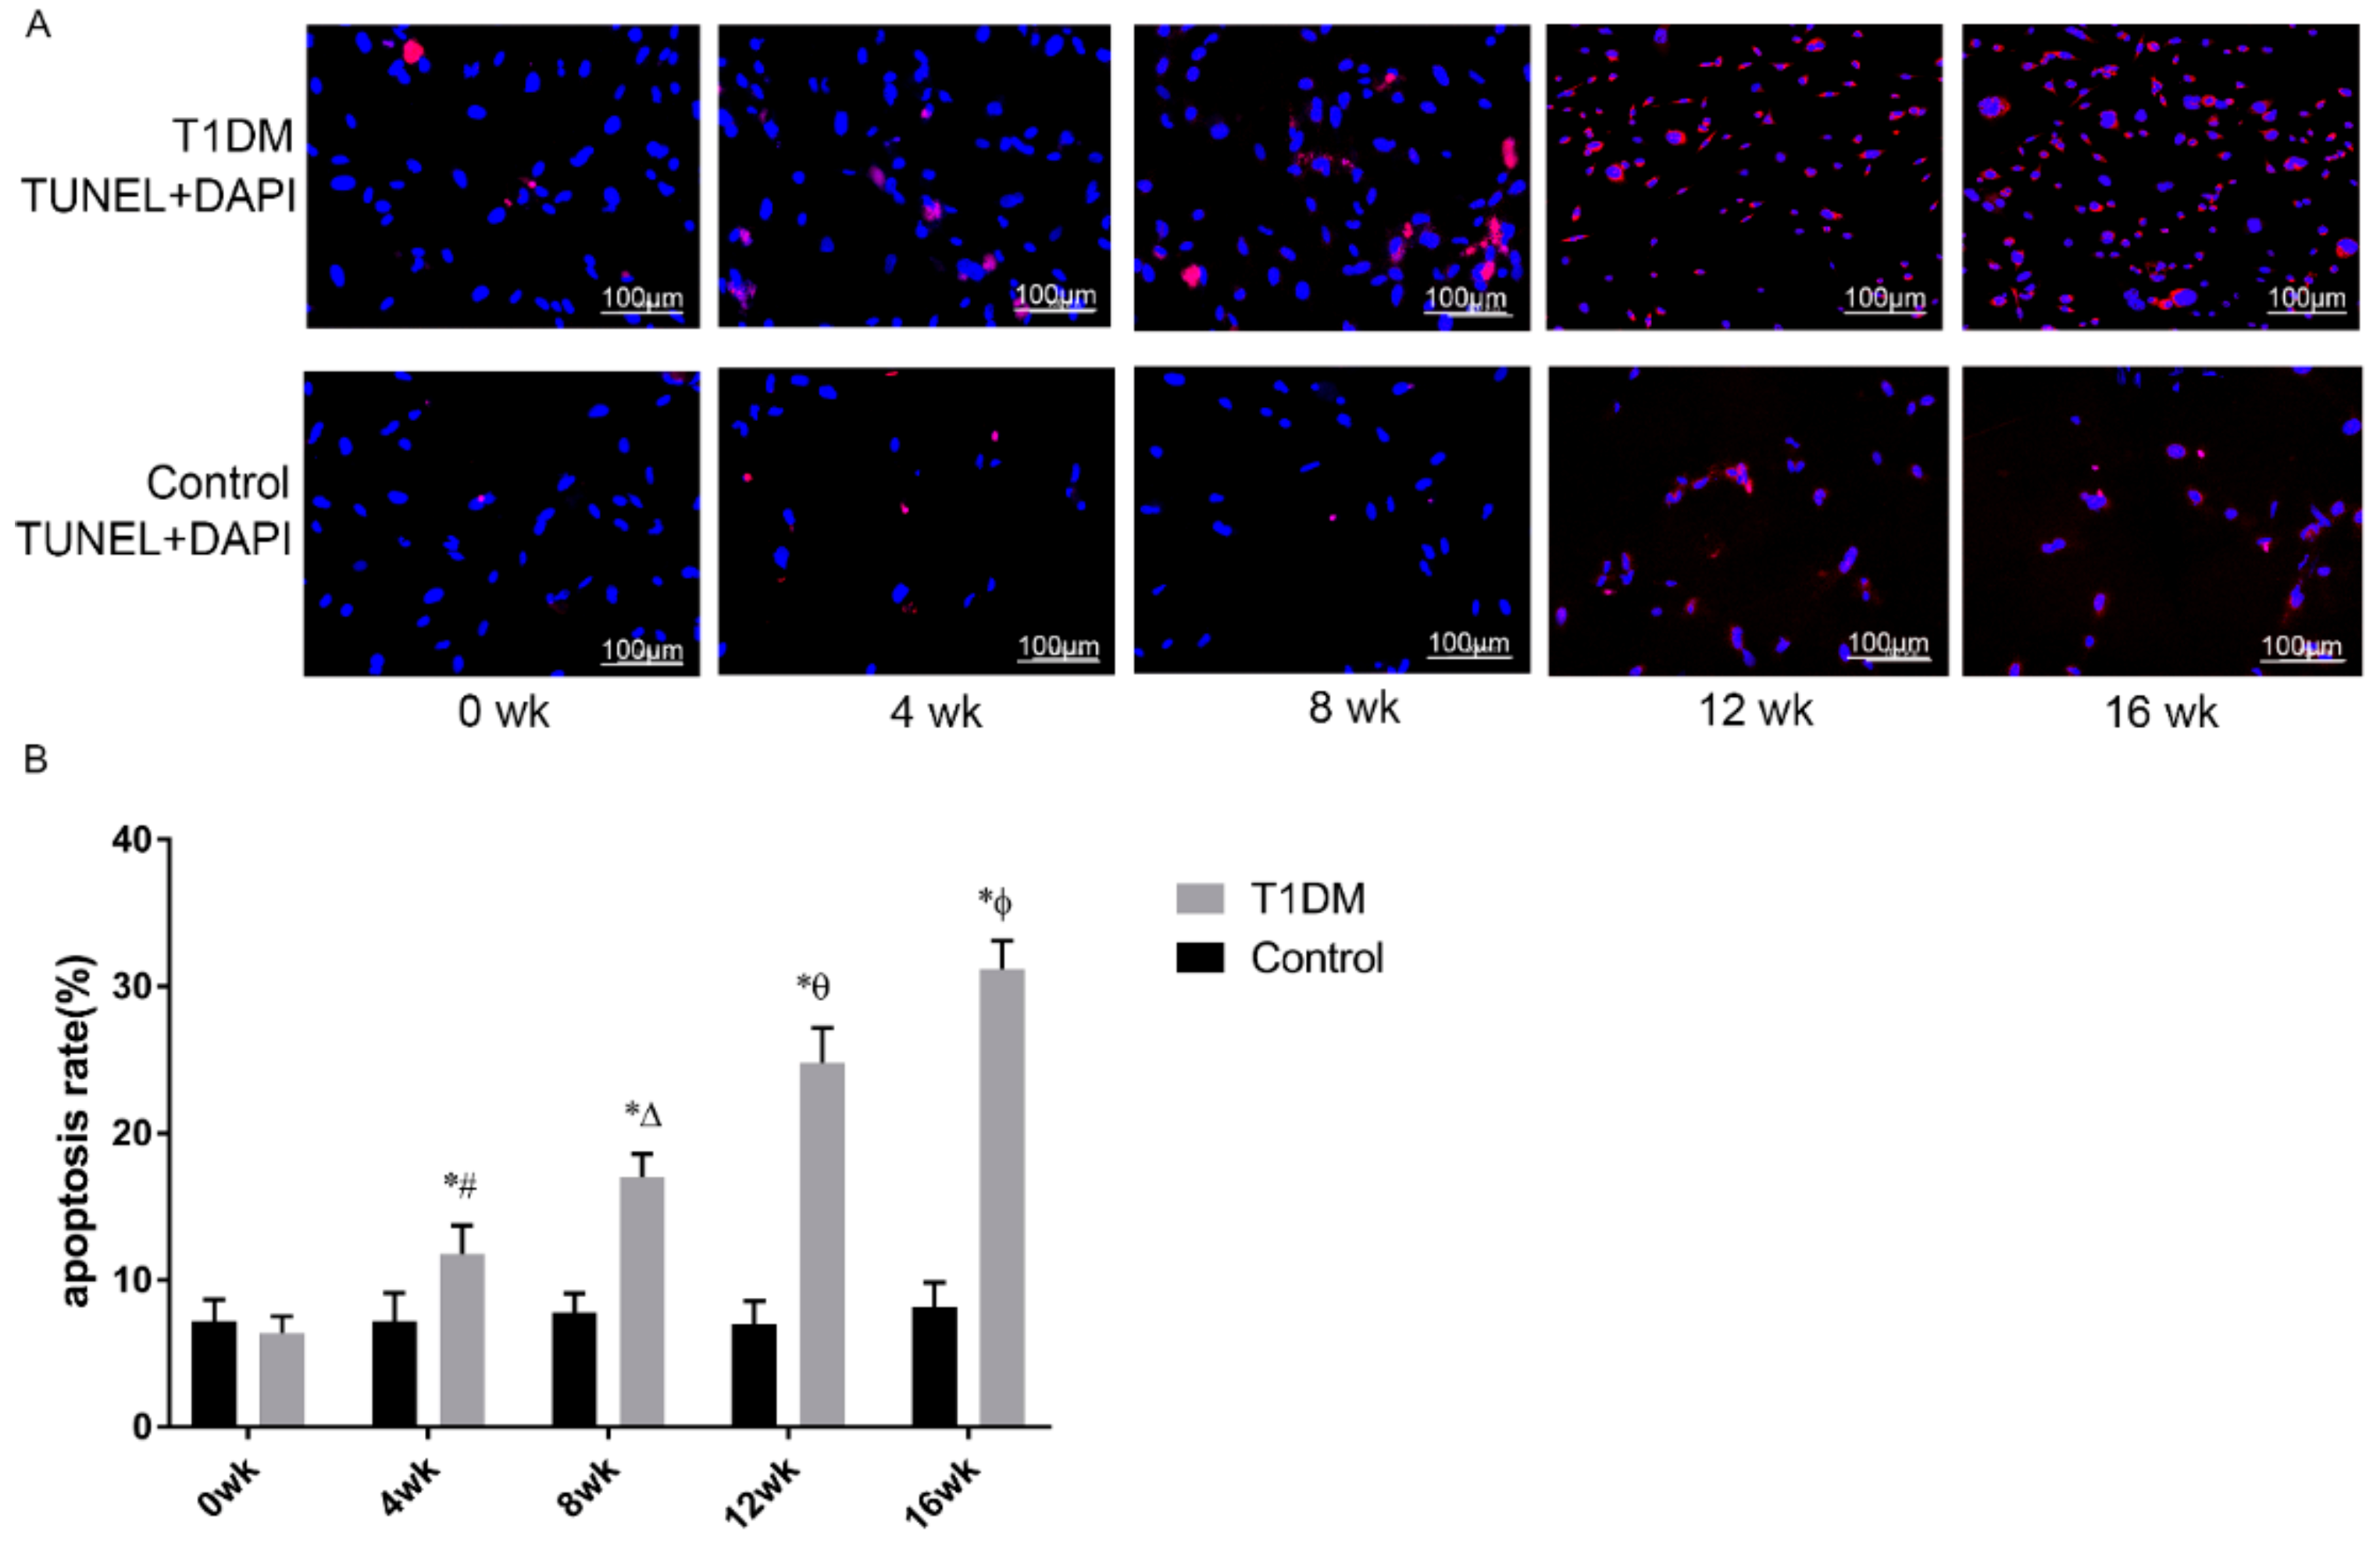
3.6. Effect of T1DM Course on Apoptosis in Passage 3 ASCs
3.7. Expression of VEGF and bFGF in ASCs
4. Discussion
5. Conclusions
Author Contributions
Funding
Institutional Review Board Statement
Informed Consent Statement
Data Availability Statement
Conflicts of Interest
Ethic Statement
References
- American Diabetes Association. Introduction: Standards of medical care in diabetes—2020. Diabetes Care 2020, 43, S1–S2. [Google Scholar] [CrossRef] [PubMed] [Green Version]
- American Diabetes Association. Diagnosis and classification of diabetes mellitus. Diabetes Care 2014, 37 (Suppl. 1), S81–S90. [Google Scholar] [CrossRef] [Green Version]
- Daneman, D. Type 1 diabetes. Lancet 2006, 367, 847–858. [Google Scholar] [CrossRef]
- Cho, N.H.; Shaw, J.E.; Karuranga, S.; Huang, Y.; da Rocha Fernandes, J.D.; Ohlrogge, A.W.; Malanda, B. Idf diabetes atlas: Global estimates of diabetes prevalence for 2017 and projections for 2045. Diabetes Res. Clin. Pract. 2018, 138, 271–281. [Google Scholar] [CrossRef] [PubMed]
- Zhang, P.; Lu, J.; Jing, Y.; Tang, S.; Zhu, D.; Bi, Y. Global epidemiology of diabetic foot ulceration: A systematic review and meta-analysis (dagger). Ann. Med. 2017, 49, 106–116. [Google Scholar] [CrossRef] [PubMed]
- Van Hattem, S.; Bootsma, A.H.; Thio, H.B. Skin manifestations of diabetes. Clevel. Clin. J. Med. 2008, 75, 772–774. [Google Scholar] [CrossRef] [PubMed]
- Chatterjee, S.; Khunti, K.; Davies, M.J. Type 2 diabetes. Lancet 2017, 389, 2239–2251. [Google Scholar] [CrossRef]
- Boulton, A.J.; Vileikyte, L.; Ragnarson-Tennvall, G.; Apelqvist, J. The global burden of diabetic foot disease. Lancet 2005, 366, 1719–1724. [Google Scholar] [CrossRef]
- Lee, K.B.; Choi, J.; Cho, S.B.; Chung, J.Y.; Moon, E.S.; Kim, N.S.; Han, H.J. Topical embryonic stem cells enhance wound healing in diabetic rats. J. Orthop. Res. 2011, 29, 1554–1562. [Google Scholar] [CrossRef] [PubMed]
- Nawrocka, D.; Kornicka, K.; Szydlarska, J.; Marycz, K. Basic fibroblast growth factor inhibits apoptosis and promotes proliferation of adipose-derived mesenchymal stromal cells isolated from patients with type 2 diabetes by reducing cellular oxidative stress. Oxid. Med. Cell. Longev. 2017, 2017, 3027109. [Google Scholar] [PubMed]
- Wallner, C.; Abraham, S.; Wagner, J.M.; Harati, K.; Ismer, B.; Kessler, L.; Zollner, H.; Lehnhardt, M.; Behr, B. Local application of isogenic adipose-derived stem cells restores bone healing capacity in a type 2 diabetes model. Stem Cells Transl. Med. 2016, 5, 836–844. [Google Scholar] [CrossRef] [PubMed] [Green Version]
- Ferrer-Lorente, R.; Bejar, M.T.; Tous, M.; Vilahur, G.; Badimon, L. Systems biology approach to identify alterations in the stem cell reservoir of subcutaneous adipose tissue in a rat model of diabetes: Effects on differentiation potential and function. Diabetologia 2014, 57, 246–256. [Google Scholar] [CrossRef] [PubMed] [Green Version]
- Gong, J.H.; Dong, J.Y.; Xie, T.; Lu, S.L. The influence of ages environment on proliferation, apoptosis, homeostasis, and endothelial cell differentiation of human adipose stem cells. Int. J. Low. Extrem. Wounds 2017, 16, 94–103. [Google Scholar] [CrossRef] [PubMed]
- Jang, M.; Kim, H.; Lea, S.; Oh, S.; Kim, J.S.; Oh, B. Effect of duration of diabetes on bone mineral density: A population study on east asian males. BMC Endocr. Disord. 2018, 18, 61. [Google Scholar] [CrossRef] [PubMed]
- Voigt, M.; Schmidt, S.; Lehmann, T.; Kohler, B.; Kloos, C.; Voigt, U.A.; Meller, D.; Wolf, G.; Muller, U.A.; Muller, N. Correction: Prevalence and progression rate of diabetic retinopathy in type 2 diabetes patients in correlation with the duration of diabetes. Exp. Clin. Endocrinol. Diabetes 2018, 126, e2. [Google Scholar] [CrossRef] [Green Version]
- Lenz, M.; Arts, I.C.W.; Peeters, R.L.M.; de Kok, T.M.; Ertaylan, G. Adipose tissue in health and disease through the lens of its building blocks. Sci. Rep. 2020, 10, 10433. [Google Scholar] [CrossRef]
- Zatterale, F.; Longo, M.; Naderi, J.; Raciti, G.A.; Desiderio, A.; Miele, C.; Beguinot, F. Chronic adipose tissue inflammation linking obesity to insulin resistance and type 2 diabetes. Front. Physiol. 2019, 10, 1607. [Google Scholar] [CrossRef]
- Henriques, F.; Bedard, A.H.; Batista, M.L.J. Adipose tissue inflammation and metabolic disorders. In Adipose Tissue Update; Szablewski, L., Ed.; IntechOpen: London, UK, 2019. [Google Scholar]
- Carrillo, J.L.M.; Campo, J.O.M.D.; Coronado, O.G.; Gutierrez, P.T.V.; Cordero, J.F.C.; Juarez, J.V. Adipose tissue and inflammation. In Adipose Tissue; Szablewski, L., Ed.; IntechOpen: London, UK, 2018. [Google Scholar]
- Athyros, V.G.; Doumas, M.; Imprialos, K.P.; Stavropoulos, K.; Georgianou, E.; Katsimardou, A.; Karagiannis, A. Diabetes and lipid metabolism. Hormones 2018, 17, 61–67. [Google Scholar] [CrossRef] [Green Version]
- Yu, C.G.; Zhang, N.; Yuan, S.S.; Ma, Y.; Yang, L.Y.; Feng, Y.M.; Zhao, D. Endothelial progenitor cells in diabetic microvascular complications: Friends or foes? Stem Cells Int. 2016, 2016, 1803989. [Google Scholar] [CrossRef] [Green Version]
- Shi, Y.; Vanhoutte, P.M. Macro- and microvascular endothelial dysfunction in diabetes. J. Diabetes 2017, 9, 434–449. [Google Scholar] [CrossRef] [PubMed] [Green Version]
- Schramm, J.C.; Dinh, T.; Veves, A. Microvascular changes in the diabetic foot. Int. J. Low. Extrem. Wounds 2006, 5, 149–159. [Google Scholar] [CrossRef]
- Chiarelli, F.; Spagnoli, A.; Basciani, F.; Tumini, S.; Mezzetti, A.; Cipollone, F.; Cuccurullo, F.; Morgese, G.; Verrotti, A. Vascular endothelial growth factor (vegf) in children, adolescents and young adults with type 1 diabetes mellitus: Relation to glycaemic control and microvascular complications. Diabet. Med. 2000, 17, 650–656. [Google Scholar] [CrossRef] [PubMed]
- Eelen, G.; Treps, L.; Li, X.; Carmeliet, P. Basic and therapeutic aspects of angiogenesis updated. Circ. Res. 2020, 127, 310–329. [Google Scholar] [CrossRef]
- Johnson, K.E.; Wilgus, T.A. Vascular endothelial growth factor and angiogenesis in the regulation of cutaneous wound repair. Adv. Wound Care 2014, 3, 647–661. [Google Scholar] [CrossRef] [Green Version]
- Lijnen, H.R.; Christiaens, V.; Scroyen, I.; Voros, G.; Tjwa, M.; Carmeliet, P.; Collen, D. Impaired adipose tissue development in mice with inactivation of placental growth factor function. Diabetes 2006, 55, 2698–2704. [Google Scholar] [CrossRef] [Green Version]
- Zarei, F.; Negahdari, B. Recent progresses in plastic surgery using adipose-derived stem cells, biomaterials and growth factors. J. Microencapsul. 2017, 34, 699–706. [Google Scholar] [CrossRef] [PubMed]
- Zhao, L.; Johnson, T.; Liu, D. Therapeutic angiogenesis of adipose-derived stem cells for ischemic diseases. Stem Cell Res. Ther. 2017, 8, 125. [Google Scholar] [CrossRef] [PubMed] [Green Version]
- Charles-de-Sa, L.; Gontijo-de-Amorim, N.F.; Takiya, C.M.; Borojevic, R.; Benati, D.; Bernardi, P.; Sbarbati, A.; Rigotti, G. Antiaging treatment of the facial skin by fat graft and adipose-derived stem cells. Plast. Reconstr. Surg. 2015, 135, 999–1009. [Google Scholar] [CrossRef] [PubMed] [Green Version]
- Gruber, H.E.; Somayaji, S.; Riley, F.; Hoelscher, G.L.; Norton, H.J.; Ingram, J.; Hanley, E.N., Jr. Human adipose-derived mesenchymal stem cells: Serial passaging, doubling time and cell senescence. Biotech. Histochem. 2012, 87, 303–311. [Google Scholar] [CrossRef] [PubMed]
- Tollervey, J.R.; Lunyak, V.V. Adult stem cells: Simply a tool for regenerative medicine or an additional piece in the puzzle of human aging? Cell Cycle 2011, 10, 4173–4176. [Google Scholar] [CrossRef] [PubMed] [Green Version]
- Tabit, C.J.; Slack, G.C.; Fan, K.; Wan, D.C.; Bradley, J.P. Fat grafting versus adipose-derived stem cell therapy: Distinguishing indications, techniques, and outcomes. Aesthetic Plast. Surg. 2012, 36, 704–713. [Google Scholar] [CrossRef] [PubMed]
- Rennert, R.C.; Sorkin, M.; Januszyk, M.; Duscher, D.; Kosaraju, R.; Chung, M.T.; Lennon, J.; Radiya-Dixit, A.; Raghvendra, S.; Maan, Z.N.; et al. Diabetes impairs the angiogenic potential of adipose-derived stem cells by selectively depleting cellular subpopulations. Stem Cell Res. Ther. 2014, 5, 79. [Google Scholar] [CrossRef] [PubMed] [Green Version]
- Dzhoyashvili, N.A.; Efimenko, A.Y.; Kochegura, T.N.; Kalinina, N.I.; Koptelova, N.V.; Sukhareva, O.Y.; Shestakova, M.V.; Akchurin, R.S.; Tkachuk, V.A.; Parfyonova, Y.V. Disturbed angiogenic activity of adipose-derived stromal cells obtained from patients with coronary artery disease and diabetes mellitus type 2. J. Transl. Med. 2014, 12, 337. [Google Scholar] [CrossRef] [PubMed] [Green Version]
- Liu, M.H.; Li, Y.; Han, L.; Zhang, Y.Y.; Wang, D.; Wang, Z.H.; Zhou, H.M.; Song, M.; Li, Y.H.; Tang, M.X.; et al. Adipose-derived stem cells were impaired in restricting cd4(+)t cell proliferation and polarization in type 2 diabetic apoe(-/-) mouse. Mol. Immunol. 2017, 87, 152–160. [Google Scholar] [CrossRef] [PubMed]
- Cramer, C.; Freisinger, E.; Jones, R.K.; Slakey, U.P.; Dupin, C.L.; Newsome, E.R.; Alt, E.U.; Izadpanah, R. Persistent high glucose concentrations alter the regenerative potential of mesenchymal stem cells. Stem Cells Dev. 2010, 19, 1875–1884. [Google Scholar] [CrossRef] [PubMed]


| Genes | Sequences (5′–3′) |
|---|---|
| R-VEGF-S | AATGATGAAGCCCTGGAGTGC |
| R-VEGF-A | TAAACCGGGATTTCTTGCGC |
| R-b-FGF-S | CCTGGCTATGAAGGAAGATGGAC |
| R-b-FGF-A | CCAGTTCGTTTCAGTGCCACAT |
| R-GAPDF-S | TTCCTACCCCCAATGTATCCG |
| R-GAPDF-A | CATGAGGTCCACCACCCTGTT |
Publisher’s Note: MDPI stays neutral with regard to jurisdictional claims in published maps and institutional affiliations. |
© 2021 by the authors. Licensee MDPI, Basel, Switzerland. This article is an open access article distributed under the terms and conditions of the Creative Commons Attribution (CC BY) license (https://creativecommons.org/licenses/by/4.0/).
Share and Cite
Wen, L.; Liu, P.; Chen, Q.; Ge, J.; Jia, B.; Li, Q. Impaired Proliferation, Apoptosis, and Angiogenesis of Adipose-Derived Stem Cells Isolated from Rats during the Course of Diabetes. Coatings 2021, 11, 1549. https://doi.org/10.3390/coatings11121549
Wen L, Liu P, Chen Q, Ge J, Jia B, Li Q. Impaired Proliferation, Apoptosis, and Angiogenesis of Adipose-Derived Stem Cells Isolated from Rats during the Course of Diabetes. Coatings. 2021; 11(12):1549. https://doi.org/10.3390/coatings11121549
Chicago/Turabian StyleWen, Lixia, Peng Liu, Qi Chen, Jiayuan Ge, Bo Jia, and Qin Li. 2021. "Impaired Proliferation, Apoptosis, and Angiogenesis of Adipose-Derived Stem Cells Isolated from Rats during the Course of Diabetes" Coatings 11, no. 12: 1549. https://doi.org/10.3390/coatings11121549
APA StyleWen, L., Liu, P., Chen, Q., Ge, J., Jia, B., & Li, Q. (2021). Impaired Proliferation, Apoptosis, and Angiogenesis of Adipose-Derived Stem Cells Isolated from Rats during the Course of Diabetes. Coatings, 11(12), 1549. https://doi.org/10.3390/coatings11121549