Abstract
Serious vibration or wear with large friction usually appear when faults occur, which leads to more serious faults such as the destruction of the oil film, bringing great damages to both the society and economic sector. Therefore, the accurate diagnosis of a fault in the early stage is important for the safety operation of machinery. To effectively extract the fault features for diagnosis, EMD-based methods are widely used. However, these methods spend lots of efforts diagnosing faults and require plenty of professional knowledge of diagnosis. Although many intelligent classifiers can be used to automatically diagnose faults such as wear, a broken tooth and imbalance, the combing EMD-based method, the scarcity of samplings with labels hinder the application of these methods to engineering. It is because the model of the intelligent classifier must be constructed based on sufficient samplings with a label. To solve this problem, we propose a novel fault diagnosis method, which is performed based on the EEMD and statistical distance analysis. In this method, the EEMD is used to decompose one original signal into several IMFs and then the probability density distribution of each IMF is calculated. To diagnose the fault of the machinery, the Euclidean distance between the signal acquired under an unknown fault with the other referenced signals acquired previously under various fault types is calculated. At last, the fault of the signal is the same with the referenced signal when the distance is the smallest. To verify the effectiveness of our proposed method, a dataset of bearings with different faults, and a dataset of 2009 Prognostics and Health Management (PHM) data challenge, including gear, bearing and shaft faults are used. The result shows that the proposed method can not only automatically diagnose faults effectively, but also fewer samplings with a label are used compared with the intelligent methods.
1. Introduction
Rotating machinery is widely used in industry and plays an important role in transmitting force, bearing load, etc. It usually operates under a tough environment and is subject to failure, which likely leads to significant economic losses or injuries. Therefore, it is necessary to monitor the health state of machinery and diagnosis defects timely and the research on fault diagnosis has attracted much attention in recent years. To inspect the condition of machinery, vibration sensors are always used for acquiring the vibration signal, which contains the health condition information. Unluckily, the machinery probably operates under a tough environment, so the useful information is always submerged in environment noise [1].
To extract the weak and useful information from the vibration signal under a low signal-to-noise ratio, many signal processing-based approaches have been proposed for fault diagnosis, such as the wavelet analysis [2], Kurtogram [3], Infogram [4] and singular value decomposition (SVD) [5]. Among these methods, the empirical mode decomposition (EMD) is one of the most used methods for fault diagnosis and has been used for gear fault diagnoses [6], bearing fault diagnoses [7] and abnormal clearance diagnoses of diesel engines [8], etc. The characteristics information of the fault can be effectively extracted using this method, because the EMD is able to decompose the complicated signals into several intrinsic model functions (IMFs), which represent the intrinsic oscillation modes embedded in the signal. Subsequently, the envelop spectrum technique can be applied to process the IMFs for finding the fault frequency. To overcome some shortcomings of the EMD, including negative frequency values, mode mixing and the lack of a rigorous mathematical formulation [9], many methods have been proposed. For example, an ensemble empirical mode decomposition (EEMD) [10], wavelet packet decomposition (WPD), local feature scale decomposition (LCD) [11], and BS-EMD [12] have also been proposed to solve the problem of mode mixing.
Although these EMD and EMD-based methods are good at extracting the impulsive signal generated by a machinery fault, it still spends lots of effort diagnosing the fault and require plenty of professional knowledge. To make full use of the merits of EMD and automatically classify the fault, many intelligent methods can be used as the classifier. Cheng et al. used the singular value decomposition (SVD) to initial feature vector matrices based on the EMD and then the support vectors machines (SVMs) trained by these features were used to distinguish the fault patterns of gears and roller bearings [13]. To achieve a better fault diagnosis performance, a more accurate SVM classifier named the multiclass transudative support vector machine (TSVM), trained by both time-domain features and time-frequency features extracted from IMFs, was applied to diagnose the gear faults [14]. Similarly, Zhang and Zhou proposed a novel procedure based on the EMD and optimized the SVM [15]. The extracted features include two types of features, the EEMD energy entropy and singular values of the matrix whose rows are IMFs. Yu et al. [16] improved the fault diagnosis performance of the SVM classifier by introducing the K-means method for selecting the most sensitive IMFs. The features, including nine time-domain features, were extracted from the most sensitive IMFs for training the SVM model.
Ali et al. [17] selected the most significant IMFs and then the chosen features, including the time features and time domain features, were used to train an artificial neural network (ANN) for classifying bearing defects. Bin et al. [18] combined the wavelet packet decomposition (WPD) and EMD to extract the fault features, and then these features were input into the classical three-layer BP neural network model for fault diagnosis. Xiao et al. [19] used an improved EMD energy entropy as the input of the SVM optimized by particle swarm optimization (PSO). A new neural network named the probability neural network (PNN) was also utilized to classify the fault models based on the features extracted from IMFs decomposed using the variational mode decomposition (VMD). The features consist of multifractal features extracted by MFDFA, and the generalized Hurst exponents and the dimension of these features were reduced by the principal component analysis (PCA) [20]. The neuro-fuzzy inference system (ANFIS) has been used as a classier for fault diagnosis by using a Fuzzy entropy as a feature [21]. Tian et al. [22] used the SVD to compress the product functions (PFs) decomposed using local mean decomposition (LMD) for obtaining the feature vectors and then these feature vectors were input into the extreme learning machine model. According to these references, it can be found that feature extraction from the decomposed components, such as IMFs or PFs, is a vital and necessary process for constructing the fault diagnosis model. Moreover, lots of samplings with labels are needed to train an accuracy model. However, it usually spends much effort extracting useful features from signals to train models and labeled signals in a practical application are scarce.
To solve this problem, a new fault diagnosis method is proposed based on the EEMD and statistic distance analysis. First, the probability density functions of the acquired signal to be analyzed are calculated. Specifically, in the proposed method, to overcome the shortcomings of the EMD, the EEMD instead of the EMD is used to decompose the vibration signal into several IMFs. The probability density function (PDF) of each IMF can then be calculated. Second, the Euclidean distance between the probability density functions (PDF) of the signal and the samplings with different fault labels can be calculated. The statistical distance (SD) can be evaluated by summing up all the distance. A small SD indicates the similarity of two signals (also small) and their corresponding machines are more likely to have the same fault type. Therefore, the fault can be diagnosed and the machines have the same fault type with the sampling when their similarity is the smallest. The SD is calculated using the probability density function of the IMFs directly and no time or time-frequency features are extracted, so it is more easy to realize the method. Moreover, because the referenced signal of the fault to be diagnosed should be provided, the number of the sampling with labels just equals the number of fault types which satisfies the requirement of a practical application. Eventually, the proposed method is more suitable for fault diagnosis, which is verified using two cases. The main contribution in this paper is that an EEMD-based method is proposed to diagnose faults more conveniently, which tries to perform fault diagnosis adaptively and with fewer training samplings than the intelligent fault diagnosis.
2. Proposed Diagnosis Model
In this section, the proposed diagnosis model was described. The proposed model consisted of four steps, including decomposing signals into IMFs using the EEMD, calculating the probability density distribution of different IMFs, computing the distance of the similarity between any two sampling, and determining the fault type using the similarity. The steps are described as follows in detail.
2.1. Decompose Signals into IMFs Using EEMD
First, signals of different types were decomposed into several IMFs using the EEMD, respectively. As a noise-assisted method, the EEMD could overcome the model mixing of the EMD.
For one signal , the EEMD could be calculated using the following six steps.
Step 1: Parameters used in the EEMD such as the trial number m and noise amplitude were initialized
Step 2: The white noise with the predefined amplitude was added to the signal and the corresponding equation was given as:
where and represent the th trial noise-assisted signal and added white noise, respectively.
Step 3: IMFs could be obtained by decomposing using the EMD algorithm for the th trial noise-assisted signal, where represents the th IMFs.
Step 4: Steps 2–3 were repeated until , but the white noise series were different between different repeats.
Step 5: The ensemble mean of the M trails was calculated for th IMFs and shown as:
Step 6: The ensemble mean could be calculated for each IMF and output the ensemble mean as the final IMF.
2.2. Calculate Probability Density Distribution of Different IMFs
Next, the probability density distribution of IMF was calculated according to:
where is the bandwidth and , represents the whole number of serial points, was taken from the corresponding IMF and denotes the non-negative kernel function which was selected as the Gaussian function in the proposed method. The Gaussian function was as follows:
2.3. Compute the SD for Evaluating Similarity between Any Two Samplings
Then, the similarity between any two IMFs (e.g., and ) could be evaluated by computing the statistical distance of their probability density distributions using the following equation:
where represents the th probability density value of th IMF, is the total number of IMFs and is the total number of serial points in each IMF. Obviously, the similarity between two signals could be measured by this distance, which considered the difference of the probability density distribution at different IMFs. In particular, the more similar two signals were, the smaller the distance was.
2.4. Determine the Fault Type Using the Similarity
Signals generated by machinery with the same fault type has a large similarity. On the contrary, the similarity of signals generated by machinery with different fault types was much smaller than the same fault type. According to this rule, the fault could be diagnosed using the proposed statistical-based distance. Specifically, the SD between one signal with an unknown fault type and referenced signals with different fault types could be calculated. Then, the fault type of the signal could be determined using the following equation:
where is the probability density function of the signal with an unknown fault type and represents the signal with the th fault type. The signal had the same fault type with the referenced signal when their statistical distance was the smallest. It could be found that only one referenced signal was used, while lots of samples should be acquired to train an intelligent model. In other words, this proposed method needed much fewer samples than the intelligent fault diagnosis method. Furthermore, the proposed method was much easier to apply to the engineering cases, which had fewer parameters to tune than the intelligent fault diagnosis methods.
3. Experimental Demonstrations
Bears and gears are two critical components used to transfer force and moment in rotary machinery, and they are easily subject to failure. In this section, data collected from bearings and gears were used to verify the effectiveness of the proposed method, respectively.
3.1. Rolling Bearing Fault Diagnosis Based on the Proposed Method
The bearing dataset of the western reserve university [23] case was used to verify the effectiveness of our proposed method. Figure 1 shows the test rig for obtaining data of various bearing faults. A 1.49 Kw, three-phase induction motor, was used to provide power, and ball bearings were installed on the left of the motor to support the motor shaft. An accelerometer with a sampling of 12 kHz was installed on the house of the motor to collect vibration signals. In this demonstration, data of various faults under different degrees were used. Specifically, 12 health conditions included (1) normal ball fault with a fault severity. Single point faults were introduced to the test bearings using electro-discharge machining with fault diameters of 7 mils, 14 mils, 21 mils, 28 mils, and 40 mils (1 mil = 0.001 inches). The fault severity was evaluated by the defect size, including (2) 0.007 inches, (3) 0.014 inches, (4) 0.021 inches, and (5) 0.028 inches, an inner ring fault with a fault severity of (6) 0.007 inches, (7) 0.014 inches, (8) 0.021 inches, and (9) 0.028 inches, and an outer rolling fault with a fault severity of (10) 0.007 inches, (11) 0.014 inches, and (12) 0.021 inches. The vibration signals of each fault were divided into 20 segments and each segment had 5000 sampling points. These segments could be considered as different samples with different faults.
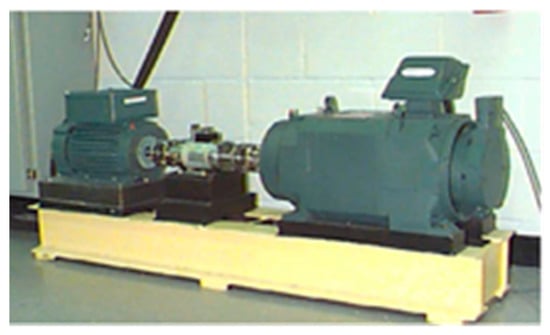
Figure 1.
The bearing test rig.
These datasets with a total of 240 samples were used to verify the proposed method. In total, 12 samples with the whole fault types were used as the referenced data. The other samples were used to test the effectiveness of the proposed method. For example, the SD between the samples of the third condition (ball fault with a severity of 0.014) and the 12 referenced samples of different types were calculated. For instance, Figure 2 shows the statistical distance between the probability density distribution of 12 referenced samples between that of the whole normal samples. The SD of the same fault type was plotted using the same curve. The curve labeled with the blue cross plotted the SD between the data of a normal condition and the referenced data of a normal condition. Sample one was just the referenced sample, so its SD was zero. Furthermore, it can be found that the SD between the referenced sample with the whole samples had the smallest SD compared with the other referenced samples, which was plotted using the curve labeled with a blue cross. As a result, these samples could be classified as the type of the second condition, which was consistent with the fact. Similarly, the fault types of the other samples could be distinguished. The corresponding results can be seen from Figure 2j to Figure 2l. The accuracy of different fault types was calculated and presented in Figure 3. In Figure 2e, the number of the samples in testing was 20 and we calculated the SD of these samples with referenced signals of different faults. Obviously, the SD between each sample with the referenced signal of inner ring fault with a fault severity of 0.007 was the smallest. According to the proposed method, we could infer that the fault types of these samples were inner ring faults with a fault severity of 0.007. Obviously, the result was consistent with the fact, so the accuracy of the proposed method for Figure 2e was 100%. Of course, in some figures, the result was not very good, for example, Figure 2j, but the result was still higher than 60%. By calculating all the samples of different types, we could obtain the mean accuracy. It could be found that the mean accuracy of the whole samples was 87%, which was a satisfying result when the samples with labels were very scarce.
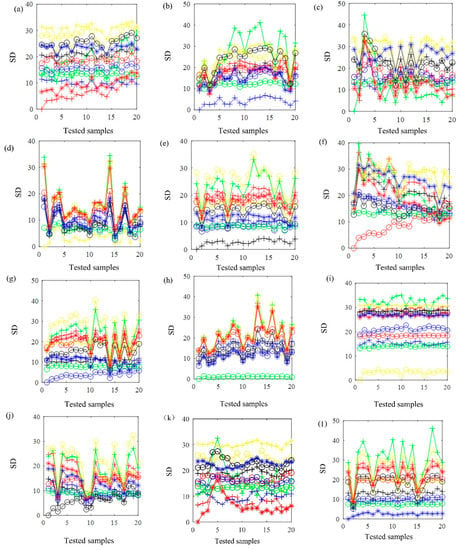
Figure 2.
The SD between various referenced samples and different samples, including (a) ball fault with fault severity of 0.007, (b) ball fault with fault severity of 0.014, (c) ball fault with fault severity of 0.021, (d) ball fault with fault severity of 0.028, (e) inner ring fault with fault severity of 0.007, (f) inner ring fault with fault severity of 0.014, (g) inner ring fault with fault severity of 0.021, (h) inner ring fault with fault severity of 0.028, (i) normal, (j) outer rolling fault with fault severity of 0.007, (k) outer rolling fault with fault severity of (10) 0.014, and (l) outer rolling fault with fault severity of 0.021.
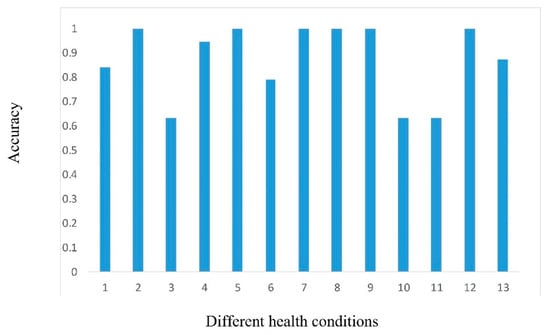
Figure 3.
The diagnosis result of (1) ball fault with fault severity of 0.007, (2) ball fault with fault severity of 0.014, (3) ball fault with fault severity of 0.021, (4) ball fault with fault severity of 0.028, (5) inner ring fault with fault severity of 0.007, (6) inner ring fault with fault severity of 0.014, (7) inner ring fault with fault severity of 0.021, (8) inner ring fault with fault severity of 0.028, (9) normal, (10) outer rolling fault with fault severity of 0.007, (11) outer rolling fault with fault severity of 0.014, (12) outer rolling fault with fault severity of 0.021, and (13) the mean accuracy.
3.2. Fault Diagnosis of Gear Based on the Proposed Method
In this section, the vibration signals of spur gears with different faults were used to verify the effectiveness of the proposed method further. These data can be found in the 2009 PHM Challenge Competition [24]. Figure 4 shows the experiment setup which mainly consisted of one electric motor, four gears, six bearings, etc. The rotating frequency of the input shaft was 34.5 Hz and the tooth numbers of gears was 32, 96, 48, and 80, respectively. Two accelerometers were installed on both sides of the experiment setup to acquire the vibration data with a sampling frequency of 100/3 kHz. Different fault models such as NF (no fault), CH (chipped tooth), BR (broken tooth), ER (error), BS (ball spin fault), IR (inner race fault), OR (outer race fault), BA (bent axle), SI (shaft imbalance) and BK (bad key) were provided in this experiment. It was important to diagnose these faults as soon as possible, and if the equipment operated with faults, seriously vibrations would be generated and the friction of the surface between different components would become larger. The oil film would be destructed and more serious faults usually appeared.
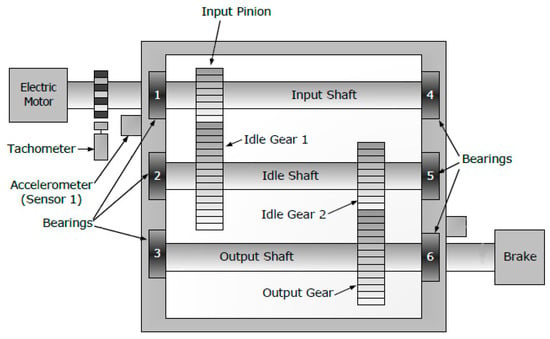
Figure 4.
The experiment setup.
The final obtained dataset consisted of eight fault types. Concretely, these types were as follows: (1) normal, (2) input gear with CH and Idle 2 with ER, (3) Idle 2 with ER, (4) Idle 2 with ER, output with BR, and bearing one with BS, (5) input gear with CH, Idle 2 with ER, output with BR, bearing one with IR, bearing two with BS, bearing three with OR, (6) output with BR, bearing one with IR, bearing two with BS, bearing three with OR, Shafts input with SI, (7) bearing one with IR, shafts output with BK, and (8) bearing two with BS, bearing three with OR inputs(shafts) with BA.
Similar to case A, the different samples were obtained by dividing the vibration signals into different segments, each of which had 5000 segments. Therefore, a total of 320 samples could be obtained and eight samples with different fault types were considered as the referenced data in the proposed method. The statistical distance between the diagnosed samples with various faults and the referenced samples are plotted in Figure 5. The accuracy of all the diagnosis results was also calculated and the corresponding accuracy of various types as well as the mean accuracy can be seen in Figure 6. The mean accuracy of the whole samples was 87%, which also verified the effectiveness of the proposed method in fault diagnosing.
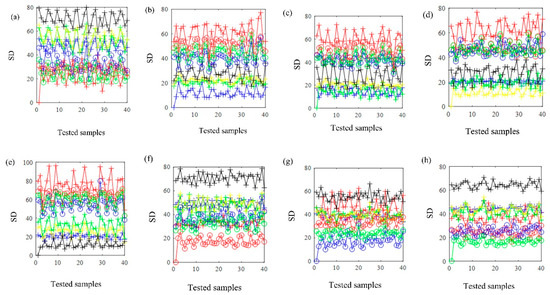
Figure 5.
The SD between various referenced samples and different samples, including (a) normal, (b) input gear with CH and Idle 2 with ER, (c) Idle 2 with ER, (d) Idle 2 with ER, output with BR, and bearing 1 with BS, (e) input gear with CH, Idle 2 with ER, output with BR, bearing 1 with IR, bearing 2 with BS, bearing 3 with OR, (f) output with BR, bearing 1 with IR, bearing 2 with BS, bearing 3 with OR, Shafts input with SI, (g) bearing 1 with IR, shafts output with BK, and (h) bearing 2 with BS, bearing 3 with OR inputs(shafts) with BA.
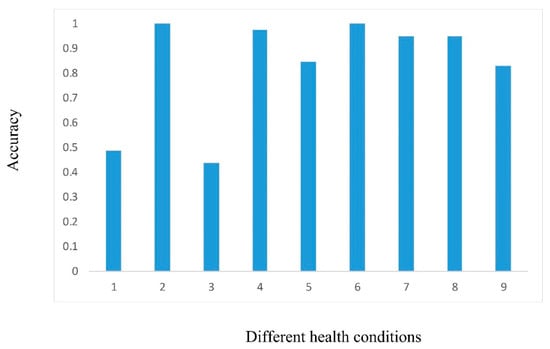
Figure 6.
The diagnosis result of (1) normal, (2) input gear with CH and Idle 2 with ER, (3) Idle 2 with ER, (4) Idle 2 with ER, output with BR, and bearing 1 with BS, (5) input gear with CH, Idle 2 with ER, output with BR, bearing 1 with IR, bearing 2 with BS, bearing 3 with OR, (6) output with BR, bearing 1 with IR, bearing 2 with BS, bearing 3 with OR, Shafts input with SI, (7) bearing 1 with IR, shafts output with BK, (8) bearing 2 with BS, bearing 3 with OR inputs(shafts) with BA, and (9) the mean accuracy.
4. Conclusions
In this paper, an EMD-based statistic distance was proposed for the fault diagnosis of machinery. The proposed method made good use of the merit of the EEMD. Furthermore, a fault could be automatically diagnosed, which needed much fewer samples with labels than the intelligent method. The similarity of one signal between the referenced samples collected from the machinery with various faults could be accuracy evaluated. As a result, the signal had the same type with the referenced sample when they were most similar. The effectiveness of the proposed method was demonstrated by two real cases, including a bearing dataset and composite dataset of bearings and gears. It could be found that satisfying results were obtained even when there were a few samples with labels. Consequently, the proposed method can be further used in engineering, which will be considered in our further work.
Author Contributions
Data curation, T.Z.; Resources, P.H.; Software, P.H.; Writing—original draft, T.W.; Writing—review & editing, L.Z. All authors have read and agreed to the published version of the manuscript.
Funding
This work was supported in part by the Science and Technology Key Project of Henan province under Grant No. 212102210520 and 202102210370, and the Science and Technology Key Project in the High-tech Fields of Henan province, grant no. 152102210123.
Institutional Review Board Statement
Not applicable.
Informed Consent Statement
Not applicable.
Data Availability Statement
The data used to support the findings of this study are available from the corresponding author upon request.
Conflicts of Interest
The authors declare that they have no conflict of interest.
References
- Lee, J.; Wu, F.; Zhao, W.; Ghaffari, M.; Liao, L.; Siegel, D. Prognostics and health management design for rotary machinery systems—Reviews, methodology and applications. Mech. Syst. Signal Process. 2014, 42, 314–334. [Google Scholar] [CrossRef]
- Huo, Z.; Zhang, Y.; Francq, P.; Shu, L.; Huang, J. Incipient fault diagnosis of roller bearing using optimized wavelet transform based multispeed vibration signatures. IEEE Access 2017, 5, 19442–19456. [Google Scholar] [CrossRef] [Green Version]
- Antoni, J. Fast computation of the kurtogram for the detection of transient faults. Mech. Syst. Signal Process. 2007, 21, 108–124. [Google Scholar] [CrossRef]
- Antoni, J. The infogram: Entropic evidence of the signature of repetitive transients. Mech. Syst. Signal Process. 2016, 74, 73–94. [Google Scholar] [CrossRef]
- Qiao, Z.; Pan, Z. SVD principle analysis and fault diagnosis for bearings based on the correlation coefficient. Meas. Sci. Technol. 2015, 26, 1–15. [Google Scholar] [CrossRef] [Green Version]
- Li, Y.; Xu, M.; Wei, Y.; Huang, W. An improvement EMD method based on the optimized rational Hermite interpolation approach and its application to gear fault diagnosis. Measurement 2015, 63, 330–345. [Google Scholar] [CrossRef]
- Tsao, W.-C.; Li, Y.-F.; Le, D.D.; Pan, M.-C. An insight concept to select appropriate IMFs for envelope analysis of bearing fault diagnosis. Measurement 2012, 45, 1489–1498. [Google Scholar] [CrossRef]
- Li, Y.; Tse, P.; Yang, X.; Yang, J. EMD-based fault diagnosis for abnormal clearance between contacting components in a diesel engine. Mech. Syst. Signal Process. 2010, 24, 193–210. [Google Scholar] [CrossRef]
- Feng, Z.; Zhang, D.; Zuo, M. Adaptive mode decomposition methods and their applications in signal analysis for machinery fault diagnosis: A review with examples. IEEE Access 2017, 5, 24301–24331. [Google Scholar] [CrossRef]
- Jiang, H.; Li, C.; Li, H. An improved EEMD with multiwavelet packet for rotating machinery multi-fault diagnosis. Mech. Syst. Signal Process. 2013, 36, 225–239. [Google Scholar] [CrossRef]
- Tong, Q.; Cao, J.; Han, B.; Zhang, X.; Nie, Z.; Wang, J.; Lin, Y.; Zhang, W. A fault diagnosis approach for rolling element bearings based on RSGWPT-LCD bilayer screening and extreme learning machine. IEEE Access 2017, 5, 5515–5530. [Google Scholar] [CrossRef]
- Saidi, L.; Ali, J.B.; Fnaiech, F. Bi-spectrum based-EMD applied to the non-stationary vibration signals for bearing faults diagnosis. ISA Trans. 2014, 53, 1650–1660. [Google Scholar] [CrossRef] [PubMed]
- Cheng, J.; Yu, D.; Tang, J.; Yang, Y. Application of SVM and SVD technique based on EMD to the fault diagnosis of the rotating machinery. Shock Vib. 2009, 16, 89–98. [Google Scholar] [CrossRef]
- Shen, Z.; Chen, X.; Zhang, X.; He, Z. A novel intelligent gear fault diagnosis model based on EMD and multi-class TSVM. Measurement 2012, 45, 30–40. [Google Scholar] [CrossRef]
- Zhang, X.; Zhou, J. Multi-fault diagnosis for rolling element bearings based on ensemble empirical mode decomposition and optimized support vector machines. Mech. Syst. Signal Process. 2013, 41, 127–140. [Google Scholar] [CrossRef]
- Yu, X.; Dong, F.; Ding, E.; Wu, S.; Fan, C. Rolling bearing fault diagnosis using modified LFDA and EMD with sensitive feature selection. IEEE Access 2017, 6, 3715–3730. [Google Scholar] [CrossRef]
- Ali, J.B.; Fnaiech, N.; Saidi, L.; Chebel-Morello, B.; Fnaiech, F. Application of empirical mode decomposition and artificial neural network for automatic bearing fault diagnosis based on vibration signals. Appl. Acoust. 2015, 89, 16–27. [Google Scholar]
- Bin, G.F.; Gao, J.J.; Li, X.J.; Dhillon, B.S. Early fault diagnosis of rotating machinery based on wavelet packets—Empirical mode decomposition feature extraction and neural network. Mech. Syst. Signal Process. 2012, 27, 696–711. [Google Scholar] [CrossRef]
- Xiao, Y.; Kang, N.; Hong, Y.; Zhang, G. Misalignment fault diagnosis of DFWT based on IEMD energy entropy and PSO-SVM. Entropy 2017, 19, 6. [Google Scholar] [CrossRef]
- Liu, H.; Jing, J.; Ma, J. Fault diagnosis of electromechanical actuator based on VMD multifractal detrended fluctuation analysis and PNN. Complexity 2018, 2018, 1–11. [Google Scholar] [CrossRef] [Green Version]
- Zheng, J.; Cheng, J.; Yang, Y. A rolling bearing fault diagnosis approach based on LCD and fuzzy entropy. Mech. Mach. Theory 2013, 70, 441–453. [Google Scholar] [CrossRef]
- Tian, Y.; Ma, J.; Lu, C.; Wang, Z. Rolling bearing fault diagnosis under variable conditions using LMD-SVD and extreme learning machine. Mech. Mach. Theory 2015, 90, 175–186. [Google Scholar] [CrossRef]
- Case Western Reserve University Bearing Data Center, “Bearing Data Center”. Available online: http://csegroups.case.edu/bearingdatacenter/home (accessed on 15 July 2017).
- PHM09 Data Challenge, “Prognostic Health Management Challenge”. Available online: http://www.phmsociety.org/references/datasets (accessed on 28 September 2019).
Publisher’s Note: MDPI stays neutral with regard to jurisdictional claims in published maps and institutional affiliations. |
© 2021 by the authors. Licensee MDPI, Basel, Switzerland. This article is an open access article distributed under the terms and conditions of the Creative Commons Attribution (CC BY) license (https://creativecommons.org/licenses/by/4.0/).