
Well Rehabilitation via the Ultrasonic Method and Evaluation of Its Effectiveness from the Pumping Test


Abstract
:1. Introduction
2. Materials and Methods
2.1. Ultrasound
- Mechanical (small tuning forks and whistles: low frequency and power);
- Magnetostrictive (oscillations around an iron rod in the magnetic field of an electromagnet powered by alternating current: high power but with a frequency only up to 100 kHz—used in dentistry and surgery);
- Piezoelectric (a silicon wafer connected to electrodes with an alternating voltage applied that oscillates at the same frequency as the voltage, converting the energy from electrical into mechanical energy that vibrates the surrounding environment—used for diagnostic and therapeutic purposes).
- Thermal effects: The energy of the wave is directly proportional to the square of the frequency. There is considerable absorption at the interface of tissues with different levels of acoustic impedance (soft tissue X bone = periosteal pain).
- Mechanical effects: Passage of the ultrasound wave through the environment results in local pressure changes (MPa/mm). Mechanical waves, and therefore sound, propagate in all states of matter through bonds between particles. When the energy of the oscillatory motion is transferred to adjacent particles and results in propagation of the oscillation, then the medium is characterized as elastic.
- Physicochemical: Ultrasound has dispersive effects, which means that fine suspensions, emulsions, foams, etc. can be prepared with its power in addition to coagulative effects (e.g., used for cleaning gases).
- Biological: Up to an intensity of 3 W/cm2, ultrasound has biopositive effects, such as the acceleration of metabolic exchange. At intensities greater than 3 W/cm2, these effects result in irreversible morphological changes, such as breakdown of the cell nucleus and the thermal coagulation of proteins.
- The removal of hard encrustations due to differences in the deformation of the grains of the gravel filter and surface precipitants. This is caused by the difference in mechanical deformation at the material interface.
- The liquefaction of organic molecules through mechanical stress caused by ultrasound transforms of large organic molecules into smaller ones. This process yields a certain degree of lethality for viruses and bacteria.
- Ultrasound energy leads to movements in the molecular structure of the encrustation. Consequently, abrasion occurs within the gravel, which grinds away the coating.
- Cavitation. The so-called cavitation effect is effective up to a depth of approximately 50 m. Cavitation removes material adhering to the gravel surface.
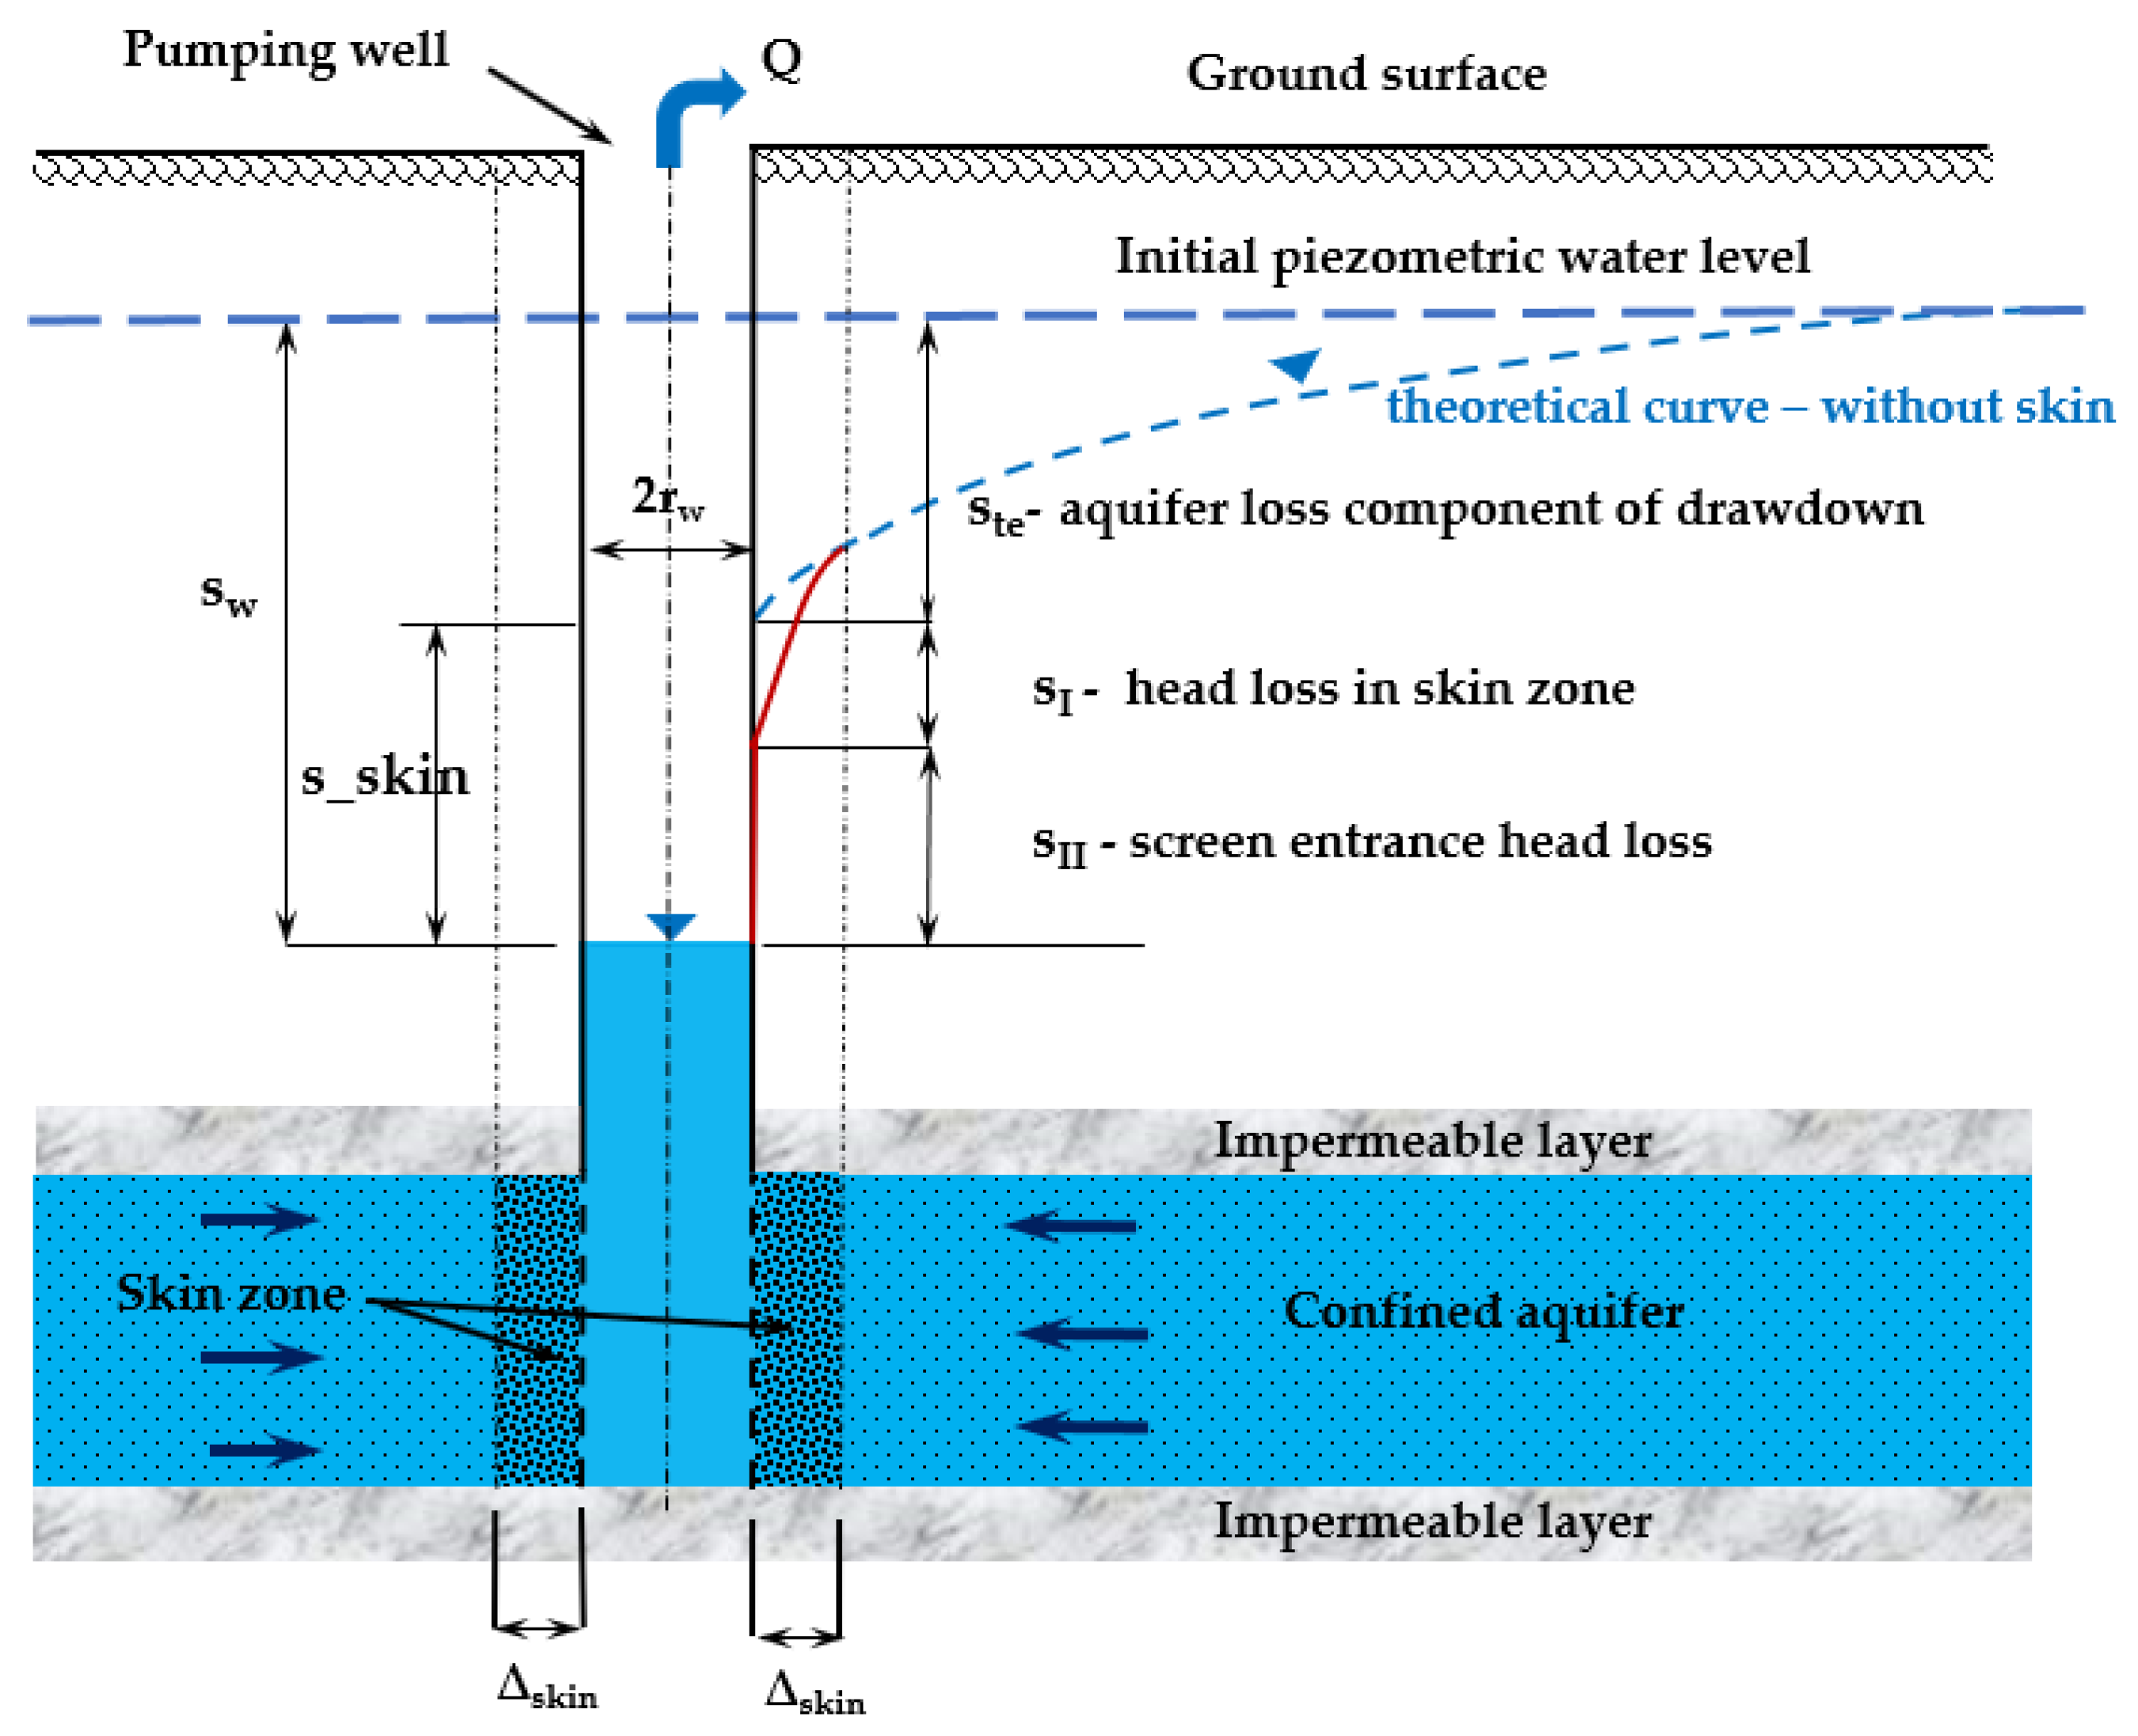
2.2. Additional Resistances
- -
- Dimensionless time
- -
- Dimensionless radius
- -
- Dimensionless drawdown
- -
- Dimensionless drawdown at a well
- -
- Dimensionless wellbore storage [8]
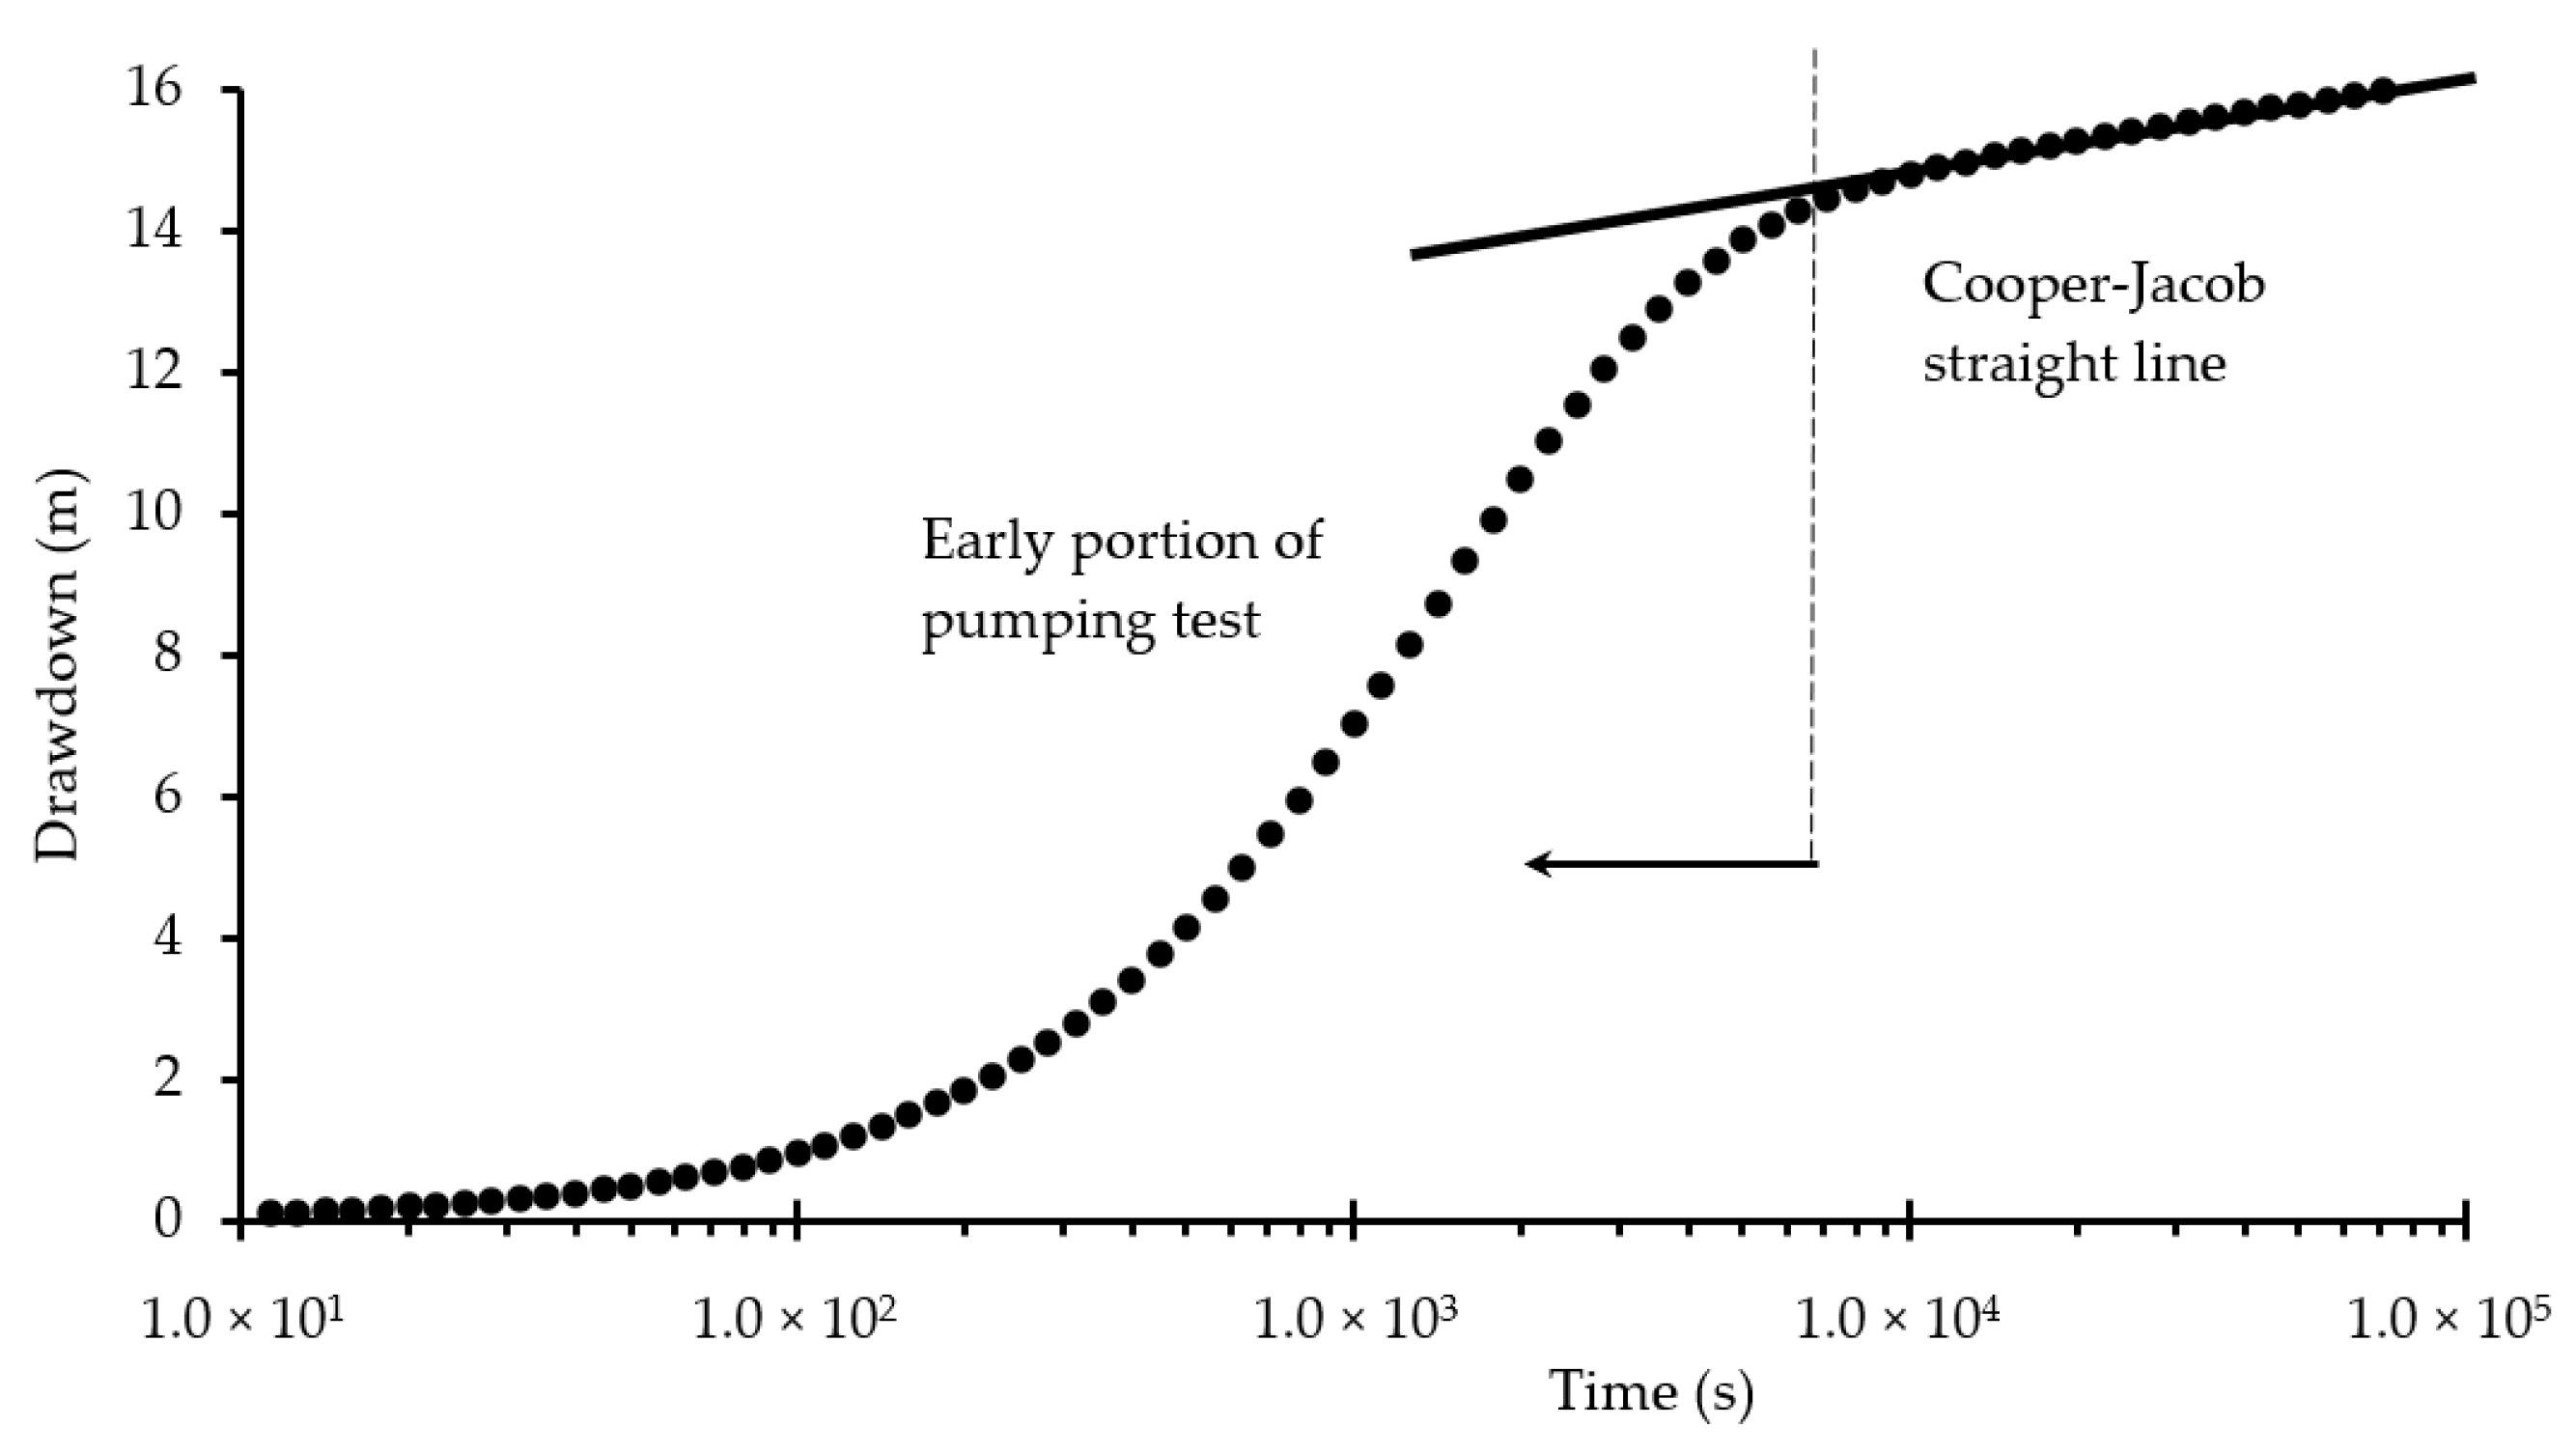
3. Results
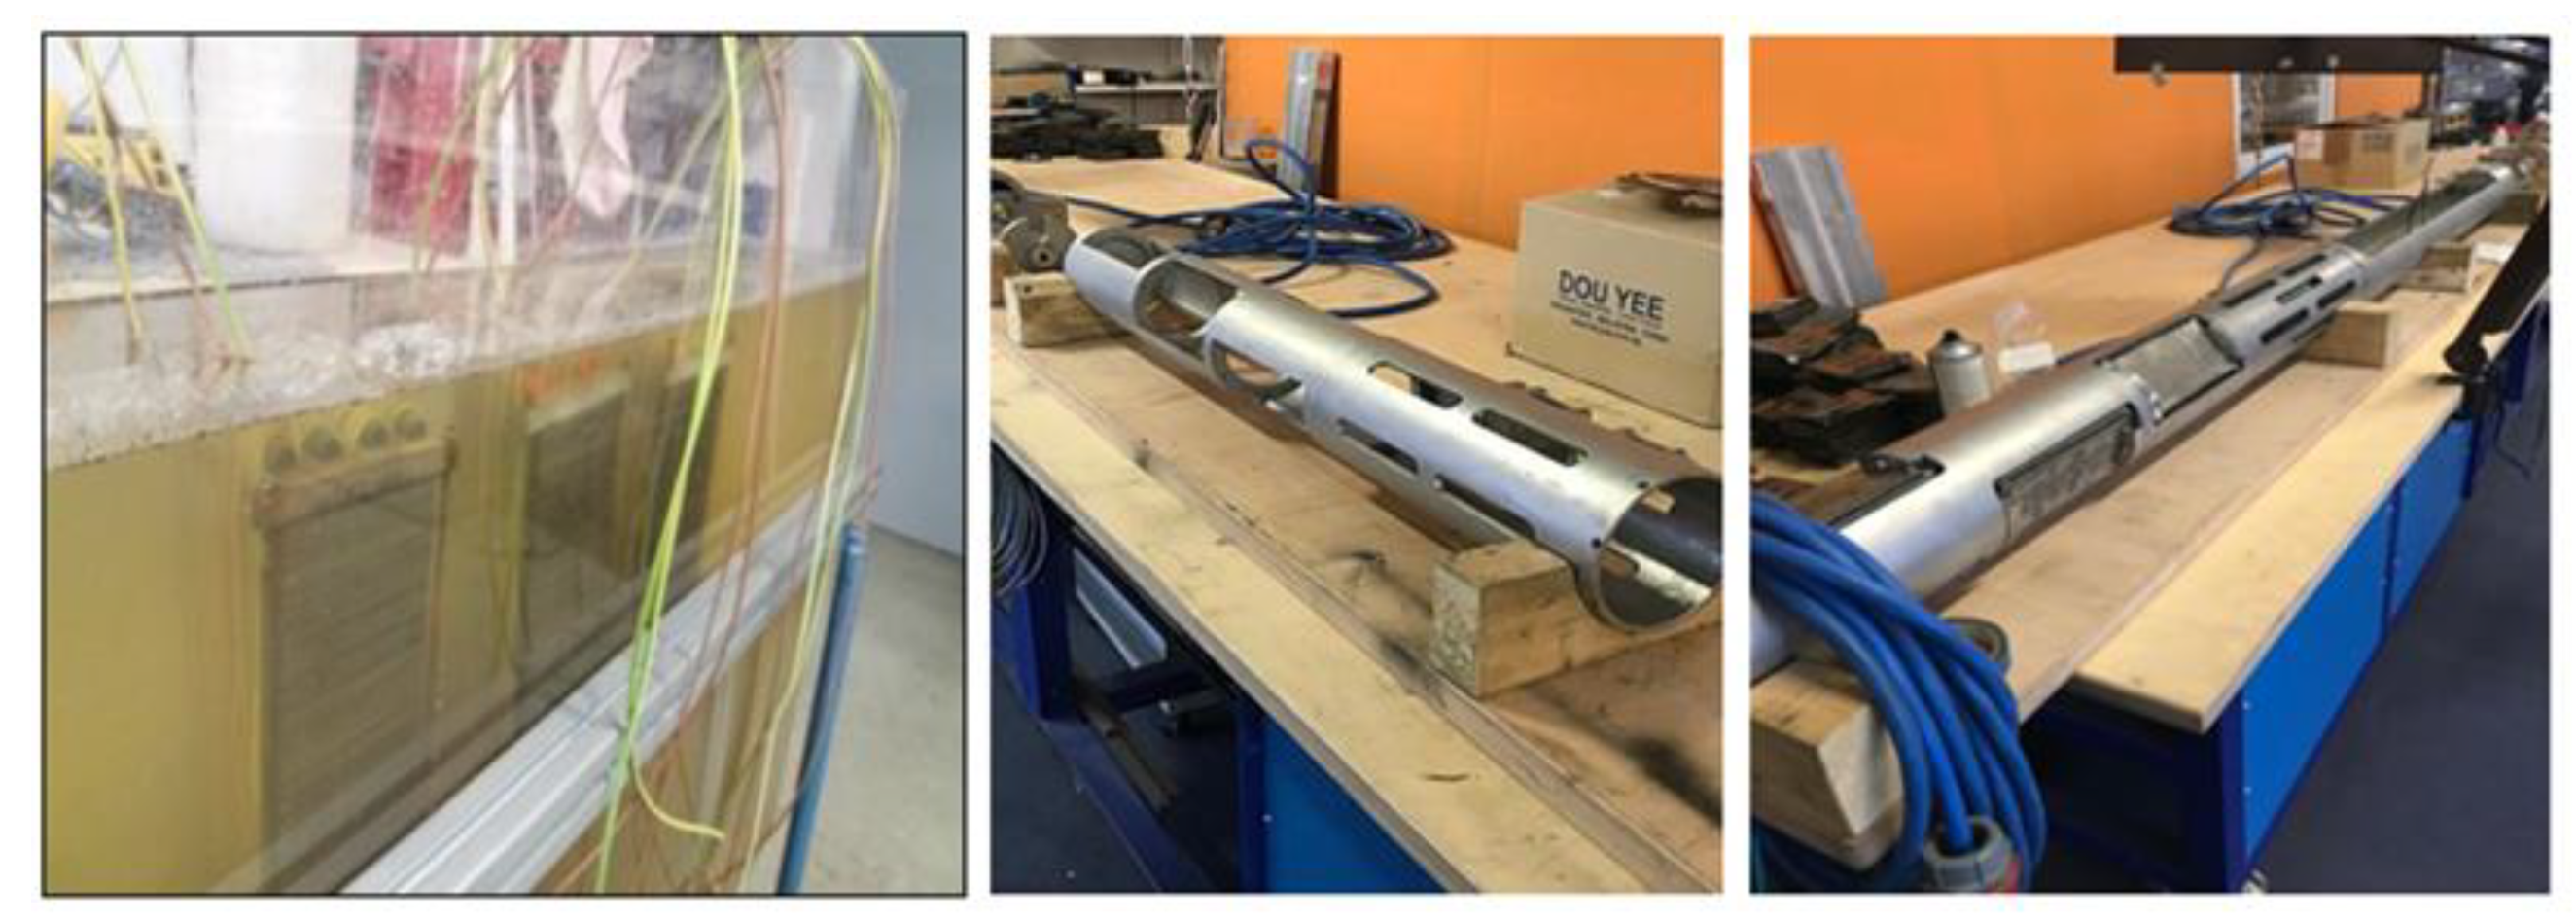
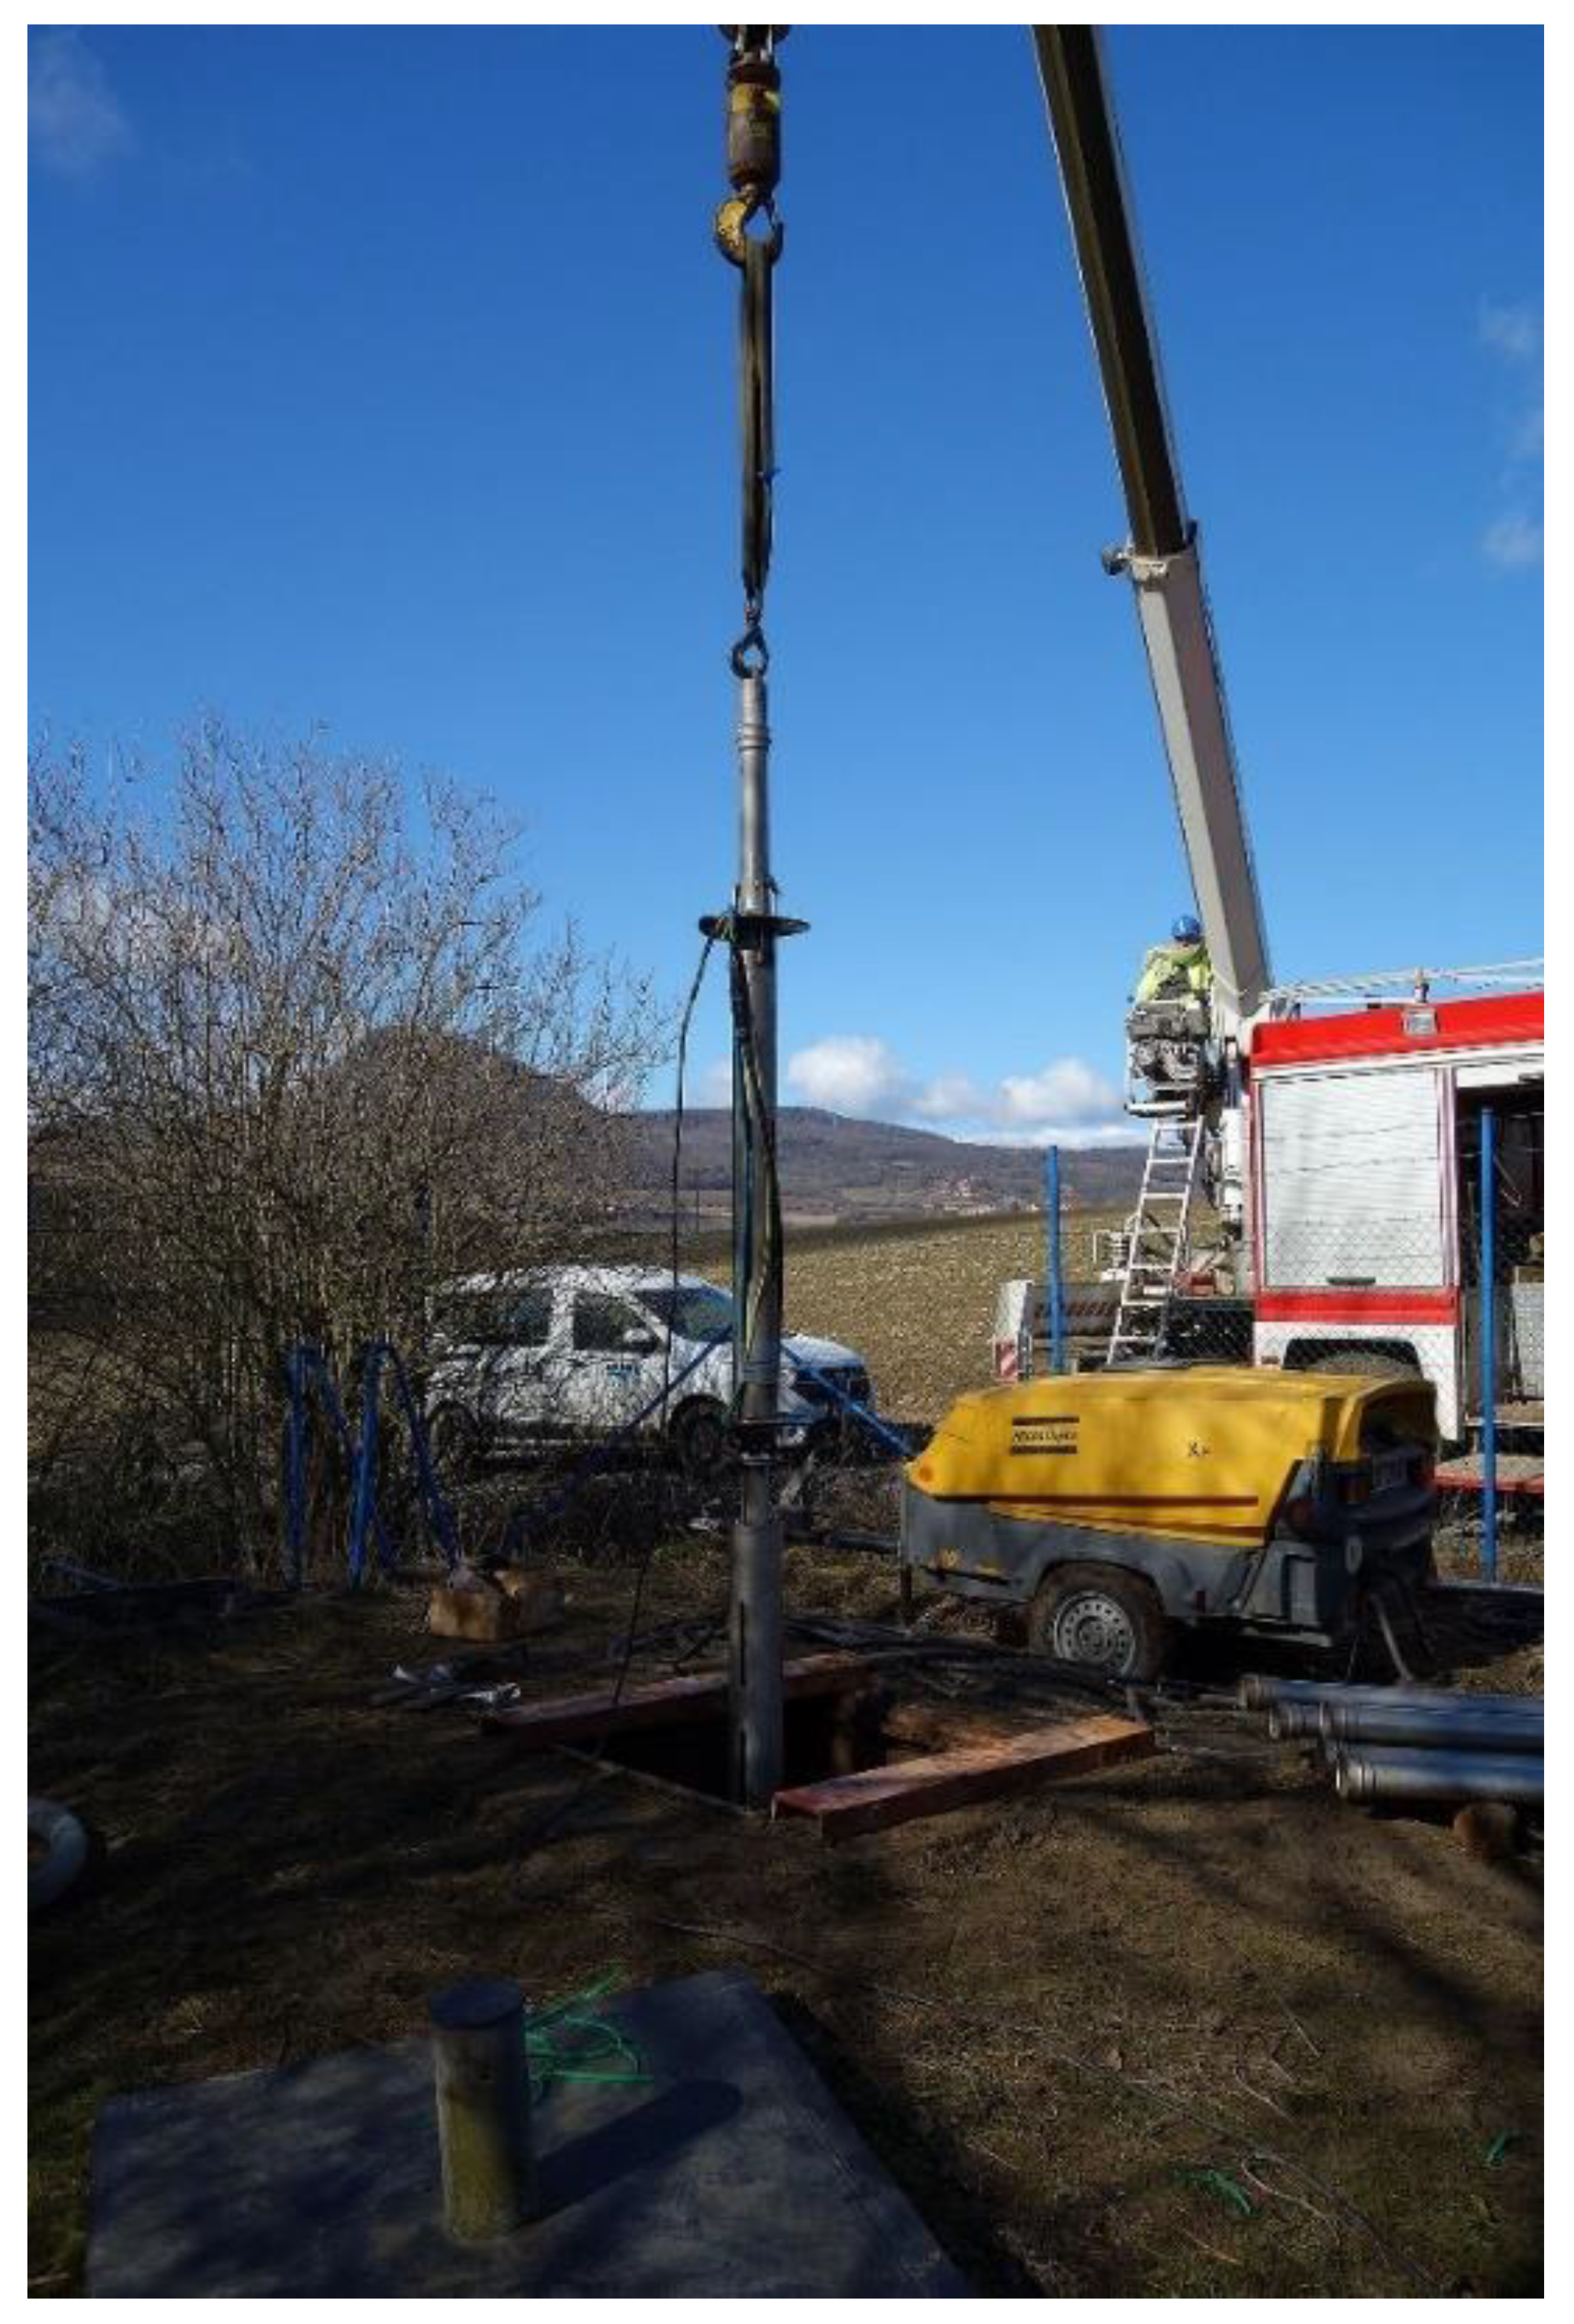
3.1. Development of Ultrasonic Well Recovery Equipment
3.2. Machine Platform
- A crane with minimum lifting capacity of 2500 kg, possible movement in two axes, and minimum lifting capacity height of 12 m;
- An AC power generator with an effective power of 40 kW and 32 A;
- A machine winch for the power cables of the ultrasonic emitters;
- A steel pipe assembly with a total length of 200 m;
- The possibility to connect a towed compressor.
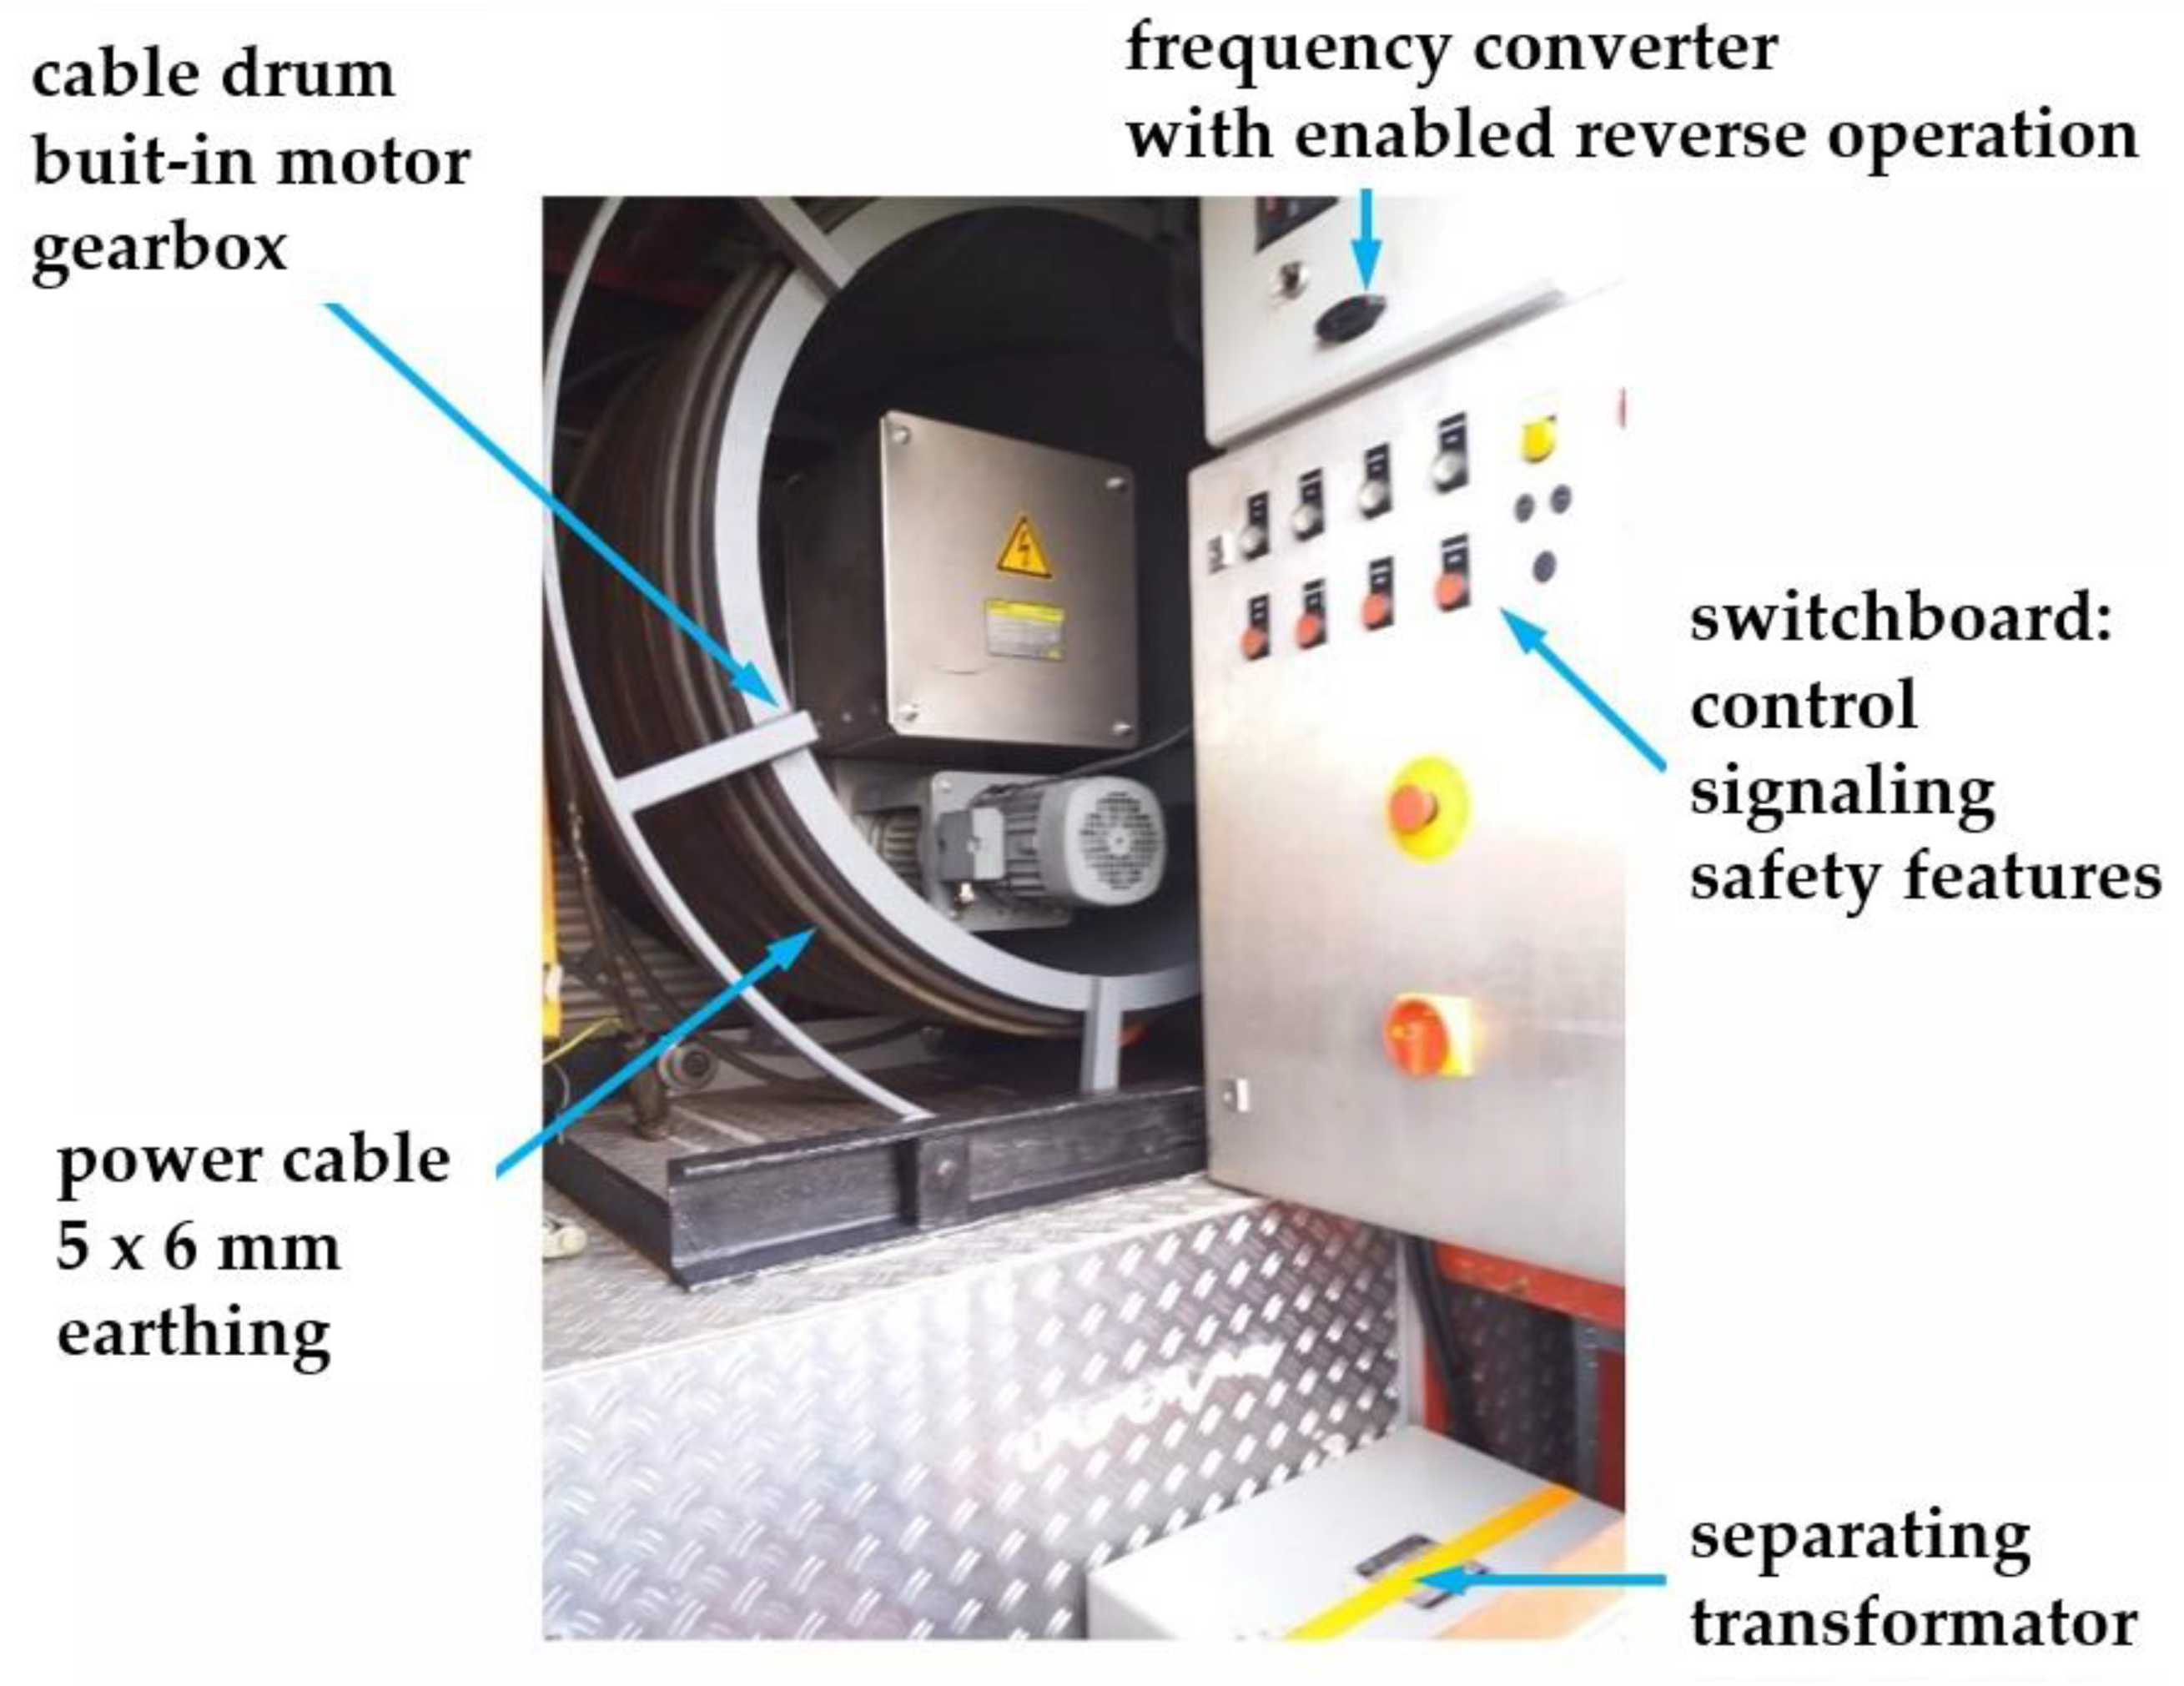
Controls and Safety Features
- Electrical switchboard—This device allows the transfer of power energy from its own aggregate or an external source to the ultrasonic emitters and the operating pump. This switchboard is equipped with control and monitoring elements for operation of the individual emitters, controls, and pump controls, as well as integral safety elements for (a) manual and (b) automatic stopping of the cable winding in cases that exceed the safe tension force.
- Power cable: Based on the calculated dimensions for the transmission of 15 kW of ultrasonic power from the emitter and submersible pump, we used a 5 m × 6 m power cable with a grounding option.
3.3. Field Deployment of the Ultrasonic Equipment during the MO-4 Well Rehabilitation and Evaluation of the Effects of the Rehabilitation Intervention
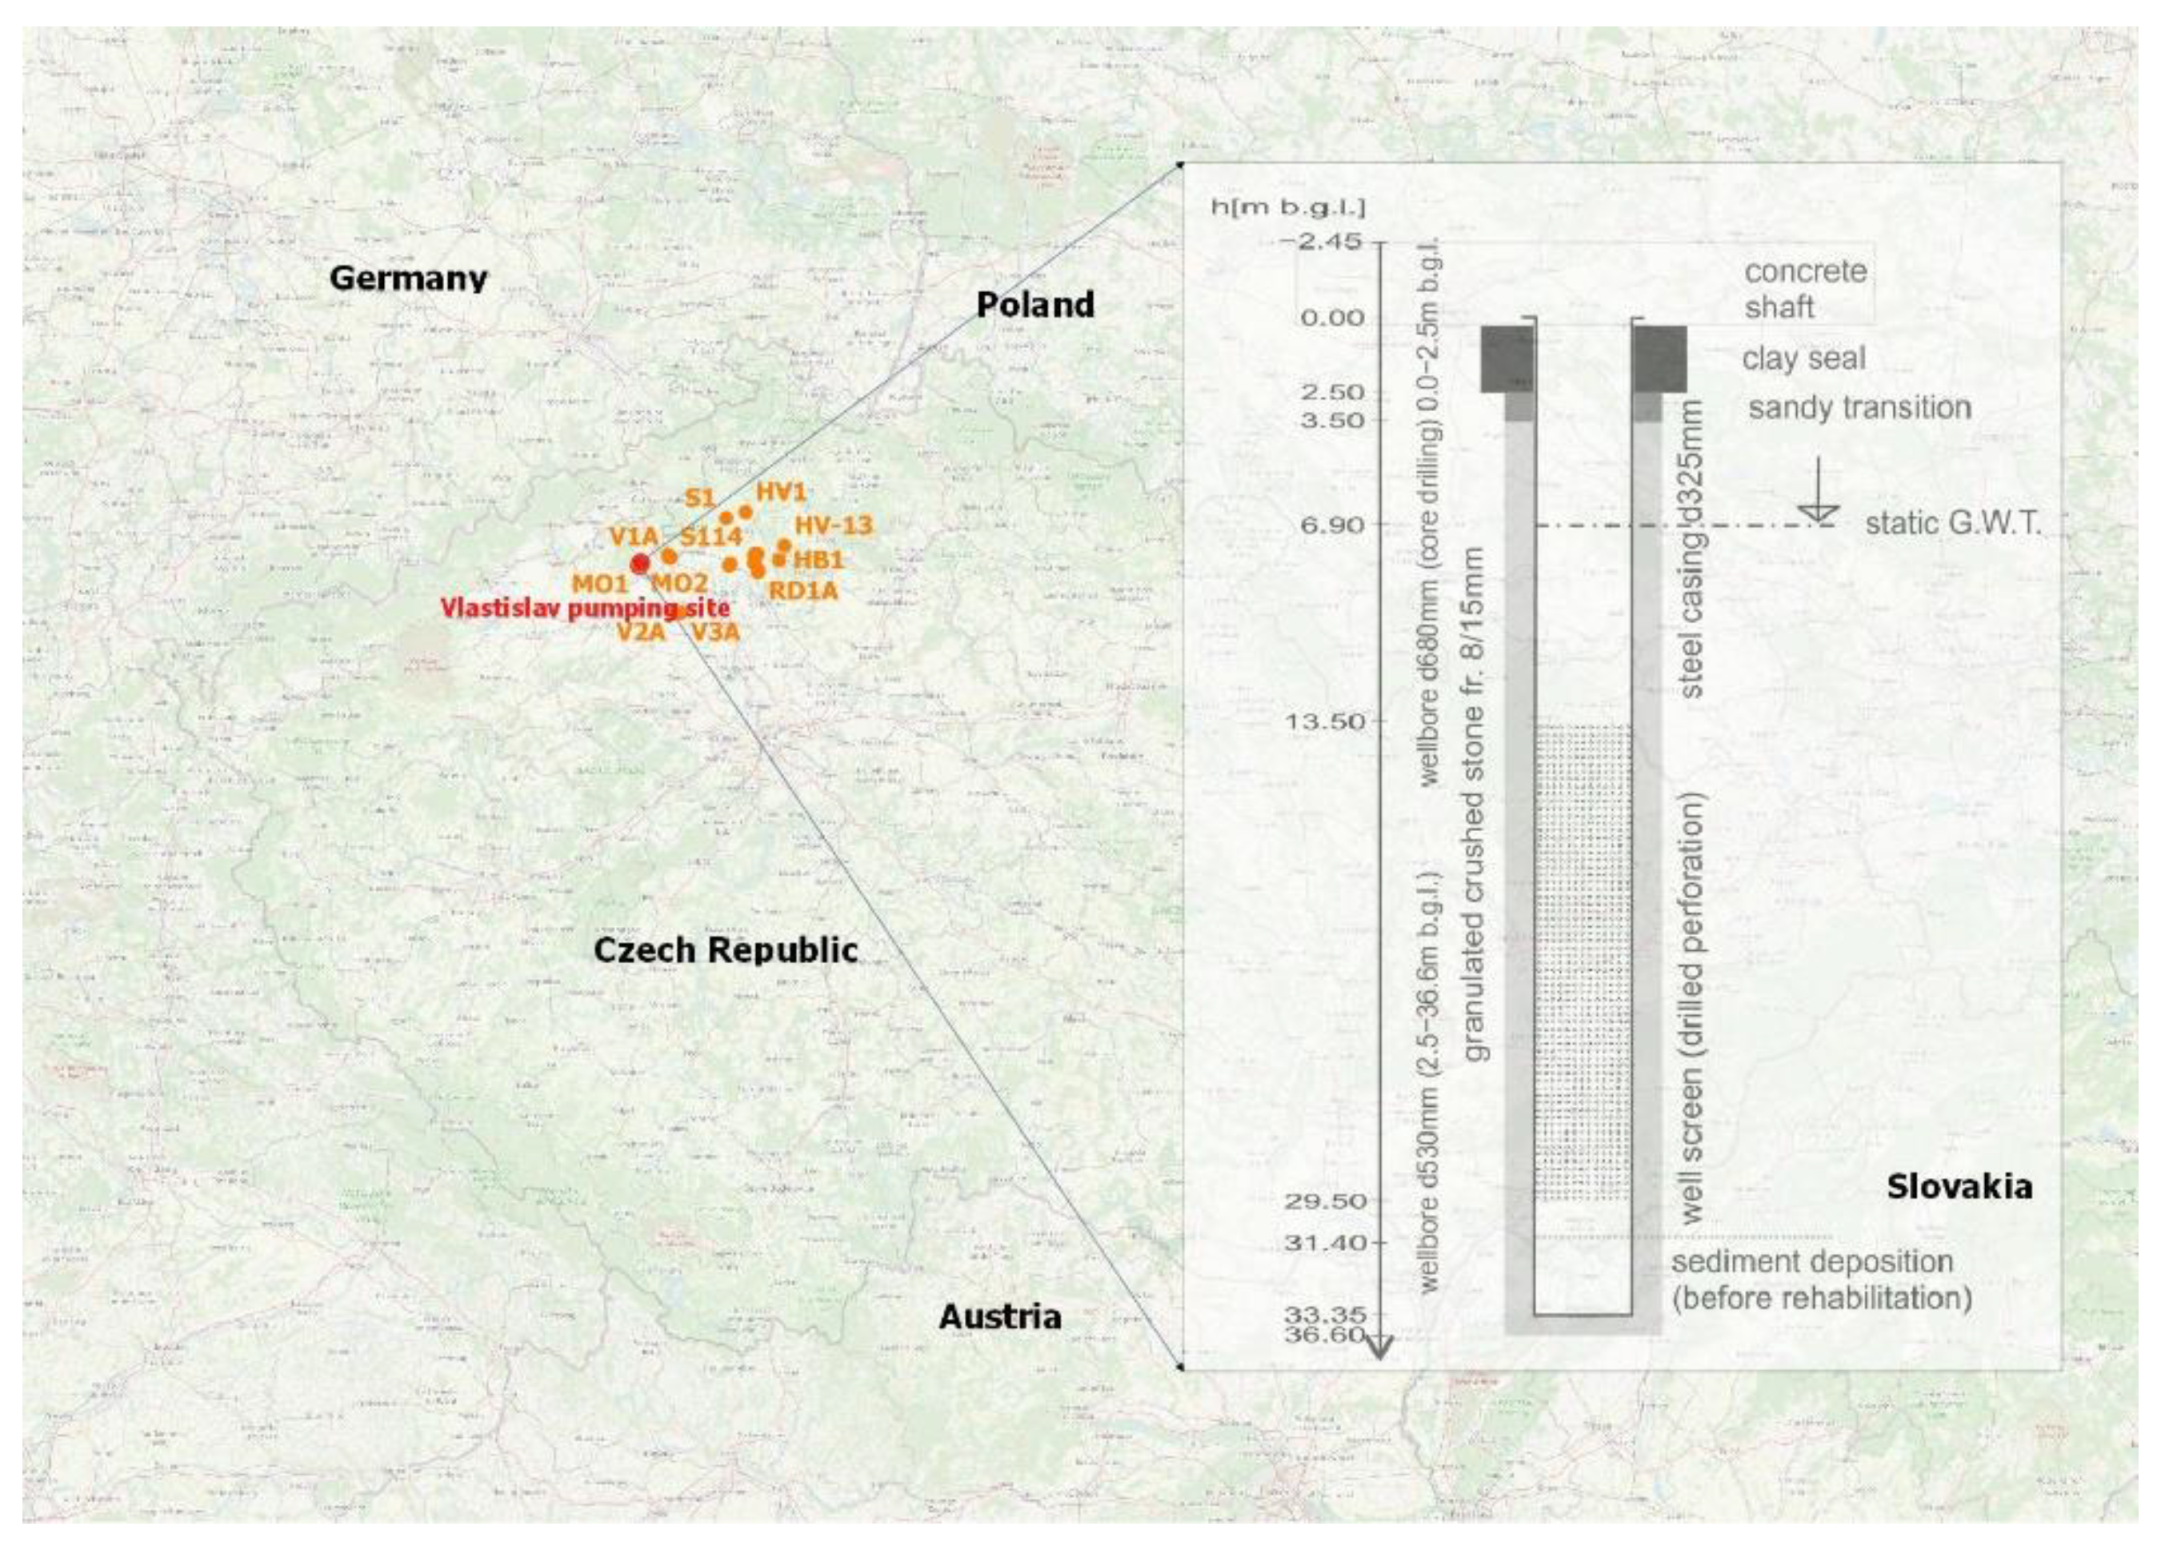
3.3.1. Case Study
3.3.2. Geology and Lithology
3.4. Well Rehabilitation
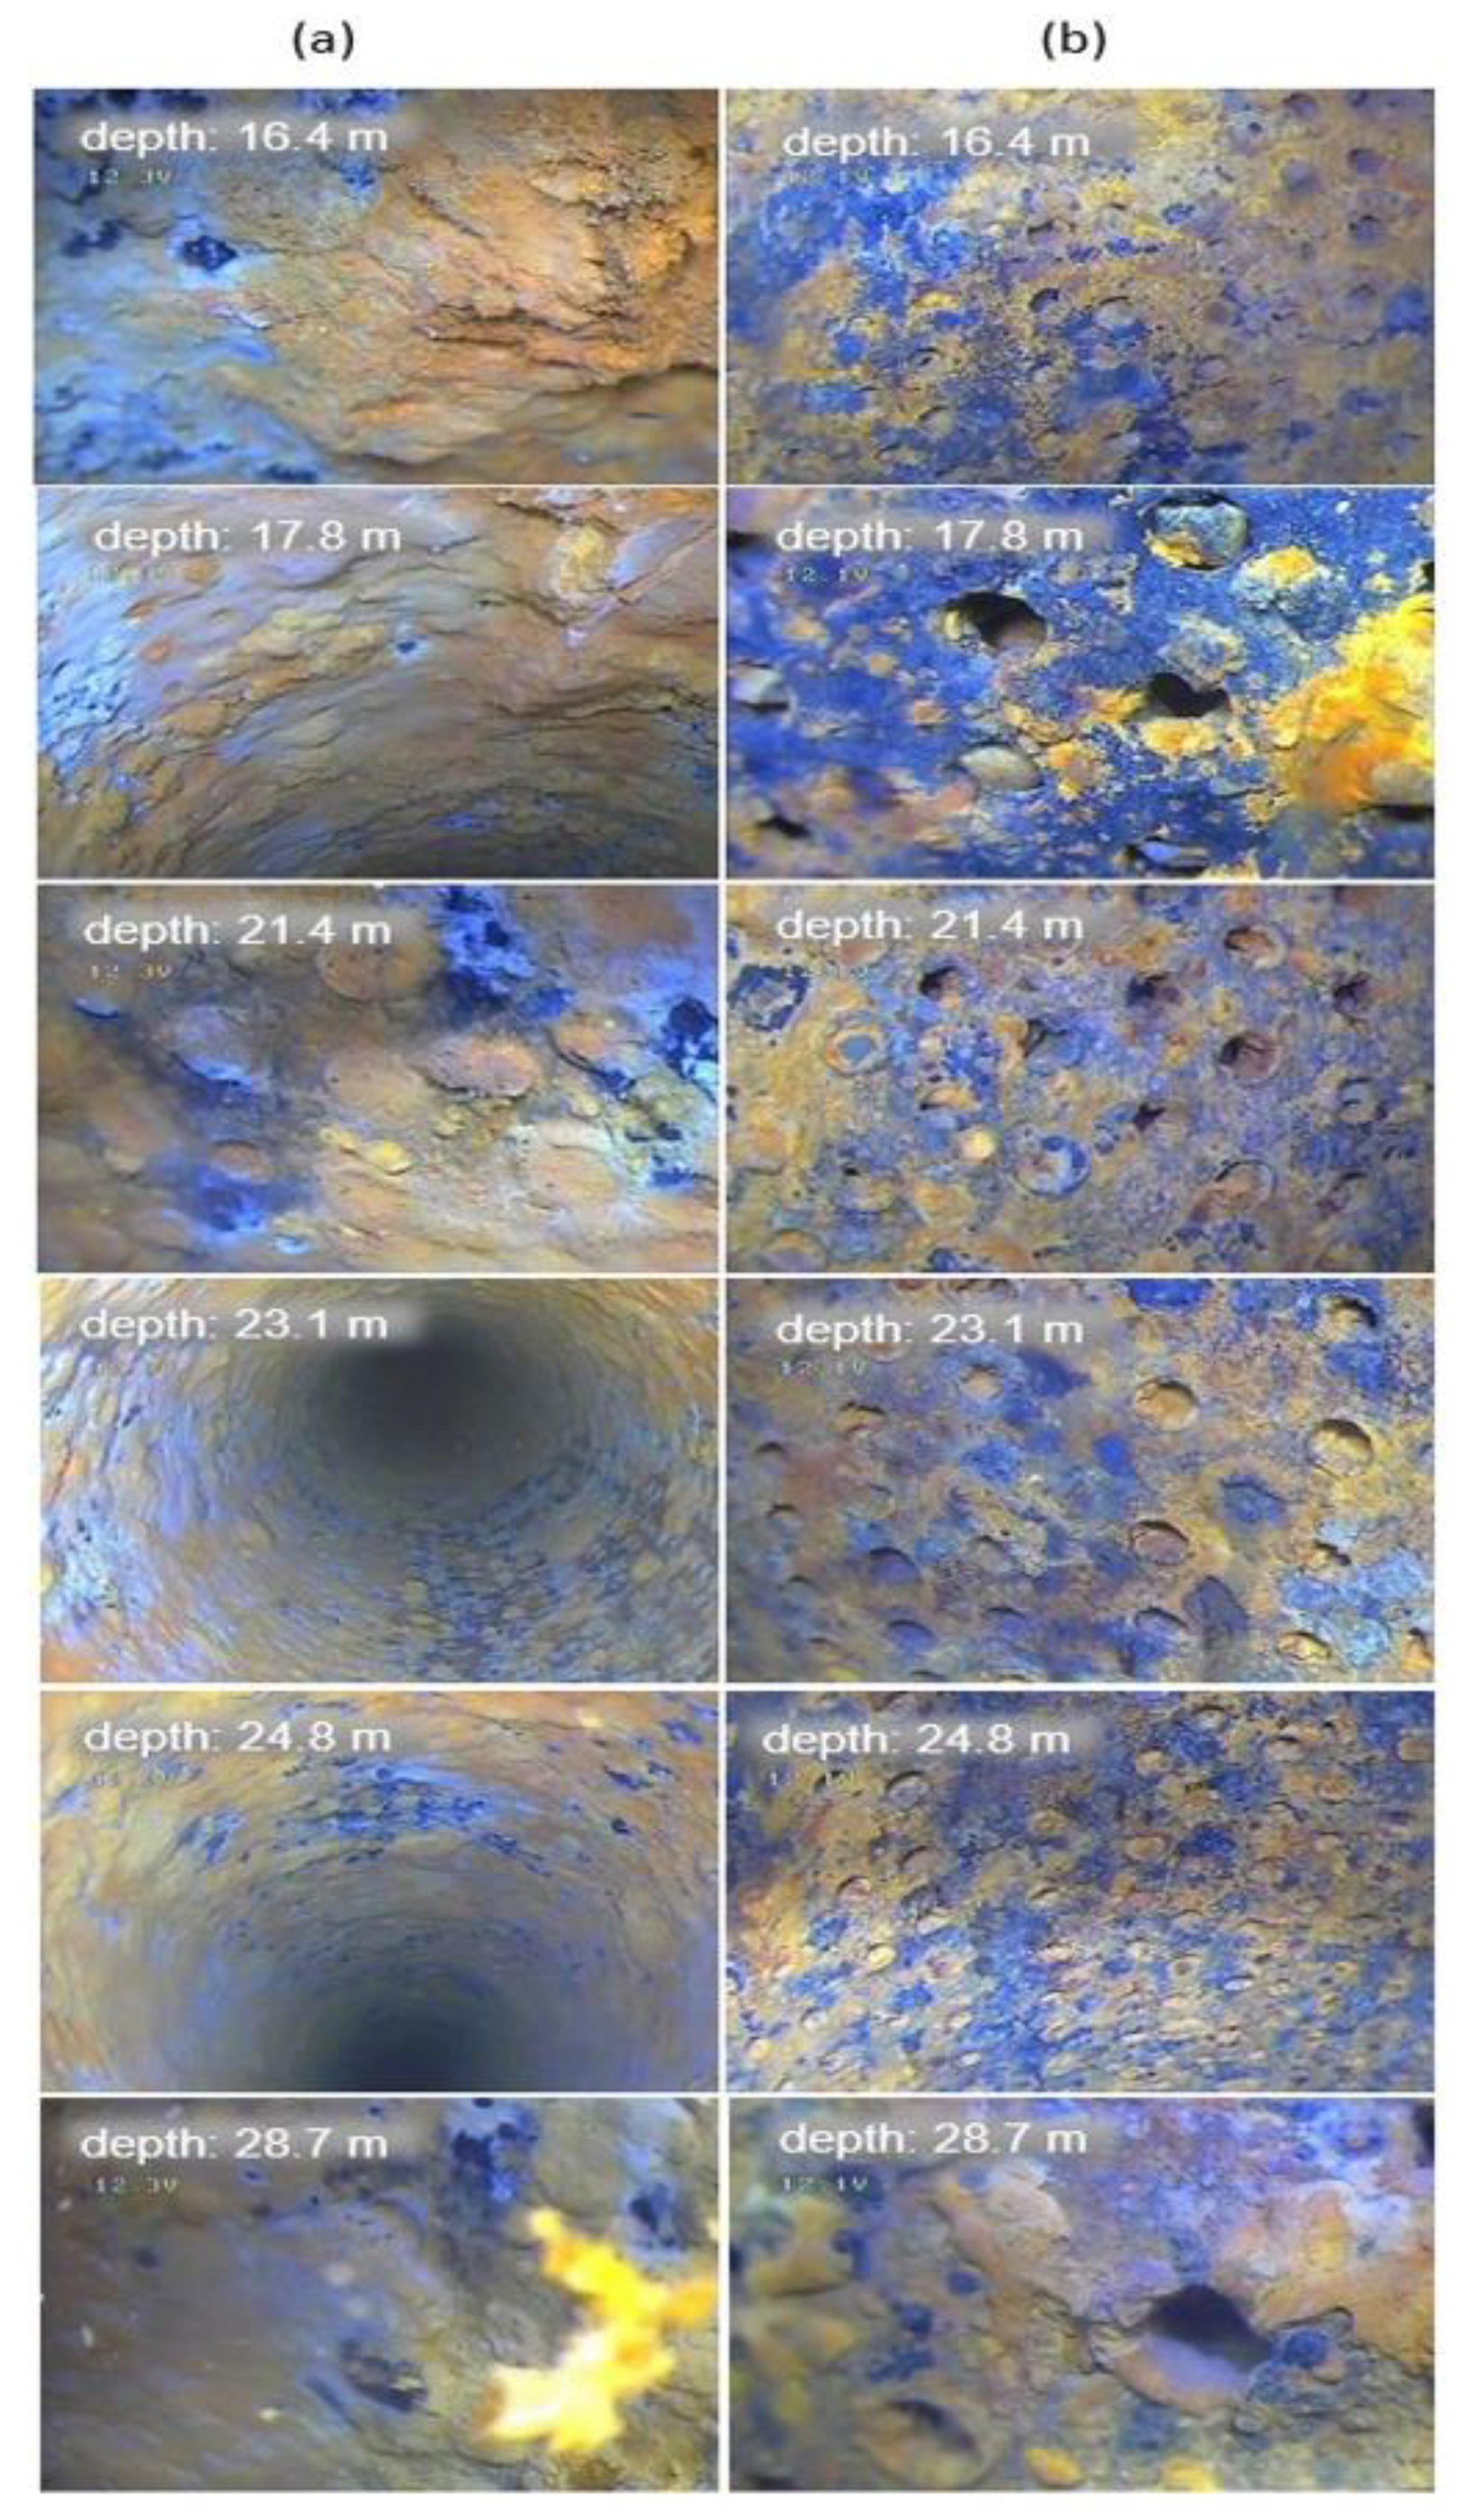
3.5. Well Logging
- The verification of the well technical conditions (internal, external equipment, diameters, perforations, depth);
- The verification of the internal space of the borehole by optical inspection;
- The determination of water inflows and their relative yields, and the clarification of the groundwater flow regime into the well.
3.6. The Inspection of Well Gravel Filter
- Gamma logging;
- Neutron neutron logging;
- Gamma gamma logging in density modification (density logging)—mainly to detect open spaces outside the well casing;
- Cavernometry—to verify the internal diameter of the well casing, possible deviations (broken casing, growths), casing joints, etc.;
- Measurement of physicochemical properties of water (conductivity, temperature, percentage of dissolved oxygen, pH index, oxidation-reduction potential)—to detect possible zonality of water in the borehole (from different inflows);
- Resistivimetry in the application of the labelled fluid dilution method—to clarify the groundwater and detection of inflows;
- Resistivimetry in the application of the labeled liquid pumping method—to determine all inflows and their yields.
4. Discussions
5. Conclusions
Author Contributions
Funding
Institutional Review Board Statement
Informed Consent Statement
Data Availability Statement
Conflicts of Interest
References
- Abramova, A.V.; Abramov, V.O.; Bayazitov, V.M.; Nikonov, R.V. A method for water well regeneration based on shock waves and ultrasound. Ultrason. Sonochem. 2017, 36, 375–385. [Google Scholar] [CrossRef]
- Houben, G.J.; Weihe, U. Spatial Distribution of Incrustations around a Water Well after 38 Years of Use. Ground Water 2010, 48, 53–58. [Google Scholar] [CrossRef] [PubMed]
- Mason, T.J.; Collings, A.; Sumel, A. Sonic and ultrasonic removal of chemical contaminants from soil in the laboratory and on a large scale. Ultrason. Sonochem. 2004, 11, 205–211. [Google Scholar] [CrossRef] [PubMed]
- Izadifar, Z.; Babyn, P.; Chapman, D. Mechanical and Biological Effects of Ultrasound: A Review of Present Knowledge. Ultrasound Med. Biol. 2017, 43, 1085–1104. [Google Scholar] [CrossRef] [PubMed] [Green Version]
- van Beek, C.G.E.M.; Breedveld, R.J.M.; Juhász-Holterman, M.; Oosterhof, A.; Stuyfzand, P.J. Cause and prevention of well bore clogging by particles. Hydrogeol. J. 2009, 17, 1877–1886. [Google Scholar] [CrossRef]
- Mullakaev, M.S.; Abramov, V.O.; Abramova, A.V. Development of ultrasonic equipment and technology for well stimulation and enhanced oil recovery. J. Pet. Sci. Eng. 2015, 125, 201–208. [Google Scholar] [CrossRef]
- Houben, G.; Treskatis, C. Water Well Rehabilitation and Reconstruction, 3rd ed.; McGraw Hill Professional: Two Penn Plaza, NY, USA, 2007; ISBN 0-07-148651-8. [Google Scholar]
- Available online: https://www.sonic-technologies.com/pdf/results_of_ultrasonic-well-rehabilitation.pdf (accessed on 6 July 2021).
- Mullakaev, M.S.; Abramov, V.O.; Abramova, A.V. Ultrasonic automated oil well complex and technology for enhancing marginal well productivity and heavy oil well recovery. J. Pet. Sci. Eng. 2017, 159, 1–7. [Google Scholar] [CrossRef]
- Timmer, H.; Verdel, J.; Jongmans, A.G. Well clogging by particles in Dutch well fields. J. Am. Water Work. Assoc. 2003, 95, 112–118. [Google Scholar] [CrossRef]
- Houben, G.J. Iron oxide incrustations inWells—Part 1: Genesis, mineralogy and geochemistry. Appl. Geochem. 2003, 18, 927–939. [Google Scholar] [CrossRef]
- Adebayo, A.R.; Bageri, B.S. A simple NMR methodology for evaluating filter cake properties and drilling fluid-induced formation damage. J. Pet. Explor. Prod. Technol. 2019, 9, 1643–1655. [Google Scholar] [CrossRef] [Green Version]
- Bageri, B.S.; Al-Mutairi, S.H.; Mahmoud, M.A. Different techniques for characterizing the filter cake. Soc. Pet. Eng. 2013, 1. [Google Scholar] [CrossRef]
- Iscan, A.G.; Kok, M.V.; Bagci, A.S. Permeability Reduction Due to Formation Damage by Drilling Fluids. Energy Sources 2007, 29, 851–859. [Google Scholar] [CrossRef]
- Ralph, D.E.; Stevenson, J.M. The role of bacteria in well clogging. Water Res. 1995, 29, 365–369. [Google Scholar] [CrossRef]
- Houben, G.J. Review: Hydraulics of water wells-head losses of individual components. Hydrogeol. J. 2015, 23, 1659–1675. [Google Scholar] [CrossRef]
- Zhu, P.; Song, Z.; Wu, X.; Xu, P.; Zhang, X.; Zhu, W. Community Distribution of Biofilms along a Vertical Wellbore in a Deep Injection Well during Petroleum Production. Energy Fuels 2021, 35, 1998–2005. [Google Scholar] [CrossRef]
- Payne, F.; Quinnan, J.; Potter, S. Remediation Hydraulics; CRC Press: London, UK, 2008; p. 432. ISBN 978-0849372490. [Google Scholar]
- Feng, F.; Mal, A.; Kabo, M.; Wang, J.C.; Bar-Cohen, Y. The mechanical and thermal effects of focused ultrasound in a model biological material. J. Acoust. Soc. Am. 2005, 117, 2347–2355. [Google Scholar] [CrossRef]
- Mullakaev, M.S.; Abramov, V.O.; Abramova, A.V. Ultrasonic piezoceramic module and technology for stimulating low-productivity wells. J. Pet. Sci. Eng. 2017, 158, 529–534. [Google Scholar] [CrossRef]
- Abramov, V.O.; Mullakaev, M.S.; Abramova, A.V.; Esipov, I.B.; Mason, T.J. Ultrasonic technology for enhanced oil recovery from failing oil wells and the equipment for its implemention. Ultrason. Sonochem. 2013, 20, 1289–1295. [Google Scholar] [CrossRef]
- Abramov, V.O.; Abramova, A.V.; Bayazitov, V.M.; Marnosov, A.V.; Kuleshov, S.P.; Gerasin, A.S. Selective ultrasonic treatment of perforation zones in horizontal oil wells for water cut reduction. Appl. Acoust. 2016, 103, 214–220. [Google Scholar] [CrossRef]
- Mullakaev, M.S.; Abramov, O.V.; Abramov, V.O.; Gradov, O.; Pechkov, A.A. An ultrasonic technology for productivity restoration in low-flow boreholes. Chem. Pet. Eng. 2009, 45, 203–210. [Google Scholar] [CrossRef]
- Abramov, V.O.; Abramova, A.V.; Bayazitov, V.M.; Altunina, L.K.; Gerasin, A.; Pashin, D.S.; Mason, T.J. Sonochemical approaches to enhanced oil recovery. Ultrason. Sonochem. 2015, 25, 76–81. [Google Scholar] [CrossRef]
- Mohsin, M.; Meribout, M. An extended model for ultrasonic-based enhanced oil recovery with experimental validation. Ultrason. Sonochem. 2015, 23, 413–423. [Google Scholar] [CrossRef] [PubMed]
- Hamida, T.; Babadagli, T. Analysis of capillary interaction and oil recovery under ultrasonic waves. Transp. Porous Media 2007, 70, 231–255. [Google Scholar] [CrossRef]
- Petrauskas, A. Increasing the efficiency of water well regeneration with ultrasound by using acoustic transducers consisting ofelements in flexural vibrations. Ultragarsas/Ultrasound 2009, 64, 17–23. [Google Scholar]
- Daghooghi-Mobarakeh, H.; Campbell, N.; Bertrand, W.K.; Kumar, P.G.; Tiwari, S.; Wang, L.; Wang, R.; Miner, M.; Phelan, P.E. Ultrasound-assisted regeneration of zeolite/water adsorption pair. Ultrason. Sonochem. 2020, 64, 105042. [Google Scholar] [CrossRef]
- Aarts, A.C.T.; Gijs, O.; Bil, K.J.; Bot, E.T.G. Enhancement of Liquid Flow Through a Porous Medium by Ultrasonic Radiation. SPE J. 1999, 4, 321–327. [Google Scholar] [CrossRef]
- Theis, C.V. The relation between the lowering of the piezometric surface and the rate and duration of discharge of a well using ground-water storage. Trans. Am. Geophys. Union 1935, 16, 519–524. [Google Scholar] [CrossRef]
- Cooper, H.H.; Jacob, C.E. A generalized graphical method for evaluating formation constants and summarizing well-field history. Trans. Am. Geophys. Union 1946, 27, 526–534. [Google Scholar] [CrossRef]
- Van Everdingen, A.F. The skin effect and its influence on the productive capacity of a well. J. Pet. Technol. 1953, 5, 171–176. [Google Scholar] [CrossRef]
- Hurst, W. Establishment of skin effect and its impediment to fluid flow into a well bore. Pet. Eng. 1953, 25, B6–B16. [Google Scholar]
- Hawkins, M.F., Jr. A note on the skin effect. Trans. Am. Inst. Min. Metall. Eng. 1956, 8, 356–357. [Google Scholar] [CrossRef]
- Papadopulos, I.S.; Cooper, H.H. Drawdown in a well of large diameter. Water Resour. Res. 1967, 3, 241–244. [Google Scholar] [CrossRef]
- Ramey, H.H., Jr. Short-time well test data interpretation in the presence of skin effect and wellbore storage. J. Pet. Technol. 1970, 22, 97–104. [Google Scholar] [CrossRef]
- Agarwal, R.G.; Al-Hussainy, R.; Ramey, H.J. An investigation of well storage and skin effect in unsteady liquid flow: I. Analytical treatment. Soc. Pet. Eng. J. 1970, 10, 279–291. [Google Scholar] [CrossRef]
- Fan, Z.; Rarashar, R. Transient flow to a finite-radius well with well storage and skin effect in a poroelastic confined aquifer. Adv. Water Resour. 2020, 142, 103604. [Google Scholar] [CrossRef]
- Patel, M.C.; Singh, A. Near Wellbore Damage and Types of Skin Depending on Mechanism of Damage. In Proceedings of the Society of Petroleum Engineers SPE International Conference and Exhibition on Formation Damage Control, Lafayette, LA, USA, 24–26 February 2016. [Google Scholar]
- Liu, S. Load characteristics of high power sandwich piezoelectric ultrasonic transducers. Ultrasonics 2005, 43, 365–373. [Google Scholar] [CrossRef]
- Watlton, W.C. Aquifer Test Modeling, 1st ed.; CRC Press: Boca Ralton, FL, USA, 2007; p. 240. ISBN 978-1-4200-4292-4. [Google Scholar]
- Batu, V. Aquifer Hydraulics: A Comprehensive Guide to Hydrogeologic Data Analysis; John Wiley & Sons: New York, NY, USA, 1998. [Google Scholar]
- Kresic, N. Hydrogeology and Groundwater Modeling, 2nd ed.; CRC Press, Taylor and Francis: Boca Raton, FL, USA, 2007; ISBN 978-0849333484. [Google Scholar]
- Bourdet, D.; Whittle, T.M.; Douglas, A.A.; Pirard, Y.M. A new set of type curves simplifies well test analysis. World Oil 1983, 196, 95–106. [Google Scholar] [CrossRef] [Green Version]
- Novakowski, K.S. A Composite analytical model for analysis of pumping tests affected by weell bore storage and finite thickness skin. Water Resour. Res. 1989, 25, 1937–1946. [Google Scholar] [CrossRef]
- Yeh, H.D.; Yang, S.Y.; Peng, H.Y. A new closed-form solution for a radial two-layer drawdown equation for groundwater under constant-flux pumping in a finite-radius well. Adv. Water Resour. 2003, 26, 747–757. [Google Scholar] [CrossRef]
- Van Everdingen, A.F.; Hurst, W. The application of the Laplace transformation to flow problems in reservoirs. J. Pet. Technol. 1949, 1, 305–324. [Google Scholar] [CrossRef]
- Stehfest, H. Algorithm 368: Numerical inversion of Laplace transforms. Commun. ACM 1970, 13, 47–49. [Google Scholar] [CrossRef]
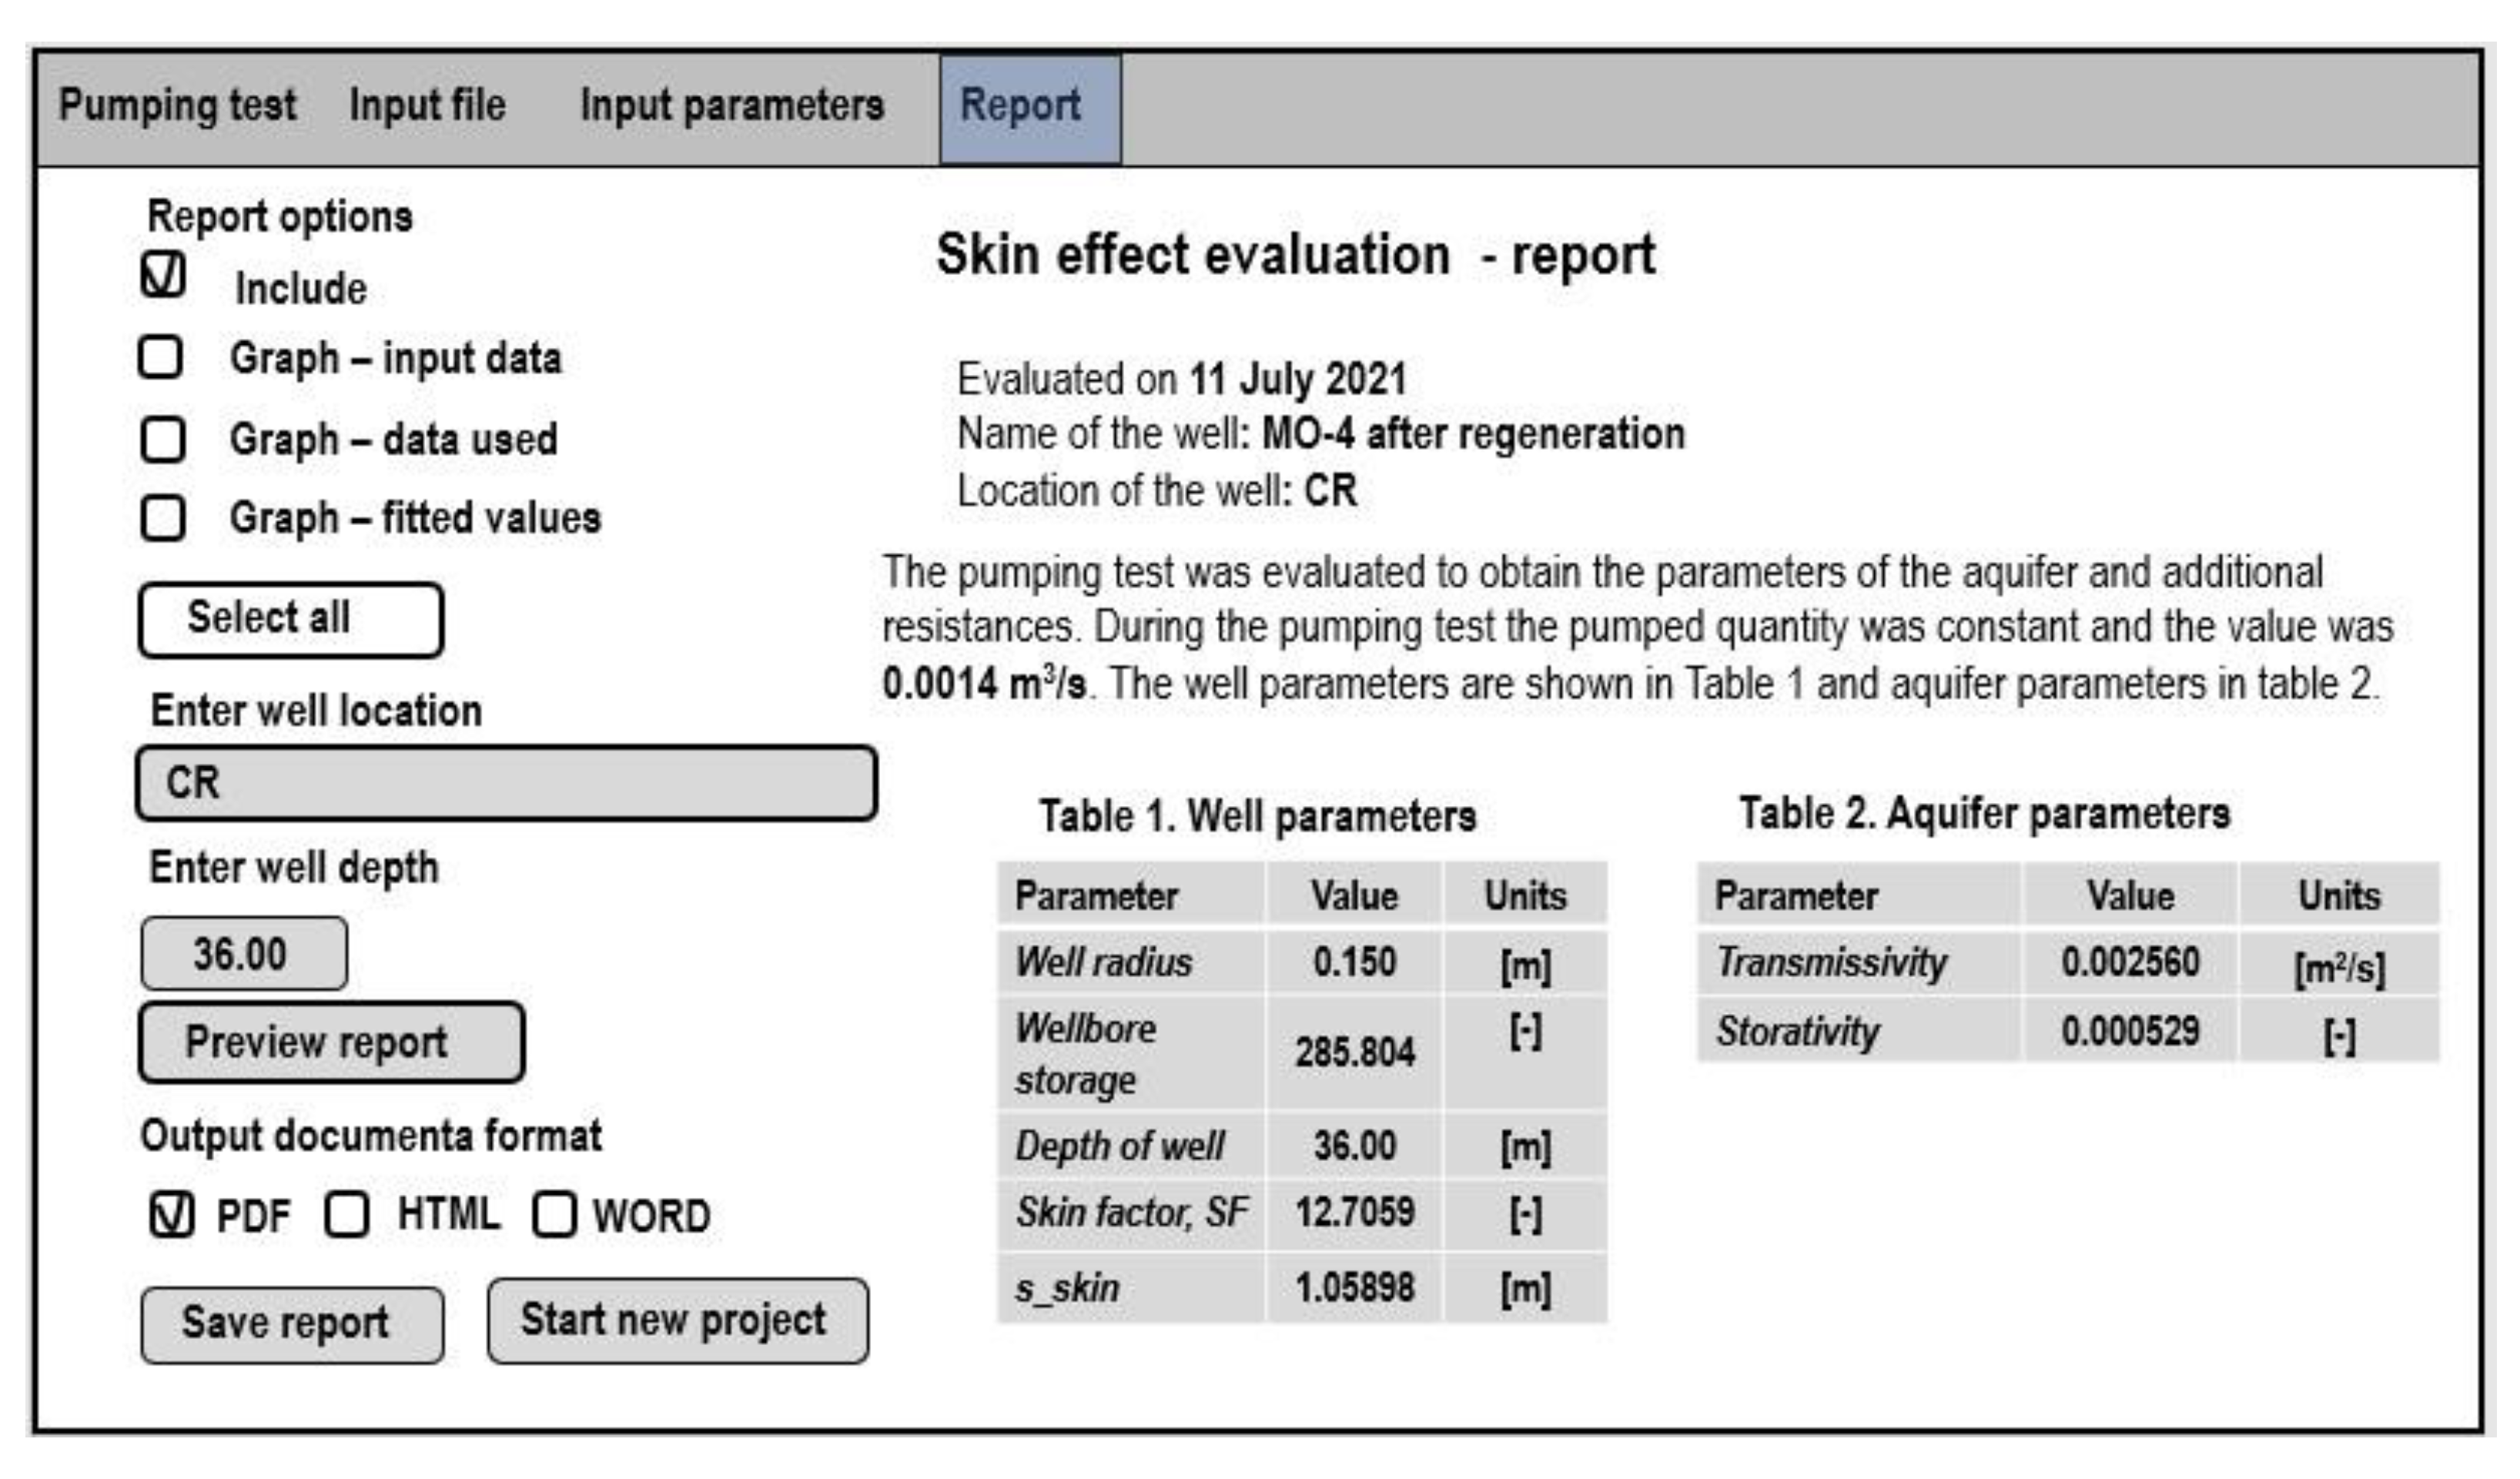
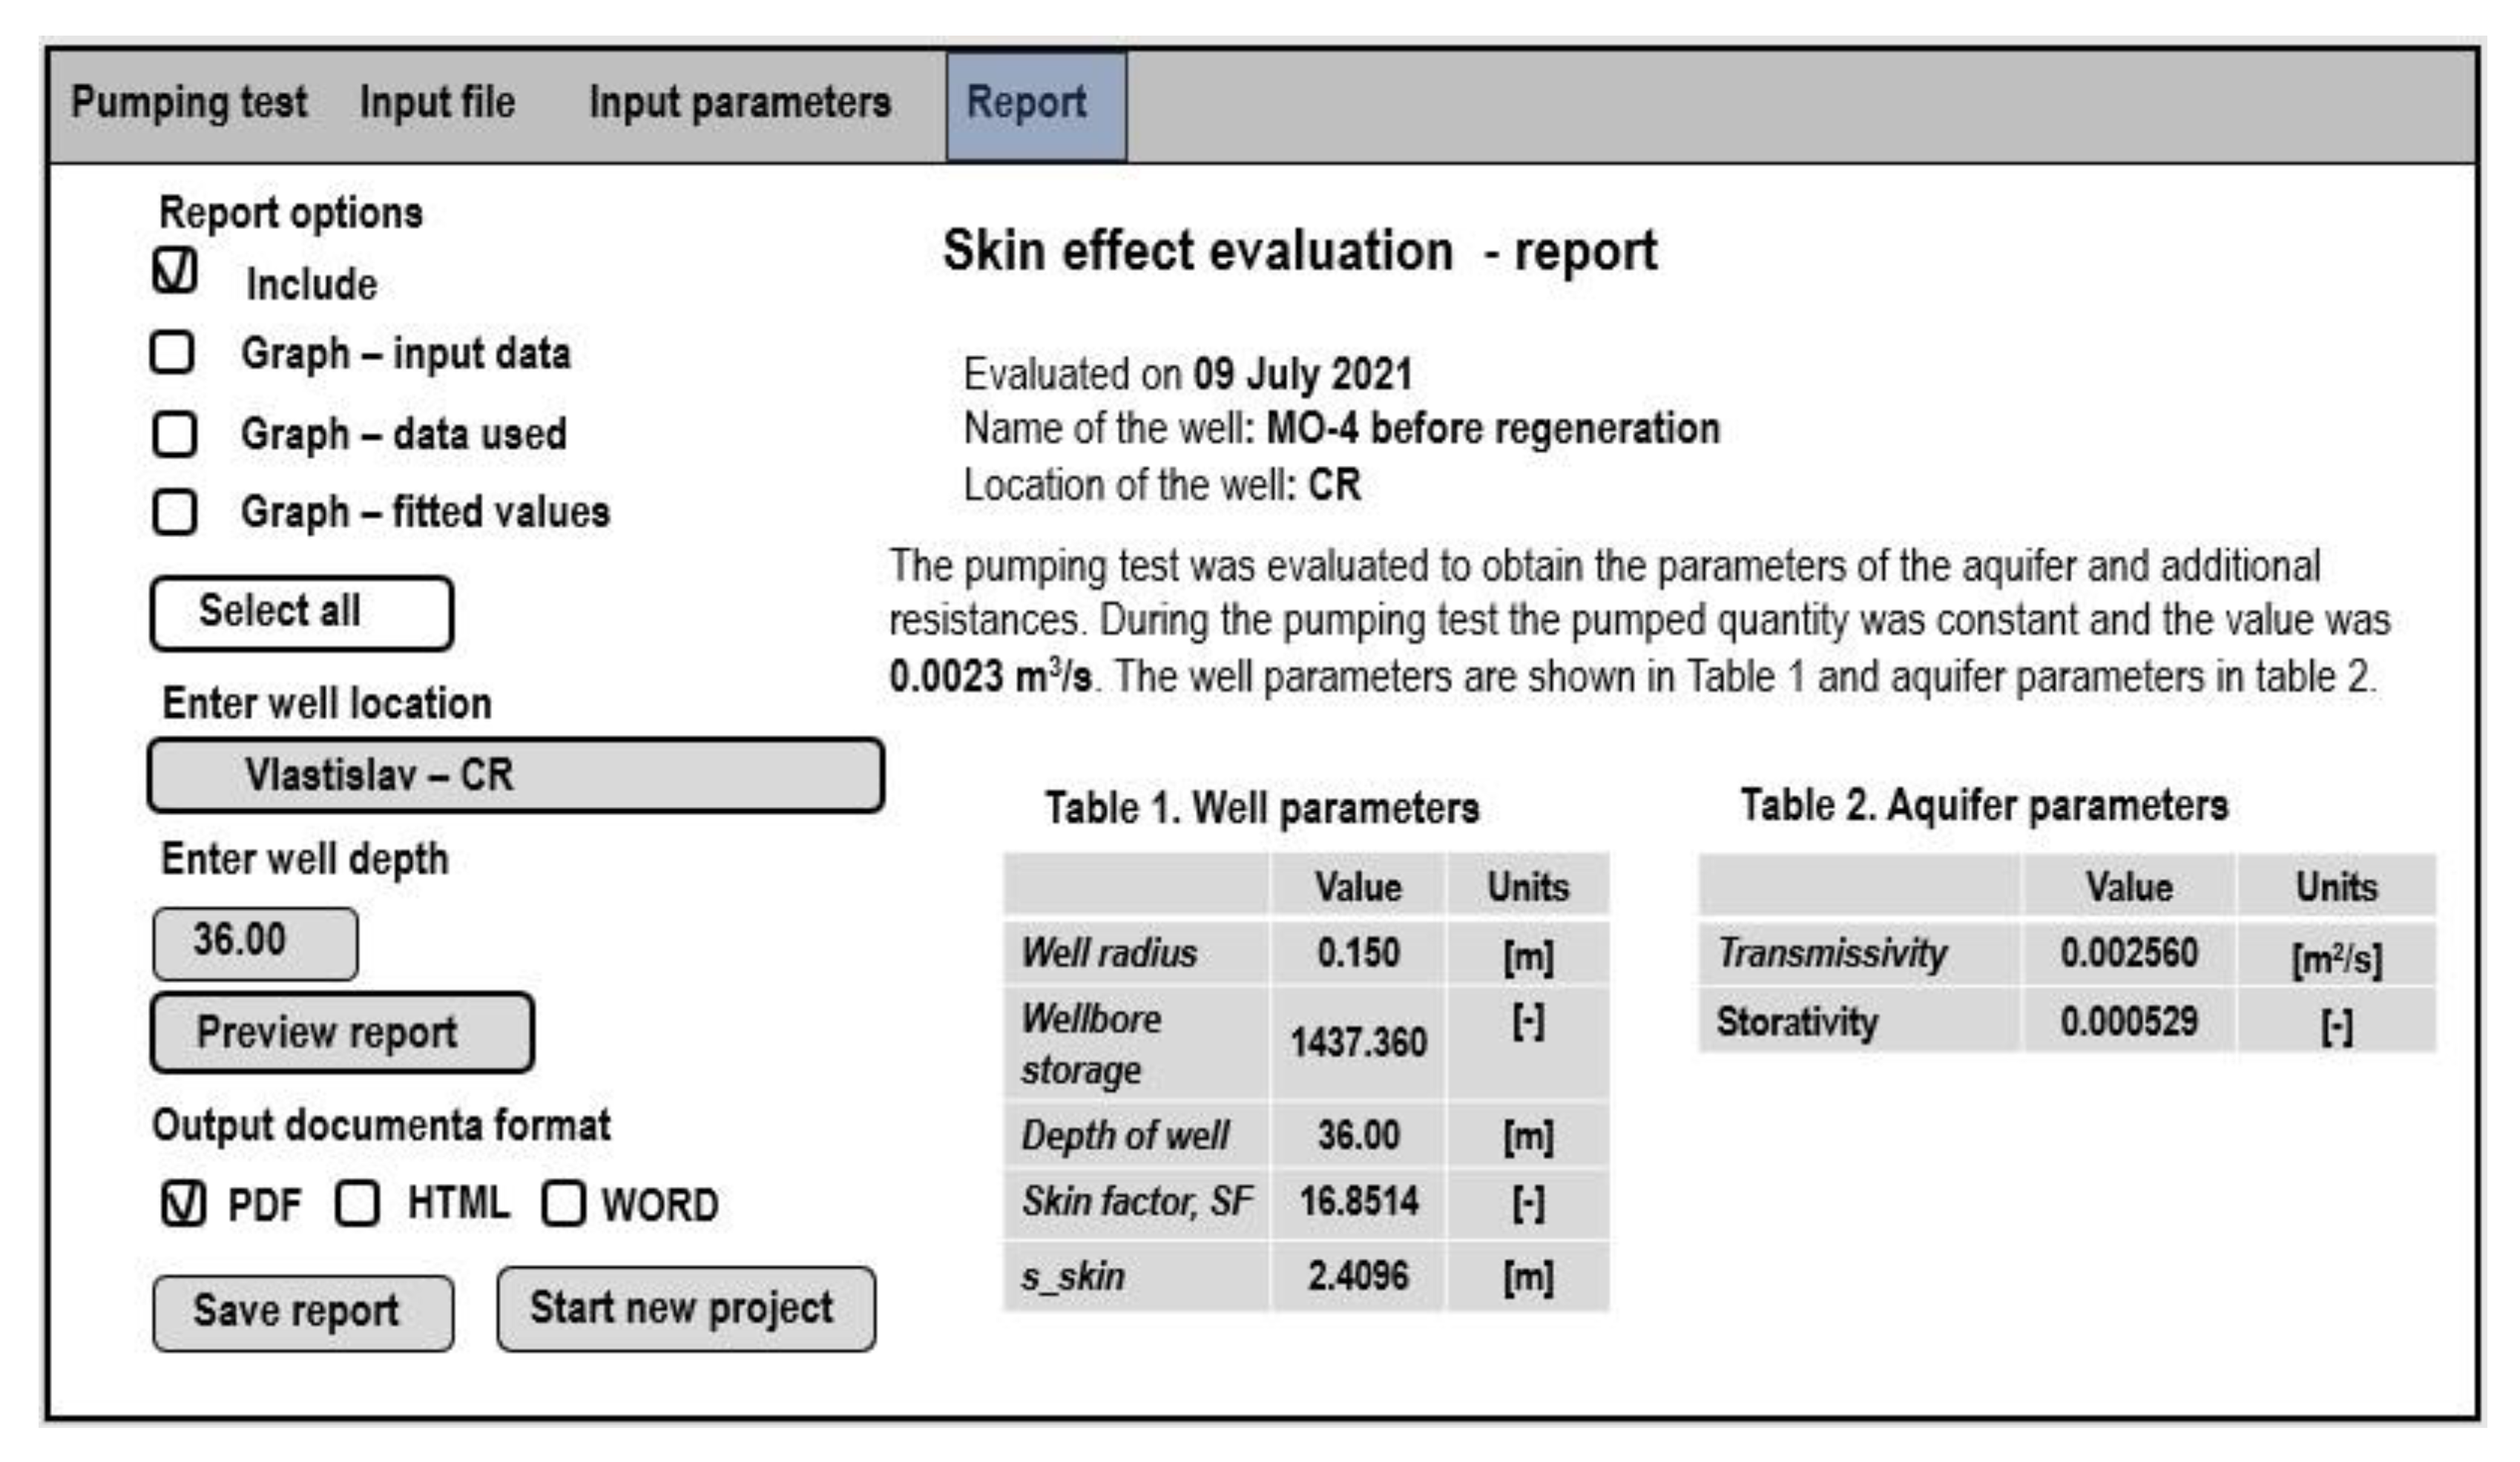
- Holub, J.; Pech, P.; Kuraz, M.; Maca, P.; Kahuda, D. Evaluation of a pumping test with skin effect and well storage on a confined aquifer in the Bela Crkva, Serbia. Int. J. Water 2019, 13, 1–11. [Google Scholar] [CrossRef]
- Ficaj, V.; Pech, P.; Kahuda, D. Software for Evaluating Pumping Tests on Real Wells. Appl. Sci. 2021, 11, 3182. [Google Scholar] [CrossRef]
- Jüttnerová, S.; Bryjová, J. Interactive Textbook of Ultrasonography. VŠB-TU, Ostrava. 2016. Available online: http://www.jtarchitekt.cz/pdf/ultrasonografie.pdf (accessed on 8 July 2021). (In Czech).
- Zhang, Z.; Guo, J.; Liang, H.; Liu, Y. Numerical simulation of skin factors for perforated wells with crushed zone and drilling-fluid damage in tight gas reservoirs. J. Nat. Gas Sci. Eng. 2021, 90, 103907. [Google Scholar] [CrossRef]
- Sterrett, J.R. Groundwater and Wells, 3rd ed.; Johnson screens—Weatherford comp.: New Brighton, MN, USA, 2007; p. 812. ISBN 978-0-9787793-0-6. [Google Scholar]
- Horne, R.N. Modern Well Test Analysis: A Computer Aided Approach, 4th ed.; Alto, P., Ed.; Petroway, Inc.: Palo Alto, CA, USA, 1995; p. 185. ISBN 0-9626992-09.55. [Google Scholar]
- Kahuda, D.; Pech, P. A new method for evaluation of well rehabilitation from the early-portion of the pumping test. Water 2020, 12, 744. [Google Scholar] [CrossRef] [Green Version]
- Park, E.; Zhan, H.B. Hydraulics of a finite-diameter horizontal well with wellbore storage and skin effect. Adv. Water Resour. 2002, 25, 389–400. [Google Scholar] [CrossRef]
- Chen, C.S.; Chang, C.C. Theoretical evaluation of non-uniform skin effect on aquifer response under constant rate pumping. J. Hydrol. 2006, 317, 190–201. [Google Scholar] [CrossRef]
- Pasandi, M.; Samani, N.; Barry, D.A. Effect of well and finite thickness skin on flow to a partially penetrating well in a phreatic aquifer. Adv. Water Resour. 2008, 31, 383–398. [Google Scholar] [CrossRef]
- Yeh, H.D.; Wang, C.T. A semianalytical solution for residual drawdown at a finite diameter well in a confined aquifer. J. Am. Water Resour. Assoc. 2013, 49, 966–972. [Google Scholar] [CrossRef]
- Sethi, R. A dual-well step drawdown method for the estimation of linear and non-linear flow parameters and well skin factor in confined aquifer systems. J. Hydrol. 2011, 400, 187–194. [Google Scholar] [CrossRef]
- Well Rehabilitation with High-Energetic Ultrasound. Sonic Umwelttecchnik. SONIC Information No. E1-09.2009. Available online: www.sonic-umwelttechnik.de (accessed on 8 July 2021).
- Procházka, M. VLASTISLAV U TŘEBENIC, Zpráva o Revizním Karotážním Měření ve Vodárenském vrtu po Provedené Regeneraci, SG Geotechnika, a.s., Praha 2021. Available online: Home.czu.cz/pech (accessed on 5 July 2021). (In Czech).
- Zhang, G.J.; Wang, S.F.; Liu, Z.Z. Ultrasonic regeneration of granular activated carbon. Environ. Eng. Sci. 2003, 20, 57–64. [Google Scholar] [CrossRef]
- Gungor-Demirci, G.; Lee, J.; Keck, J.; Harrison, S.J.; Bates, G. Development of a risk-based tool for groundwater well rehabilitation and replacement decisions. J. Water Supply Res. Technol. AQUA 2019, 68, 411–419. [Google Scholar] [CrossRef]
- Mansuy, N. Water Well Rehabilitation; CRC Press: Boca Raton, FL, USA, 2017; pp. 113–149. [Google Scholar] [CrossRef]


| Technical Data for Individual Emitter | |
| Operating frequency | 20 kHz |
| Rated power | 2500 Watt |
| Peak power | 4000 Watt |
| Weight | approx. 18 kg |
| Sound emitting surface | 85 × 185 mm |
| Sound energy (nominal/peak)) | 12/25 W/cm2 |
| Modulation | double half wave |
| Ultrasonic technology | magnetostriction |
| Horizontal range | up to 350 mm from the borehole wall |
| Technical Data of the Ultrasonic Device | |
| Type | B 20/6 |
| Number of ultrasonic emitters | 3 |
| Total power | 7.5 KW |
| Power source | 15 kVA |
| Main voltage | 230/100/50 Hz |
| Weight | 120 kg |
| Length | 160 cm |
| Weight of switching box | approx. 200 kg |
| Weight of cables | 2 kg/m |
| Cable reel weight | approx. 150 kg |
| Outer diameter | 140 mm |
| External dimensions of the switch cabinet | 800 × 1800 × 600 mm |
| Applicability for bore diameter | 160–1000 mm |
| Maximum borehole depth | 250 m |
| Crane capacity | 2500 kg |
| Steel pipe assembly | lengths of 200 m |
| Alternating current generator | min power 15 kW and 25 A |
| Q (m3/s) | Length of Pumping Test (s) | max sw (m) | |
|---|---|---|---|
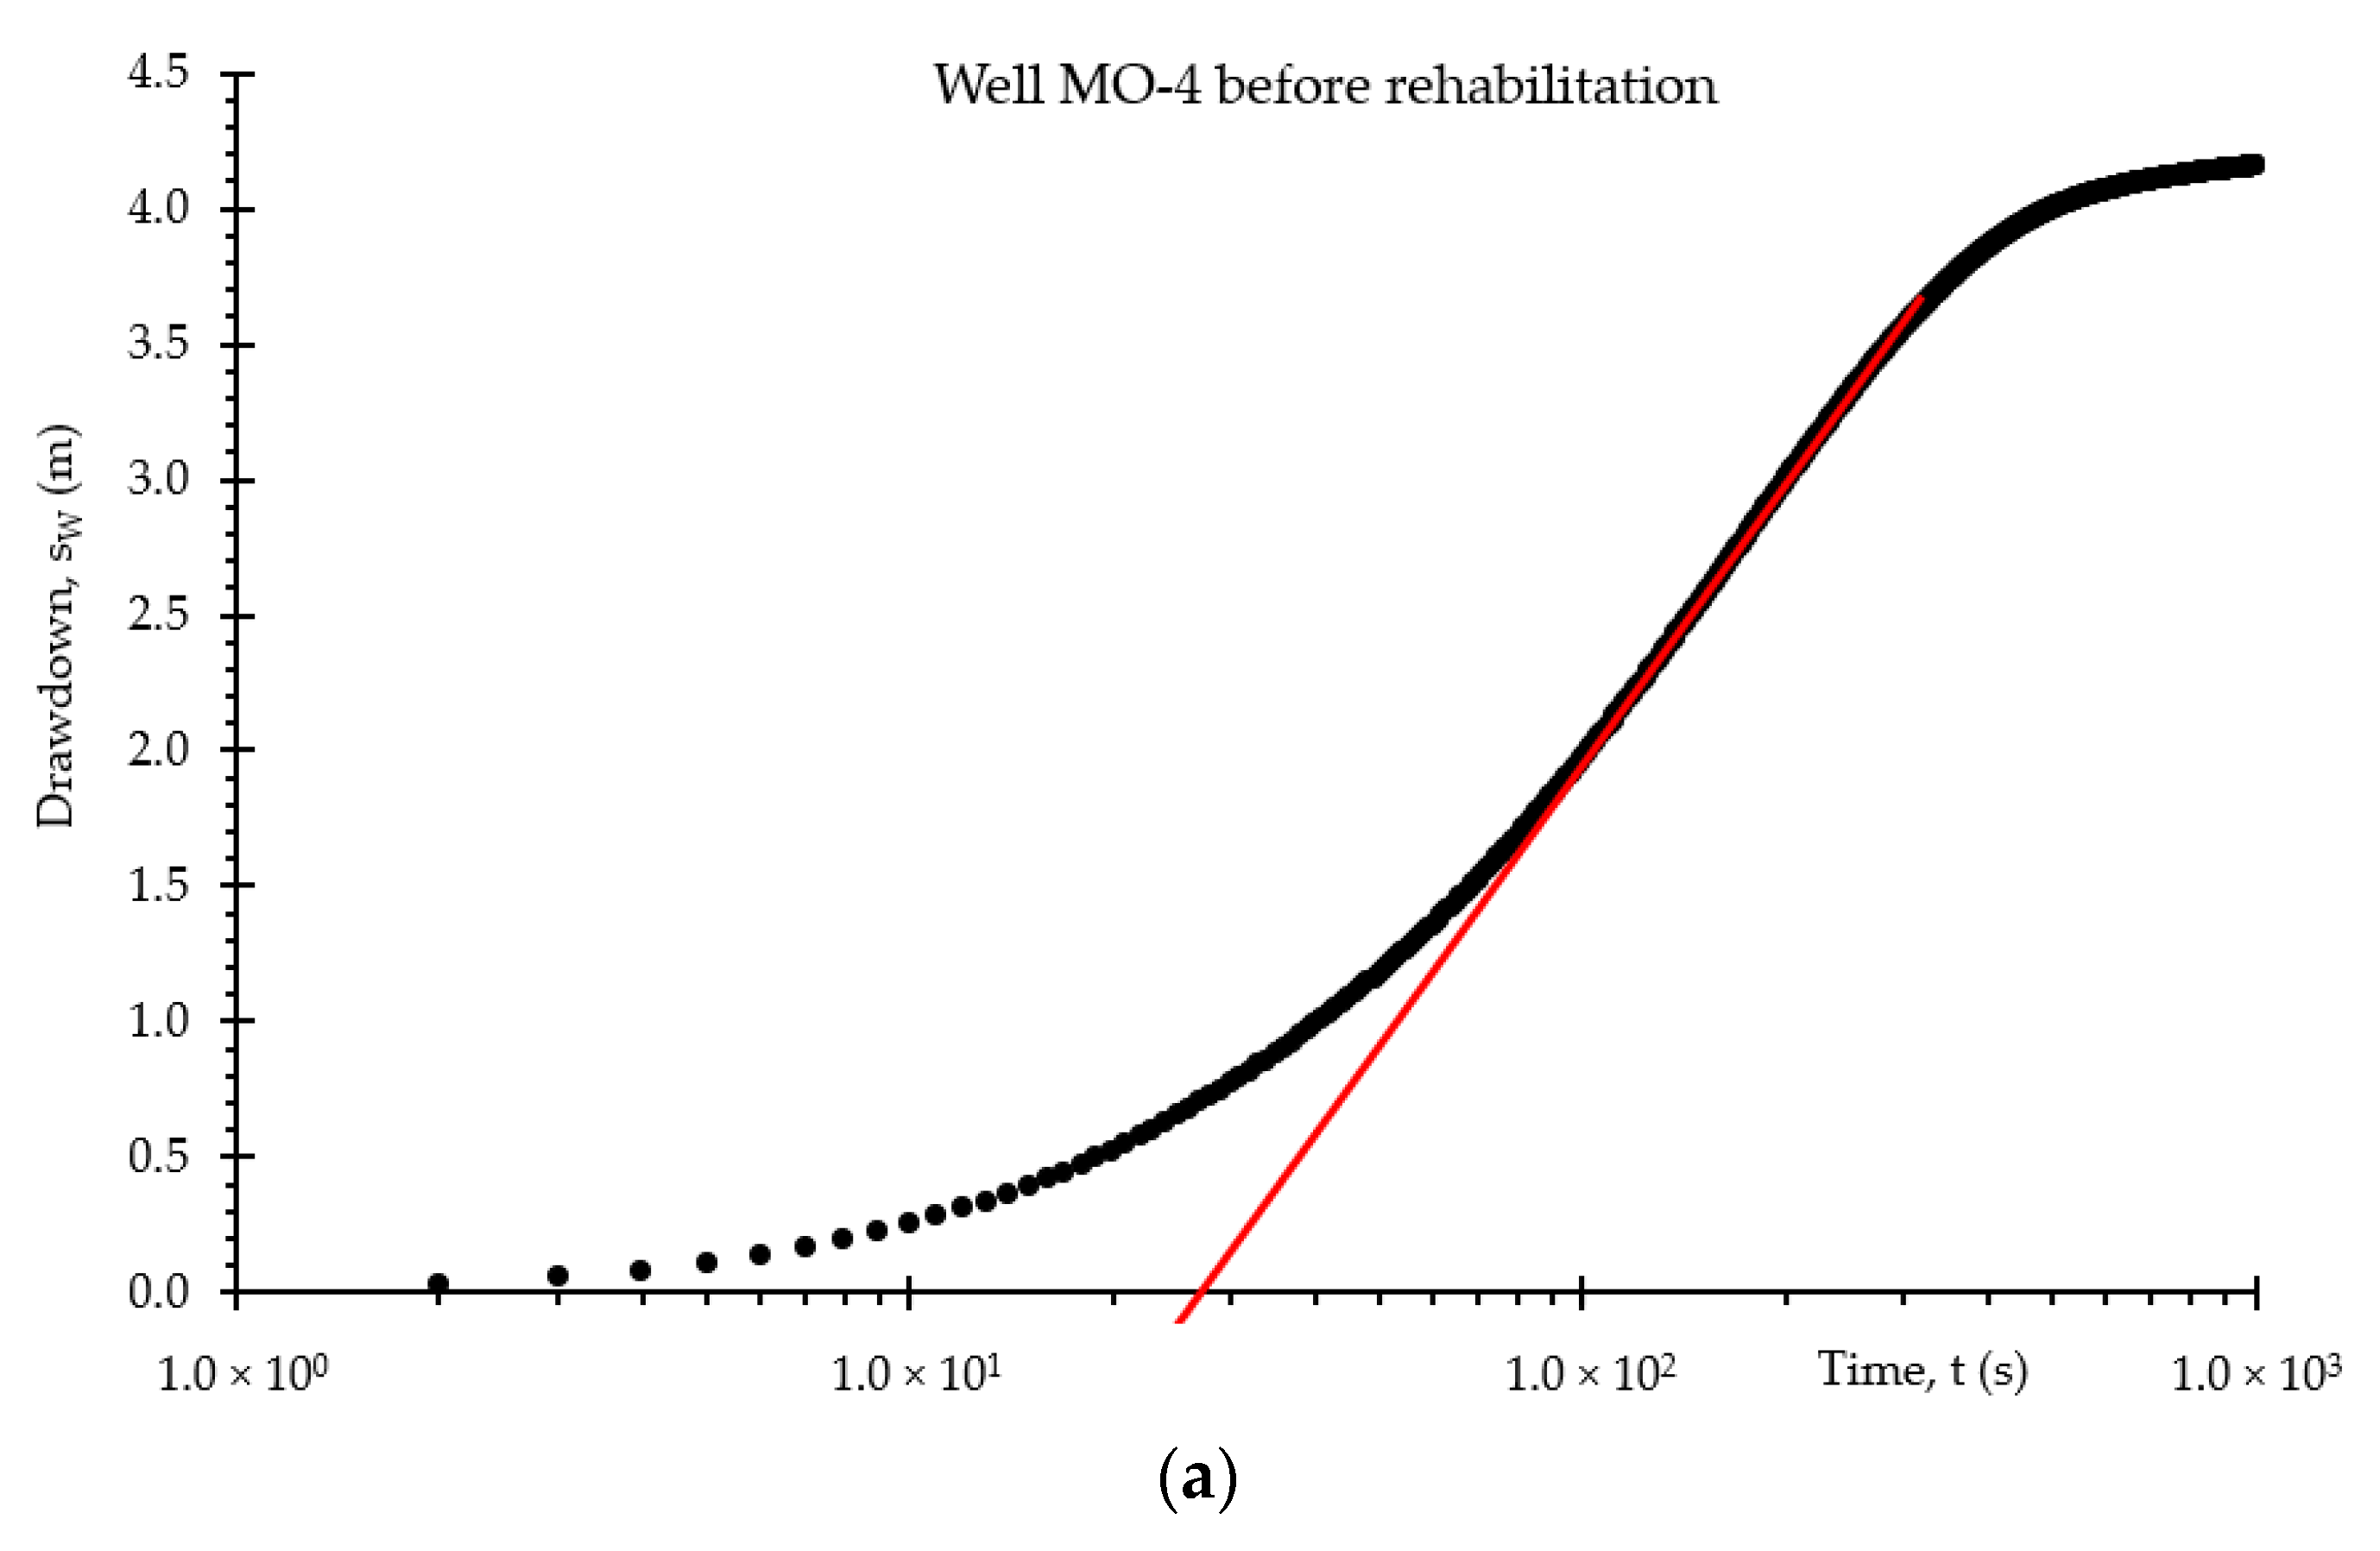
| Before rehabilitation | 0.0023 | 1500 | 4.2 |
| After rehabilitation | 0.0014 | 1250 | 2.05 |
| Q (m3/s) | Skin Factor, SF (-) | sw (m) | s_skin (m) | Specific Discharge (m2/s) | |
|---|---|---|---|---|---|
| Before rehabilitation (a) | 0.0023 | 16.85 | 4.2 | 2.41 | 5.5.10−4 |
| After rehabilitation (b) | 0.0014 | 12.7 | 2.05 | 1.1 | 6.83.10−4 |
| Difference (a), (b) | 4.15 | 2.15 | 1.31 | 1.33.10−4 | |
| Improvement by (%) | 24.63 | 51.2 | 54.36 | 24.18 |
| Impact | Operation | |||||
|---|---|---|---|---|---|---|
| Physical Methods | Bottom Sediment | Well Casing | Well Filter | Toxic Wastewater | PROs | CONs |
| Air-lift | YES | limited | NO | NO | easy | limited dept range |
| pumping methods | limited | NO | limited | NO | easy | low effectivity |
| Brushes | NO | limited | NO | NO | easy | low effectivity, may cause damages |
| Water jet | NO | YES | limited | NO | effective, thin profile | expensive, may cause damages |
| Air jet (hydropulse) | NO | YES | limited | NO | effective, thin profile | complex, expensive, may cause damages |
| Ultrasound | NO | YES | YES | NO | effective, material-friendly | complex, expensive |
| Chemical methods | ||||||
| Acidic solvents | YES | YES | YES | YES | effective, cheap | dangerous, creates toxic wastewater |
| Oxidants | limited | YES | limited | YES | cheap | dangerous, creates toxic wastewater |
Publisher’s Note: MDPI stays neutral with regard to jurisdictional claims in published maps and institutional affiliations. |
© 2021 by the authors. Licensee MDPI, Basel, Switzerland. This article is an open access article distributed under the terms and conditions of the Creative Commons Attribution (CC BY) license (https://creativecommons.org/licenses/by/4.0/).
Share and Cite
Kahuda, D.; Pech, P.; Ficaj, V.; Pechová, H. Well Rehabilitation via the Ultrasonic Method and Evaluation of Its Effectiveness from the Pumping Test. Coatings 2021, 11, 1250. https://doi.org/10.3390/coatings11101250
Kahuda D, Pech P, Ficaj V, Pechová H. Well Rehabilitation via the Ultrasonic Method and Evaluation of Its Effectiveness from the Pumping Test. Coatings. 2021; 11(10):1250. https://doi.org/10.3390/coatings11101250
Chicago/Turabian StyleKahuda, Daniel, Pavel Pech, Václav Ficaj, and Hana Pechová. 2021. "Well Rehabilitation via the Ultrasonic Method and Evaluation of Its Effectiveness from the Pumping Test" Coatings 11, no. 10: 1250. https://doi.org/10.3390/coatings11101250
APA StyleKahuda, D., Pech, P., Ficaj, V., & Pechová, H. (2021). Well Rehabilitation via the Ultrasonic Method and Evaluation of Its Effectiveness from the Pumping Test. Coatings, 11(10), 1250. https://doi.org/10.3390/coatings11101250