Abstract
This article deals with the possibility of predicting skid resistance based on non-contact scanning of the road surface. The study is based on comparing pavement texture parameters with coefficients of friction measured on a wide variety of road surfaces, while other test conditions were the same and constant. The measurements of the coefficient of friction were performed using a pendulum tester. The pavement texture was measured using a static road scanner, and 85 different 3D texture parameters were calculated. The study shows that the determination of the friction using only single texture parameters is not sufficient. Based on this statement, the next part of the research analyzed the influence of the mutual combination of surface texture parameters. A linear regression model was chosen to determine the friction coefficient prediction formula based on the combination of texture parameters. Statistically, the most significant parameters in the prediction model proved to be the valley material portion, characterizing the microtexture, and the arithmetic mean curvature, characterizing the pavement macrotexture. The obtained regression model proved to be statistically significant with R2 = 0.81 for Pendulum Test Value prediction.
1. Introduction
The precise diagnostics and objective evaluation of skid resistance within pavement management systems are essential, primarily to ensure road safety is maintained at a satisfactory level throughout the whole lifecycle of the road pavement. To date, many methods and devices for skid resistance measurement have been developed [1]. In general, there are two main groups of measuring methods, according to the way of describing the skid resistance. From a physical perspective, there are devices measuring the tangential force at the contact between the tire and the pavement surface, which gives the dimensionless coefficient of friction in relation to the perpendicular normal force (wheel load) [2,3]. From a geometric point of view, there are devices capturing the morphology of the pavement surface (the pavement texture). According to [4,5,6], pavement texture is represented by surface irregularities with a wavelength of less than 0.5 m. The texture is divided into three levels (micro-, macro-, and megatexture), which affect different tire–road interaction phenomena, such as tire wear [7,8], rolling resistance [9,10], tire/road noise [10,11,12,13], particulate matter production [14] and, of course, the tire/road friction. The specific most significant effects depending on the wavelength of texture are shown in [5]. Still, it is widely known that the friction between tires and road surfaces is primarily affected by micro- and macrotexture [2,3,4,5,6,7,15,16,17].
For direct measurement of a coefficient of friction, there have been more than 20 devices in active use working at different measuring principles and under various test conditions (operating speed, variable or fixed slip, type of test tire, water film depth, wheel load, inflation pressure, etc.). All of these test conditions, together with temperature and limited amounts of water in water tanks, make these skid resistance measurements difficult to harmonize and not very practical.
Given the facts mentioned above, and together with the rapid development of surface sensing and data processing technology, there are currently more and more attempts to predict skid resistance based on non-contact texture measurements. Mathematical models have been created to calculate the coefficient of friction determined by sliding a rubber element on a rough surface [18,19,20]. These models have a solid physical basis and are very complex, but need to have the viscoelastic properties of the rubber as inputs, which can also be considered as a variable that can vary. However, promising results were obtained using a combination of Persson’s model and texture measurements of asphalt specimens in the study [21]. On the other hand, there is a basic premise that if the goal is to predict the skid resistance based on texture, the only subject that should be taken into account as an input is the pavement surface. Considering a potential comparison between different surfaces or creating degradation models, all other variables aside from texture should be constant.
For this reason, many researchers approach skid resistance prediction using statistical regression models to find the correlation between texture descriptors and the measured coefficient of friction. Even within this kind of investigation, there are many different approaches. For example, [22] investigated the relationship between friction and microtexture descriptors (shape and relief of the indentors). Another friction–texture relationship was based on a new signal processing method called Huang–Hilbert transformation [23]. The suitability of discrete wavelet transform used to decompose pavement surface macrotexture profile data into multiscale characteristics for pavement friction prediction was investigated in [24]. The fractal nature of pavement surfaces in relation to a coefficient of friction was discussed in [25,26,27]. An evaluation model of pavement skid resistance using 3D texture data (mean texture depth, skewness, average spacing of single peaks, and root-mean-square wavelength) was established, and satisfactory test results were achieved in the study [28]. Meanwhile, [29] explored the use of spectrum analysis to investigate the texture–friction relationship; the authors found a good correlation between texture parameters and side force coefficient of friction at higher speeds, but not much significant correlation was obtained at lower speeds or by using a British pendulum tester.
Despite some promising results from many studies, and the great deal of work and research that have been carried out in this scope, the texture–friction relationship is still not fully understood. There still has been no single texture characteristic or evaluation method found to predict the skid resistance using only non-contact measurements, with sufficiently high reliability, repeatability, and usability in praxis to be accepted worldwide.
This article is intended to contribute to the efforts towards skid resistance prediction based on contactless surface measurements. As the main contribution, we consider measurements with the newly developed device, capturing the pavement surface up to the microtexture level on real road sections.
2. Devices and Methods
One of the reasons that no satisfactory relation between pavement texture and friction has been found is the resolution of the scanning devices. The low resolution of the scanning devices does not allow capturing the properties of the microtexture, which is substantial in influencing the magnitude of friction. Another reason has been the evaluation of 2D texture parameters from the profiles. Two-dimensional parameters can be insufficient to provide the information relevant to the description of tire–road interaction, due to missing surface features related to particle shape. The authors of [30] showed that 3D investigation produces more reliable results than those performed on profiles. Respecting the above-stated assumptions, we used a brand new device for the present study: the static road scanner.
2.1. Static Road Scanner (SRS)
The SRS (Figure 1) is a device developed at the University of Žilina to measure pavement texture up to the microtexture level. The device uses two different optical methods: The first is represented by two red laser sensors with a resolution of 15 μm; the two lasers scan in opposite directions to minimize the blind spots. The second optical method is the structured blue light with a resolution of up to 2.49 µm in the X- and Y-axes; the resolution in the Z-axis is orders of magnitude higher than in the X- and Y-axes. Because of the traffic on selected road sections, and the time-consuming nature of measurements using the structured blue light, measurements were performed using only the red laser sensors. The maximum measured area at one spot can be 120 mm × 100 mm, consisting of 10 runs of laser sensors capturing a 10 mm wide strip. The device is powered by a generator and operated by a computer with software that allows a few texture parameters to be computed immediately after the scanning process. There is also an option to export raw surface data as a text file with X, Y, and Z coordinates, which can be used as an input for further processing.
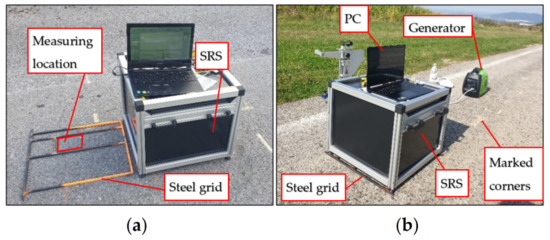
Figure 1.
The SRS (static road scanner). (a) the SRS with the steel grid; (b) the measuring set.
For the purpose of this study—to find the relationship between texture and skid resistance—it was of utmost importance to ensure the perfect localization of all measurements. For that reason, we manufactured a steel grid, the corners of which were marked on the pavement surface. The measurement location of the scans was determined by the construction of the SRS situated above the grid. The location of each scan was subsequently marked on the pavement for the following pendulum test. The measurement locations on the road section marked on the pavement surface can be seen in Figure 2.
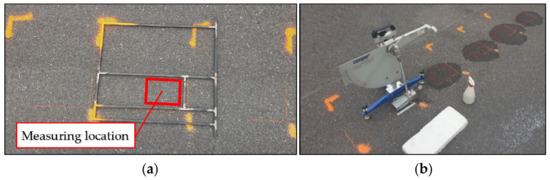
Figure 2.
The measurement locations marked on the pavement surface. (a) the steel grid for the measuring location determination; (b) the British Pendulum Tester.
2.2. The Pendulum Test
The test method used for determining the skid resistance was the pendulum test [31]. This method has been in use for over 60 years. Since the pendulum tester (Figure 3) is a device that remains stationary at the measuring spot, it is not often used to evaluate road networks. However, it is still widely used for research purposes.
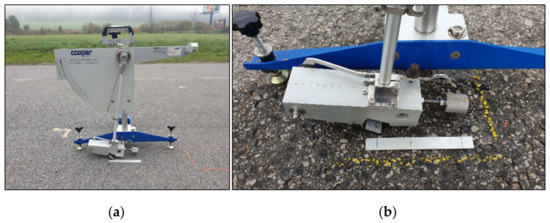
Figure 3.
The pendulum tester. (a) the British Pendulum Tester; (b) determination of the slip length of a rubber slider.
According to [31], the test results are referred to as a Pendulum Test Value (PTV). The PTV is a measure of friction between a rubber slider mounted at the end of the arm and the testing surface. The friction is determined by the loss of kinetic energy of the pendulum arm due to the rubber slider sliding over the constant length of a testing surface. The area of the surface in contact with the slider is approximately 0.01 m2. The slip speed of the slider is low (~10 km/h). Considering the presumption that the friction at low speeds is mainly affected by microtexture, the pendulum test is widely used as a surrogate device for microtexture-level approximation. However, the influence of the macrotexture on skid resistance measured by the pendulum is still a subject of research [32,33]. In the present study, the potential influence of micro- and macrotexture on the pendulum test value was estimated by the statistical significance of the texture parameters in the prediction model.
2.3. Methodology
Measurements with the two devices mentioned above were performed on 17 selected road sections to examine the possibility of predicting skid resistance using texture parameters. The essential criterion of measuring site selection was the highest possible diversity of friction coefficients corresponding to a wide range of pavement surfaces with different levels of microtexture and macrotexture. On every road section (RS), 10 points were measured at an interval of 0.5 m. Thus, the relationship between PTV values and texture parameters was investigated for 170 points.
All measurements were performed in similar weather conditions in the shortest time interval in order to eliminate the influence of climatic conditions. The study did not focus on the influence of the material or type of pavement, nor on degradation models; hence, the wearing course composition and traffic load information were not observed. All measurements were performed according to recommendations from previous experiments. Special attention was paid to achieving the highest possible accuracy of localization of measurements by different methods.
Three runs were conducted, providing a total scanned area of 30 mm × 120 mm, with a resolution of 15 µm. Previous experiments showed insufficient friction level description in relation to texture using 2D texture parameters. Thus, the surface morphology was evaluated by 3D texture parameters in this study. The methodology of textural data processing and evaluation is shown in Figure 4.
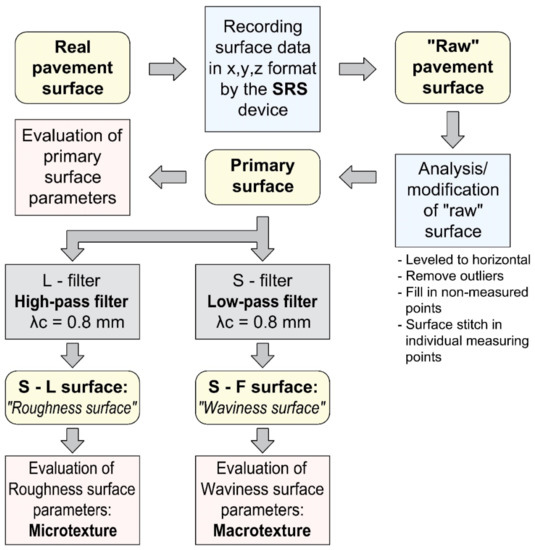
Figure 4.
Flowchart of the surface data analysis procedure.
After pavement surface scanning by the SRS, the raw data were processed and analyzed. Using the point coordinates X, Y, and Z, a surface of each of three measured stripes at one location was created. The surface was then aligned to a horizontal level. An example of one measured and leveled stripe with a selected profile is shown in Figure 5.
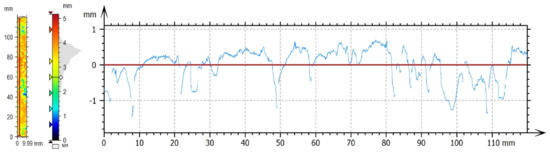
Figure 5.
The leveled surface and a selected profile.
The next step was the filtering of a raw, unfiltered dataset, and the removal of outliers [34]. As can be seen in Figure 6, the surface has some outliers and some missing parts. When scanning the road surface, outliers may occur, where the laser may capture dust particles, or measurement errors may occur due to reflection, resulting in an erroneous image of the surface. There are different ways to remove outliers, and each method focuses on a specific type of inaccuracy. This study used a method to remove isolated outliers, and a method of monitoring the maximum allowed slope of surface irregularities. The maximum slope was set according to the technical data of the SRS device (60°). Removed outliers were replaced by so-called “non-measured” data. These non-measured data were filled by interpolating the data, not only in a given profile, but of all adjacent data in the X- and Y-axes. This modified surface, however, still had parts missing. Such gaps can occur during the measurement if some surface points cannot be captured by the device (blind spots) due to the high slope of the surface irregularities. A close-up view of the surface before removing outliers, and after supplementing the non-measured data, is shown in Figure 6.
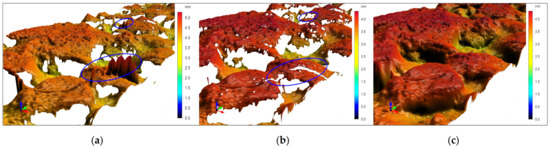
Figure 6.
The removal of outliers and supplementation with the non-measured data. (a) a scanned surface with outliers; (b) removal of outliers; (c) supplementation with the non-measured data.
The result of the raw surface processing was the primary surface (PS) used for subsequent evaluation. In addition to the primary surface, the texture parameters were analyzed for filtered surfaces with irregularities in the range of macrotexture and microtexture. The filtration process was carried out using Gaussian filters, as described in [35]. The surfaces used for the calculation of texture parameters were:
- Primary Surface (PS) is a surface created on the basis of preliminary processing of the raw measured data. This surface contains irregularities with wavelengths that belong to both the micro- and macrotexture levels;
- Roughness Surface (S-L) is a surface derived from the primary surface by suppressing the wavelength data components characterizing the macrotexture using a high-pass L-filter. The surface data were used to determine parameters describing the microtexture;
- Waviness Surface (S-F) is a surface derived from the primary surface by suppressing the wavelength data components characterizing the microtexture using a low-pass S-filter. The surface data were used to determine parameters describing the macrotexture.
The example of the 3D primary surface and derived roughness (microtexture) and waviness (macrotexture) surfaces are shown in Figure 7, Figure 8 and Figure 9, respectively.
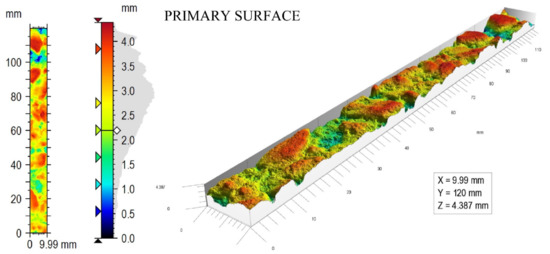
Figure 7.
The example of a primary surface.
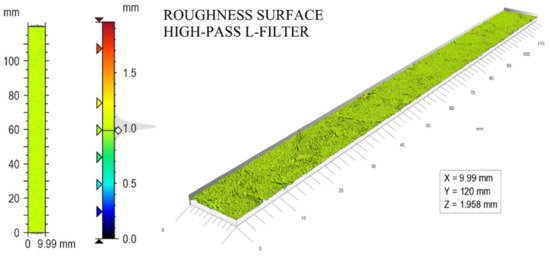
Figure 8.
The example of a roughness surface (microtexture).
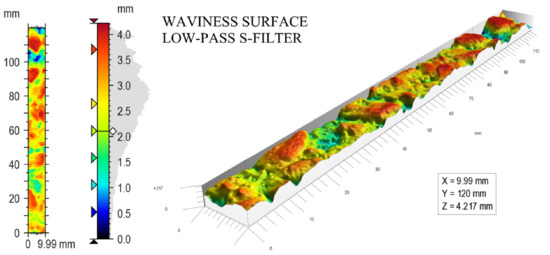
Figure 9.
The example of a waviness surface (macrotexture).
To find the relationship between pavement texture and skid resistance, we calculated 3D texture parameters as described in [36,37,38]. In addition to the commonly used height parameters (peak and pit height, kurtosis, skewness) and spatial parameters (autocorrelation length, texture aspect ratio, texture direction), we also calculated hybrid parameters (root-mean-square gradient, developed interfacial area ratio), volume parameters (volume of material or void), functional parameters (areal material ratio, core roughness depth, valley material portion, etc.) and feature parameters (density of peaks, arithmetic mean peak curvature, etc.). Overall, 85 texture parameters were calculated.
2.4. Texture Parameters Selected for Skid Resistance Prediction Model
Arithmetic mean peak curvature Spc (1/mm) is a feature parameter representing the arithmetic mean of the principal curvatures of peaks within a defined area. This parameter was used to describe the influence of macrotexture on skid resistance. Surface peaks were identified by surface segmentation. The segmentation process consists of finding all of the hills and valleys on the surface. Hills are defined as the area from which slopes lead to one particular peak. After identifying the peak site, the arithmetic mean peak curvature Spc is calculated according to the following formula:
where n is the number of peaks, z (x, y) are ordinate values, and (x, y) are used to identify the position of the calculation point. A higher Spc value indicates that the protrusions on the surface have pointed shapes. Conversely, a lower value indicates the rounded contact edges of the surface vertices. The graphical interpretation of the Spc is shown in Figure 10.
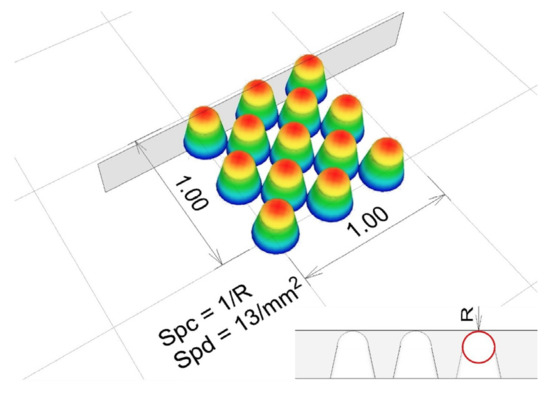
Figure 10.
The graphical interpretation of the Spc.
Root-mean-square gradient Sdq (-) is a hybrid parameter that indicates the mean magnitude of the local gradient (slope) of the scale-limited surface. The Sdq value of the completely level surface is 0. The surface is more steeply inclined as the value of the parameter Sdq becomes larger. It is calculated according to the following formula:
where A is the projected area of the scale-limited surface; z (x, y) are ordinate values, and (x, y) represent the position of the calculation point. This parameter was used to describe the influence of microtexture on skid resistance.
Functional characteristics of the surface are calculated from the results of peak and valley regions using the Abbott–Firestone curve. They are used to evaluate the behavior of a surface that comes into mechanical contact. Schematic presentation of the Abbott–Firestone curve and the functional parameters is shown in Figure 11.
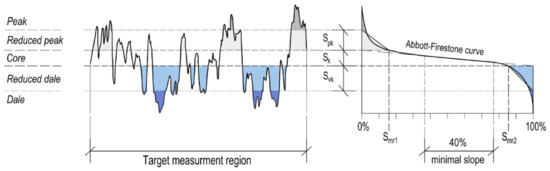
Figure 11.
Schematic presentation of the Abbott–Firestone curve and the functional parameters.
The profile of the road surface is imaginarily divided according to the Abbott–Firestone curve into 3 parts: the highest part represents the protrusions (peaks), the lowest part represents the depressions (valleys), and everything between these two limits is the core of the surface. When determining the cutoff height between the protrusions, the core, and the depressions, at least 40% of the profile heights corresponding to the straight line with the minimal slope of the Abbott–Firestone curve are determined. The slope of the line varies depending on the segmentation of the surface. The point where this imaginary line intersects with a line where the material ratio is 0% gives the limit height between the protrusions and the core—the reduced peak height (Spk), which is a measure of the peak height above the core. Accordingly, the Spk level indicates the percentage of material that comprises the peak structures—the peak material portion (Smr1); hence, this areal material ratio represents the measured area with a height of Spk or higher. On the other hand, the intersection where there is a 100% material ratio gives the limit height between the core and the depressions—the reduced valley depth (Svk); this is a measure of the valley depth below the core, which represents the average depth of the reduced valleys. Accordingly, the valley material portion (Smr2) relates to the percentage of the area that comprises the deeper valley structures associated with Svk.
Valley Material Portion Smr2 (%) represents an areal material ratio segmenting protruding valleys from the core.
Core height Sk (mm) difference between the highest and lowest levels of the core surface.
Void volume Vv(p) (mm3/mm2) represents a volume of the voids per unit area at a given material ratio calculated from the Abbott–Firestone curve. It is calculated according to the following formula:
where K is a constant to convert units, and Smc is an inverse areal material ratio.
Material volume Vm(p) (mm3/mm2) is calculated according to the following formula:
where Sdc is an inverse areal void ratio.
3. Results and Discussion
3.1. Evaluation of Skid Resistance Measured by Pendulum Tester (PTV)
For the determination of skid resistance, we used the pendulum test. The advantage of this method is the simplicity of the exact location of the measured point. The PTV results obtained on 17 road sections (170 measuring points) are shown in Table 1 and Figure 12.

Table 1.
PTV results on 17 road sections.
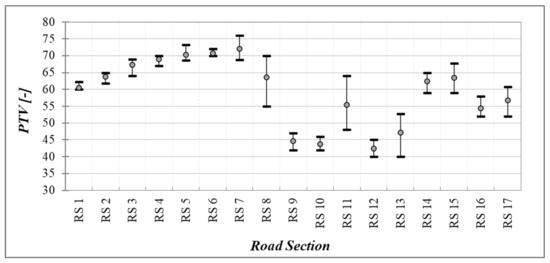
Figure 12.
PTV results on 17 road sections.
To find the most objective relation between surface texture and skid resistance, it was necessary to find different surfaces with the highest possible diversity of friction coefficients. This objective was satisfactorily met—see Table 1, where measured PTVs are in a range from approximately 40 to 75. This fact is better visible from Figure 12, where average, minimum, and maximum obtained values are presented. As can be seen, there is a wide range of values not only on different surfaces, but also at different points within some individual road sections (RS 8, RS 11, RS 13).
3.2. Evaluation of Texture Parameters
A total of 85 texture characteristics were evaluated for each surface. An example of the results of the obtained texture parameters is given in Table 2. The parameters stated here were chosen according to their statistical significance in the prediction model solved later. The data in the table are given to two decimal places for clarity, but all decimal places were considered. Examples of surfaces on selected road sections are shown in Figure 13.
Table 2.
Results of selected texture parameters on 17 road sections.
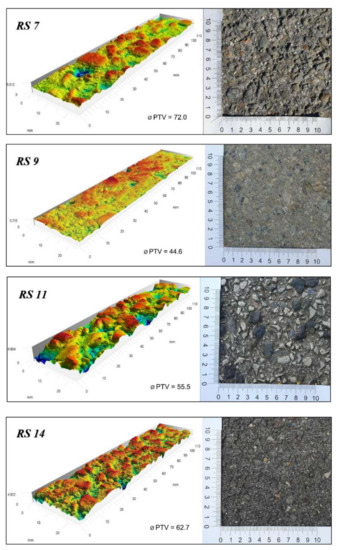
Figure 13.
Examples of surfaces with different levels of macro- and microtexture.
3.3. Evaluation of Relationships between Texture Parameters and Skid Reistance
After evaluation of texture parameters and coefficients of friction, the correlations between them were analyzed. These relationships were evaluated for primary surface, as well as for scale-limited surfaces. Only texture parameters with the most significant influence on the skid resistance prediction model (according to the multinomial regression explained later) are presented in the section below.
Roughness Surface (S-L)—Microtexture:
One of the examples chosen is a hybrid parameter calculated from the roughness surface—the root-mean-square gradient Sdq,MIC. The measured values, the range, and the comparison with the coefficient of friction PTV are shown in Figure 14.
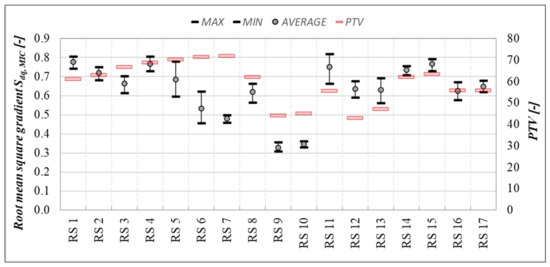
Figure 14.
Average values and the range of the root-mean-square gradient Sdq,MIC, and average values of PTV (red lines).
The relationships between root-mean-square gradient Sdq,MIC and values of PTV are shown in Figure 15. The assumption was that this texture parameter would have a significant favorable influence on skid resistance values.
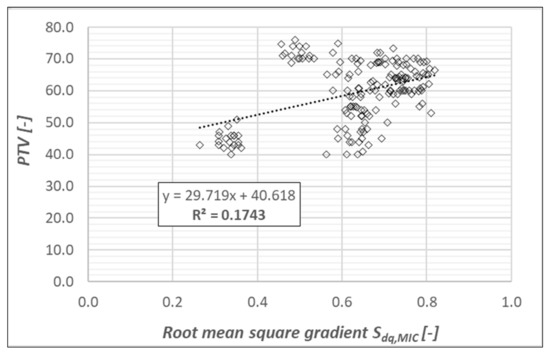
Figure 15.
The relationships between root-mean-square gradient Sdq,MIC and values of PTV.
In Figure 15, an increasing trend can be seen for the value of PTV. However, the relationship is not as strong as was expected. The trend is impacted by results obtained at road sections RS 11–13. These surfaces are rough and polished, characterized by a high level of macrotexture and a low level of microtexture. Although the root-mean-square gradient of these surfaces is relatively high, low PTV values were measured. This disproportion could be caused by the filtering effect of the relatively high macrotexture.
An ostensibly outlying group of values on the left side of the graph were recorded on the pavement surface of road section RS 9. This surface has low levels of both texture components and low values of PTV, as can be seen from the pictures of surfaces in Figure 13. The surface is smooth and polished. In this case, however, the evaluation using the parameter Sdq,MIC in relation to the observed skid resistance can be considered correct. Stated facts and obtained correlations indicate that it is impossible to predict skid resistance using this texture parameter (Sdq,MIC) alone, and that a combination of several parameters is necessary.
The following example represents the valley material portion Smr2,MIC. The premise was that the most significant influence on skid resistance would be from parameters such as the mean height of peaks above the core surface (Spk) or the peak material volume (Vmp). However, the obtained results show the best correlation using the Smr2,MIC, representing the percentage of a surface at the intersection of the core surface minimum height and the areal material ratio curve. The obtained values, the range, and the comparison with the coefficient of friction PTV are shown in Figure 16.
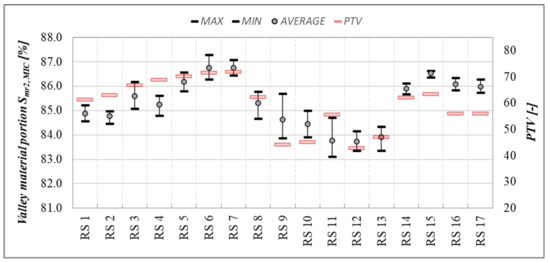
Figure 16.
Average values and the range of the valley material portion Smr2,MIC, and average values of PTV (red lines).
The relationships between the valley material portion Smr2,MIC and coefficients of friction PTV are shown in Figure 17.
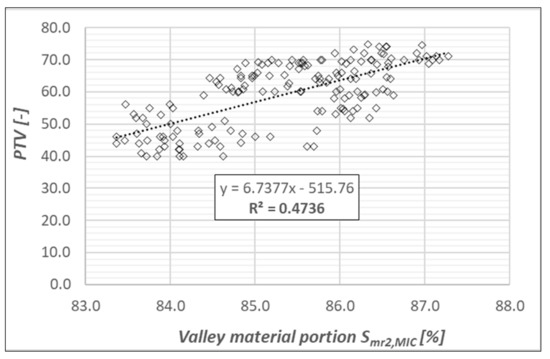
Figure 17.
The relationships between the valley material portion Smr2,MIC and values of PTV.
As can be seen in Figure 17, there is an undeniable trend with a relatively strong relationship between the Smr2,MIC and coefficient of friction PTV. The results indicate that the peaks, in combination with the core of the roughness surface, have the greatest influence on friction levels. However, the strength of the relationship is not high enough for the characteristic itself to predict the skid resistance. Therefore, as expected, it would be necessary to combine this texture parameter with another suitable characteristic describing the pavement texture and affecting the skid resistance in another way. Such parameters could include, for example, the peak density (Spd), mean peak curvature (Spc), or dale void volume (Vvv) calculated from primary or waviness surfaces.
Waviness Surface (S-F)—Macrotexture:
The premise was that there is a significant influence of the shape of surface protrusions on the skid resistance, due to the bumping of the rubber slider into the grains. For this purpose, we analyzed the arithmetic mean peak curvature Spc,MAC calculated from waviness surfaces. The obtained values, the range, and the comparison with the coefficient of friction PTV are shown in Figure 18.
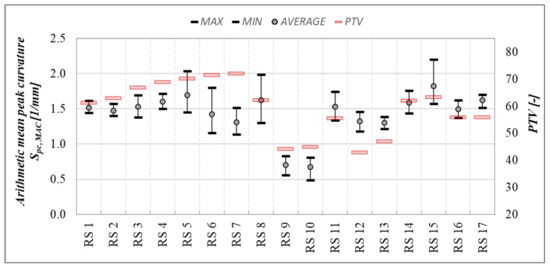
Figure 18.
Average values and the range of the arithmetic mean peak curvature Spc,MAC, and average values of PTV (red lines).
As can be seen in Figure 18, there are significant disproportions between measured friction and Spc,MAC values on the road sections RS 6 and RS 7 (Figure 13). These road sections are characterized by relatively large and rounded grains, which are harsh. This means that while Spc,MAC values are relatively low, the coefficients of friction (influenced by good microtexture) are high. The opposite case can be observed on the road sections RS 11–13, where there are significant irregularities formed by large grains with sharp edges (correct evaluation by the Spc,MAC), but the surface of these grains is smooth (low microtexture), resulting in low values of friction coefficients. The above-mentioned surfaces—RS 6, 7, 12, and 13—as far as the shape of grains are concerned, look very similar. Moreover, the Spc,MAC values are at approximately the same level. The biggest difference between them, as far as friction is concerned, is the microtexture level.
The relationships between the arithmetic mean peak curvature Spc,MAC and coefficients of friction PTV are shown in Figure 19.
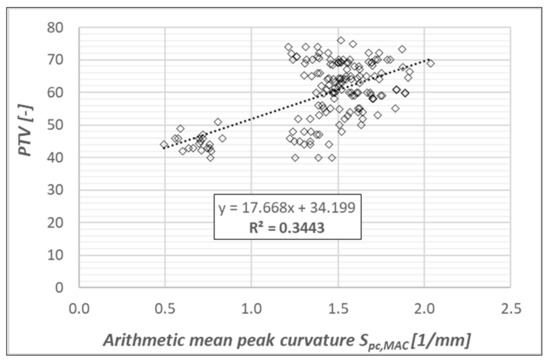
Figure 19.
The relationships between the arithmetic mean peak curvature Spc,MAC and values of PTV.
As shown in Figure 19, there is an undeniable trend with a moderate strength of the relationship between the Spc,MAC and coefficient of friction PTV. This suggests that the assumption of the effect of the shape of the protrusions on friction was correct.
As mentioned above, an ostensibly outlying group of values on the left side of the graphs were recorded on the pavement surface of road sections RS 9 and RS 10. The surfaces are characterized by low levels of both texture components (smooth and polished), and the evaluation using the parameter Spc,MAC in relation to observed skid resistance can be considered correct. On the other hand, the surfaces mentioned above—RS 6, 7, 12, and 13—as far as the shape of grains are concerned, look very similar. Moreover, the Spc,MAC values are approximately at the same level. The most significant difference between them, as far as friction is concerned, is the microtexture level. However, the arithmetic mean peak curvature of the surface protrusions undoubtedly affects the skid resistance. Therefore, its use in creating combinations of surface texture characteristics to predict the coefficient of friction was considered.
The obtained values from different methods were compared with one another and, based on the analysis of the results, some of the conclusions are as follows:
- It was confirmed that the microtexture has a significant effect on the level of friction (relationship Smr2,MIC–PTV);
- The arithmetic mean peak curvature Spc,MAC calculated from the waviness surface proved to be a characteristic of the macrotexture with a relatively significant effect on the level of friction in a separate evaluation, and with a significant effect in combination with the microtexture parameter Smr2,MIC, as revealed by the subsequent analysis;
- A significant effect of macrotexture on the microtexture parameters was observed, which may be due to the filtration effect of the primary surface, as well as due to insufficient resolution of the scanning device to detect the finest surface irregularities;
- Some volume characteristics, as well as characteristics of the number, area, and density of the protrusions, did not show such strong correlations as expected;
- It was confirmed that high values of individual texture parameters (at all levels) do not necessarily represent a high level of friction;
- The expected significant variance of the values of the texture parameters and values of PTV was confirmed (even within the same type of wearing course);
- It was shown that the prediction of the coefficient of friction based on non-contact measurements using only individual texture parameters (at all levels of texture) is not sufficient.
Based on the above, the next part of the research analyzed the influence of the mutual combination of surface texture parameters.
3.4. The Skid Resistance Prediction Based on the Surface Texture Characteristics
The basic premise for the creation of a prediction model was that the mutual combination of characteristics describing the different geometric properties of the surface—and, hence, influencing the tire–road interaction in different ways—would lead to a solid and reliable relationship between the friction and texture parameters. To determine the value of PTV prediction formulae based on texture parameters, a linear regression model was chosen, which can be generally described by the following equation:
where y a dependent variable (coefficient of friction PTV), x1, x2, …, xm are independent variables (texture characteristics), a0, a1, a2, …, am are parameters of the regression model, and m is the number of texture parameters entering the prediction model (m > 1 because of the multinomial regression).
Texture parameters entering the regression model were representative of both micro- and macrotexture. The choice of parameters for determining the prediction model was, on the one hand, based on the hypothetical assumptions of the possible influence of the characteristics on the PTV. On the other hand, the choice resulted from the conclusions of the analyses mentioned earlier. The selection of texture parameters and their mutual combination was ultimately subjected to verifying the statistical significance of the influence of individual parameters, as well as the complete regression models. The finding of the best combination of texture parameters, and the examination of the fitted models’ predictive accuracy, were performed using the cross-validation method in the Regression Learner application in the MATLAB software environment. In order to control the correct number of independent variables in the prediction model, in addition to the statistical parameters p-value and R2, we also calculated the parameters R2adjusted, root-mean-square error RMSE, and F-value from the F-test of overall significance. The process of adding texture parameters into the regression model was controlled by an R2adjusted value. If the R2adjusted increased along with R2 after adding a new parameter to the model, this texture parameter was included. Once the values of R2adjusted began to decrease despite the increasing value of R2, the process of adding the independent variables was completed [39]. Then, the statistical parameter p-value—describing the statistical significance of the independent variable—was checked. If the p-value was higher than 0.001, the texture parameter was excluded from the prediction model. Finally, the statistical significance of the regression model was verified by comparing the calculated F-value, which must be greater than the tabular value of the quantile Ftab.
Since the most significant relationship between the coefficient of friction and the texture was recorded using the valley material portion Smr2,MIC, this parameter was considered as the basis of every prediction model, into which other texture parameters were progressively added.
The prediction of the coefficient of friction (PTV):
The texture parameters for predicting the coefficient of friction PTV were chosen according to the assumption that the primary influence on PTV is the pavement microtexture. The parameters used in the prediction model were the valley material portion Smr2,MIC, the core height Sk,MIC, and the root-mean-square gradient Sdq,MIC, all calculated from the roughness of the surface.
Using multiple linear regression analysis, the following formula was obtained for the PTVpredicted calculation:
The results of verifying the accuracy and the significance of the prediction model using statistical parameters are shown in Table 3.
Table 3.
Regression coefficients and statistical parameters of the model based on texture parameters Sdq,MIC, Sk,MIC, and Smr2,MIC.
The regression model result and the comparison of the measured and calculated values of the coefficient of friction PTV, together with the coefficients for 95% confidence intervals and lines of prediction interval (P.I.), are shown in Figure 20.
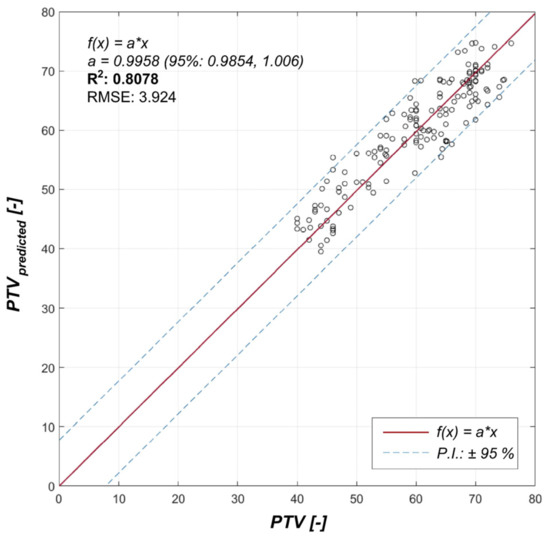
Figure 20.
Comparison of measured and predicted coefficients of friction (PTV).
As shown in Figure 20, and according to the obtained values of all statistical parameters shown in Table 3, the regression model is statistically significant and credible.
Another parameter added to the model for PTV prediction was the arithmetic mean peak curvature Spc,MAC. The assumption was that the addition of characteristics describing the shape of the vertices of the macrotexture in contact with the rubber slider would increase the correlation between friction and texture.
The equation for the prediction of the friction coefficient PTVpredicted, based on the combination of the independent variables Sdq,MIC, Sk,MIC, Smr2,MIC, and Spc,MAC, was determined using multiple linear regression analysis as follows:
The regression model result and the comparison of the measured and calculated values of the coefficient of friction PTV are shown in Figure 21.
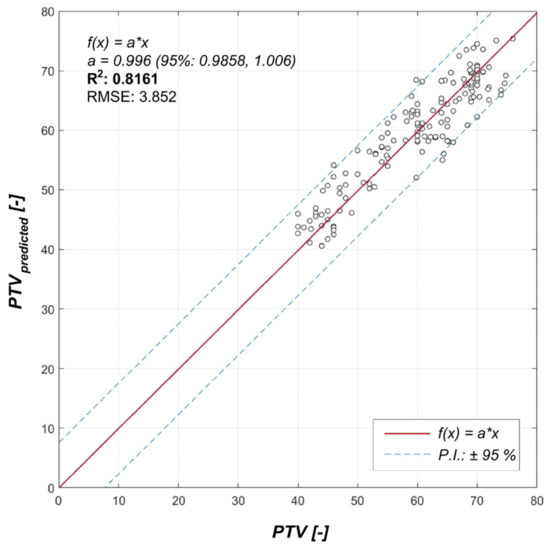
Figure 21.
Comparison of measured and predicted coefficients of friction (PTV).
The results of verifying the accuracy and the significance of the prediction model using statistical parameters are shown in Table 4.
Table 4.
Regression coefficients and statistical parameters of the model using Sdq,MIC, Sk,MIC, Smr2,MIC, and Spc,MAC.
As shown in Figure 21 and presented in Table 4, the assumption was confirmed, and the value of the coefficient of determination increased while the value of RMSE decreased compared to the model without the parameter Spc,MAC. However, a significantly higher p-value can be seen at coefficient a4 (applies to added texture parameter Spc,MAC), indicating much lower statistical significance compared to the previous three characteristics of the microtexture. Although the p-value was less than 0.05, the reproducibility decreased, and this model’s error rate can reach almost 20% [40]. Therefore, further measurements will be necessary in order to confirm or refute the hypothesis of the effect of this macrotexture parameter on the PTV value.
4. Conclusions
This article dealt with the analysis of the possibility of determining skid resistance on the basis of non-contact scanning of the road surface. The study was based on the experimental results, where were compared pavement texture parameters with coefficients of friction measured on a wide variety of surfaces, while other test conditions were kept the same and constant. Measurements were performed on 17 road sections. The measurements of the coefficients of friction were performed using the pendulum test. The surface texture was measured with the static road scanner using red laser sensors with a resolution of 15 µm. In the performed experiments, particular attention was paid to the exact locations of individual measurements. The obtained values from different methods were compared with one another, and based on the analysis of individual results, it was confirmed that the microtexture has a significant effect on the level of friction (relationship Smr2,MIC–PTV). The arithmetic mean peak curvature Spc,MAC, calculated from the waviness surface, proved to be a characteristic of the macrotexture with a relatively significant effect on the level of friction in a separate evaluation, and with a significant effect in combination with the microtexture parameter Smr2,MIC. It was shown that the prediction of the coefficient of friction based on non-contact measurements, using only individual texture parameters (at all observed levels), is not sufficient. Based on this statement, the next part of the research dealt with analyzing the influence of the mutual combination of surface texture parameters. A linear regression model was chosen to determine the friction coefficient prediction formula based on the combination of texture parameters. The significance levels of the prediction model and the individual texture parameters were verified. Based on the analysis of the relationships between the individual texture parameters and the values of PTV, this statistical significance can also be considered to be a measure of the parameters’ influence on the level of friction. The most important conclusions are as follows:
- The most statistically significant parameter in the prediction model proved to be the valley material portion Smr2,MIC, characterizing the microtexture of a surface and determining the basic level of friction;
- The arithmetic mean curvature of the protrusions Spc,MAC was proven to be an essential parameter of the macrotexture;
- After many attempts at mutual combinations of different texture parameters at different levels, the prediction of the coefficient of friction PTV confirmed that its value is influenced mainly by the microtexture of the surface;
- In determining the prediction of the PTV, the most suitable combination of microtexture characteristics proved to be Sdq,MIC, Sk,MIC, and Smr2,MIC, where the coefficient of determination between the predicted and measured values R2 = 0.8078 was achieved;
- After adding a characteristic describing the curvature of the protrusions of the macrotexture Spc,MAC, the coefficient of determination increased only slightly, to the value R2 = 0.8161. However, the statistical significance of the whole model (F-value) decreased, and the p-value of this characteristic was much higher than for the other three parameters of the microtexture. This finding confirms the widely used hypothesis that the microtexture of the surface has the most significant effect on the PTV.
Based on the obtained results and the mentioned facts, one of the main conclusions is the real possibility of predicting the value of the coefficient of friction PTV through texture characteristics, based on non-contact sensing of the road surface, with a relatively high degree of reliability. These conclusions, together with the rapid development of measurement and computational technology, as well as new and advanced means of processing and analyzing measured data, give a realistic assumption of replacing friction coefficient measurements, using standard methods subjected to many test conditions (measurement speed, tire tread depth, pressure, temperature, and water film thickness). At this point, however, it is necessary to draw attention to the identified weaknesses in the non-contact capture of significant properties of the road surface in terms of predicting the level of friction, which are:
- It was found that the resolution of the SRS device (15 µm) is still insufficient to obtain the relevant dependencies of friction and surface characteristics. Therefore, it is recommended to increase the sampling frequency in further experiments, thus improving the information about the microtexture of the pavement surface, which still appears to be crucial in terms of the level of friction;
- When comparing the results of different measurements, the exact determination of the measuring location also proved to be critical.
It should be stressed that the prediction models were created based on a limited set of surface data (170 points on 17 road sections), where some gaps in the range of measured values were observed. To confirm, to adjust, or to make prediction models more precise, it is recommended to perform additional experiments on other surfaces with different texture characteristics.
Author Contributions
Conceptualization, M.K., M.D. and M.B.; methodology, M.K., M.B. and M.D.; software, M.B.; validation, M.K. and M.B.; formal analysis, M.K., M.B. and M.D.; investigation, M.K. and M.B.; resources, M.K., M.B. and M.D.; data curation, M.B.; writing—original draft preparation, M.B.; writing—review and editing, M.K. and M.D.; visualization, M.B.; supervision, M.K. and M.D.; project administration, M.K.; funding acquisition, M.K. and M.D. All authors have read and agreed to the published version of the manuscript.
Funding
This research received no external funding.
Institutional Review Board Statement
Not applicable.
Informed Consent Statement
Not applicable.
Acknowledgments
This publication was realized with support of Operational Program Integrated Infrastructure 2014–2020 of the project: Innovative Solutions for Propulsion, Power and Safety Components of Transport Vehicles, code ITMS 313011V334, co-financed by the European Regional Development Fund.
Conflicts of Interest
The authors declare no conflict of interest.
References
- Kogbara, R.B.; Masad, E.A.; Kassem, E.; Scarpas, A.; Anupam, K. A state-of-the-art review of parameters influencing measurement and modeling of skid resistance of asphalt pavements. Constr. Build. Mater. 2016, 114, 602–617. [Google Scholar] [CrossRef]
- Transportation Research Board, Guide for Pavement Friction; Transportation Research Board: Washington, DC, USA, 2009. [CrossRef]
- Flintsch, W.G.; McGhee, K.K.; de León Izeppi, E.; Najafi, S. The Little Book of Tire Pavement Friction. Pavement Surface Properties Consortium. 2012. Available online: https://pdf4pro.com/view/the-little-book-of-pavement-friction-virginia-tech-5bae47.html (accessed on 26 September 2012).
- Permanent International Association of Road Congresses (PIARC). Report of the Committee on Surface Characteristics. In Proceedings of the 18th World Road Congress, Brussels, Belgium, 13–19 September 1987.
- ISO 13473-2:2002. Characterization of Pavement Texture by Use of Surface Profiles—Part 2: Terminology and Basic Requirements Related to Pavement Texture Profile Analysis; ISO: Geneva, Switzerland, 2002. [Google Scholar]
- Henry, J.J. Evaluation of Pavement Friction Characteristics, NCHRP Synthesis 291; National Cooperative Highway Research Program (NCHRP): Washington, DC, USA, 2000. [Google Scholar]
- Gunaratne, M.; Bandara, N.; Medzorian, J.; Chawla, M.; Ulrich, P. Correlation of Tire Wear and Friction to Texture of Concrete Pavements. J. Mater. Civ. Eng. 2000, 12, 46–54. [Google Scholar] [CrossRef]
- Cenek, P.D.; Carpenter, P.; Jamieson, N.J.; Stewart, P.F. Friction and Tyre Abrasion Characteristics of New Zealand Road Surfaces; Transfund New Zealand Research Report No. 94; California Transit Association: Sacramento, CA, USA, 1997. [Google Scholar]
- Ejsmont, J.A.; Ronowski, G.; Świeczko-Żurek, B.; Sommer, S. Road texture influence on tyre rolling resistance. Road Mater. Pavement Des. 2016, 18, 181–198. [Google Scholar] [CrossRef]
- ROSANNE. Rolling Resistance, Skid Resistance and Noise Emission Measurement Standards for Road Surfaces. European Union’s Seventh Framework Programme (FP7/2008–2013) under Grant Agreement No 605368. 2013. Available online: www.rosanne-project.eu (accessed on 31 October 2016).
- TYROSAFE—Tyre and Road Surface Optimisation for Skid Resistance and Further Effects. Grant Agreement No. 217920. n.d. Available online: https://trimis.ec.europa.eu/sites/default/files/project/documents/20120406_001647_43476_TYROSAFE%20FINAL%20Summary%20Report.pdf (accessed on 29 July 2010).
- FEHRL Report. Final Report SI2.408210 Tyre/Road Noise, n.d. Available online: https://circabc.europa.eu/sd/a/6a2cf3e7-7caf-48a7-ae46-450fabe47803/report_tyre_road_noise1_en.pdf (accessed on 17 August 2006).
- Sandberg, U.; Ejsmont, J.A. Tyre/Road Noise Reference Book; Infomex (1 January 2002); Politechnika Gdańska: Gdansk, Poland, 2002; ISBN 978-9163126109. [Google Scholar]
- Jandacka, D.; Kovalova, D.; Durcanska, D.; Decky, M. Chemical composition, morphology, and distribution of particulate matter produced by road pavement abrasion using different types of aggregates and asphalt binder. Cogent Eng. 2021, 8, 1884325. [Google Scholar] [CrossRef]
- RWambold, R.; Henry, J.C.; Hegmon, J.J. Evaluation of pavement surface texture significance and measurement techniques. Wear 1982, 83, 351–368. [Google Scholar] [CrossRef]
- Wesolowski, K.; Blacha, M. Evaluation of airfield pavement micro and macrotexture in the light of skid resistance (friction coefficient) measurements. MATEC Web Conf. 2019, 262, 05017. [Google Scholar] [CrossRef]
- Gardziejczyk, W.; Wasilewska, M. Assessment of Skid Resistance of Asphalt Mixtures in Laboratory Conditions. Arch. Civ. Eng. 2012, 58, 521–534. [Google Scholar] [CrossRef][Green Version]
- Heinrich, G.; Klüppel, M. Rubber friction, tread deformation and tire traction. Wear 2008, 265, 1052–1060. [Google Scholar] [CrossRef]
- Persson, B. Theory of rubber friction and contact mechanics. J. Chem. Phys. 2001, 115, 3840–3861. [Google Scholar] [CrossRef]
- Persson, B. Rubber friction and tire dynamics. J. Phys. Condens. Matter 2010, 23, 015003. [Google Scholar] [CrossRef]
- Ueckermann, A.; Wang, D.; Oeser, M.; Steinauer, B. Calculation of skid resistance from texture measurements. J. Traffic Transp. Eng. 2015, 2, 3–16. [Google Scholar] [CrossRef]
- Do, M.T.; Zahouani, H. Influence of the road-surface texture on the speed dependency of tire/road friction. In Proceedings of the 10th International Conference Metrology and Properties of Engineering Surface, Saint Etienne, France, 4–7 July 2005; Available online: https://hal.archives-ouvertes.fr/hal-00851275 (accessed on 13 August 2013).
- Rado, Z.; Kane, M. An initial attempt to develop an empirical relation between texture and pavement friction using the HHT approach. Wear 2014, 309, 233–246. [Google Scholar] [CrossRef]
- Yang, G.; Li, Q.J.; Zhan, Y.J.; Wang, K.C.P.; Wang, C. Wavelet based macrotexture analysis for pavement friction prediction. KSCE J. Civ. Eng. 2017, 22, 117–124. [Google Scholar] [CrossRef]
- Kokkalis, A.G.; Panagouli, O.K. Fractal Evaluation of Pavement Skid Resistance Variations. I: Surface Wetting. Chaos Solitons Fractals 1998, 9, 1875–1890. [Google Scholar] [CrossRef]
- Panagouli, O.; Kokkalis, A. Skid resistance and fractal structure of pavement surface. Chaos Solitons Fractals 1998, 9, 493–505. [Google Scholar] [CrossRef]
- Villani, M.; Scarpas, A.; de Bondt, A.; Khedoe, R.; Artamendi, I. Application of fractal analysis for measuring the effects of rubber polishing on the friction of asphalt concrete mixtures. Wear 2014, 320, 179–188. [Google Scholar] [CrossRef]
- Wang, Y.; Lai, X.; Zhou, F.; Xue, J. Evaluation of Pavement Skid Resistance Using Surface Three-Dimensional Texture Data. Coatings 2020, 10, 162. [Google Scholar] [CrossRef]
- Yan, Y.; Ran, M.; Sandberg, U.; Zhou, X.; Xiao, S. Spectral Techniques Applied to Evaluate Pavement Friction and Surface Texture. Coatings 2020, 10, 424. [Google Scholar] [CrossRef]
- Simone, A.; Lantieri, C.; Vignali, V.; Bitelli, G. 3D laser scanner technique for in situ analysis of road pavement surface texture. In Proceedings of the 7th International Conference on Maintenance and Rehabilitation of Pavements and Technological Control, Auckland, New Zealand, 28–30 August 2012. [Google Scholar]
- STN EN 13036-4. Road and Airfield Surface Characteristics. Test Methods. Part 4: Method for Measurement of Slip/Skid Resistance of a Surface: The Pendulum Test; British Standards Institution: London, UK, 2011. [Google Scholar]
- Lee, Y.P.K.; Fwa, T.F.; Choo, Y.S. Effect of Pavement Surface Texture on British Pendulum Test. J. East. Asia Soc. Transp. Stud. 2005, 6, 1247–1257. [Google Scholar]
- Pancar, E.; Karaca, Z. Reliability of british pendulum test on macrotextured surfaces. Int. J. Innov. Sci. Res. 2016, 5, 611–616. [Google Scholar]
- Bitelli, G.; Simone, A.; Girardi, F.; Lantieri, C. Laser Scanning on Road Pavements: A New Approach for Characterizing Surface Texture. Sensors 2012, 12, 9110–9128. [Google Scholar] [CrossRef] [PubMed]
- ISO 16610-61:2015. Geometrical Product Specification (GPS)—Filtration—Part 61: Linear Areal Filters—Gaussian Filters; ISO: Geneva, Switzerland, 2015. [Google Scholar]
- ISO 25178-1:2016, Geometrical Product Specifications (GPS)—Surface Texture: Areal—Part 1: Indication of Surface Texture; ISO: Geneva, Switzerland, 2016.
- ISO 25178-2:2012, Geometrical Product Specifications (GPS)—Surface Texture: Areal—Part 2: Terms, Definitions and Surface Texture Parameters; ISO: Geneva, Switzerland, 2012.
- ISO 25178-3:2012, Geometrical Product Specifications (GPS)—Surface Texture: Areal—Part 3: Specification Operators; ISO: Geneva, Switzerland, 2012.
- Frost, J. Regression Analysis: An intuitive Guide for Using and Interpreting Linear Models; Statistics by Jim Publishing: State College, PA, USA, 2019. [Google Scholar]
- Frost, J. Hypothesis Testing: An intuitive Guide for Making Data Driven Decisions; Statistics by Jim Publishing: State College, PA, USA, 2020. [Google Scholar]
Publisher’s Note: MDPI stays neutral with regard to jurisdictional claims in published maps and institutional affiliations. |
© 2021 by the authors. Licensee MDPI, Basel, Switzerland. This article is an open access article distributed under the terms and conditions of the Creative Commons Attribution (CC BY) license (https://creativecommons.org/licenses/by/4.0/).