Meso-Simulation and Experimental Research on the Mechanical Behavior of an Energetic Explosive


Abstract
1. Introduction
2. Basic Theory
2.1. Ultrasonic Nondestructive Testing
2.2. Acoustic Characteristics of the PBX Composite Materials
3. Results Predicting the Effective Elastic Modulus
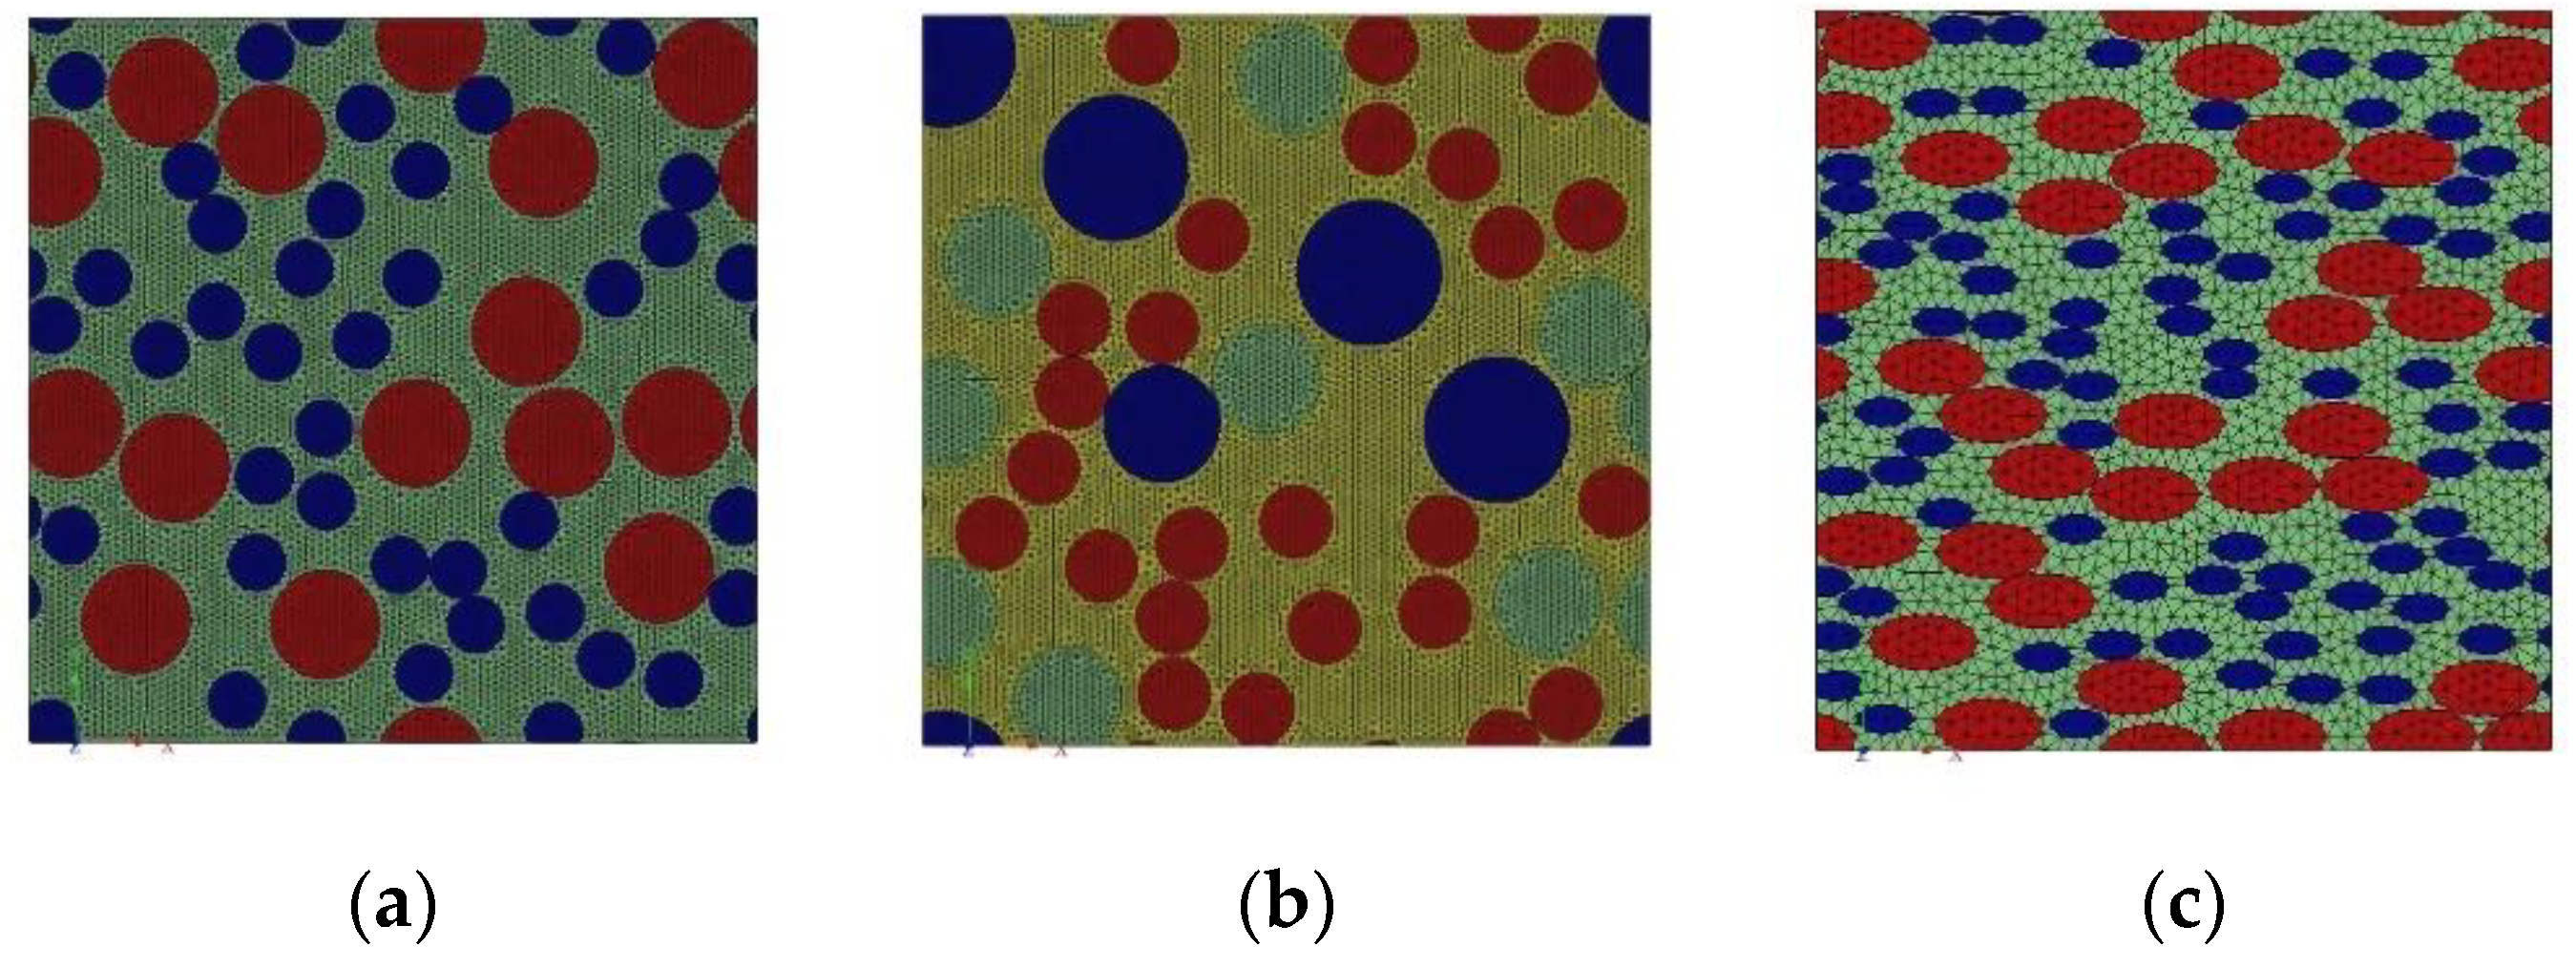
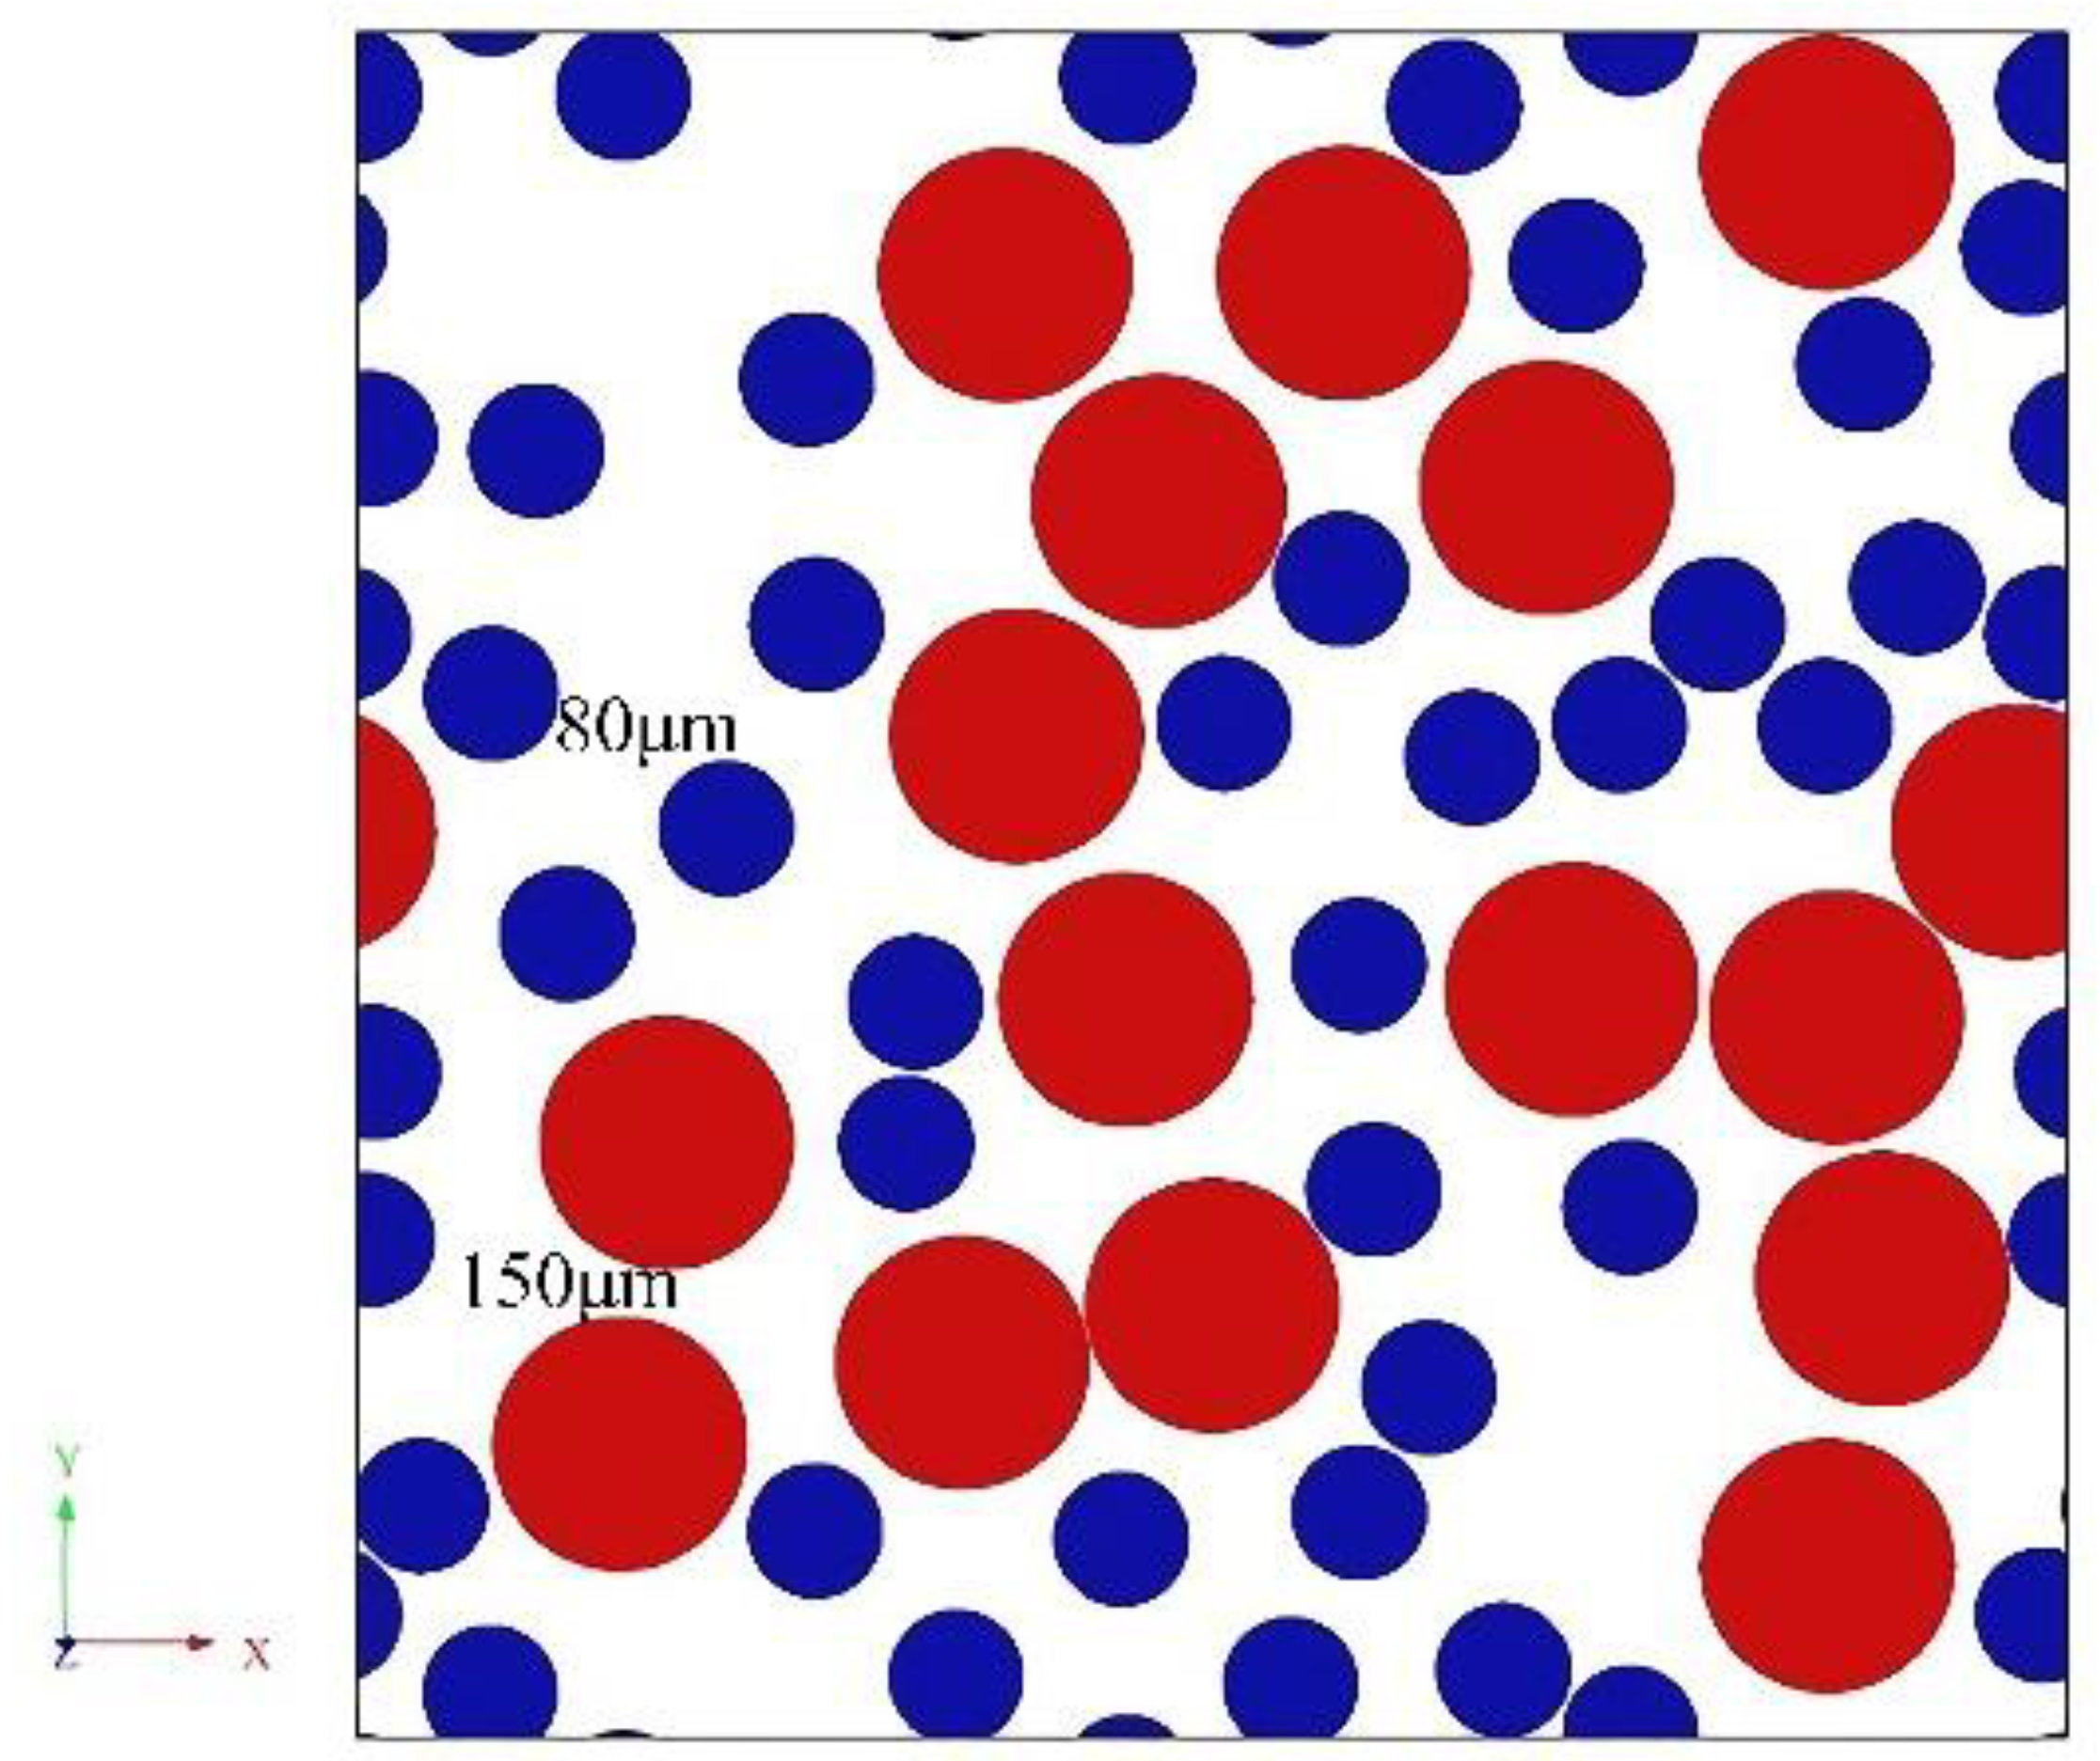
3.1. Three-Phase RVE Model of the PBX Particles, Binder, and Pores
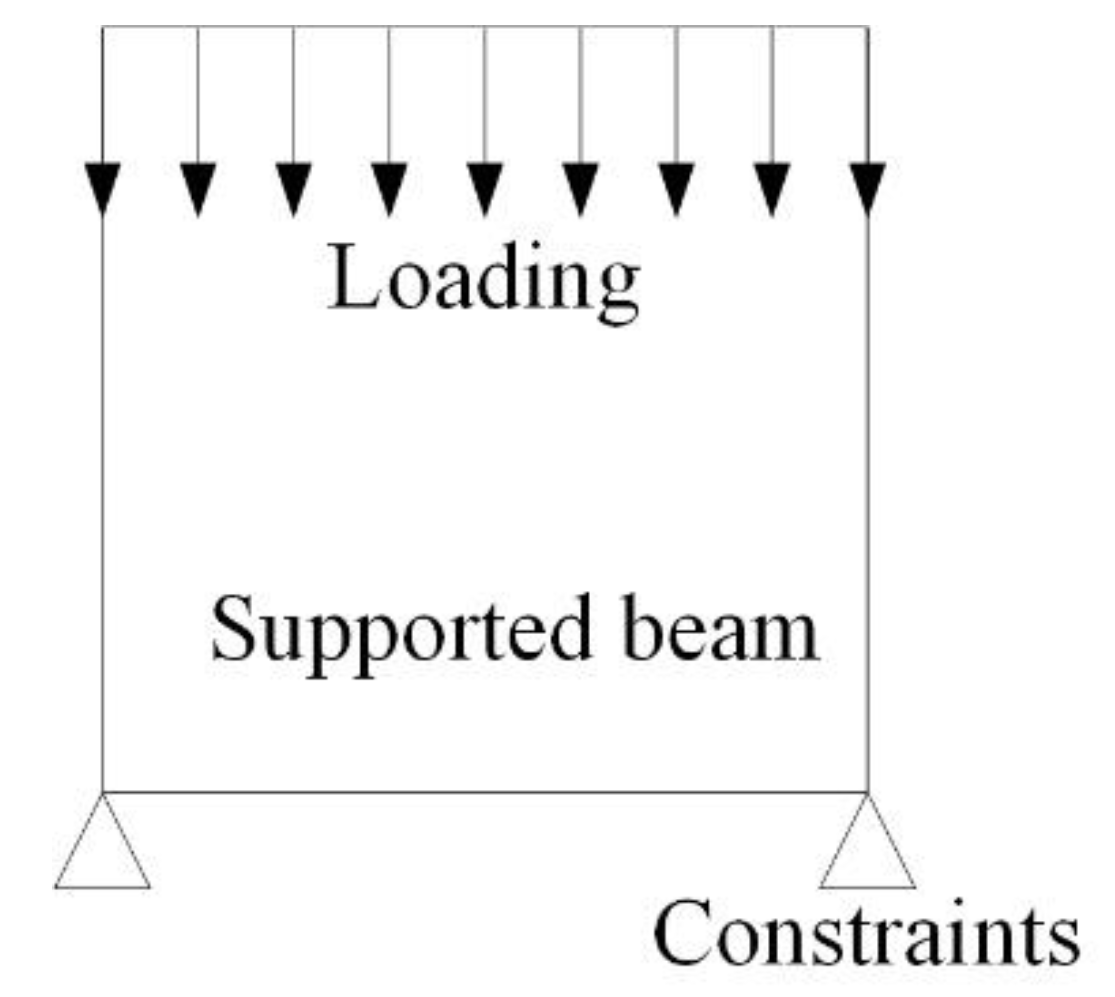
3.2. Calculating the PBX Effective Elastic Modulus
3.3. Factors Influencing the Effective Elastic Modulus
3.3.1. Volume Fraction of the Explosive Particles
3.3.2. Shape and Gradation of the Explosive Particles
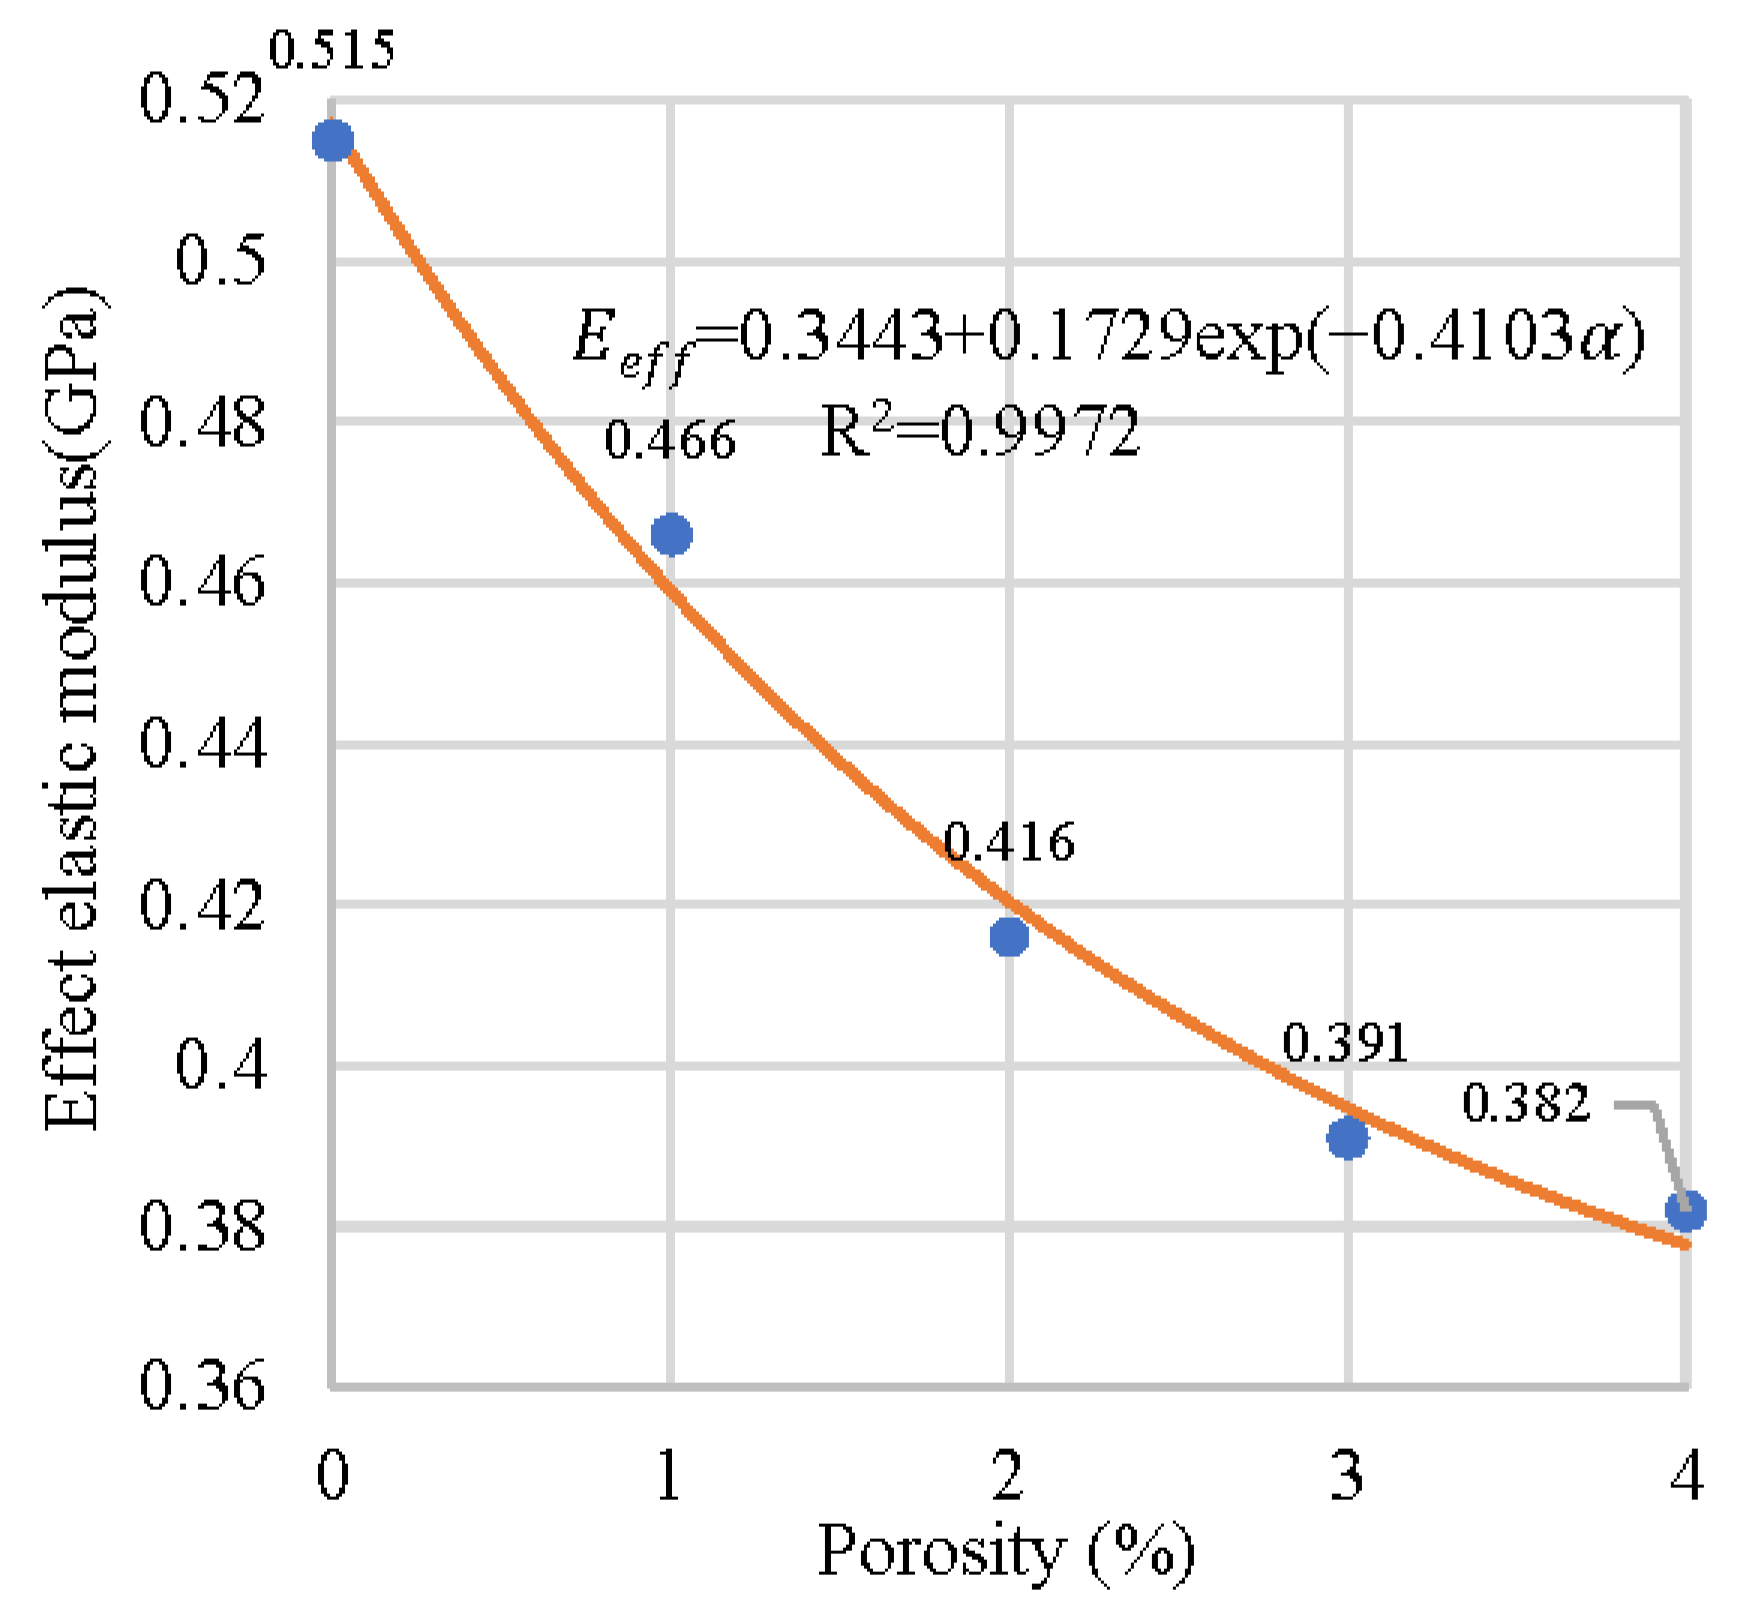
3.3.3. Porosity
4. Simulation Calculation of the Ultrasonic Attenuation Coefficient
4.1. RDX/Estane Two-Phase RVE Model
4.2. Ultrasonic Loading and Attenuation Coefficient Calculation Principle
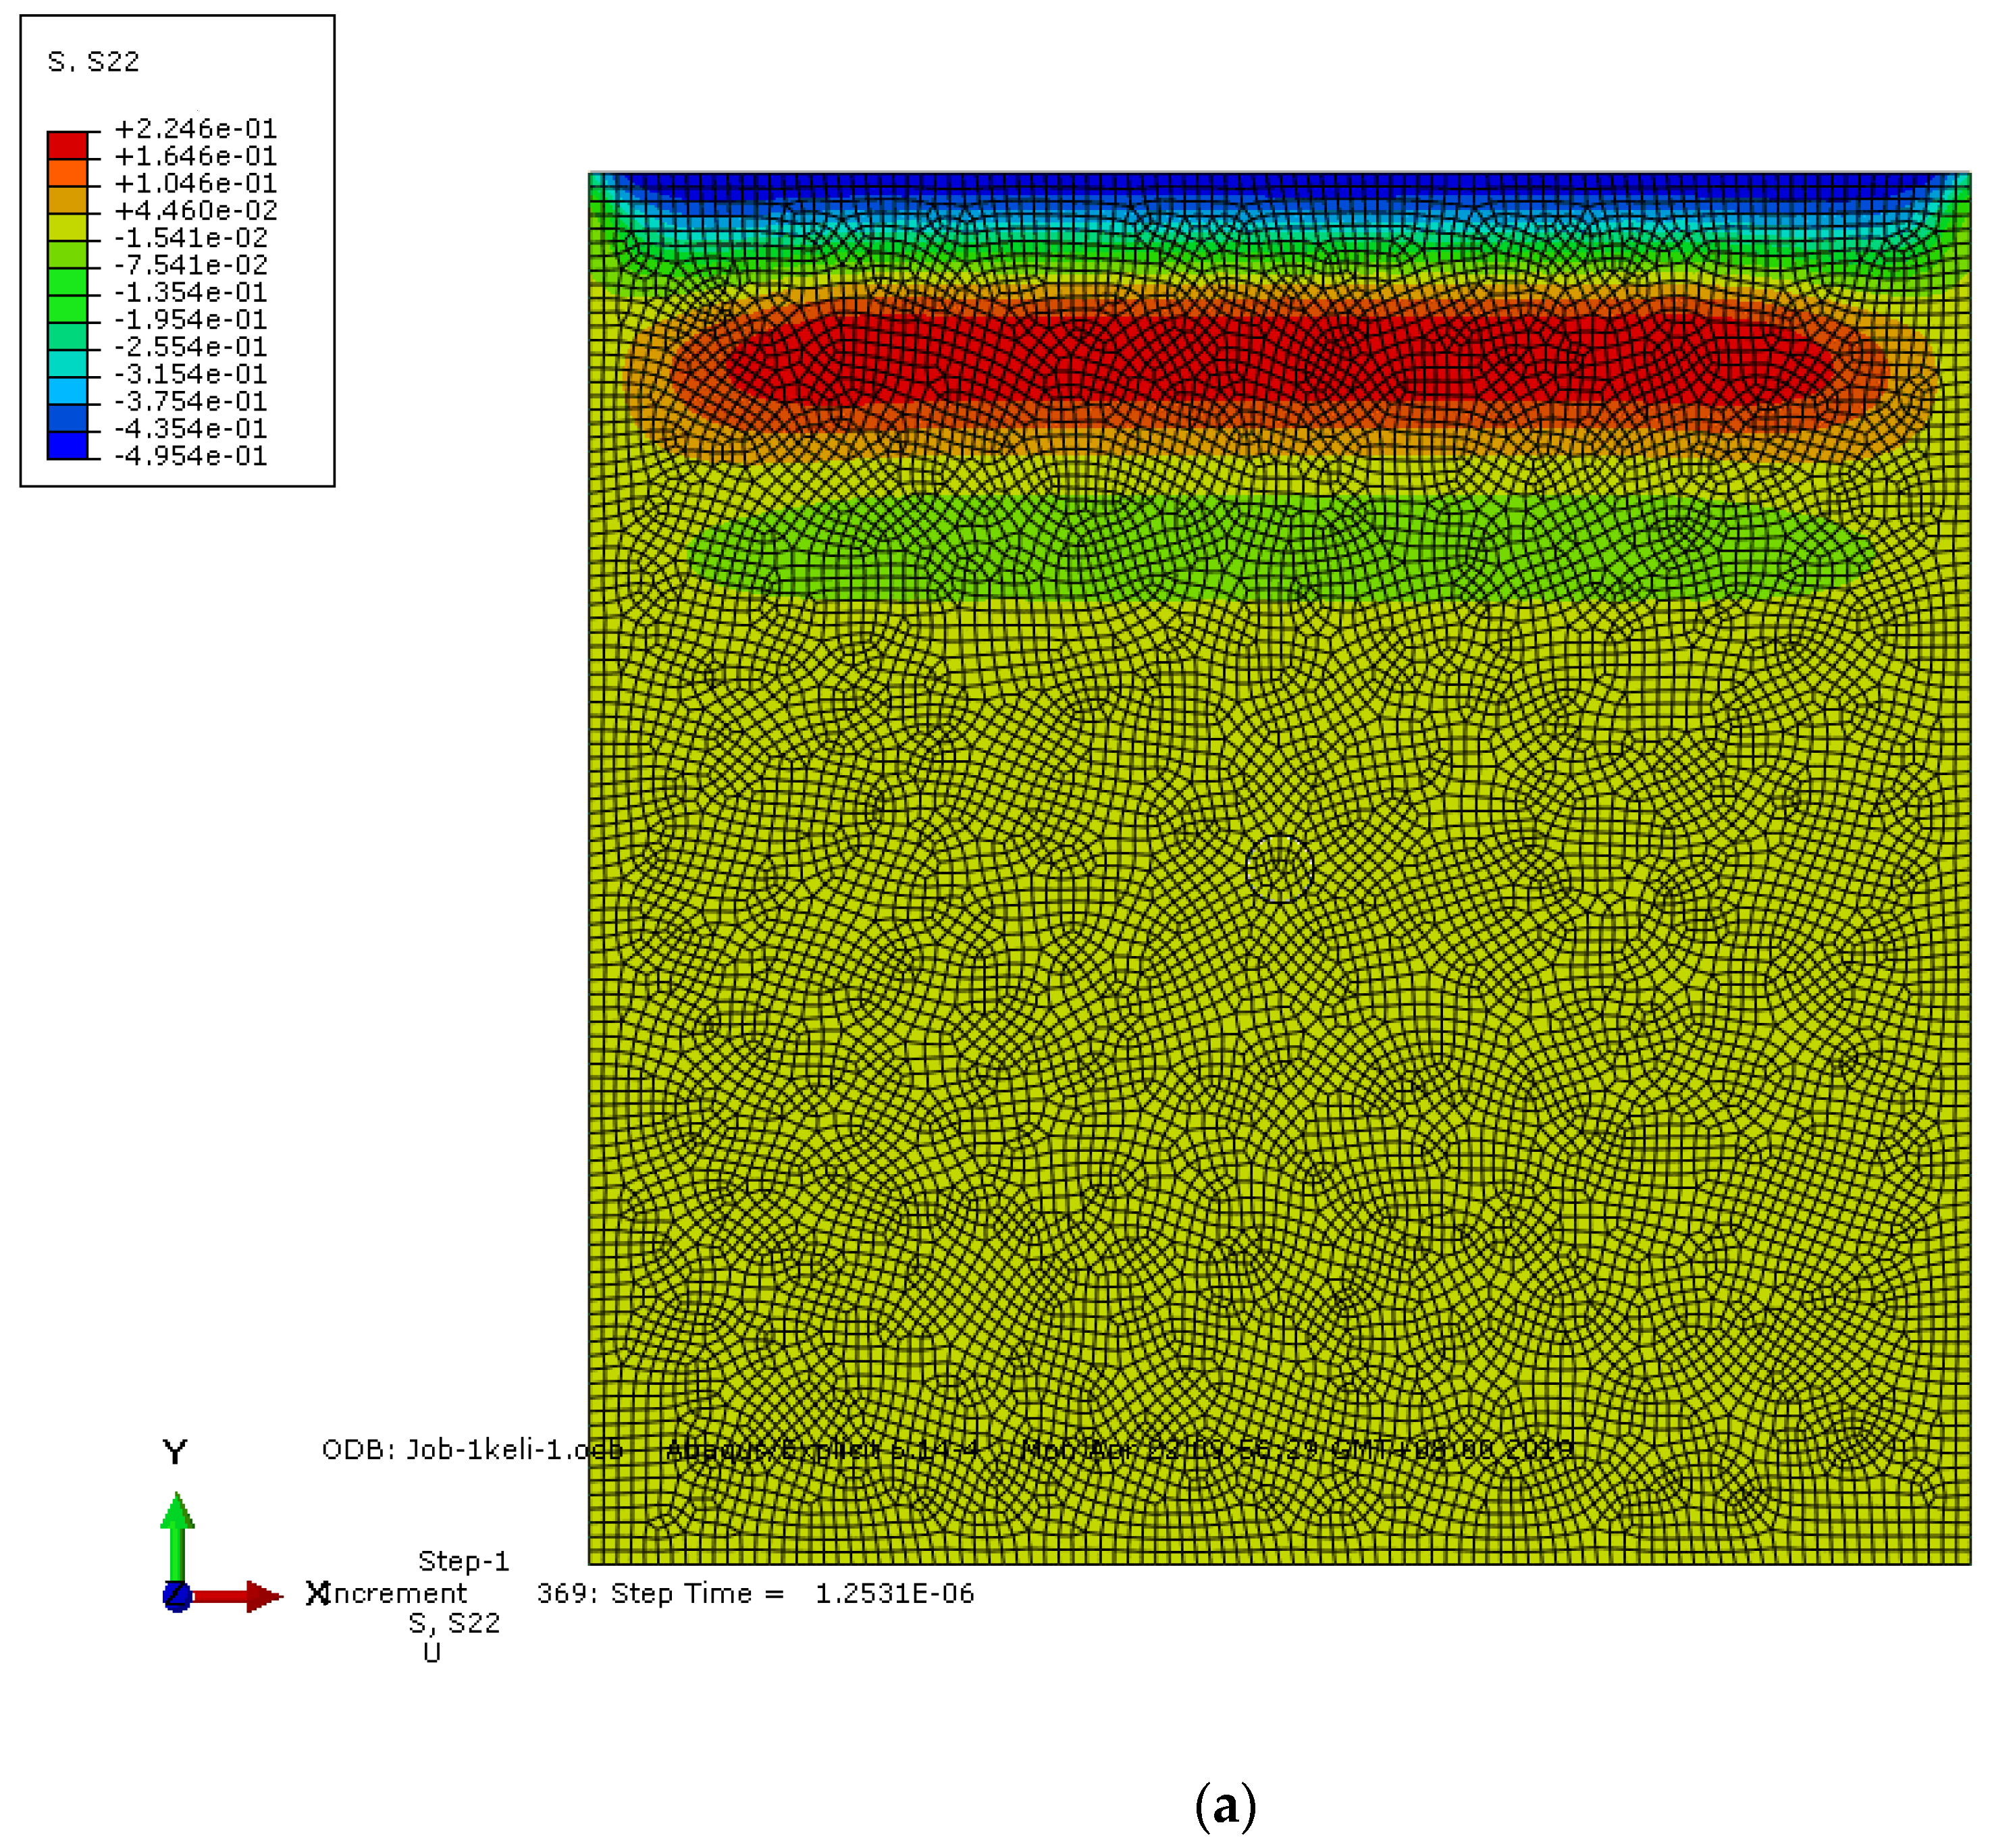
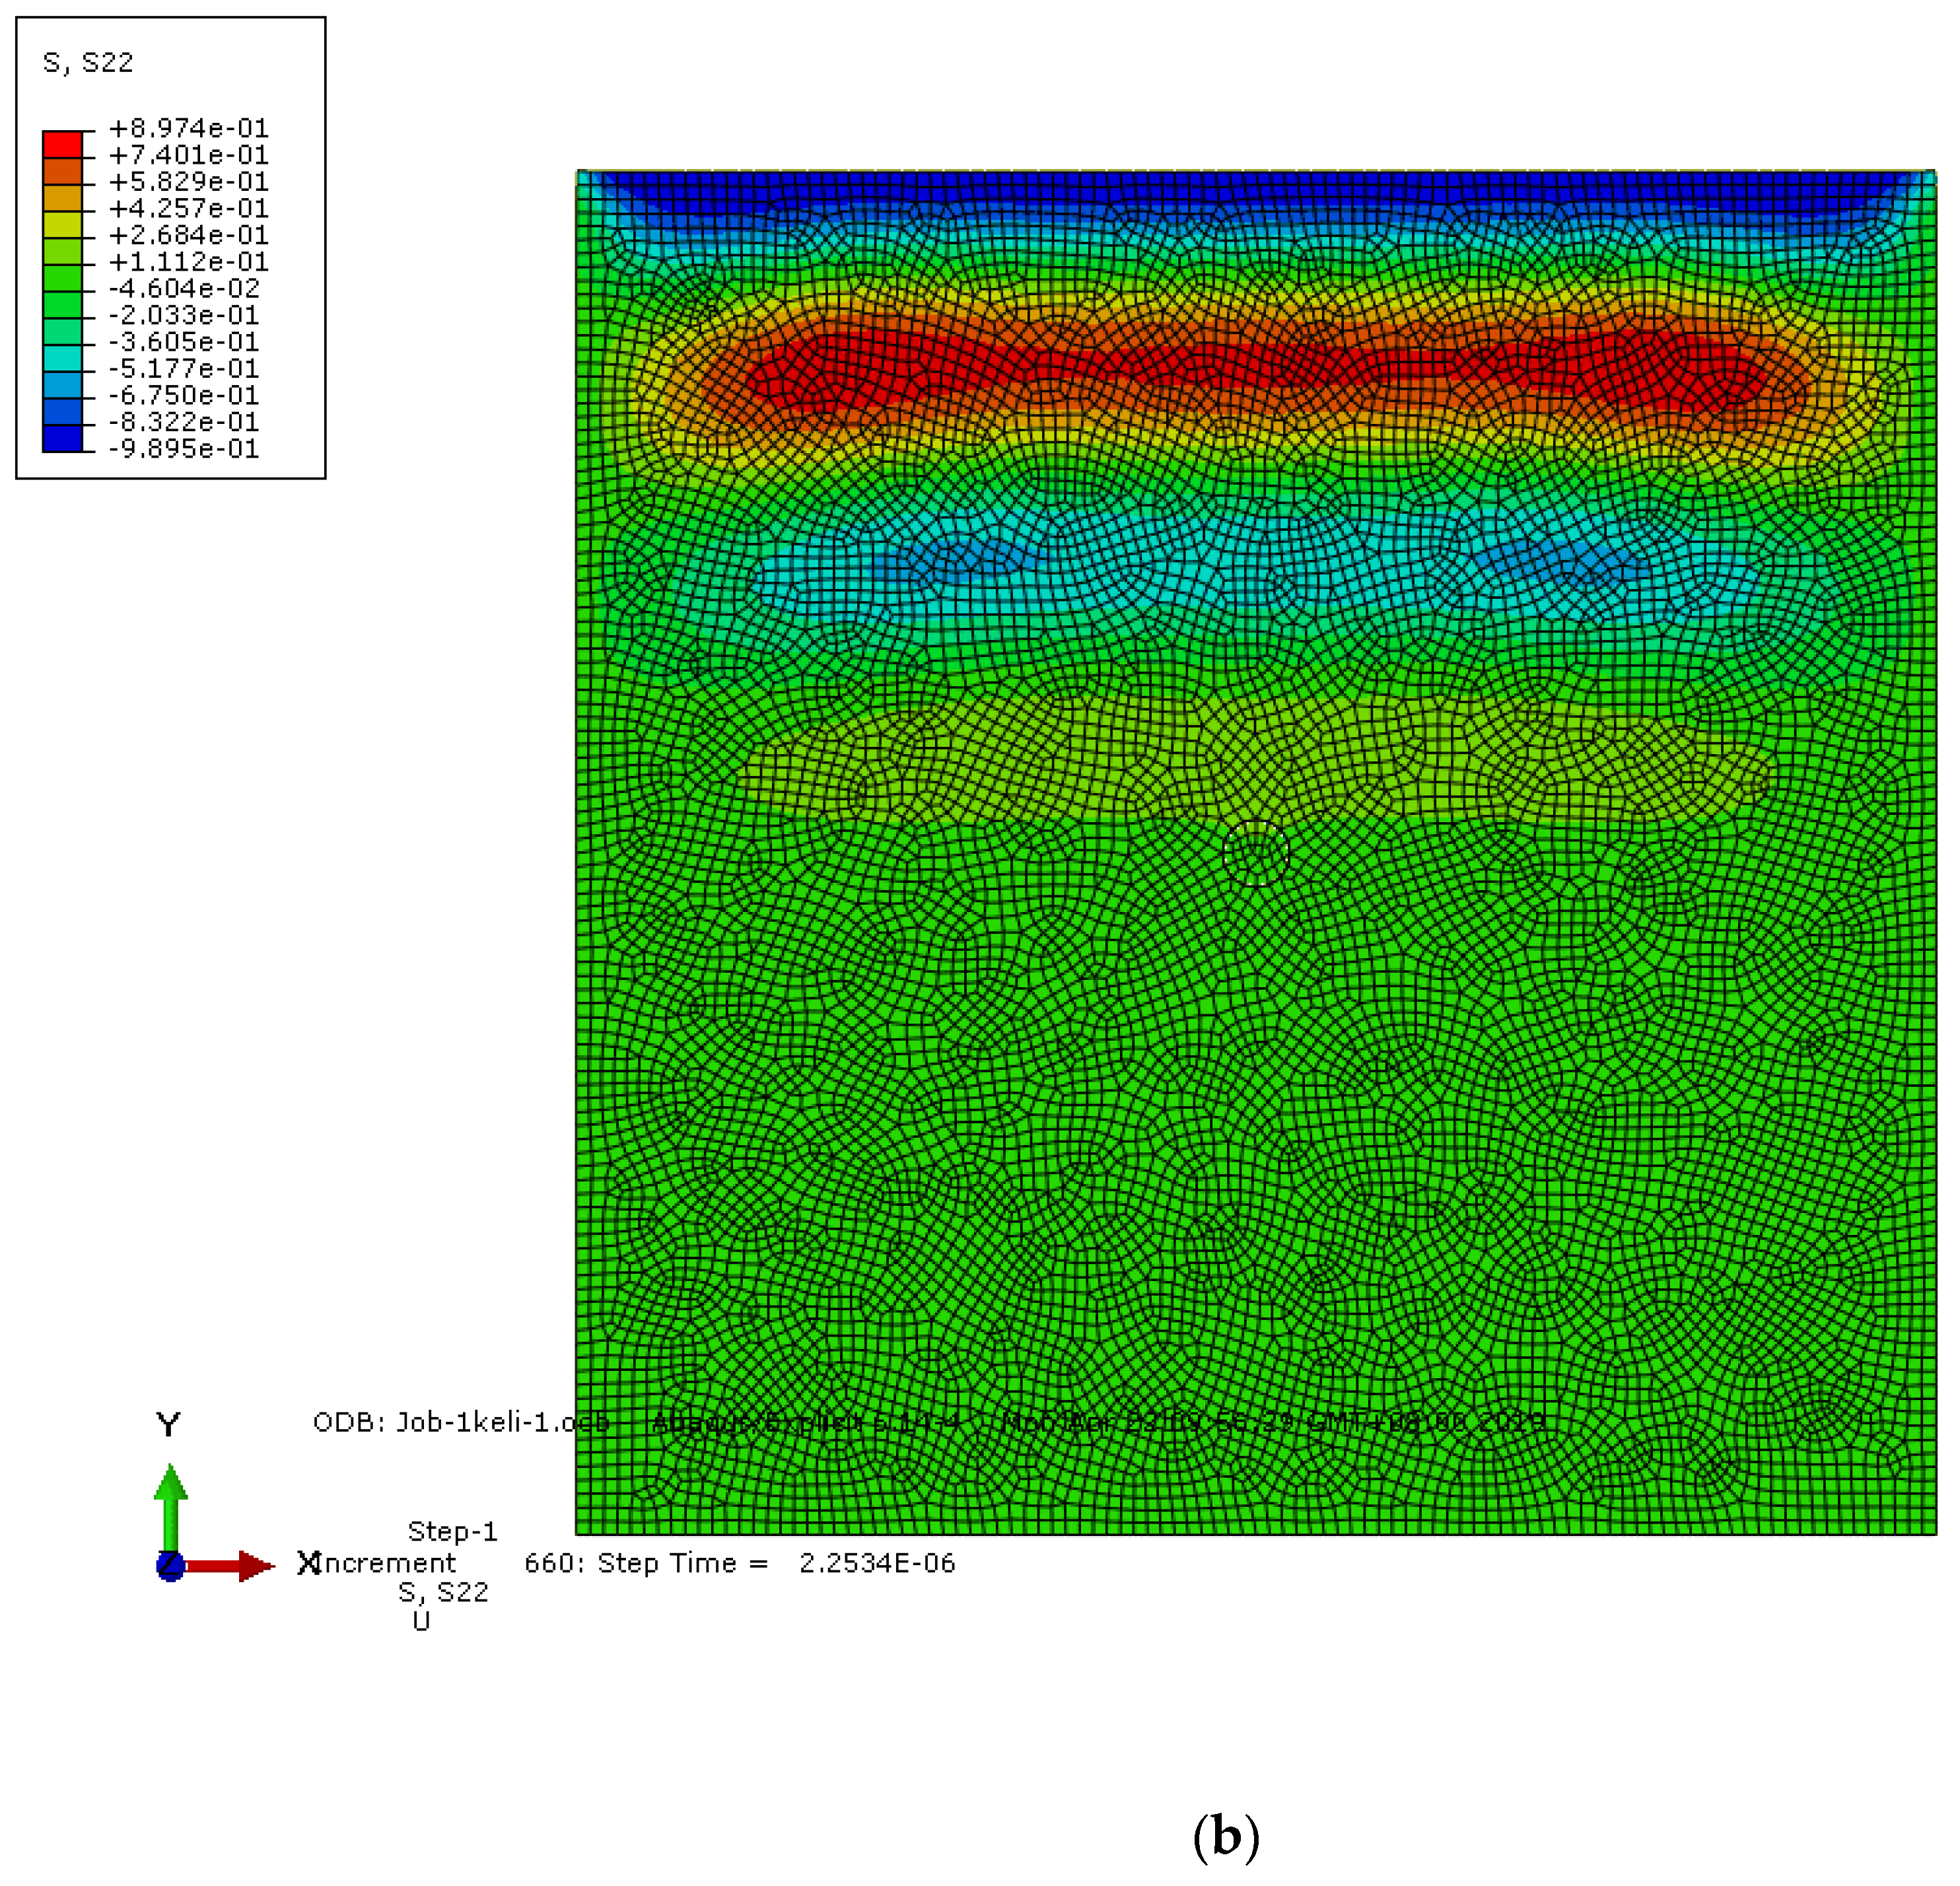
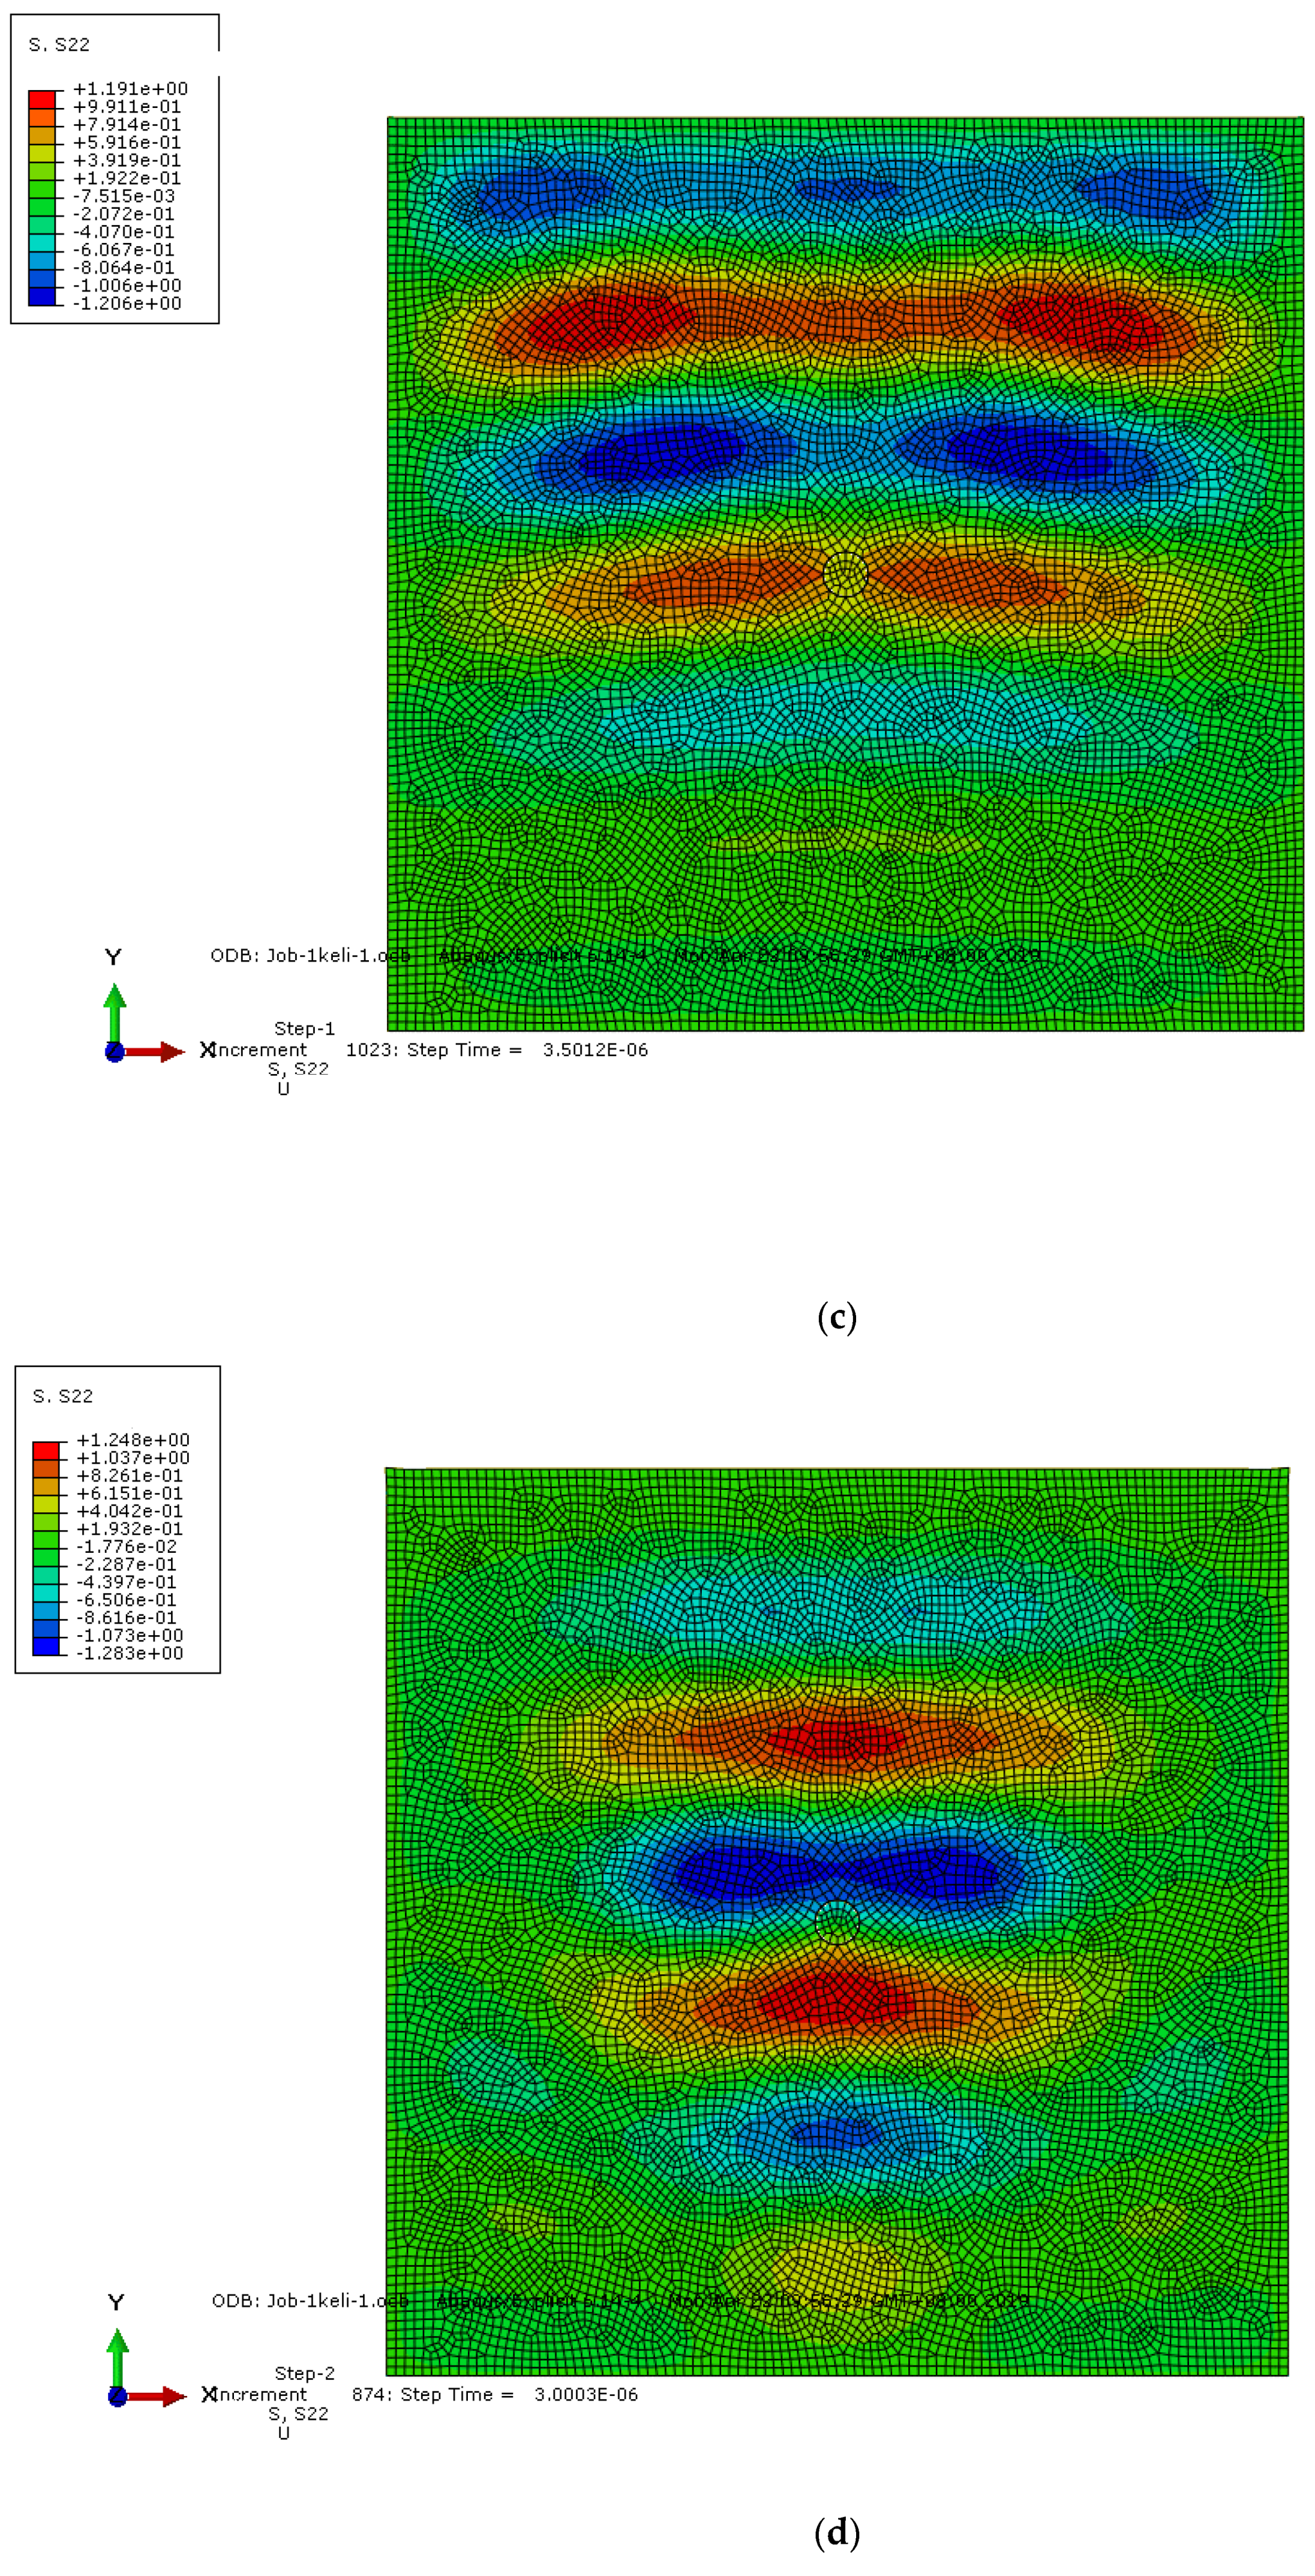
4.3. Finite Element Analysis of the Sound Field for the RVE Model
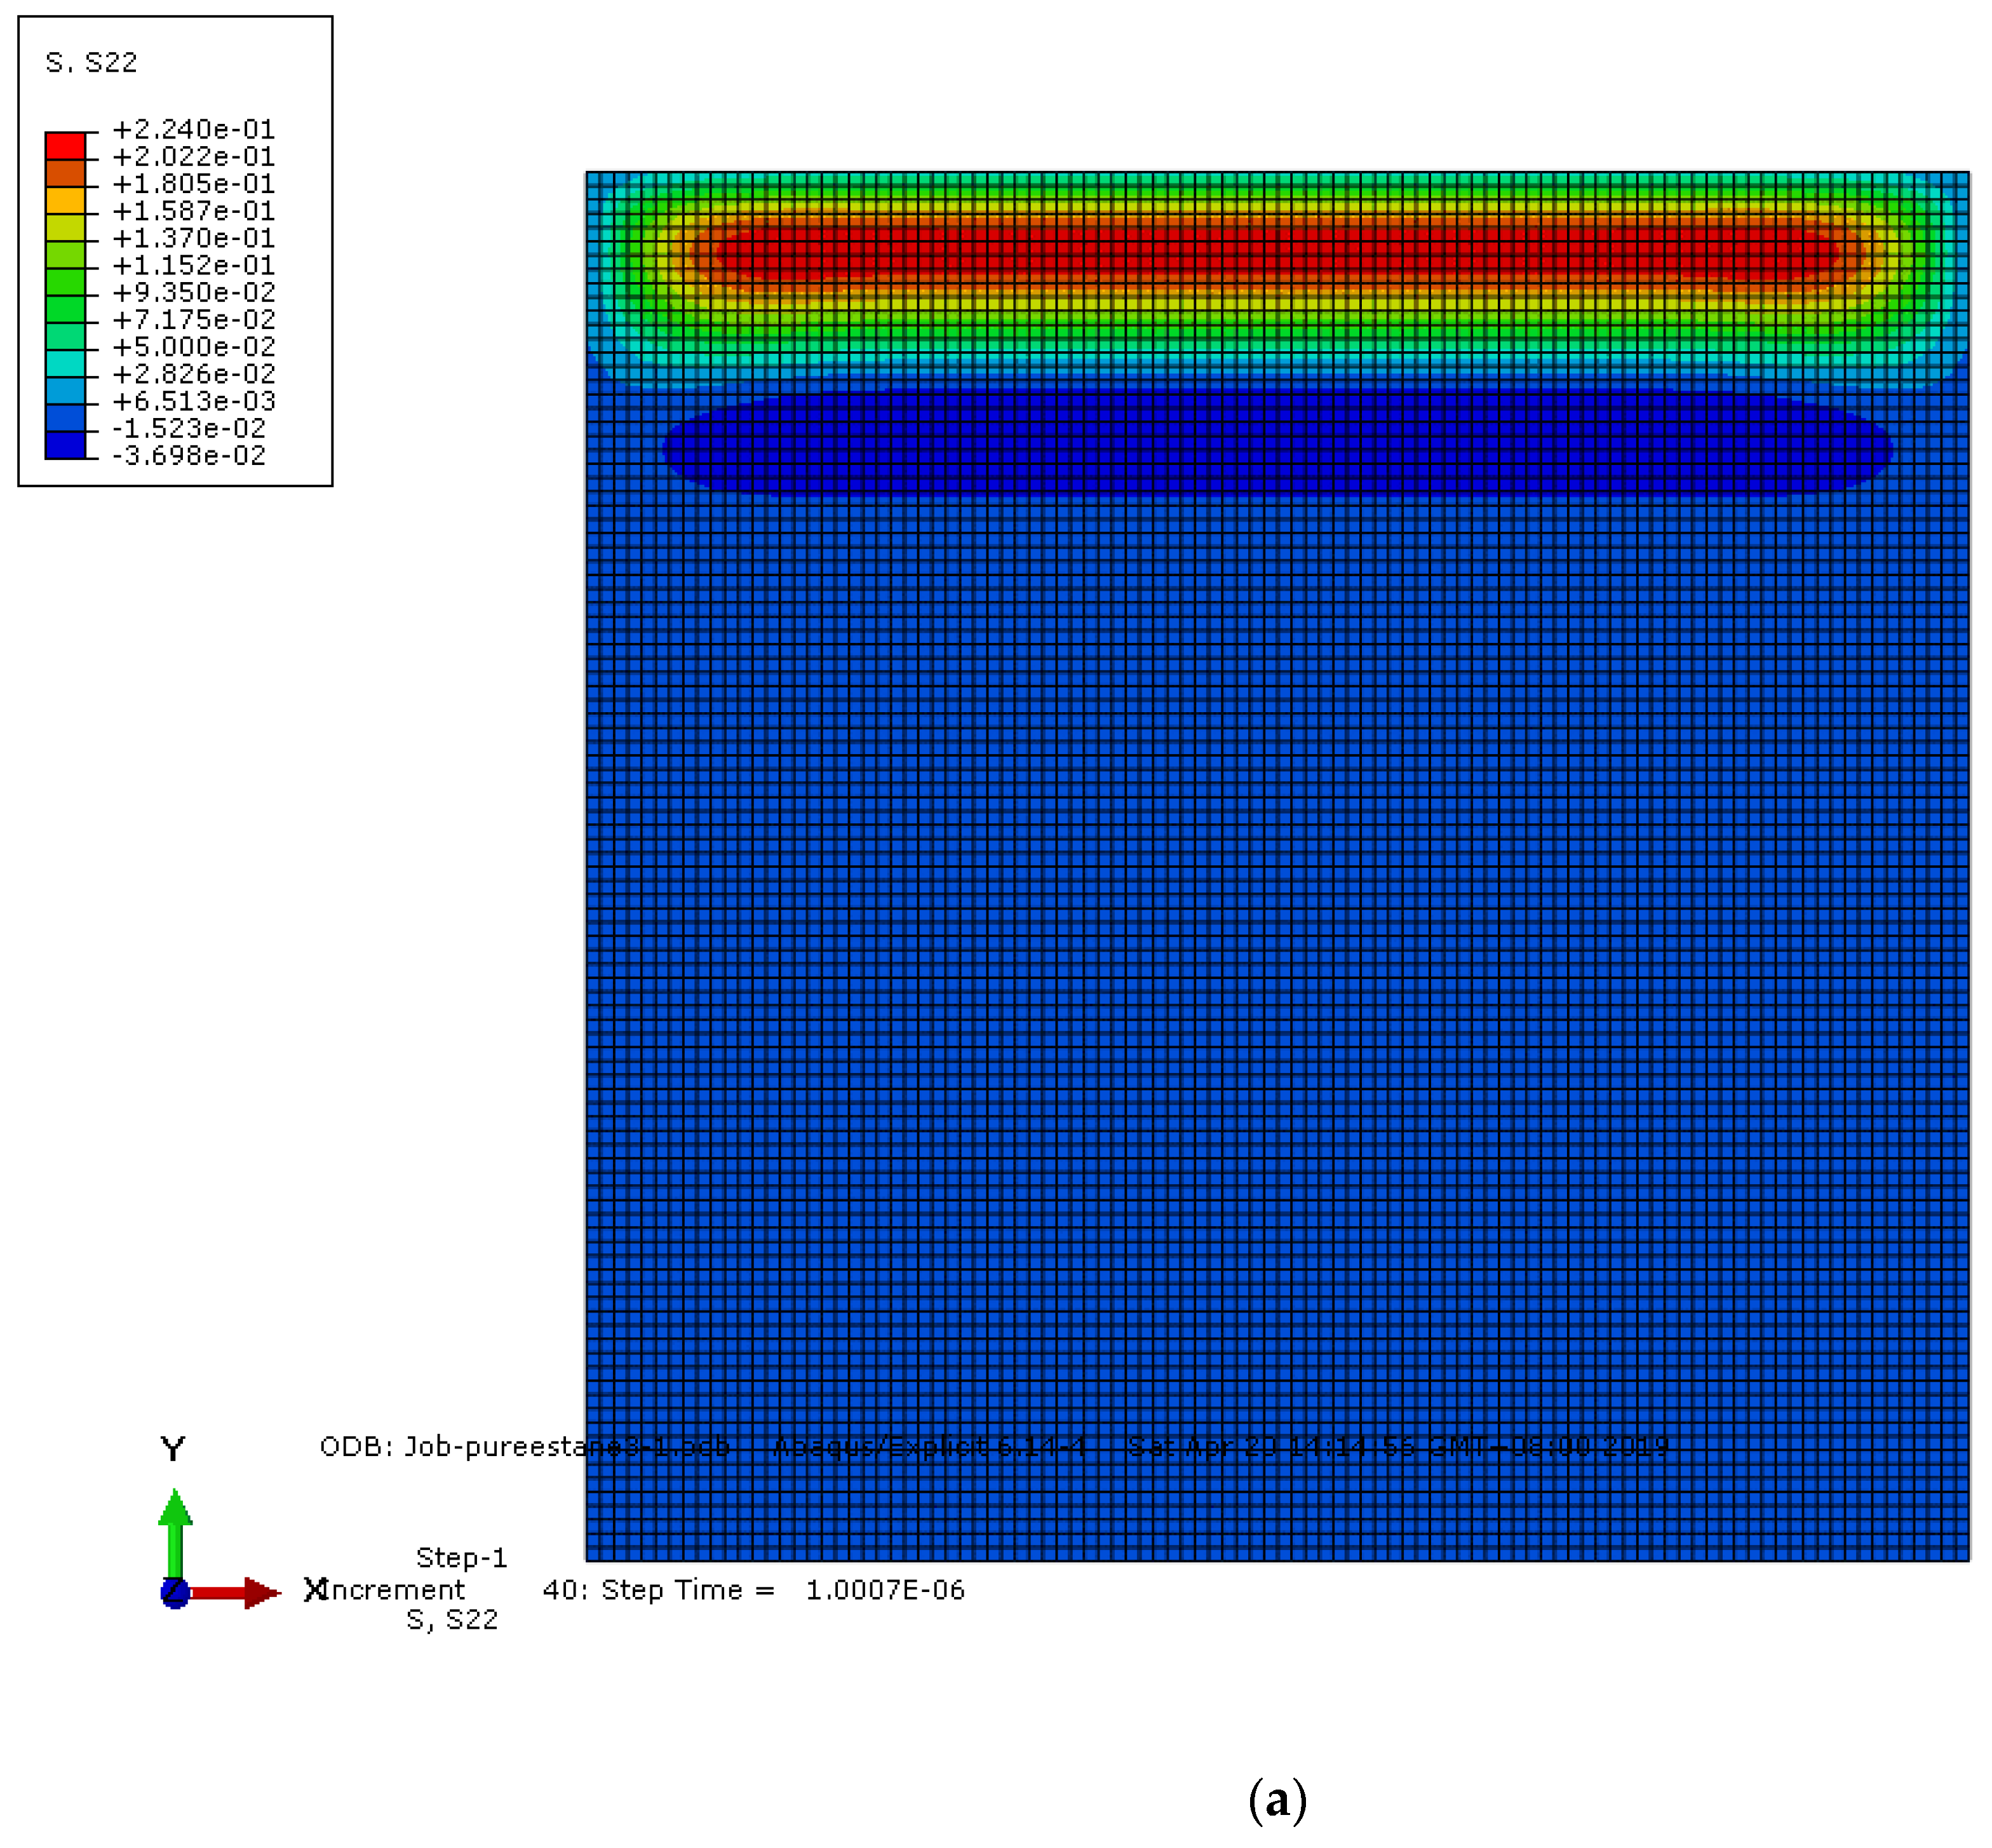
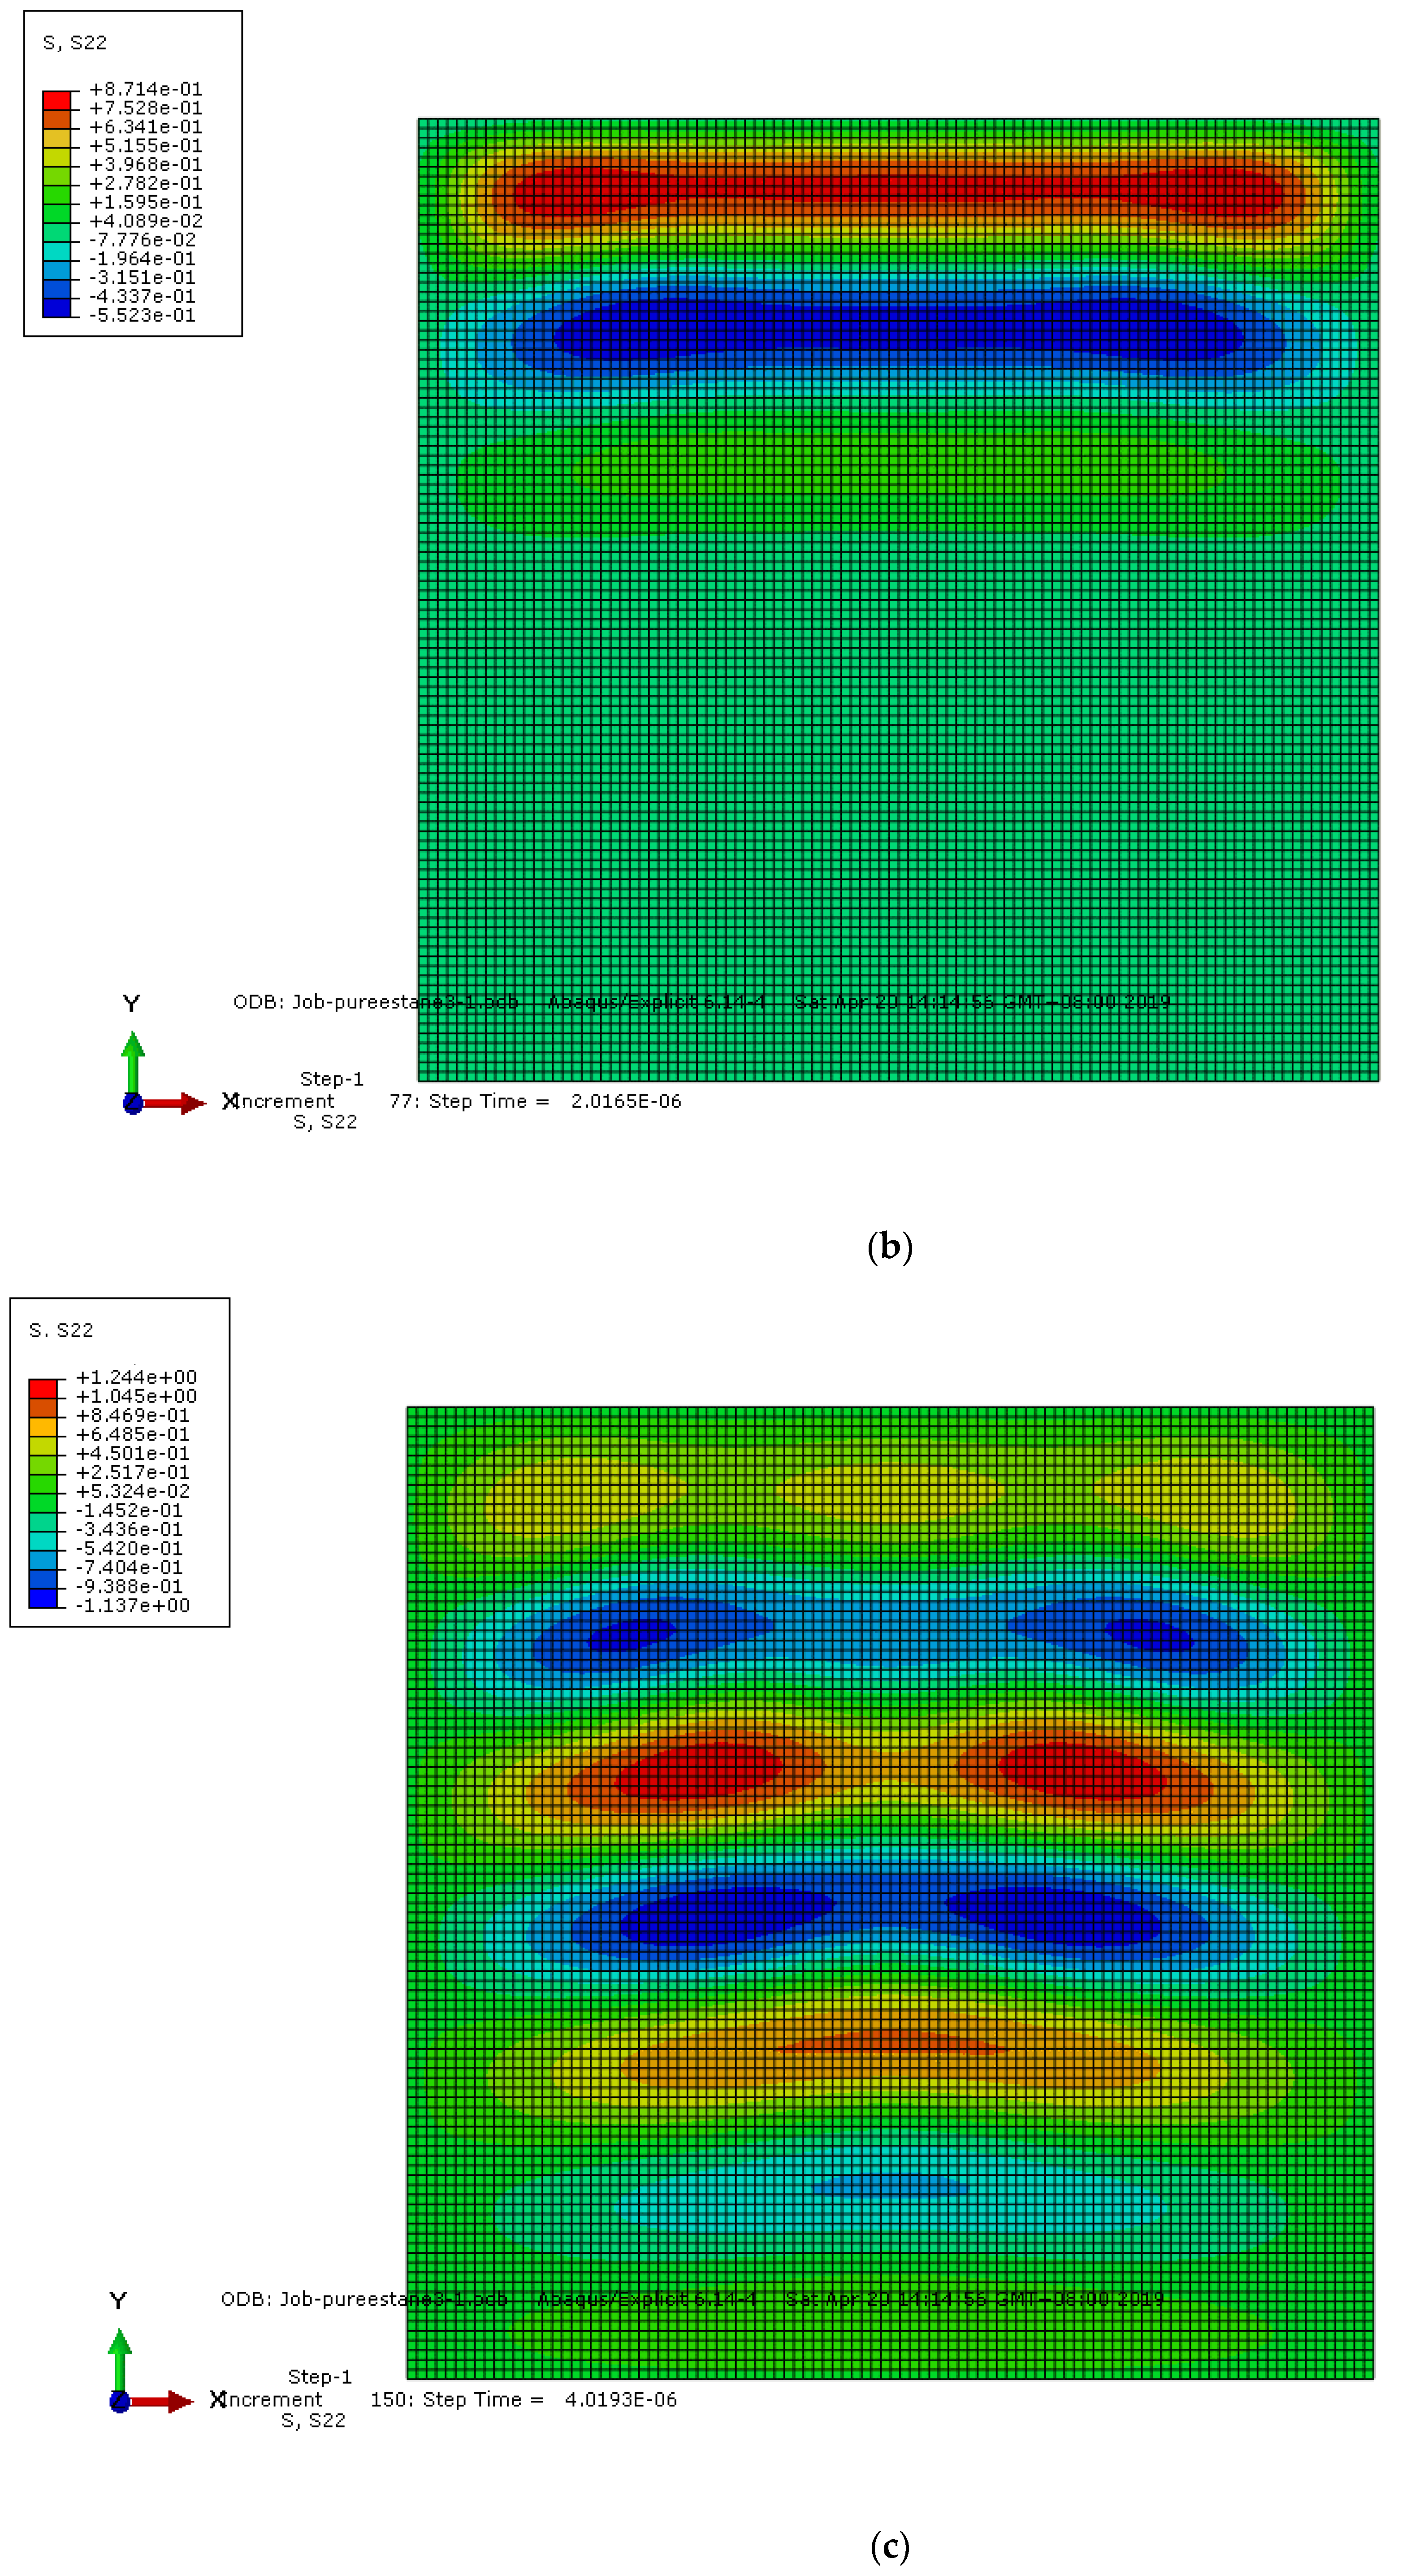
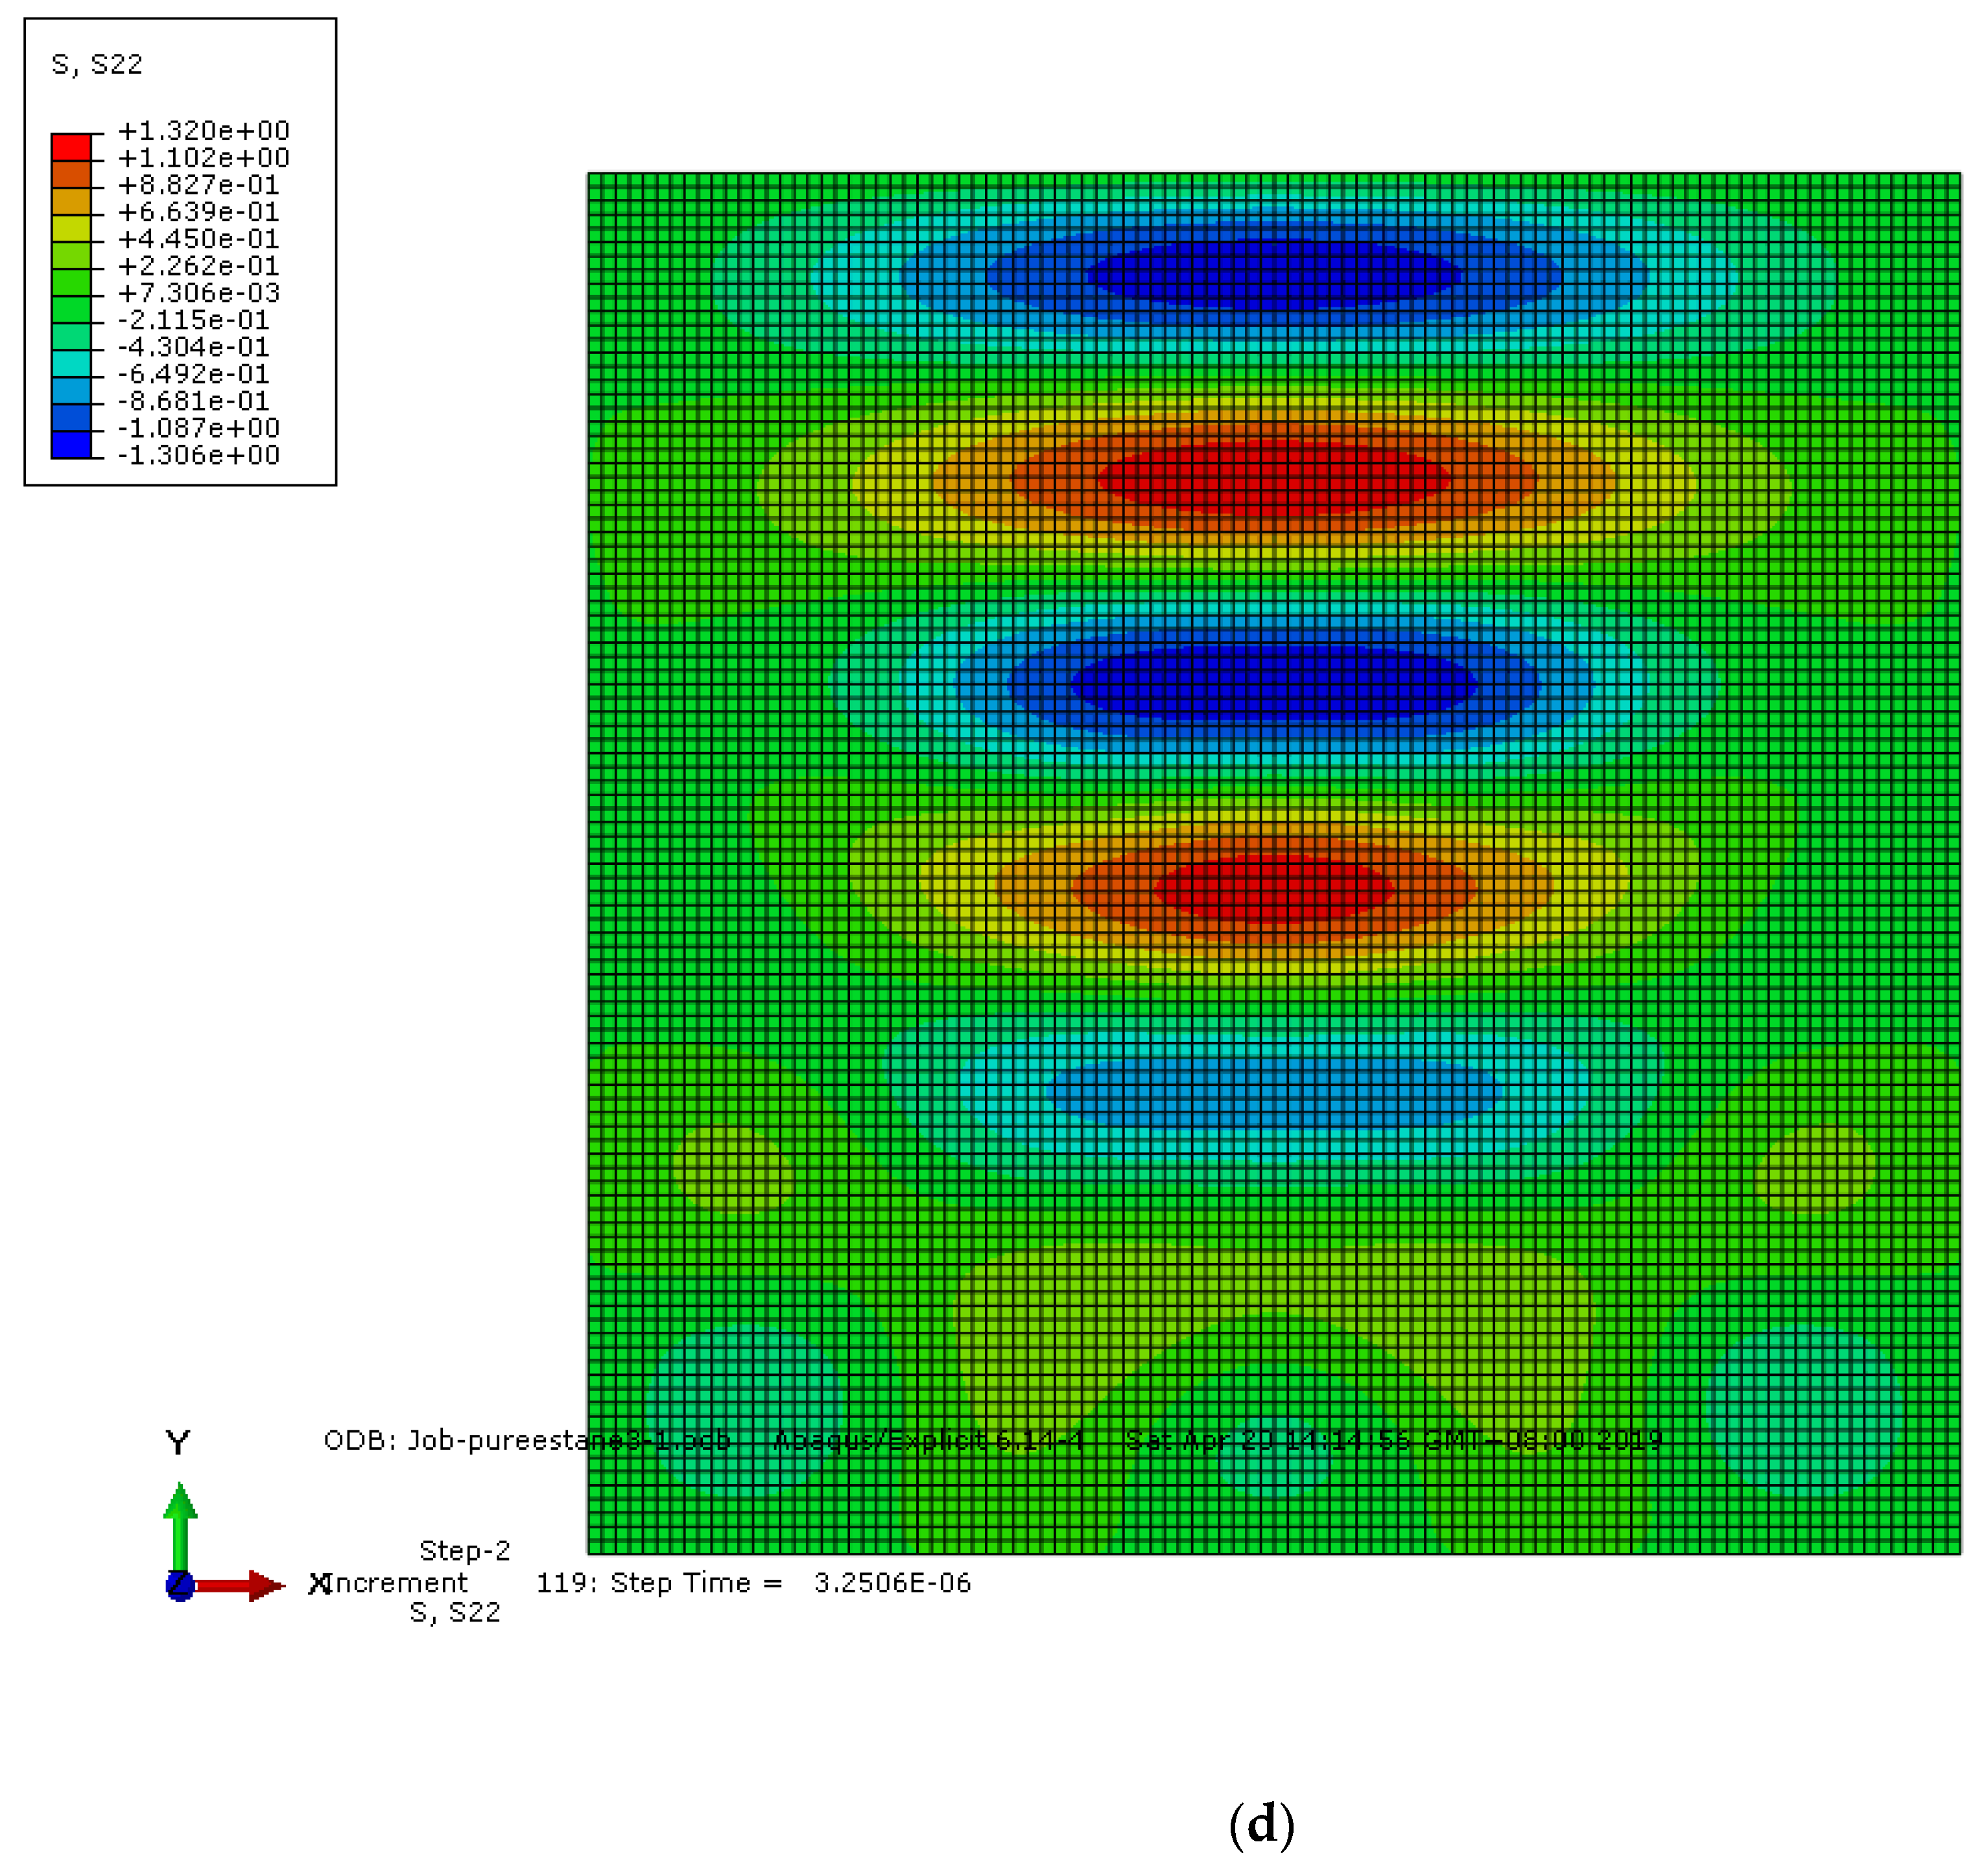
4.3.1. Pure Binder RVE Model
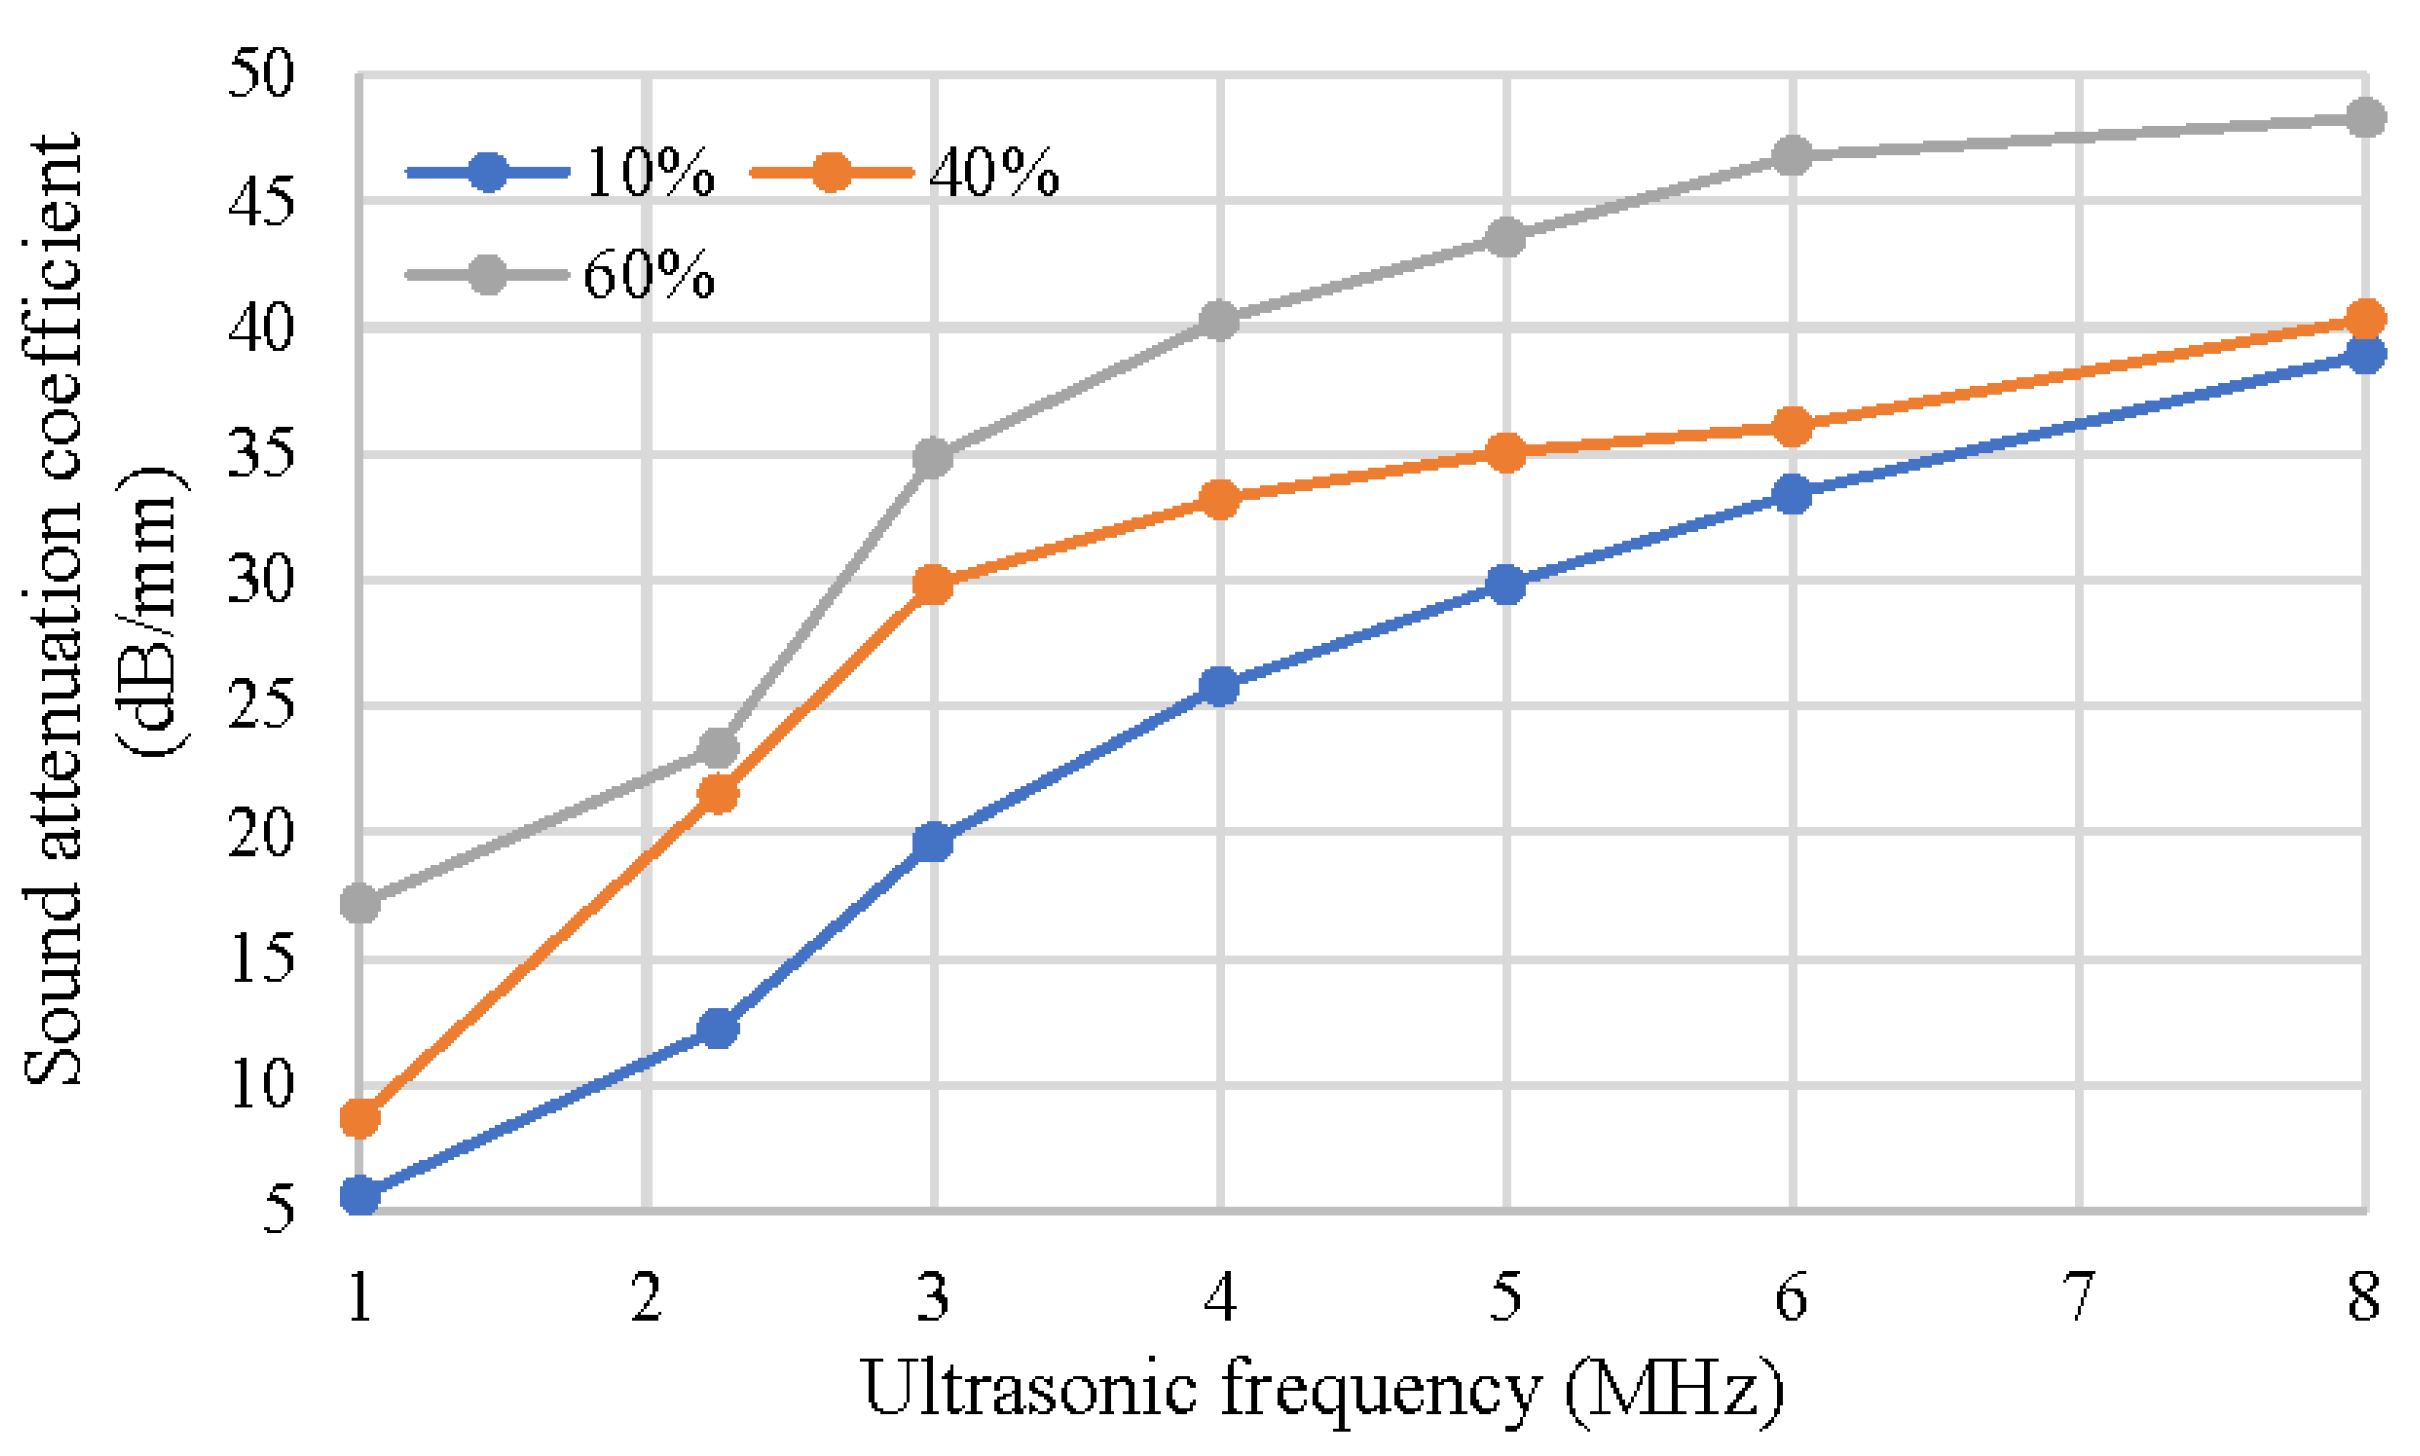
4.3.2. Single-Particle RVE Model of the Different RDX Particle Volume Fractions
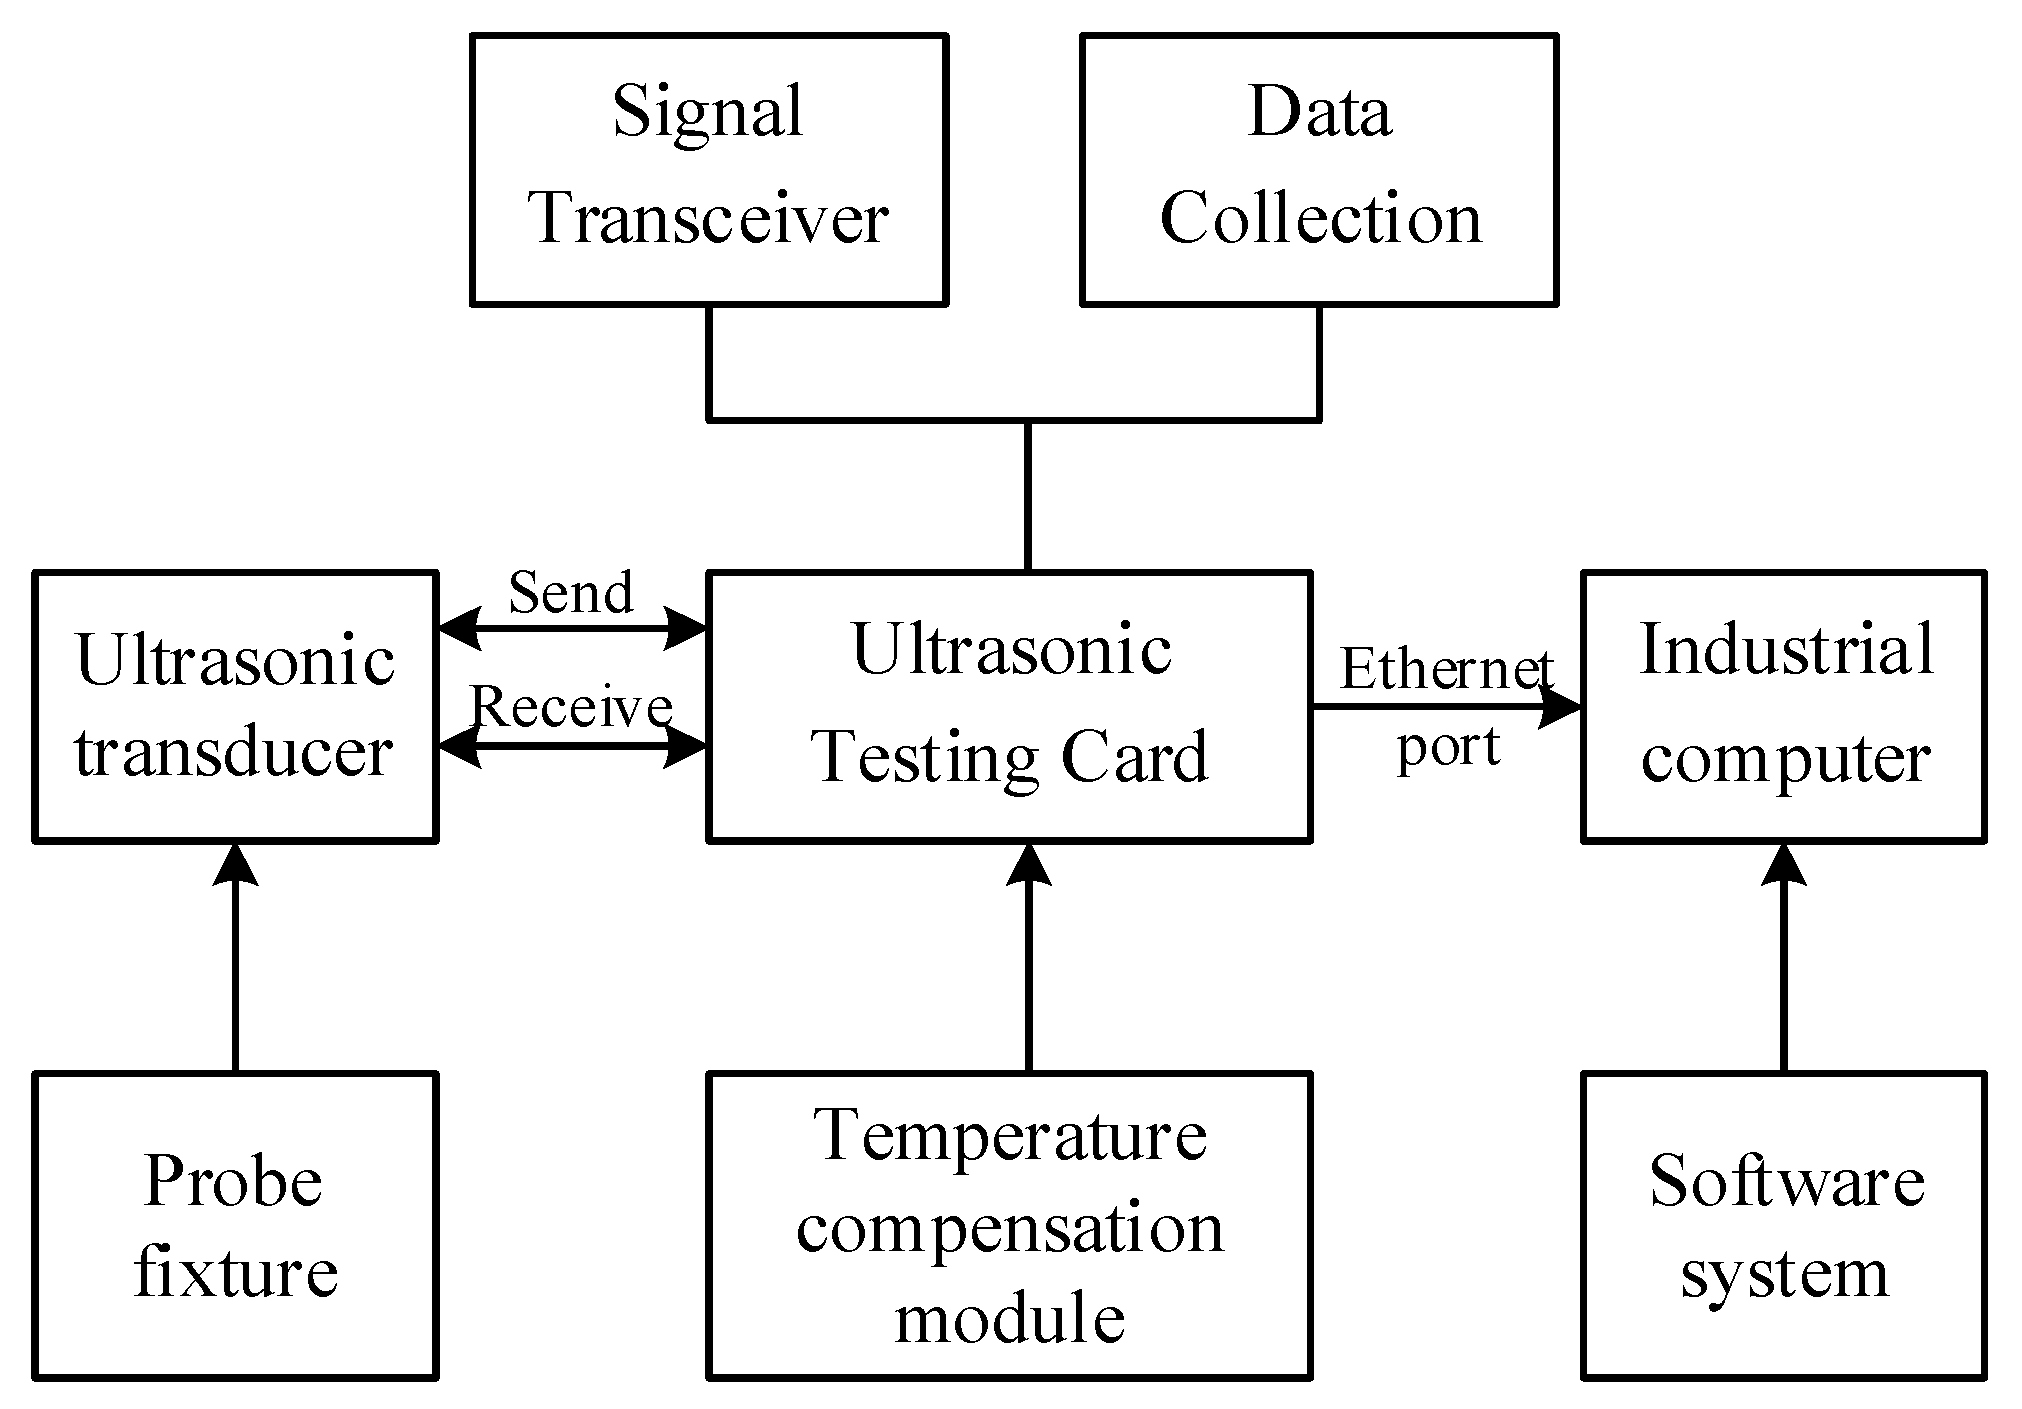
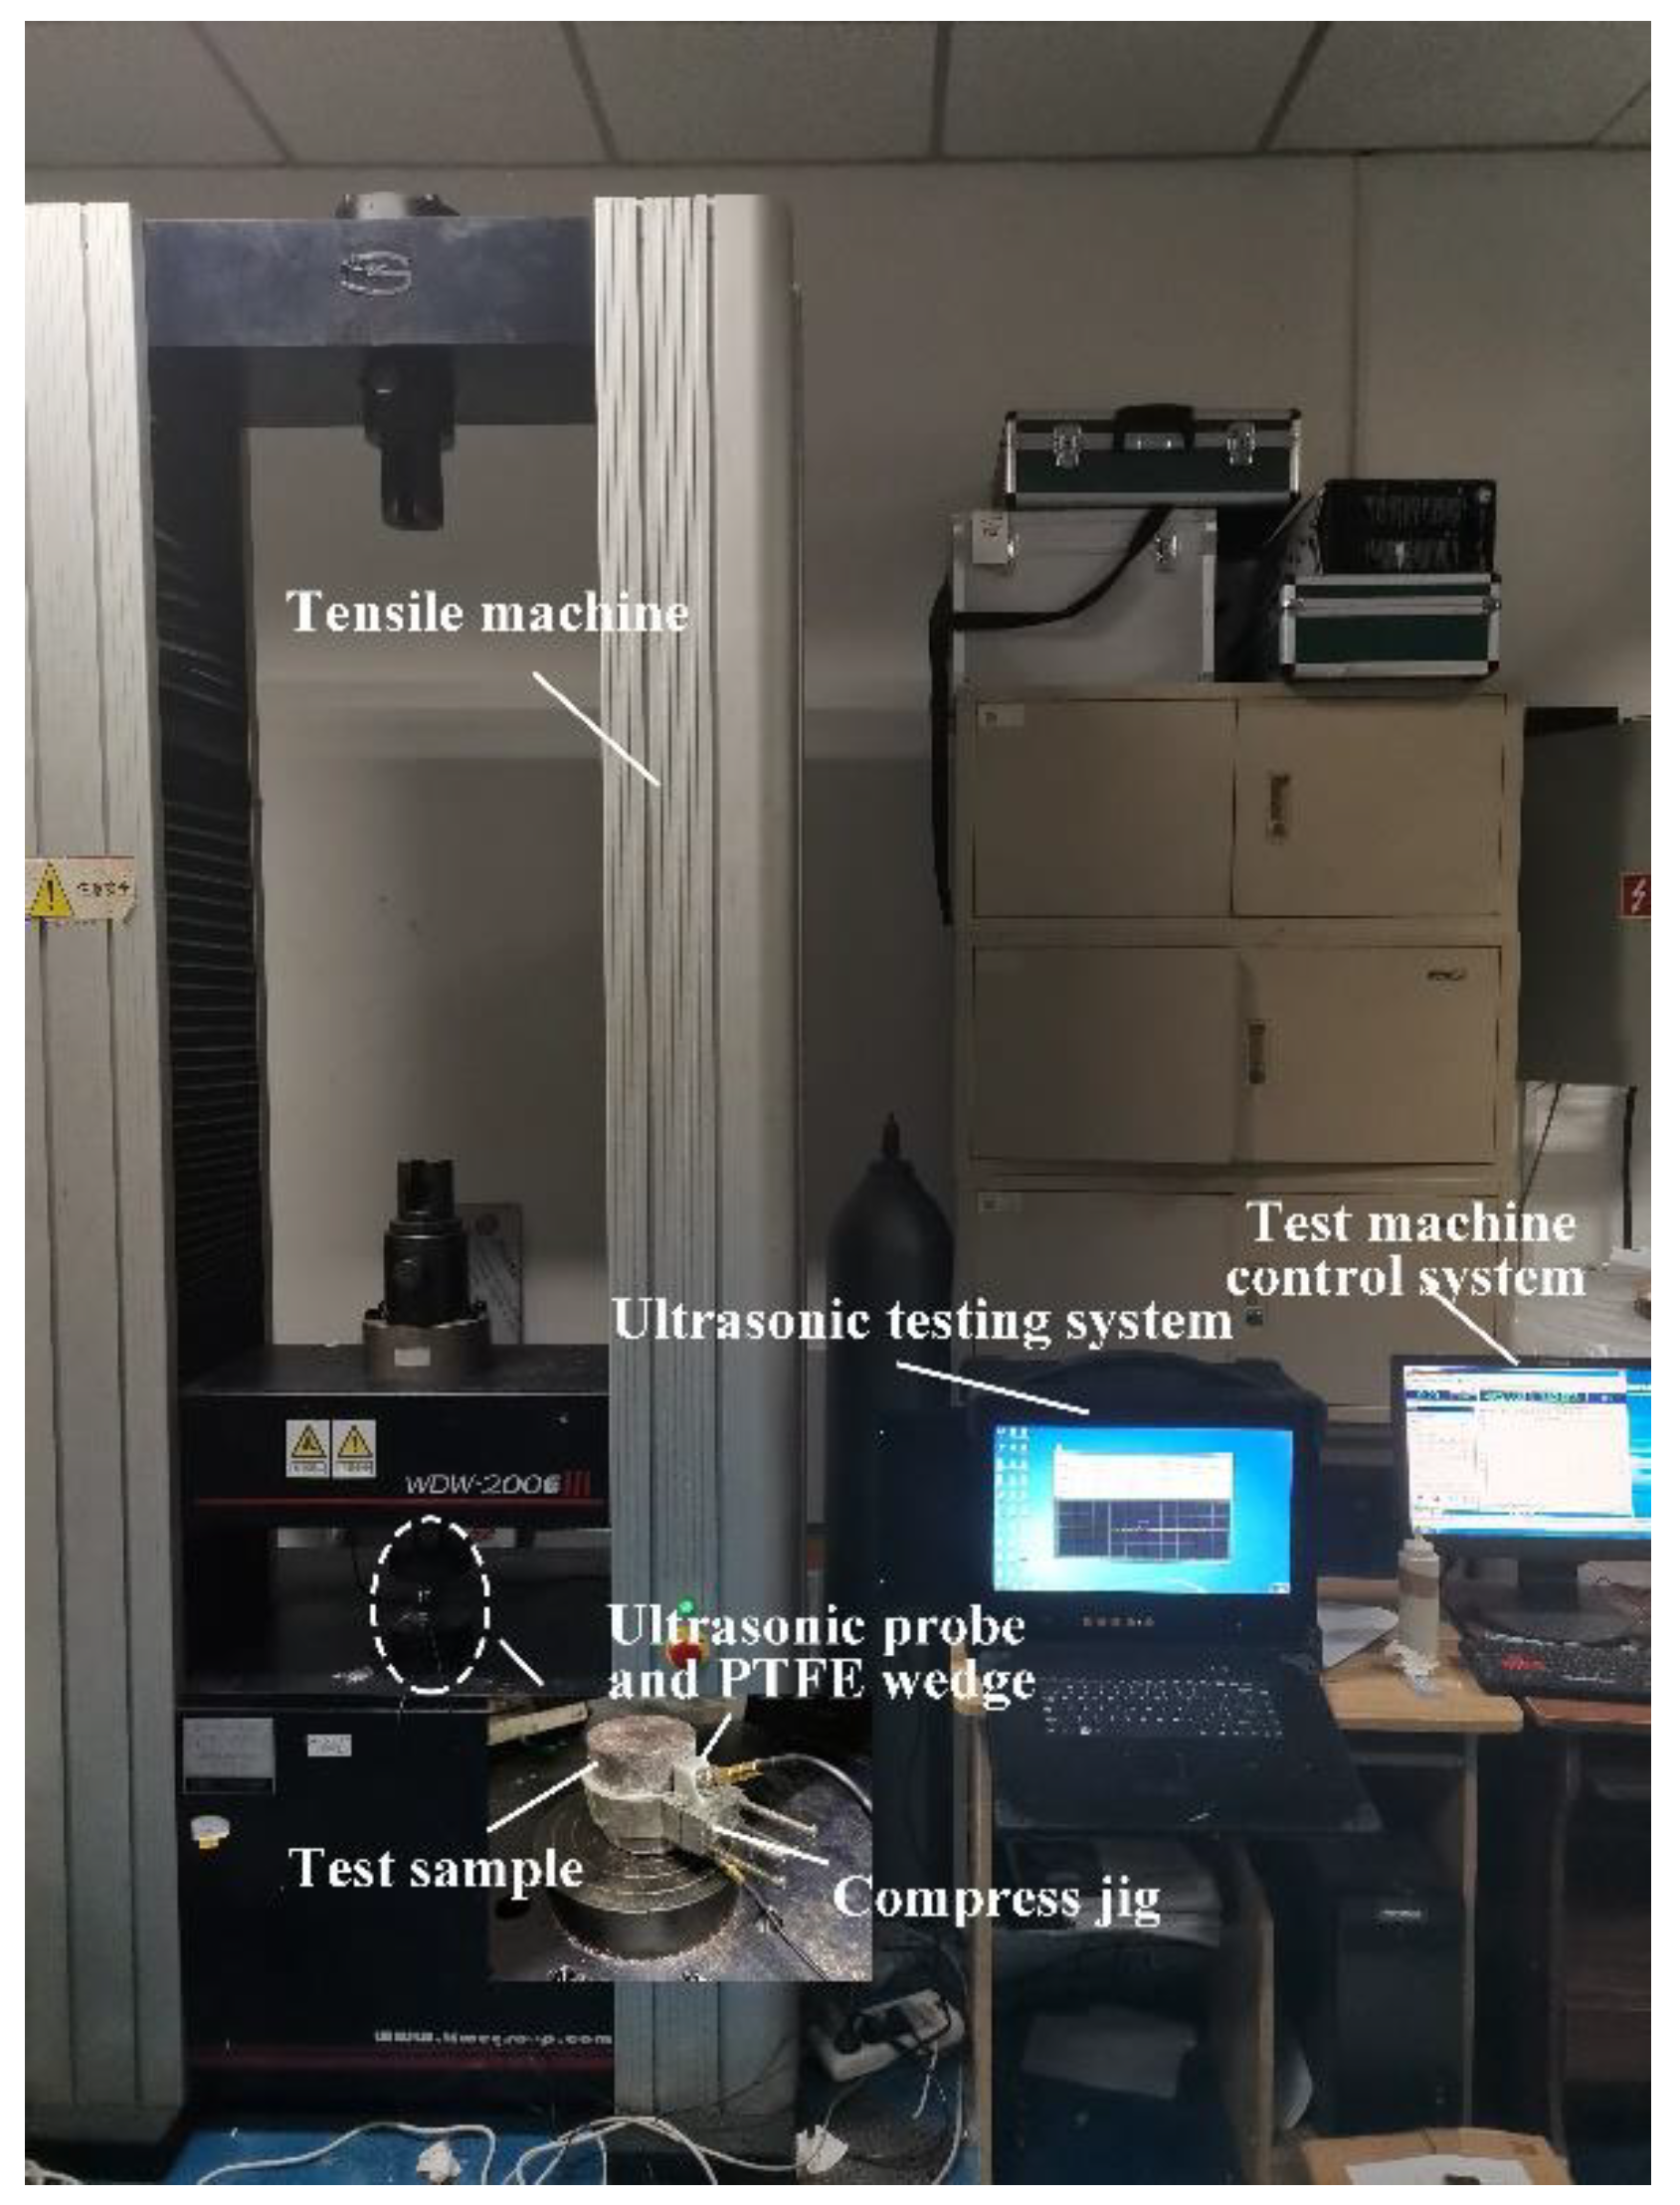
5. System Design
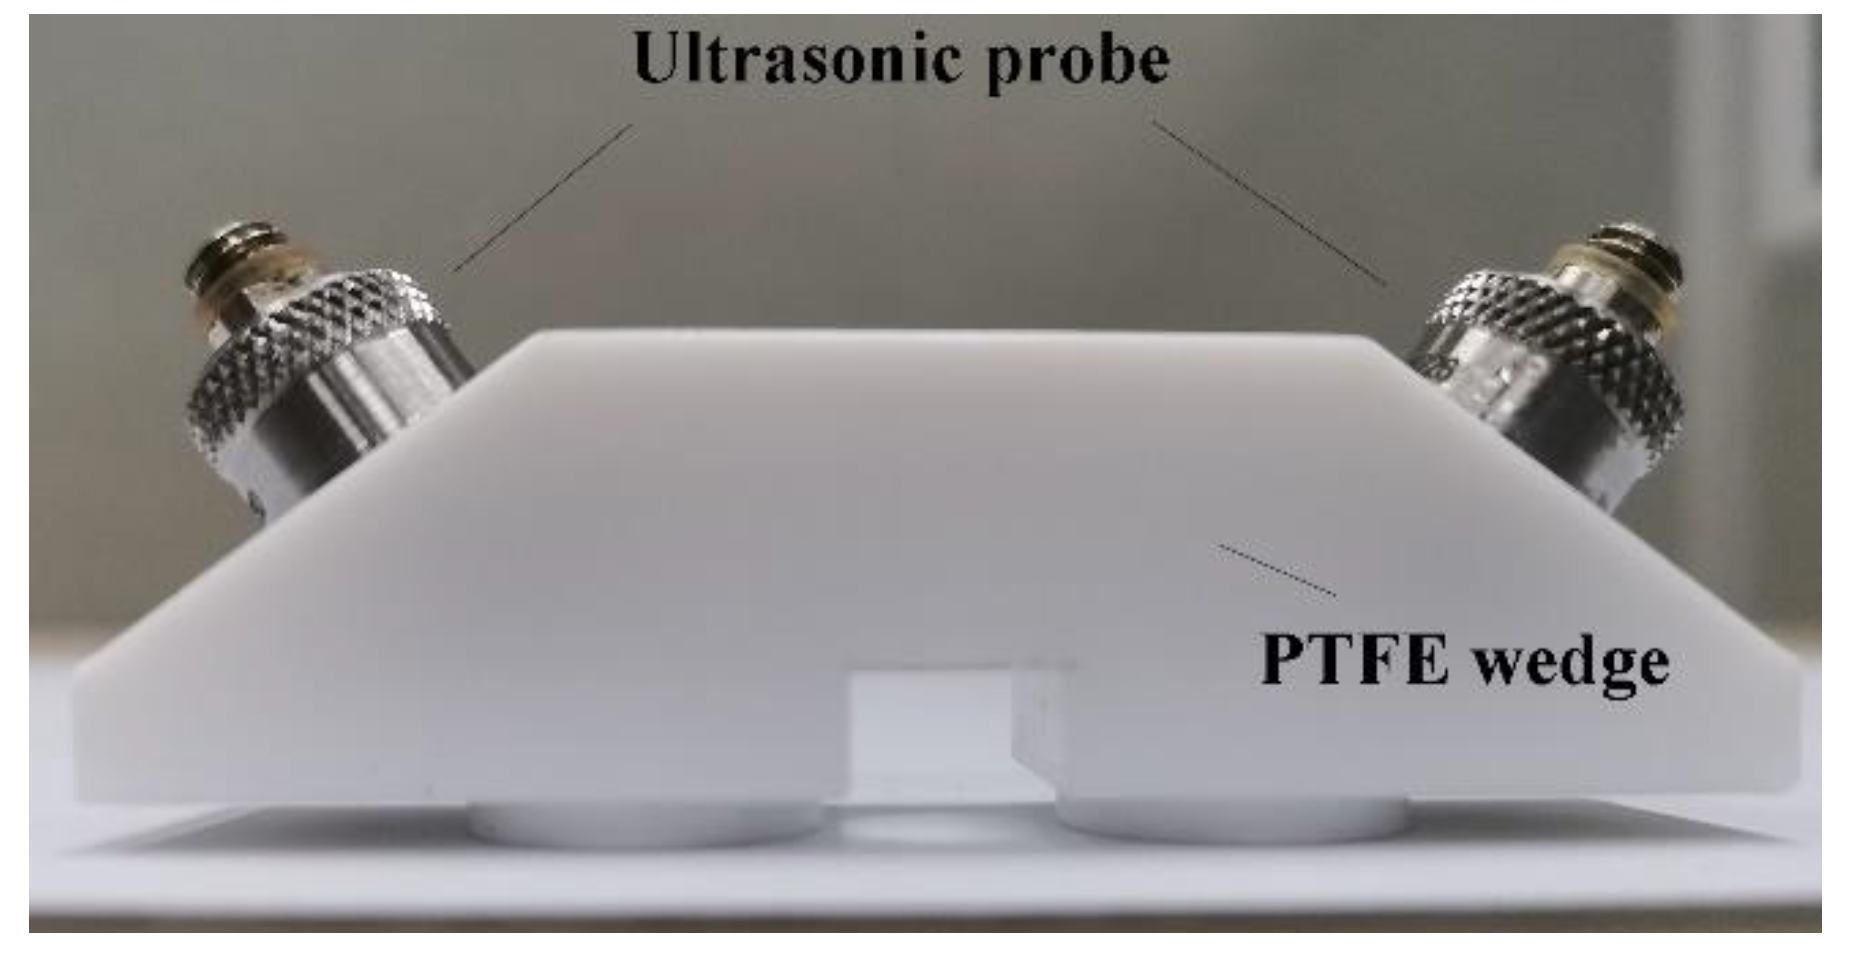
5.1. Transducers
5.1.1. Ultrasound Probe
5.1.2. Wedge
5.2. Signal Transceiver
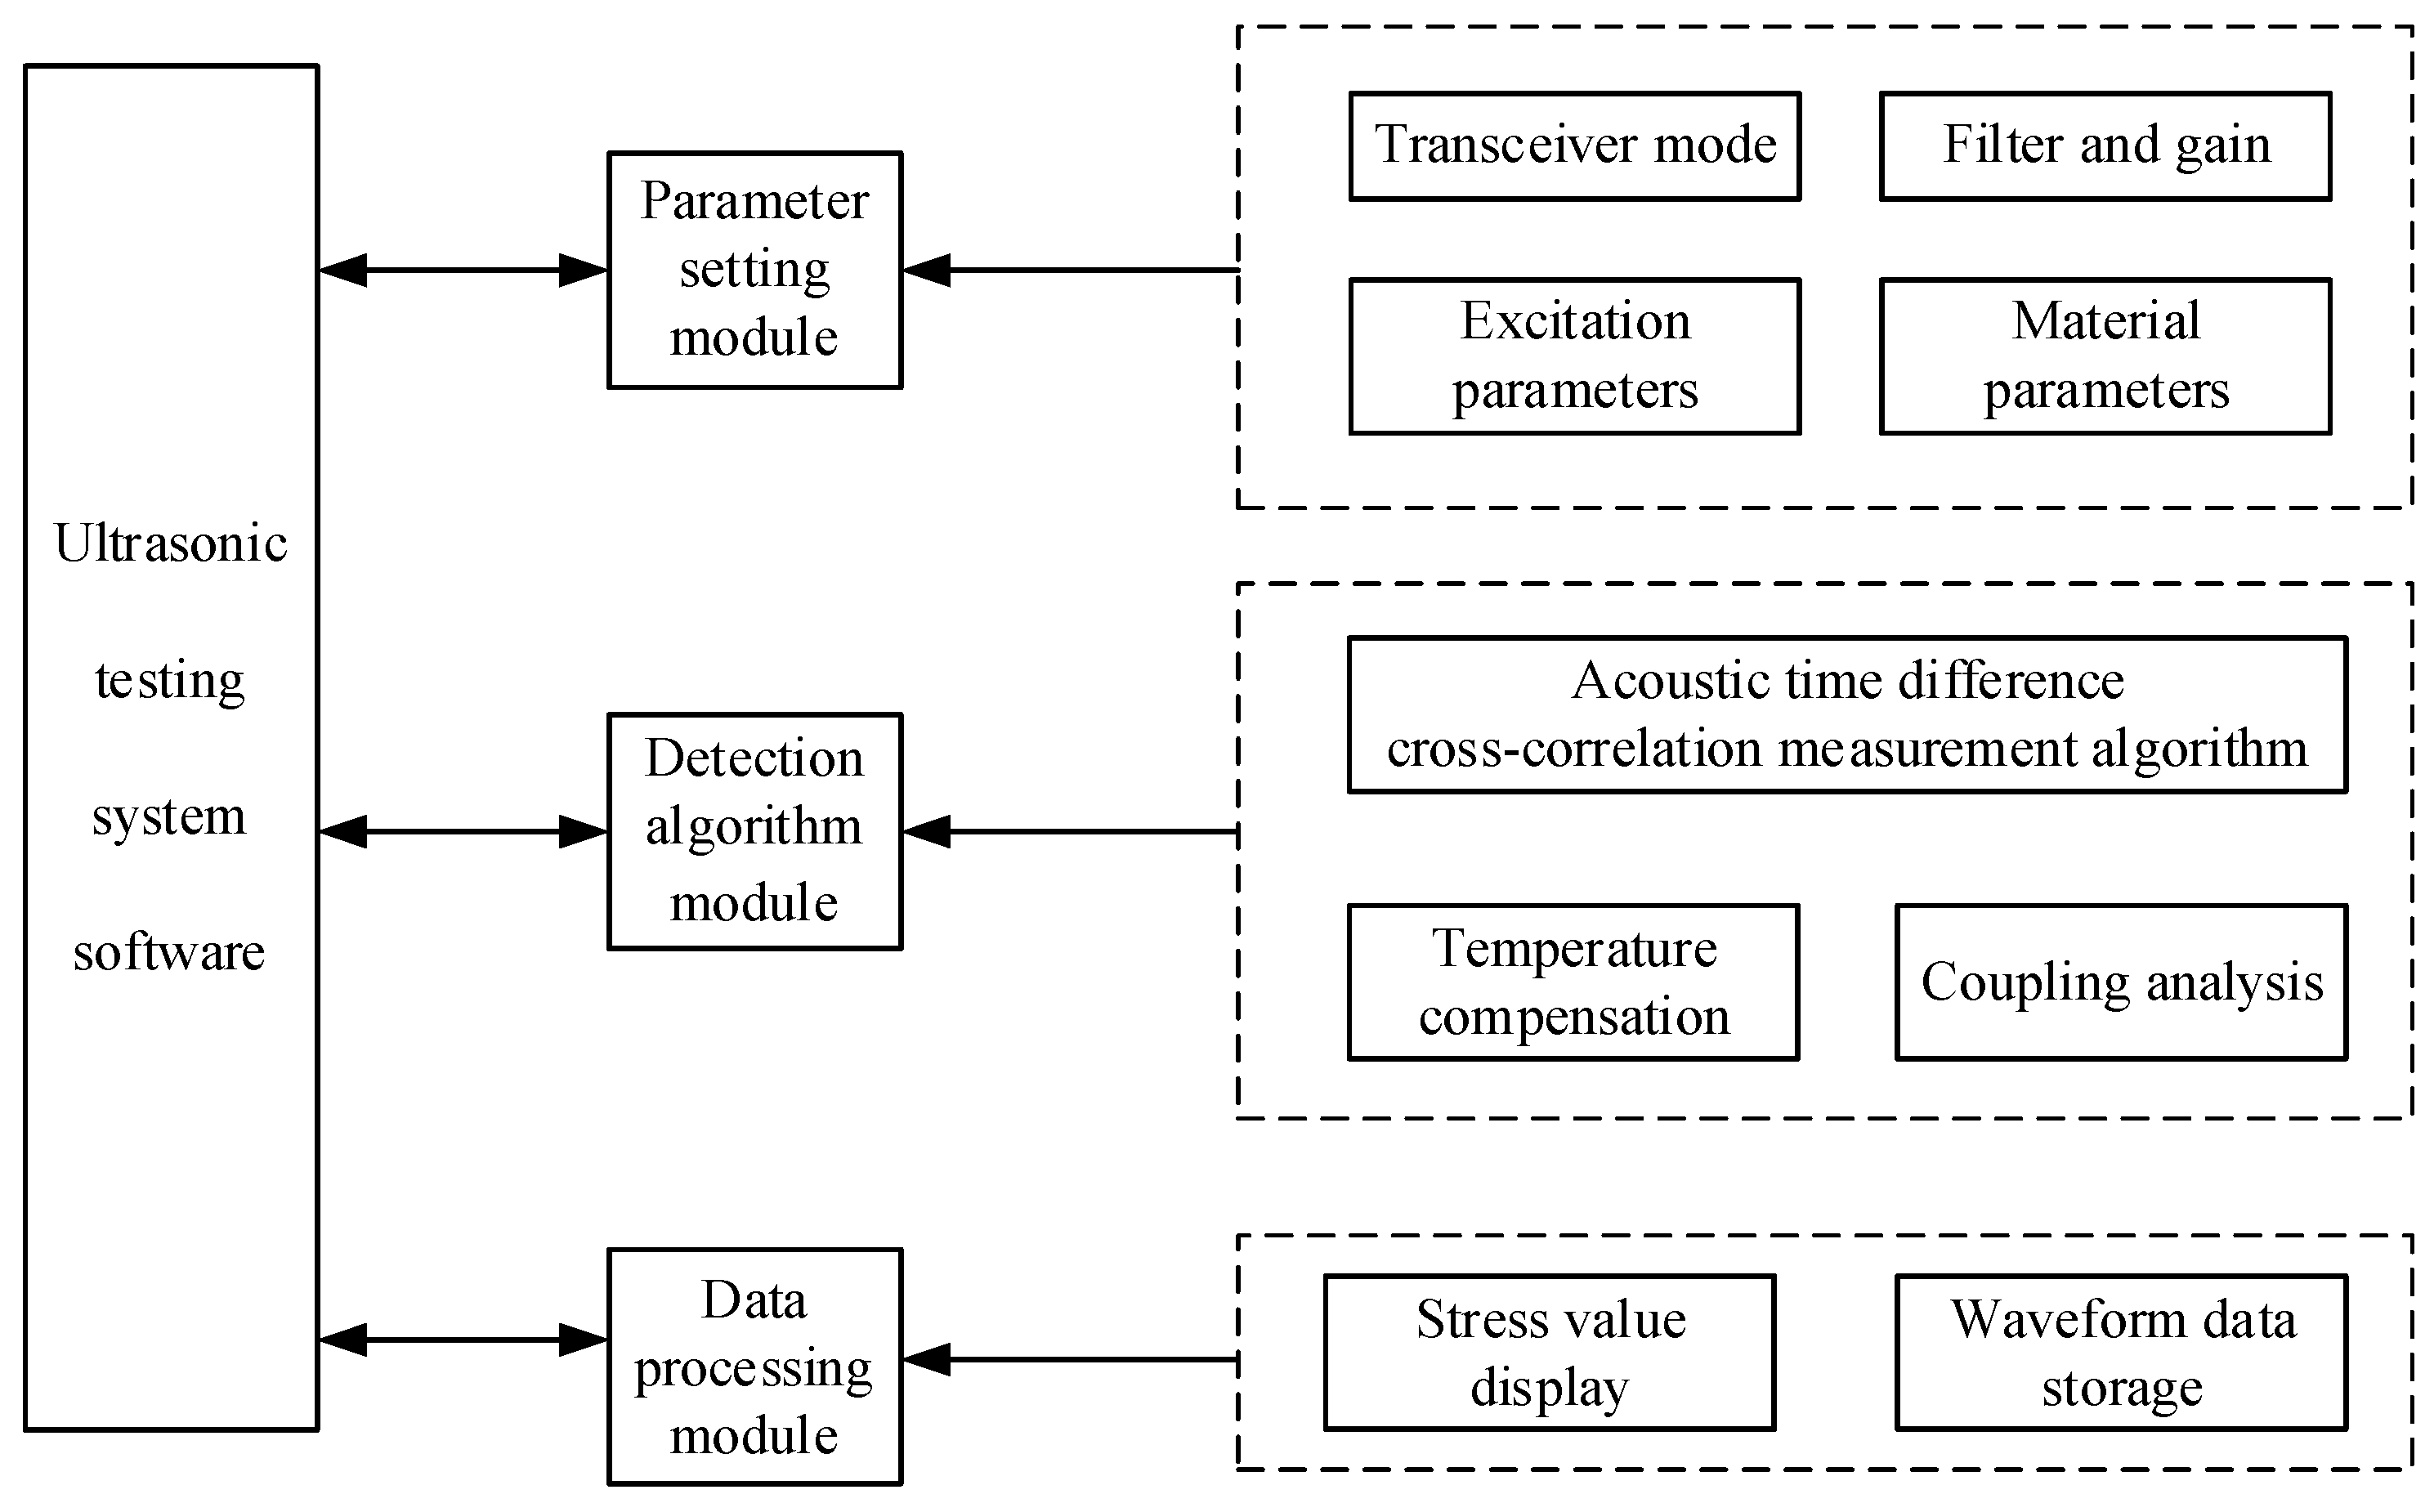
5.3. Inspection System Software Add-on Module
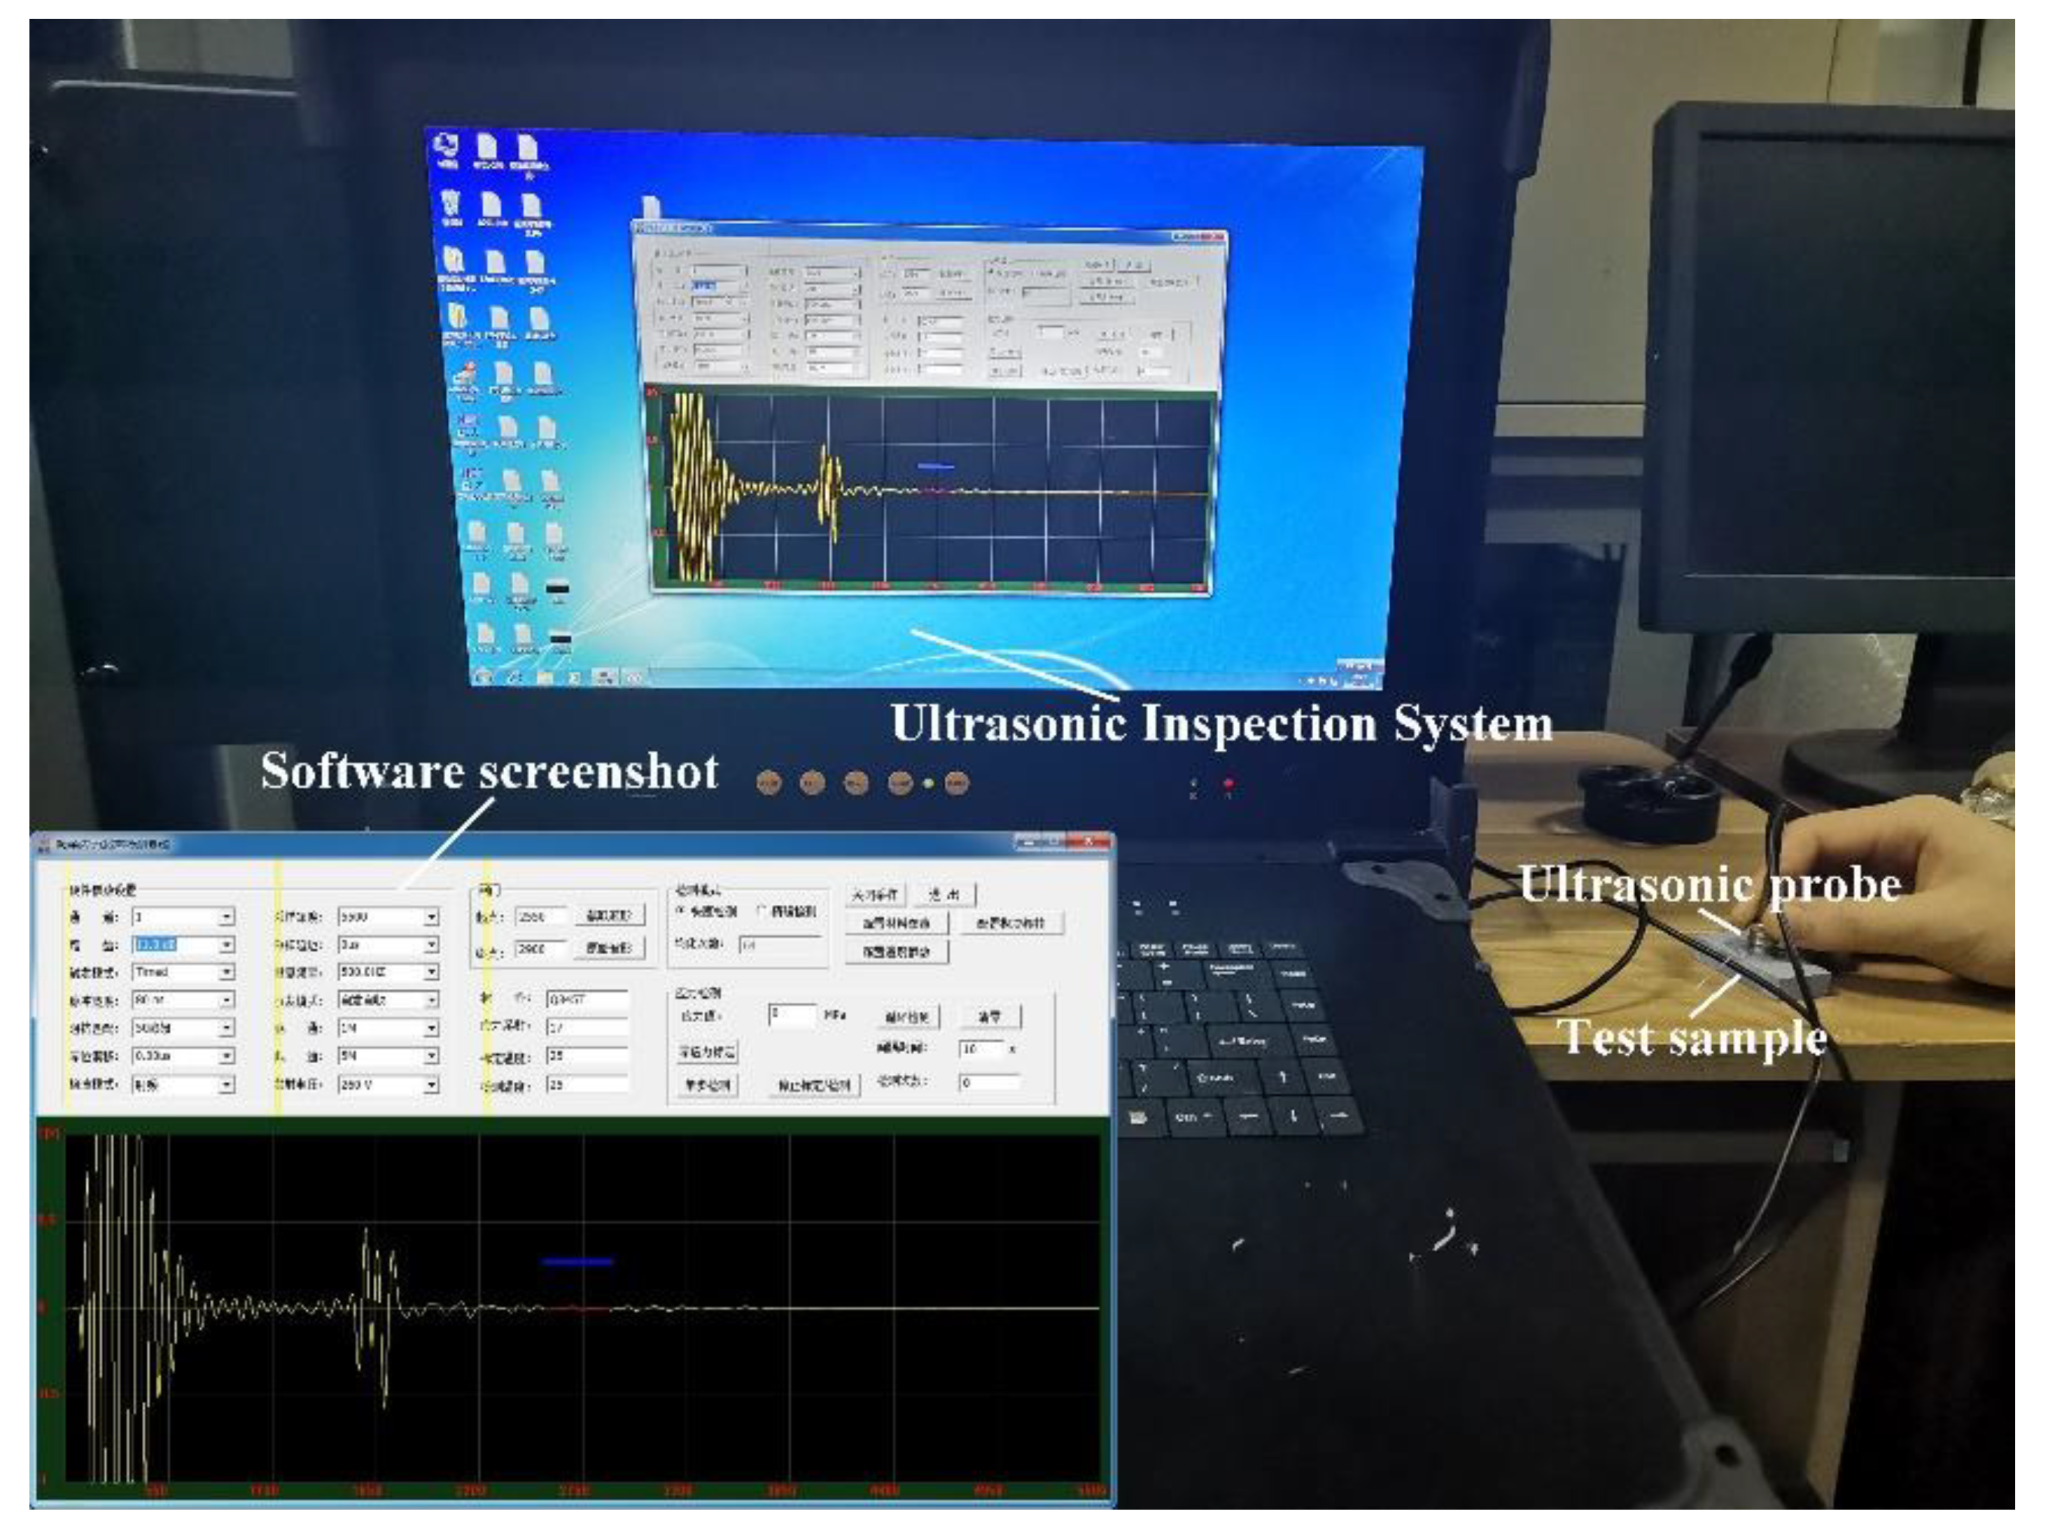
6. Experimental Verification
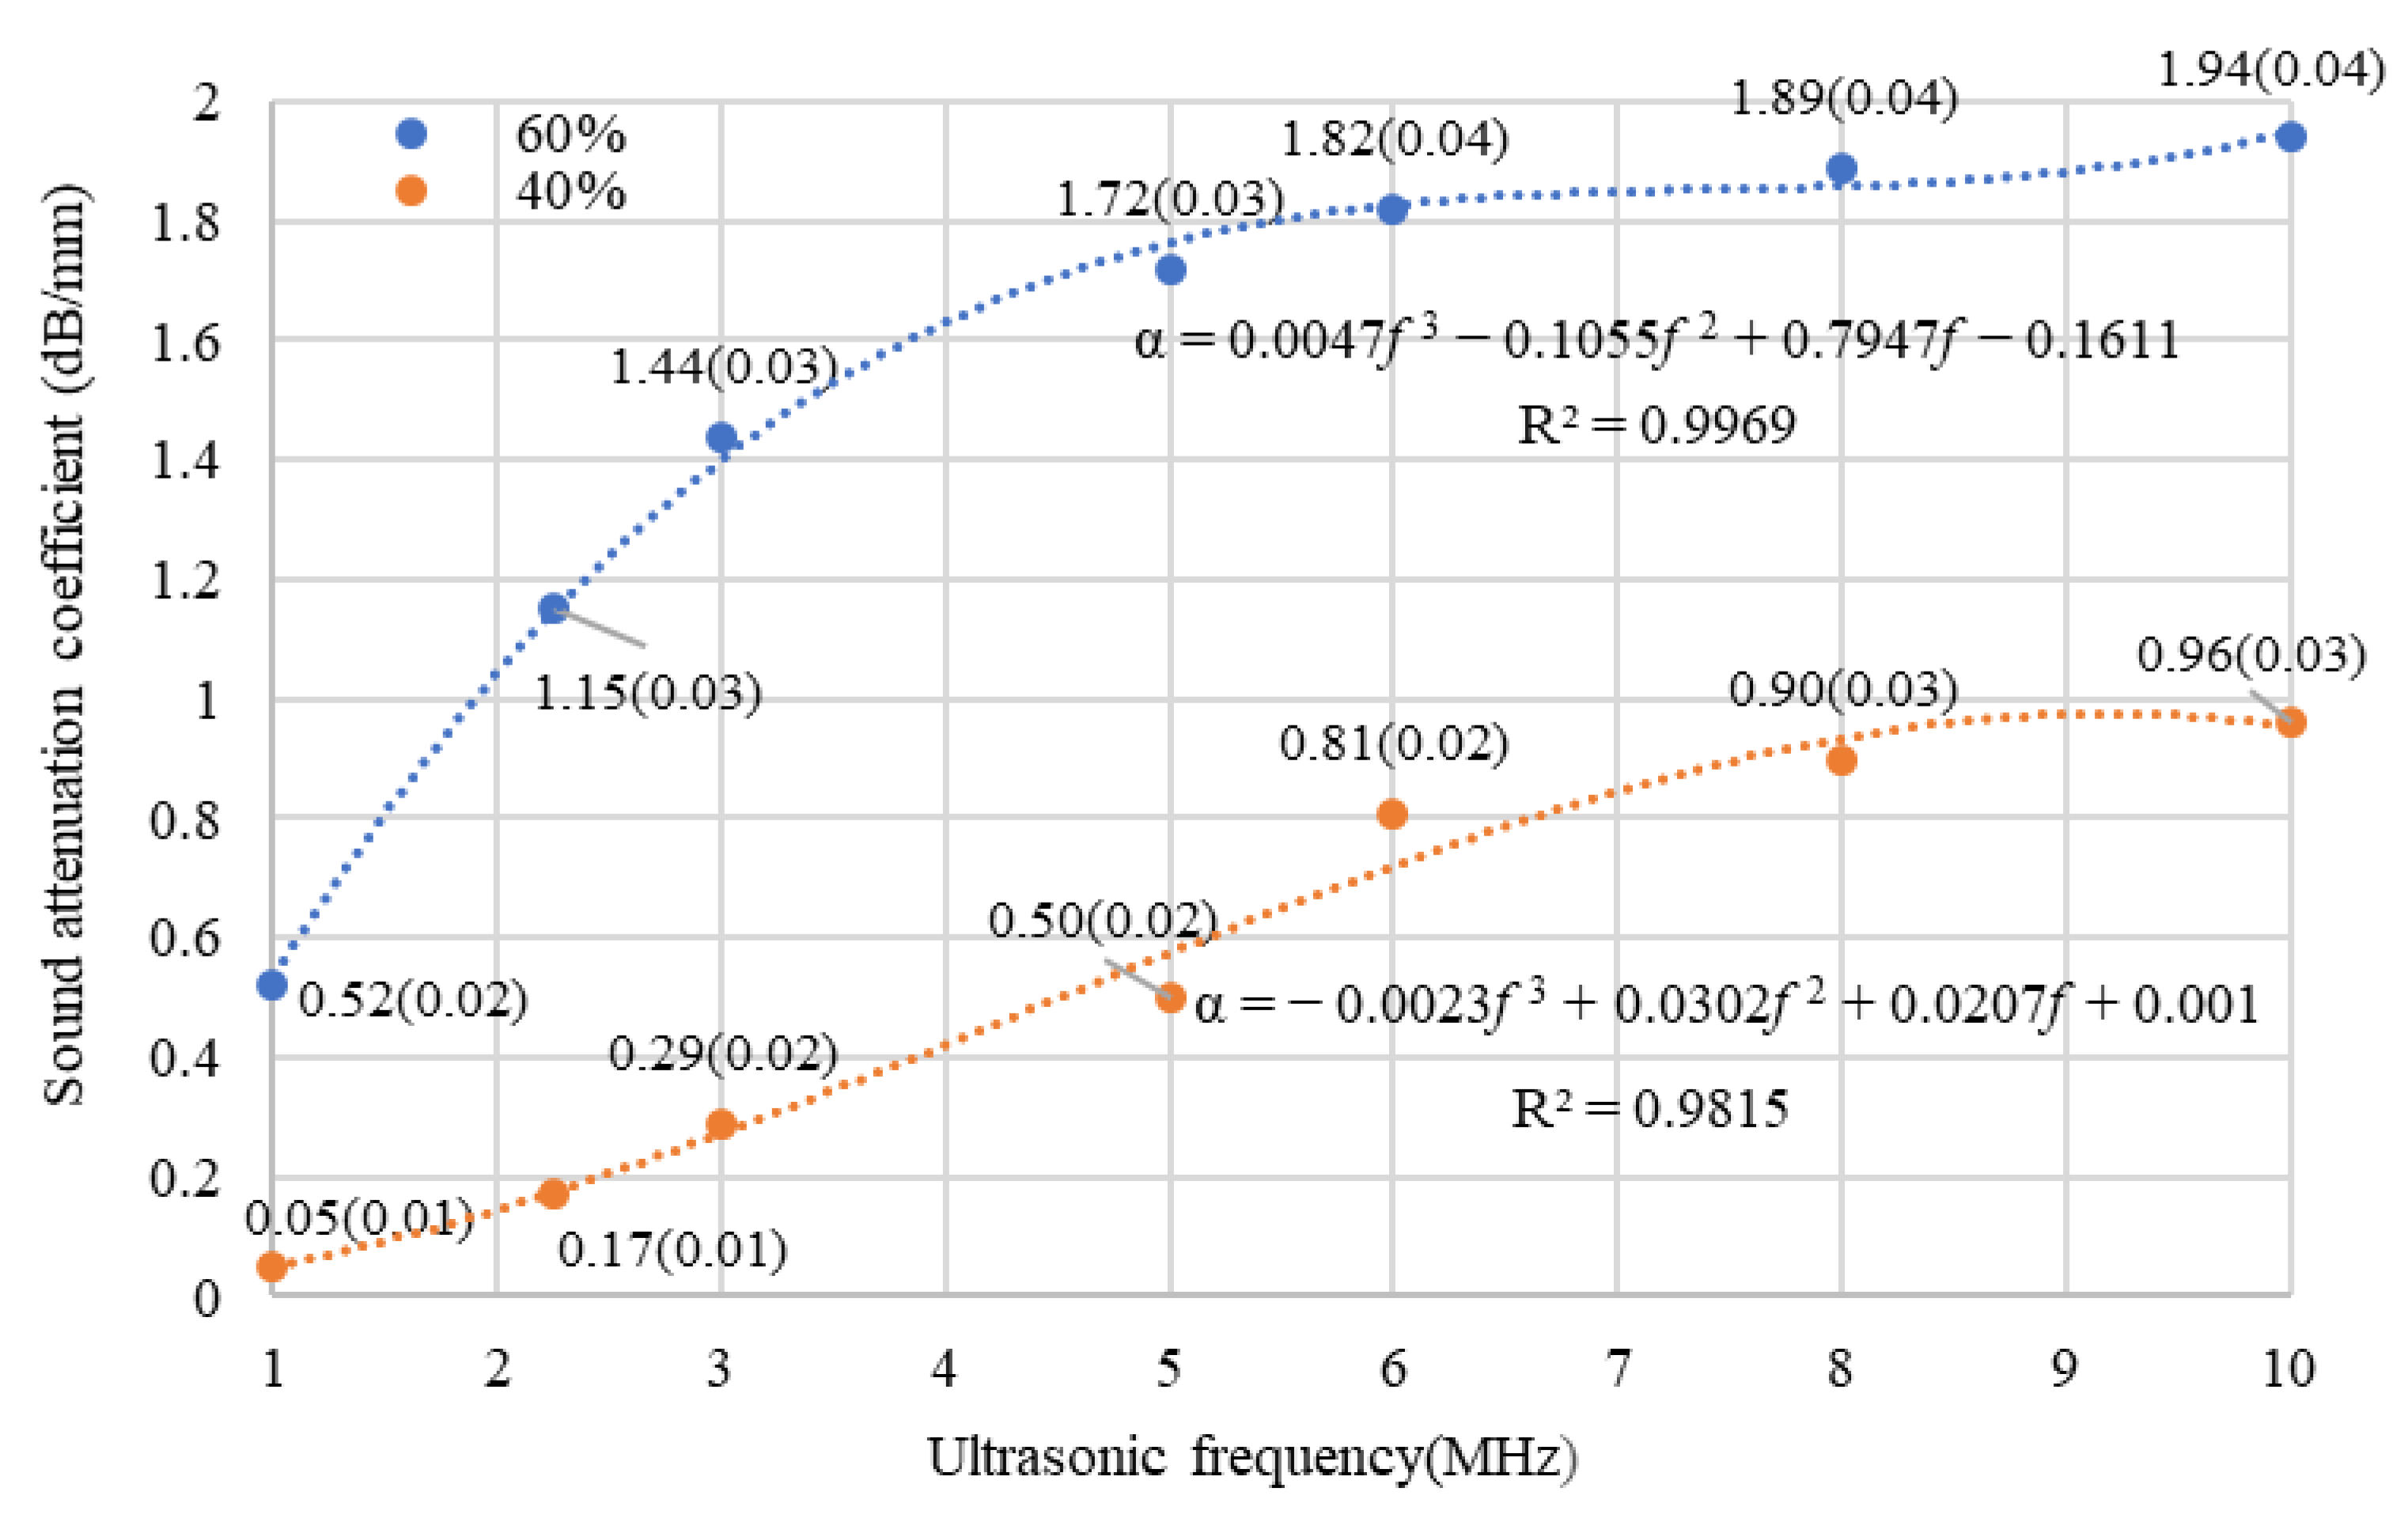
6.1. Attenuation Coefficient of the RDX/Estane RVE Model
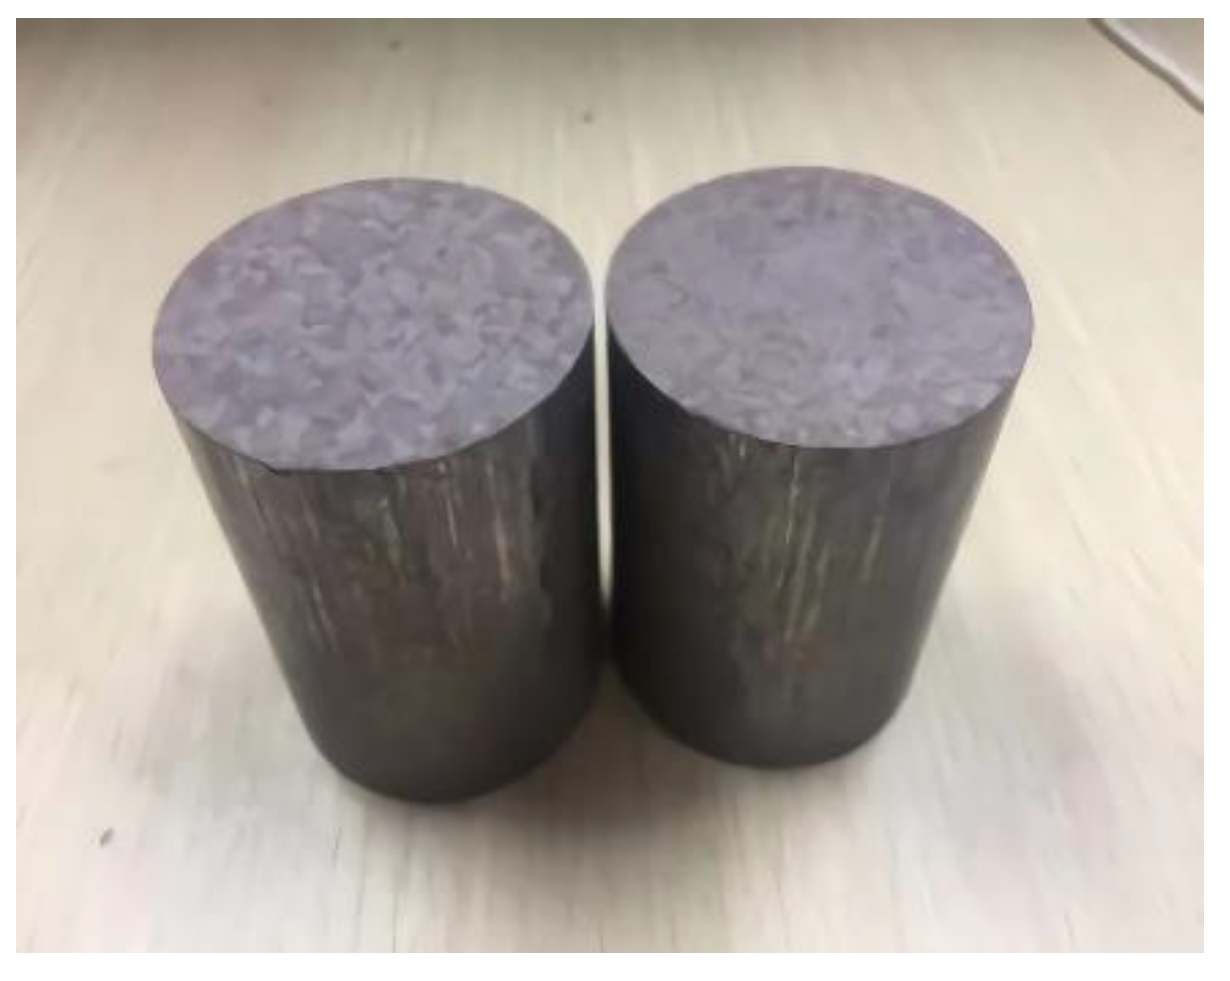
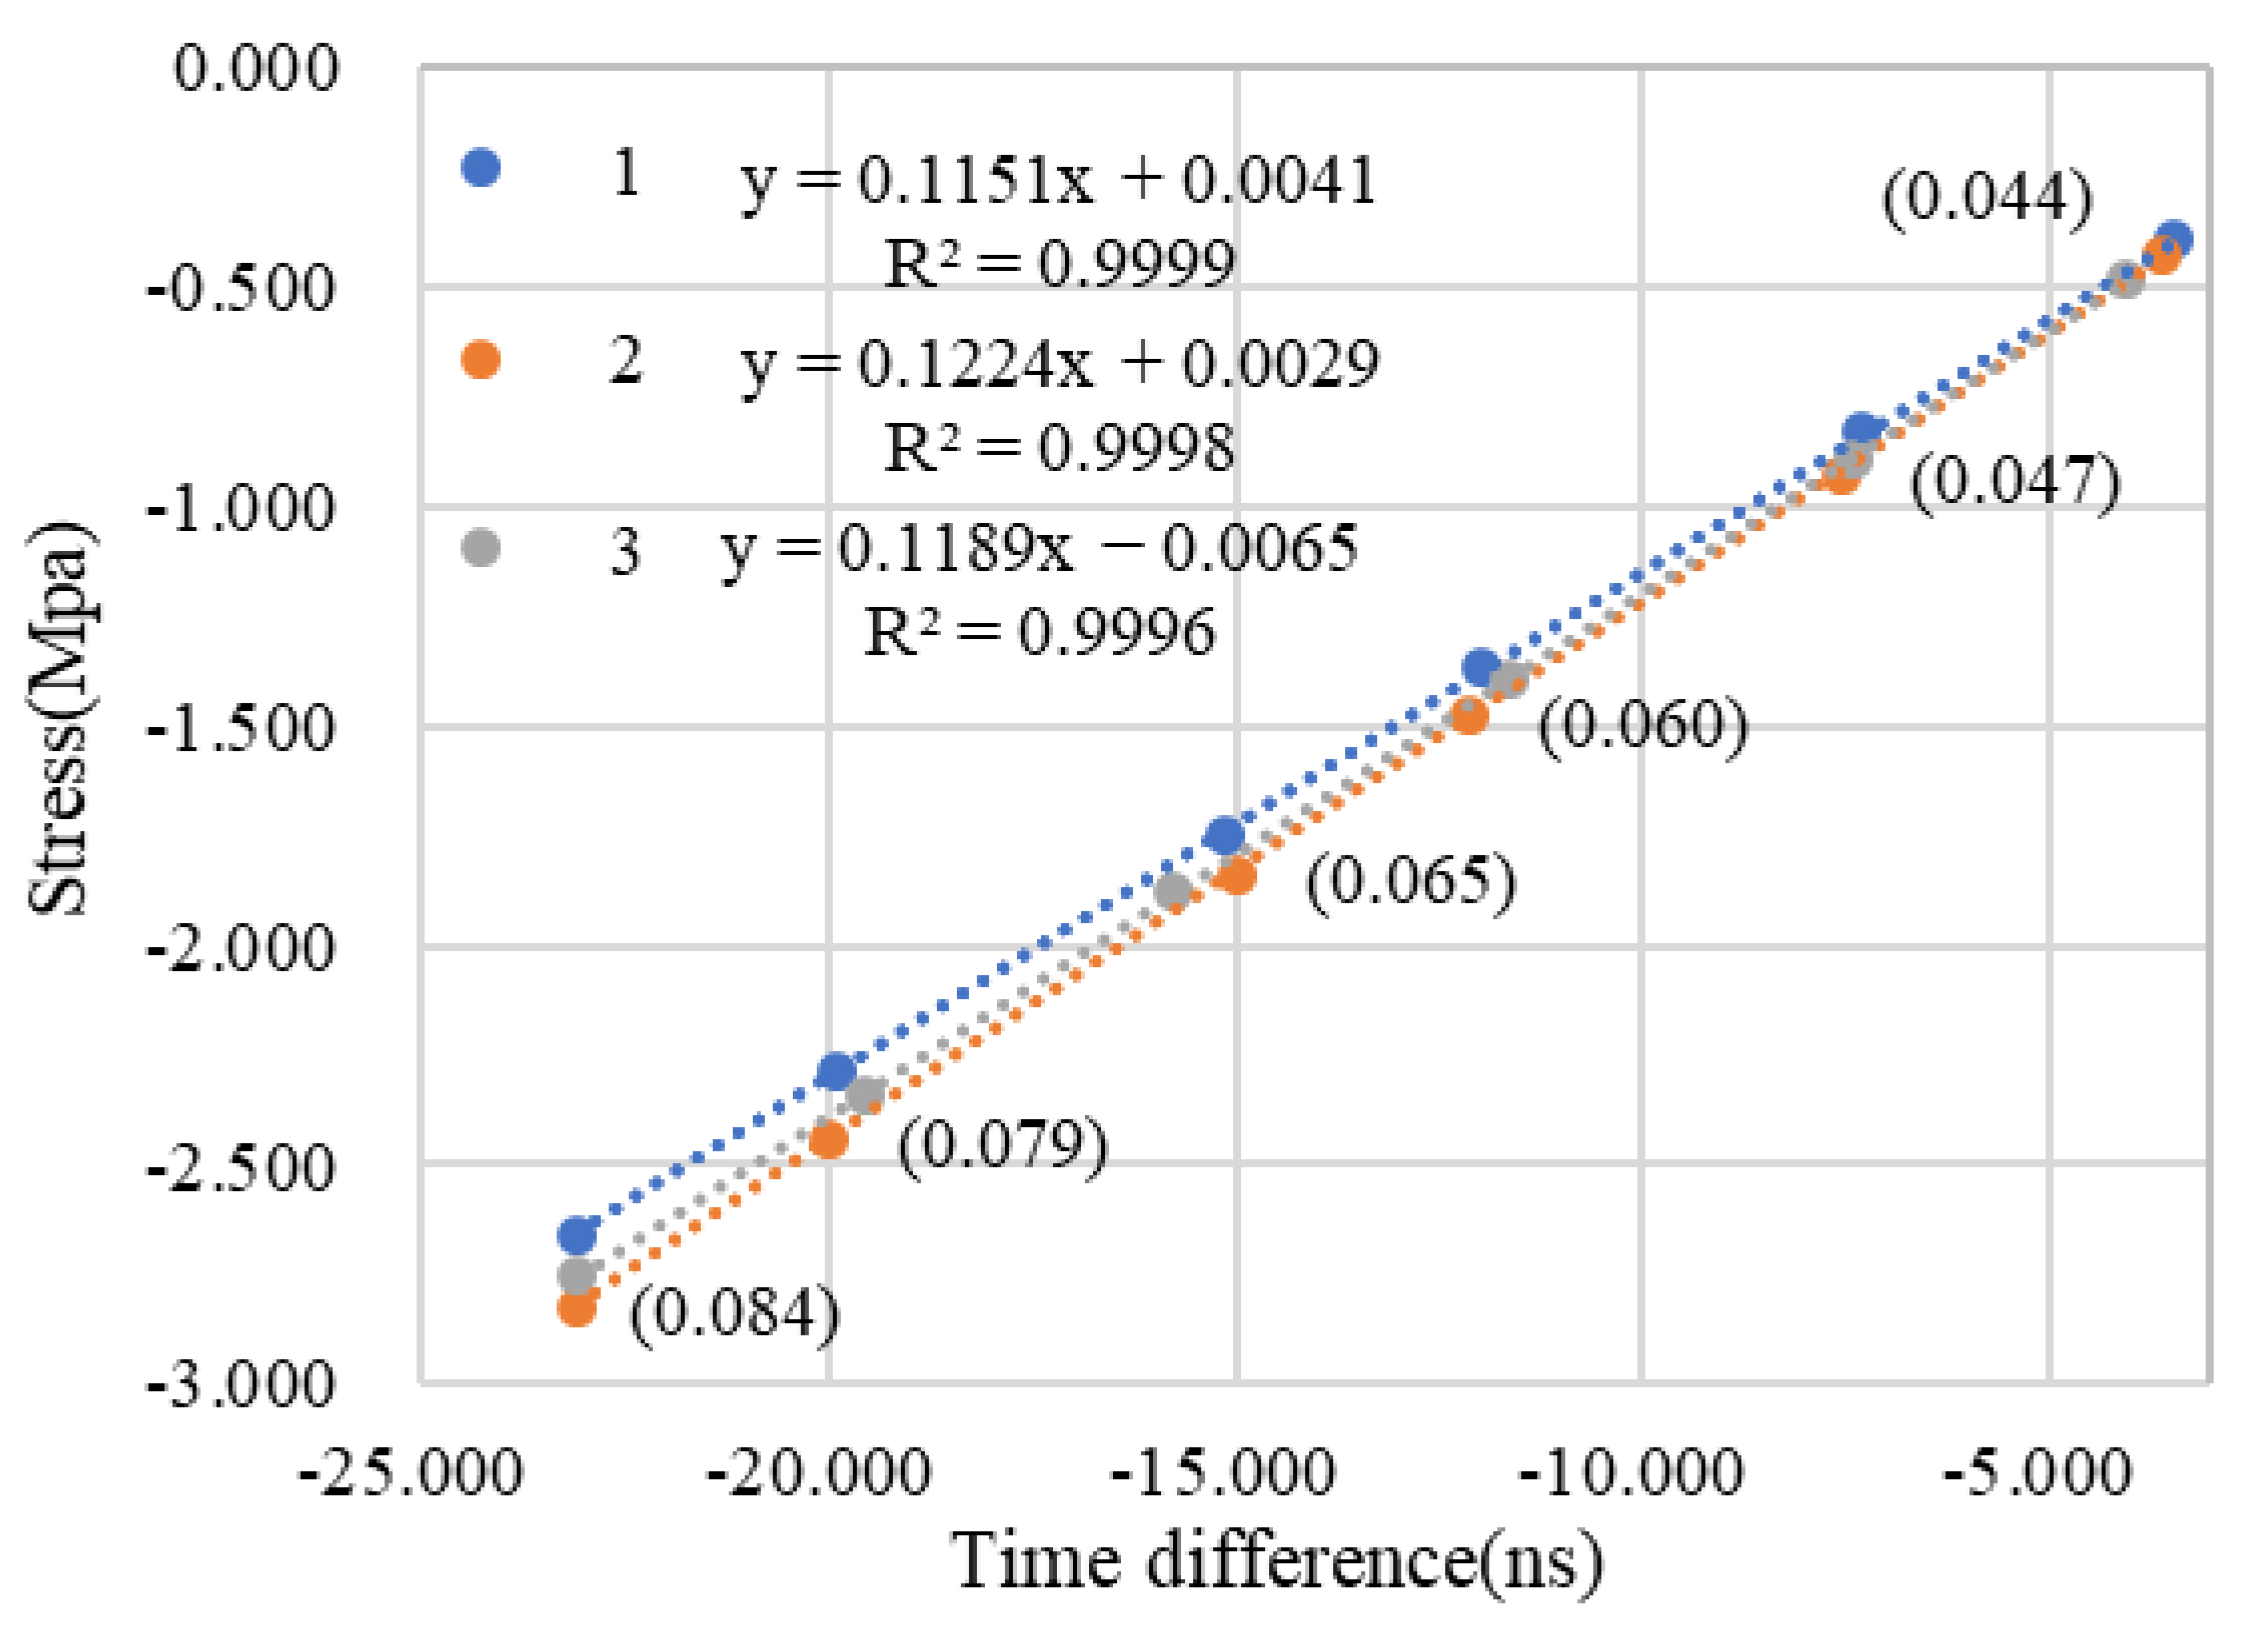
6.2. PBX Sample Internal Stress Detection
7. Conclusions
- (1)
- The effective elastic modulus calculation of the PBX materials can be predicted by parameters such as the explosive particle volume fraction, shape and gradation, and porosity. The RVE model established by Digimat/FE, combined with the load and constraint settings of ABAQUS, can simulate the mechanism of ultrasonic propagation and attenuation inside the material.
- (2)
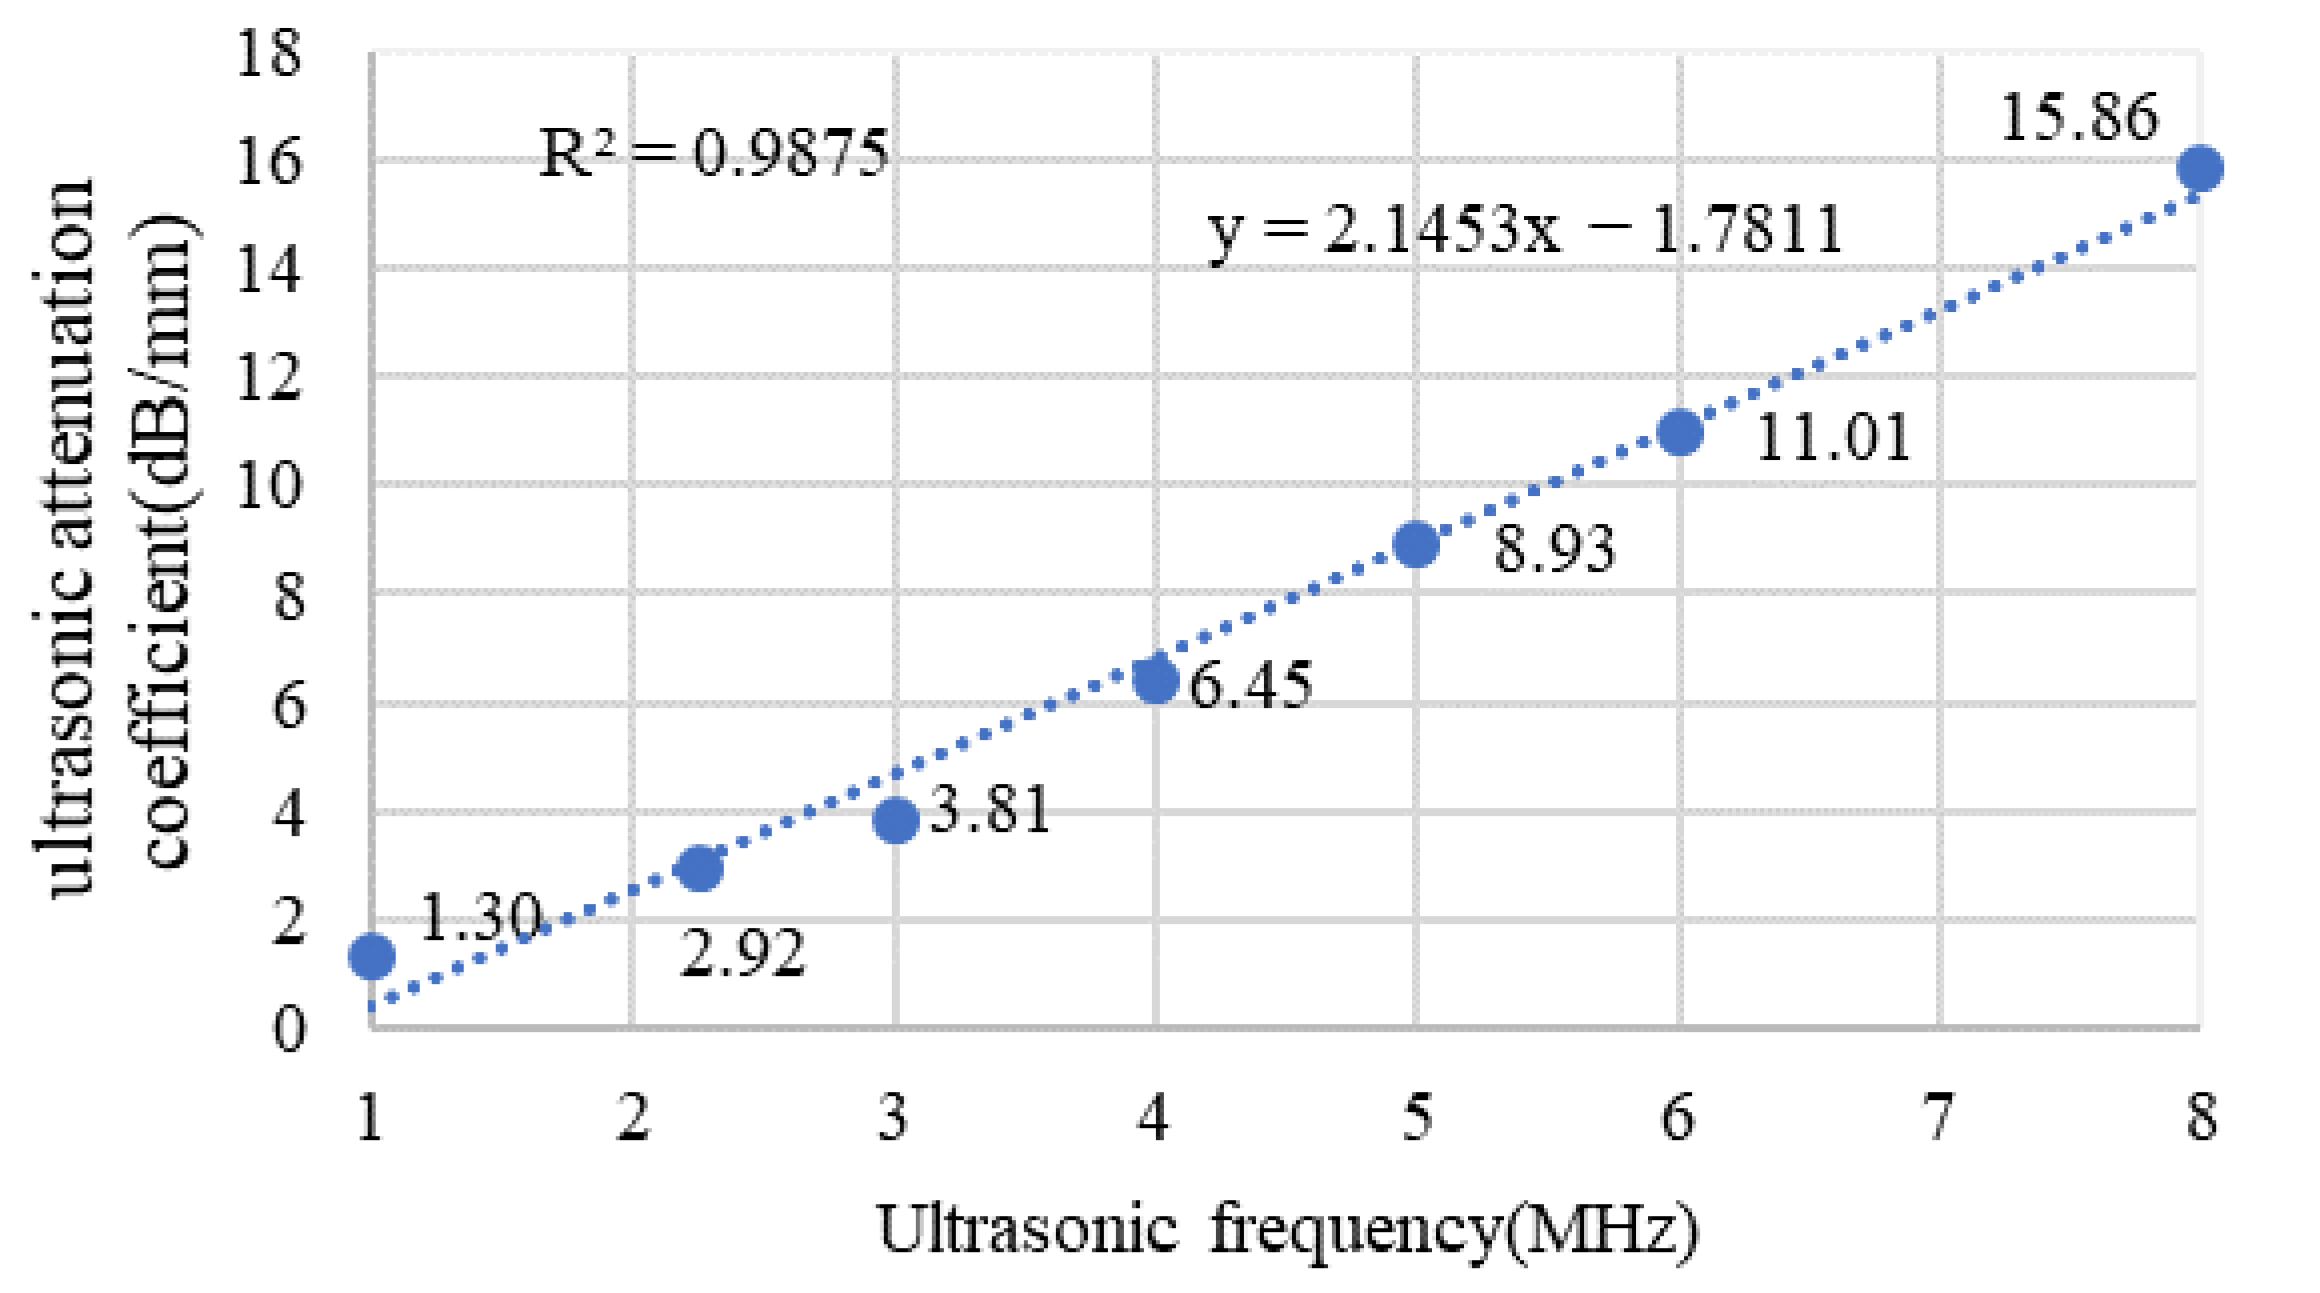
- The attenuation coefficients of PBX with pure binder and different explosive particle volume fractions were studied. The numerical simulation verified that scattering is the main influencing factor of ultrasonic attenuation, and the attenuation coefficient is positively correlated with the particle volume fraction and ultrasonic detection frequency.
- (3)
- The positive correlation between the ultrasonic attenuation coefficient, the particle volume fraction, and the ultrasonic frequency was verified. The function expression of the ultrasonic attenuation coefficient and the detection frequency was also fitted.
- (4)
- The deviation between the detected stress value and the actual loaded stress value inside the PBX composite material was determined to be within 15%. This indicates that within a certain tolerance range, the designed system is suitable for PBX sample stress testing.
Author Contributions
Funding
Informed Consent Statement
Data Availability Statement
Acknowledgments
Conflicts of Interest
References
- Rossini, N.S.; Dassisti, M.; Benyouni, K.Y.; Olabi, A.G. Methods of Measuring Residual Stresses in Components. Mater. Des. 2012, 35, 572–588. [Google Scholar] [CrossRef]
- Liu, S.Z.; Rao, N.X.; Zhang, C.; Jin, L. Design of Electromagnetic Ultrasonic Nondestructive Testing System Based on LabVIEW. Trans. China Electrotech. Soc. 2018, 33, 2274–2281. [Google Scholar]
- Zhou, H.Q.; Pei, C.X.; Liu, W.W.; Yi, D.C.; Yang, Z.F. Study on Detection Method of Internal Stress in PBX Simulated Material by Laser Ultrasonic Skimming Surface Longitudinal Wave. Chin. J. Energetic Mater. 2018, 26, 786–790. [Google Scholar]
- Yang, Z.F.; Tian, Y.; Zhou, H.Q.; Zhang, W.B. Detection of Micro-damages in TATB-based Polymer Bonded Explosive by Nonlinear Ultrasonic Technique. Chin. J. Energetic Mater. 2017, 25, 970–975. [Google Scholar]
- Wang, J.C.; Luo, J.R. Predicting the Effective Elastic Modulus of PBX Based on Voronoi Meso-scale Numerical Model. Chin. J. Energetic Mater. 2017, 25, 546–551. [Google Scholar]
- Dai, K.D.; Liu, Y.L.; Chen, P.W.; Tian, Y. Finite Element Simulation on Effective Elastic Modulus of PBX Explosives. Trans. Beijing Inst. Technol. 2012, 32, 1154–1158. [Google Scholar]
- Zhou, H.P.; Li, J.M.; Li, L.; Wei, X.W.; Zhang, W.B.; Wen, M.P. Testing and Relieving of Residual Stress for Polymer Bonded Explosive Based on TATB. Chin. J. Energetic Mater. 2008, 16, 37–40. [Google Scholar]
- Mo, Y.F.; Zhang, X.; Lin, L.; Tian, H.T.; Guang, G.P.; Li, X.M. Investigations on CFRP Porosity by Using Ultrasonic Testing Based on Random Pores Model. J. Mech. Eng. 2010, 46, 22–26. [Google Scholar]
- Zhou, X.J.; You, H.W.; Cheng, Y.D. Ultrasonic Attenuation Model of void-contained Carbon- fiber reinforced plastics. Acta Mater. Compos. Sin. 1997, 14, 99–106. [Google Scholar]
- Zhou, X.J.; Mo, J.Q.; You, H.W. Ultrasonic Attenuation Testing Method for NDE of Void Content Based on Theoretical Model and Experiment Calibration. Acta Mater. Compos. Sin. 1997, 14, 108–115. [Google Scholar]
- Liu, J.Z. Research and Implementation of CFRP Porosity Ultrasonic Nondestructive Testing. Ph.D. Dissertation, Machinery and Energy Engineering College Zhejiang University, Zhejiang, China, 2005. [Google Scholar]
- Yu, Y.L.; Ye, J.R.; Liu, K.; Zhang, B.M. A Mesoscale Ultrasonic Attenuation Finite Element Model of Void-containing Composites. Acta Mater. Compos. Sin. 2014, 31, 171–178. [Google Scholar]
- Han-song, H.; Ramesh, T. Effects of Void Geometry on Elastic Properties of Unidirectional Fiber Reinforced Composites. Compos. Sci. Technol. 2005, 65, 1964–1981. [Google Scholar]
- Wang, D.Y.; Wen, W.D.; Cui, H.T. Three-dimensional Progressive Damage Analysis of Composite Laminates Containing a Hole Subjected to Tensile Loading. Acta Mech. Sin. 2005, 7, 118–125. [Google Scholar]
- Xie, Q.; Li, Y.Z.; Li, B.; Li, X. The Strength Prediction of Composite Laminates Based on a Quasi-3D Finite Element Models. Sci. Technol. Eng. 2012, 12, 3160–3165. [Google Scholar]
- Pan, Q.X.; Shao, C.; Xiao, D.G.; Pan, R.P.; Liu, X.H.; Song, W. Robotic Ultrasonic Measurement of Residual Stress in Complex Curved Surface Components. Appl. Bionics Biomech. 2019, 2019, 2797896. [Google Scholar] [CrossRef]
- Yashar, J.; Mehdi, A.K.; Mehdi, A.N. Residual Stress Evaluation In Dissimilar Welded Joints Using Finite Element Simulation And The LCR Ultrasonic Wave. Int. J. Innova. Technol. Manag. 2013, 4, 170–174. [Google Scholar]
- Pan, Q.X.; Li, Y.; Xu, C.G.; Xiao, D.G.; Yang, X.C.; Wu, Y. Residual Stress Measurement for Welded Structure by Ultrasonic Wave. Electro. Mech. Eng. 2012, 28, 8–12. [Google Scholar]
- Xu, C.G.; Song, W.T.; Pan, Q.X.; Li, X.; Jin, X.; Liu, H.Y. Residual Stress Nondestructive Testing Method Using Ultrasonic. Nondestr. Test. 2014, 36, 25–31. [Google Scholar]
- Xu, C.G.; Li, H.X.; Wang, J.F.; Pan, Q.X.; Xiao, D.G. Ultrasonic Shear and Longitudinal Wave Testing Method of Residual Stress. Acta Acoust. 2017, 42, 195–204. [Google Scholar]
- Yang, Y.M.; Ju, Y.; Liu, H.B.; Wang, H.J. Influence of Porous Structure Properties on Mechanical Performances of Rock. Chin. J. Rock Mech. Eng. 2009, 28, 2031–2038. [Google Scholar]
- Kang, G.; Chen, P.W.; Guo, X.; Ma, G.W.; Ning, Y.J. Simulations of Meso-scale Deformation and Damage of Polymer Bonded Explosives by The Numerical Manifold Method. Eng. Anal. Bound. Elem. 2018, 96, 123–137. [Google Scholar] [CrossRef]
- Liu, Y.L. Micro-mechanical numerical simulation of viscoelastic behavior of PBX explosives. In Proceedings of the 20th Annual Academic Conference of the Beijing Society of Mechanics, Beijing, China, 12 January 2014. [Google Scholar]
- Zhang, Y.G.; Lou, J.F.; Hong, T. Modification of Viscose-Statistical Crack Mechanics for PBXs. Chin. J. High. Press. Phys. 2015, 29, 9–14. [Google Scholar]
- Gao, J.; Huang, Z.X. Parameter Sensitivity Analysis for Viscoelastic Damage Constitutive Model of PBX Materials. Eng. Mech. 2015, 32, 201–206. [Google Scholar]
- Djerir, W.; Ourak, M.; Boutkedjirt, T. Characterization of the Critically Refracted Longitudinal (LCR) Waves and Their Use in Defect Detection. Res. Nondestr. Eval. 2014, 25, 203–217. [Google Scholar] [CrossRef]


| Explosive Particles | Binder | ||||
|---|---|---|---|---|---|
| Material | Poisson’s Ratio | Elastic Modulus (MPa) | Material | Poisson’s Ratio | Elastic Modulus (MPa) |
| TATB | 0.25 | 8860 | Estane | 0.495 | 13.2 |
| RDX | 0.21 | 18,400 | F2311 | 0.499 | 42.2 |
| HMX | 0.32 | 26,410 | F2314 | 0.33 | 397 |
| Explosive Composition | Eeff MPa | |||||||
|---|---|---|---|---|---|---|---|---|
| 30% | 40% | 50% | 60% | 65% | 70% | 75% | 80% | |
| TATB+Estane | 217.69 | 242.51 | 426.67 | 534.26 | 832.68 | 1145.67 | 1507.34 | 1823.1 |
| TATB+F2311 | 410.48 | 464.67 | 664.74 | 1232.57 | 1666.5 | 2033.41 | 2451.34 | 2834.7 |
| TATB+F2314 | 1365.31 | 1957.78 | 2617.17 | 3694.53 | 4292.14 | 4856.67 | 5454.35 | 6034.7 |
| RDX+Estane | 485.23 | 591.98 | 712.99 | 815.19 | 1144.81 | 1465.45 | 1900.54 | 2253.3 |
| RDX+F2311 | 509.77 | 708.67 | 997.72 | 1696.36 | 2056.25 | 2399.78 | 2740.24 | 3133.5 |
| RDX+F2314 | 1793.12 | 2726.42 | 3706.86 | 5423.14 | 7236.41 | 8766.53 | 10,273.5 | 11,832 |
| HMX+Estane | 318.41 | 676.07 | 832.04 | 1014.72 | 1470.98 | 1830.79 | 2256.24 | 2676.1 |
| HMX+F2311 | 639.38 | 1026.83 | 1207.76 | 1742.64 | 2920.11 | 3450.34 | 3876.4 | 4232.7 |
| HMX+F2314 | 2548.39 | 3011.07 | 3846.85 | 7123.67 | 7629.4 | 9201.12 | 11,377.5 | 12,565 |
| Volume Fraction | Effective Elastic Modulus (MPa) | ||
|---|---|---|---|
| Round Particle | Oval Particle | ||
| 2 Grades | 3 Grades | 2 Grades | |
| 30% | 318.41 | 389.45 | 309.22 |
| 40% | 676.04 | 756.02 | 654.74 |
| 50% | 832.04 | 911.55 | 821.91 |
| 60% | 1014.72 | 1217.83 | 1012.21 |
| RVE Model | Ultrasonic Frequency (MHz) | Single Particle | Estane Binder | Difference |
|---|---|---|---|---|
| Sound attenuation coefficient (dB/mm) | 1 | 1.402 | 1.302 | 0.1 |
| 2.25 | 2.354 | 2.326 | 0.028 | |
| 3 | 4.440 | 3.866 | 0.574 | |
| 4 | 8.348 | 6.445 | 1.903 | |
| 5 | 12.482 | 9.145 | 3.337 | |
| 6 | 16.809 | 11.013 | 5.796 | |
| 8 | 21.039 | 15.860 | 5.179 |
| Number | Applying Load (MPa) | Measuring Sound Time Difference (ns) | Measuring Stress (MPa) | Deviation (MPa) | Relative Error |
|---|---|---|---|---|---|
| 1 | −0.5 | 3.69 | −0.438 | 0.062 | 12.4% |
| 2 | −1 | 7.42 | −0.881 | 0.119 | 11.9% |
| 3 | −1.5 | 11.91 | −1.415 | 0.085 | 5.67% |
| 4 | −2 | 15.29 | −1.816 | 0.184 | 9.20% |
| 5 | −2.5 | 19.81 | −2.353 | 0.147 | 5.88% |
| 6 | −3 | 23.10 | −2.744 | 0.256 | 8.53% |
Publisher’s Note: MDPI stays neutral with regard to jurisdictional claims in published maps and institutional affiliations. |
© 2021 by the authors. Licensee MDPI, Basel, Switzerland. This article is an open access article distributed under the terms and conditions of the Creative Commons Attribution (CC BY) license (http://creativecommons.org/licenses/by/4.0/).
Share and Cite
Pan, Q.; Li, S.; Liu, Y.; Xu, X.; Chang, M.; Zhang, Y. Meso-Simulation and Experimental Research on the Mechanical Behavior of an Energetic Explosive. Coatings 2021, 11, 64. https://doi.org/10.3390/coatings11010064
Pan Q, Li S, Liu Y, Xu X, Chang M, Zhang Y. Meso-Simulation and Experimental Research on the Mechanical Behavior of an Energetic Explosive. Coatings. 2021; 11(1):64. https://doi.org/10.3390/coatings11010064
Chicago/Turabian StylePan, Qinxue, Shuangyang Li, Yang Liu, Xiaoyu Xu, Meile Chang, and Yunmiao Zhang. 2021. "Meso-Simulation and Experimental Research on the Mechanical Behavior of an Energetic Explosive" Coatings 11, no. 1: 64. https://doi.org/10.3390/coatings11010064
APA StylePan, Q., Li, S., Liu, Y., Xu, X., Chang, M., & Zhang, Y. (2021). Meso-Simulation and Experimental Research on the Mechanical Behavior of an Energetic Explosive. Coatings, 11(1), 64. https://doi.org/10.3390/coatings11010064