Abstract
The pavement skid resistance performance index is one of the most important indexes to ensure driving safety. Based on the test data of RIOHTrack full-scale track, this paper analyzes the decay law of pavement skid resistance performance, including the sideway force coefficient (SFC), British pendulum number (BPN), mean texture depth measured by sand patch method (MTD) and sensor measured texture depth by laser method (SMTD), under different equivalent single axle load times (ESALs). The paper analyzes the influence of different methods and conditions on the different indicators and excavates the internal correlation of different pavement skid resistance performance indexes, aiming to improve the effectiveness and accuracy of pavement skid resistance performance detection. The shortcomings of the temperature correction method of BPN and SFC are verified, which cannot correct the skid resistance performance effectively in different temperatures. Based on the assumption that there is a sensitive range of temperature influence on skid resistance performance, a new temperature correction method of skid resistance performance index is proposed based on the Boltzmann model and equivalent temperature of the asphalt surface layer. It can truly reflect the decay law of skid resistance pavement performance. At the same time, the internal correlation between BPN and MTD indicators is analyzed. It is found that there is a linear growth law between two indexes whose correlation coefficient is 0.999, which provides a reference for the research of pavement skid resistance performance.
1. Introduction
Pavement texture depth, driving speed and environment are the main factors affecting the skid resistance performance of asphalt pavement. The temperature is one of the most important environmental factors which will seriously affect the morphology characteristics and the skid resistance of the pavement. Seasonal variation and alternation of day and night can make the temperature change periodically, which will lead to the change in internal temperature of the road structure [1]. Finally, it leads to the decay of pavement skid resistance.
Researchers worldwide have carried out a lot of research on temperature correction of pavement skid resistance. Flintsch et al. (2005) adopted an skid resistance trailer based on American Society of Testing Materials (ASTM) standard to evaluate seven hot mix asphalt (HMA) surfaces regularly. It was found that pavement temperature had a significant impact on pavement friction measurement [2]. Wang and Flintsch (2007) studied the surface friction and texture characteristics of twelve kinds of asphalt pavement through Virginia Intelligent Road. They studied the influence of temperature on the surface morphology characteristics in the long and short term and found that environmental factors had a significant impact on the skid resistance of pavement [3]. Ahammed et al. (2010) adopted British pendulum number (BPN) of both Portland cement concrete (PCC) and asphalt concrete (AC) pavements, which were measured bi-weekly or monthly to determine the effect of short-term weather changes on skid resistance variation. It shows that available friction fluctuates at 0.35 BPN per 1 °C change in prevailing ambient or pavement surface temperature, with an overall eight BPN seasonal fluctuation [4]. Khasawneh et al. (2012) adopted a British pendulum tester (BPT) to measure the surface friction of HMA specimens at different polishing stages and temperatures. It was found that temperature had a significant effect on the friction measurement value [5]. Hadiwardoyo et al. (2013) tested the skid resistance of an asphalt concrete wearing course using a skid resistance tester and a British pendulum tester. It was found that the skid resistance value decreases with the increase in asphalt pavement surface temperature [6]. Wang et al. (2013) simulated the development of the skid resistance of asphalt road surfaces in a laboratory using the Wehner/Schulze machine (W/S). The process of binder removal and polishing of the aggregate can be accurately described using a five-parameter skid resistance model [7]. They considered that it is necessary to study the influence of different environmental conditions in winter and summer on skid resistance performance. Kang (2015) studied the temperature correction value of lateral force coefficient under high temperature conditions by investigating the climate characteristics and skid resistance performance of typical pavement in Guangdong Province and adjusted the correction value according to the actual situation [8]. Deng (2017) considered that the temperature has a direct effect on the measured value of sideway force coefficient (SFC). He tested the SFC value of asphalt pavement with different mixture types at different surface temperatures and proposed temperature correction values. It was found that the SFC value of asphalt pavement was not linearly related to the road surface temperature [9]. Hassan et al. (2017) constructed three kinds of concrete mixtures with different surface textures by adding broken glass into the mixtures. It was found that the skid resistance of the three mixtures decreased with the increase in temperature [10]. Ahmed (2018) established a modified skid resistance model under temperature change by carrying out skid resistance tests on asphalt slabs below freezing point [11]. Wang et al. (2018) found that the structural depth of asphalt mixture increased with the increase in temperature through indoor accelerated wear test [12]. The temperature has a significant effect on the attenuation of skid resistance of asphalt pavement [13]. Christina et al. (2020) realized the quantification of seasonal variation of asphalt pavement skid resistance [14]. They proposed an estimation method of percentage change rate of skid resistance index under the influence of seasonal variation based on distribution fitting to evaluate the influence of seasonal variation on pavement skid resistance. Xiao et al. (2019) adopted the Bigaussion model to analyze the atmospheric temperature and pavement internal temperature data of RIOHTrack full-scale track, while its fitting effect was good [1]. Xie et al. (2018) simulated the polishing effect due to traffic and weathering with a self-developed device, the Harbin accelerated polishing machine (HAPM). The British pendulum number (BPN) and mean texture depth (MTD) were determined to describe skid resistance development during the polishing process. The influence of temperature on the development of skid resistance regarding different content of asphalt mixtures was deeply studied. It was found that the lower the temperature, the faster the rate at which the BPN decreases. Prediction models of the skid resistance of asphalt mixtures regarding temperature were created [15].
According to the analysis above, temperature has a great influence on pavement skid resistance performance. Existing temperature correction methods have some limitations, namely that they usually adopt the pavement surface temperature as the reference value, without considering the influence of the pavement internal temperature. In the existing standard of China, the temperature correction method is adopted only for the sideway force coefficient (SFC) and British pendulum number (BPN) index. The measured index is revised to 20 °C standard temperature [16]. There is no effective temperature correction method on the pavement texture depth index in the existing standards, which leads to measurement deviations in the pavement texture depth at different temperatures. It is impossible to compare and evaluate the skid resistance of pavement accurately. New temperature correction methods for pavement skid resistance need to be carried out.
The RIOH is the abbreviation of the Ministry of Transport Research Institute of Highway. The track is operated by the Ministry of Transport Research Institute of Highway, so it is called RIOHTrack full-scale track. The RIOHTrack full-scale track is the only entity verification platform aiming at the life cycle performance verification of long-life road structure, which provides a relatively controllable test environment. Through the accelerated pavement test (APT), the skid resistance performance of different pavement structures is tested periodically, which provides continuous data support for temperature correction of pavement skid resistance performance, so as to improve the reliability and accuracy of pavement skid resistance performance prediction model. Based on the RIOHTrack full-scale track, temperature sensors were embedded at different depth positions of the road structure to collect the temperature data inside the road. The paper introduces the test methods of the pavement skid resistance performance index adopted on the RIOHTrack full-scale track and analyzes the influence of detection methods and conditions (including temperature, speed, water quantity) on the pavement skid resistance performance. Through the analysis of the test data of different pavement structures, it is found that the temperature correction method of the pavement skid resistance performance index (including BPN and SFC) has shortcomings in the existing specifications, which cannot effectively correct the skid resistance performance under different temperatures. Based on the assumption that there is a sensitive range for the influence of temperature on skid resistance performance, a new temperature correction method based on the Boltzmann model and equivalent temperature of asphalt surface layer is proposed to reflect the decay law of pavement skid resistance performance. At the same time, the internal correlation of different pavement skid resistance performance indexes is deeply analyzed to simplify the detection process of skid resistance performance, which can improve the effectiveness and accuracy of pavement detection, guide the best time of pavement maintenance, save the cost of pavement maintenance and improve the safety of highway driving.
2. Detection of Skid Resistance Index on RIOHTrack Full-Scale Track
The RIOHTrack full-scale track contains 19 forms of typical asphalt pavement structures in China, as shown in Figure 1. There are four typical pavement structures on the RIOHTrack full-scale track including SMA13–75%, SAC13–65%, SAC13–70% and PAC13–80%. The STR9 structure is one of the typical structures on the RIOHTrack full-scale track, which is also one of the typical structural types used in the current expressway construction process in China [17]. It mainly adopts 4 cm PAC13 high viscosity drainage asphalt concrete. The coarse aggregate content with particle size greater than 4.75 mm in the asphalt mixture is 80%. The thickness of the asphalt pavement surface is 18 cm. The two layers of cement stabilized graded crushed stone are used as a base, with a thickness of 38 cm. The cement stabilized soil is used as a sub-base, with a thickness of 20 cm, as shown in Figure 2.
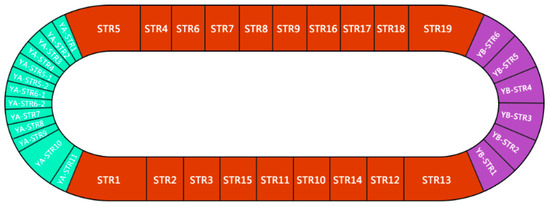
Figure 1.
Structural distribution of RIOHTrack full-scale track.
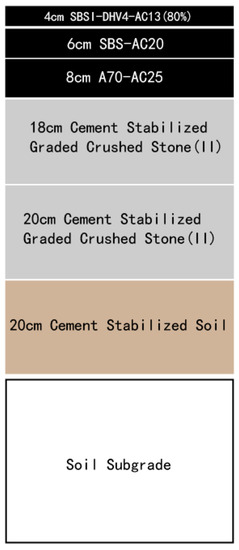
Figure 2.
The STR9 structure of RIOHTrack full-scale track.
At present, the evaluation methods of pavement skid resistance performance are mainly divided into the direct method and indirect method. The direct method is mainly used to evaluate the friction coefficient of pavement, such as SFC and BPN. The indirect method is mainly used to evaluate the macro and micro-structure of pavement, such as mean texture depth measured by the sand patch method (MTD) and sensor measured texture depth by laser method (SMTD), as shown in Figure 3. The pavement skid resistance performance test of RIOHTrack full-scale track is carried out according to the Chinese standard of the field test methods of subgrade and pavement for highway engineering (JTG E60-2008) [18]. The skid resistance performance indexes such as SFC, BPN, MTD, and SMTD are tested by different types of detection equipment, such as the BM-III British pendulum tester (Beijing Chaoyang Luda Instrument Factory, Beijing, China), multi-function testing vehicle (CISC III road condition rapid detection system), sideway force coefficient measuring vehicle, and so on, as shown in Figure 4.
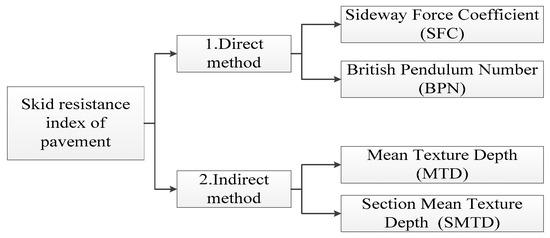
Figure 3.
Classification of skid resistance performance index.
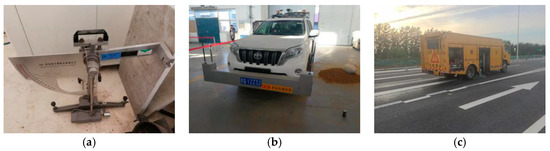
Figure 4.
Testing equipment for skid resistance of RIOHTrack full-scale track. (a) BM-III British pendulum tester, (b) multi-function testing vehicle (CISC III), (c) sideway force coefficient measuring vehicle.
2.1. Detection of BPN Index
The BPN is an index which adopts the friction between road surface and tire to characterize the skid resistance of pavement surface. In the BPN detection of RIOHTrack full-scale track, the calibrated BM-III British pendulum tester is used to obtain the BPN value. The BPN is measured every 10 m. Each point is measured 5 times. The average BPN value of each point in the road section is calculated as the BPN value.
2.2. Detection of SMTD Index
The skid resistance performance of asphalt pavement is closely related to the surface morphology, which is mainly determined by the micro and macro-texture structure of the pavement. Reasonable texture characteristic parameters can accurately predict the skid resistance performance of the pavement [19]. In the SMTD detection of RIOHTrack full-scale track, the full section road condition rapid detection system in the multi-function testing vehicle (CICS III) is used to detect the pavement texture depth. The driving speed is 50 km/h, while the SMTD index is measured every 20 m. Each lane is detected three times, and the average value is taken as the SMTD value.
2.3. Detection of MTD Index
The manual sand patch method is used to detect the pavement structure depth. The detection frequency is 10 m for one point, while each point is detected three times. The standard sand with 0.3–0.6 mm particle size is selected for detection. The average value of pavement structure depth measurement results is taken as the MTD index.
2.4. Detection of SFC Index
The detection of SFC index is one of the main pavement skid resistance performance testing methods. It can not only reflect the length of vehicle braking distance but also characterize the ability of the road surface to prevent the vehicle sideslip phenomenon. It is an intuitive reflection of pavement skid resistance performance which is adopted in the highway acceptance. The SFC index of RIOHTrack full-scale track is detected by using a double wheel type sideway force coefficient measuring vehicle. The transverse tension is measured by the tension sensor. The friction coefficient of lateral force is obtained by calculating the ratio of tension to vertical load. The test speed is generally 50 km/h.
In the study, the sideway force coefficient measuring vehicle of the Beijing Road Engineering Quality Supervision Station is adopted to obtain the SFC test data of RIOHTrack full-scale track. Through the calibration before detection, the data validity and accuracy are ensured. Each detection starts from the starting point in the STR11 structure on RIOHTrack full-scale track, as shown in Figure 5. Each traffic lane is tested three times to obtain the SFC value, vehicle speed and road surface temperature data of each measuring point. The average value of each test is taken as the SFC value.
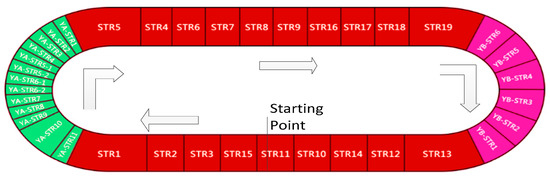
Figure 5.
Schematic diagram of sideway force coefficient detection.
3. Detection and Analysis of Pavement SFC Value
3.1. Data Collection of Pavement SFC Value
The SFC value represents the skid resistance performance of the pavement structure under the most unfavorable condition of tire road friction during high-speed driving. Through SFC detection on RIOHTrack full-scale track, the SFC values in 13 test times from 2017 to 2018 of different pavement structures are obtained, as shown in Figure 6. For different asphalt pavement structures, the SFC value changes in a wavy shape with the increase in equivalent single axle load times (ESALs). The pavement structure types have significant influence on the test result of SFC value under the coupling effect of the same environment and load. With the change in temperature in different seasons, the SFC value of pavement fluctuates seasonally.
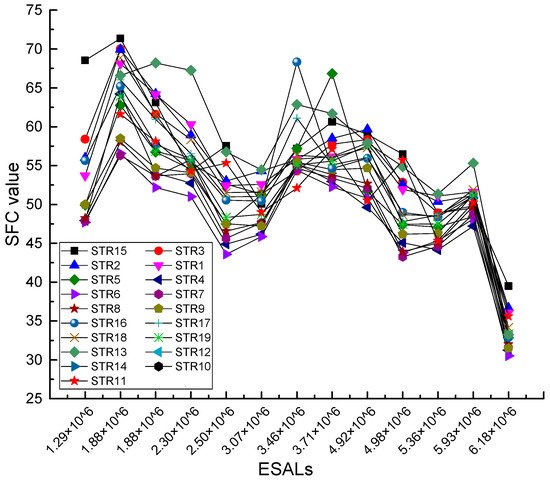
Figure 6.
SFC value variation of asphalt pavement structure under different periods.
3.2. The Current Correction Method of SFC in China
Most regions of China have a typical continental climate. The velocity and temperature correction of SFC values in the Chinese standard are based on this climate condition. The pavement surface freezes easily in winter, when the temperature is below 0 °C. The specification in China requires that the temperature should be controlled between 8 °C and 60 °C, because extreme weather may lead to errors in the stress sensor. It is necessary to spray water during the detection of SFC values, which will cause the road icing phenomenon in winter. It is unfavorable to conduct the SFC test in winter. Therefore, the SFC value detection of pavement skid resistance performance cannot consider the seasonal influence, but temperature correction is needed.
The summer season is the most unfavorable season for the skid resistance of pavement, which is conducive to analyze the change in SFC value. He et al. [20] considered that there was a linear relationship between SFC value and temperature. It is necessary to take temperature correction in the process of SFC measurement and put forward the temperature correction formula of SFC, as shown in Equation (1).
where SFC20 is the SFC at the standard temperature of 20 °C, SFCT is the SFC at the standard temperature of t °C, and t is the test temperature.
In the Chinese standard of “Field test methods of subgrade and pavement for highway engineering (JTG E60-2008)” [18], the standard test speed of SFC is 50 ± 4 km/h. The other detection values need to be switched to the equivalent SFC value at standard speed. The standard test ground temperature range of SFC values is 20 ± 5 °C. The SFC values measured under other ground temperature conditions need to be switched to the equivalent SFC value at standard temperature through the conversion coefficient, as shown in Table 1.

Table 1.
Temperature correction value of SFC.
The SFC values of RIOHTrack full-scale track obtained on 25 March 2016 were used for analysis. This is the calibration period for the RIOHTrack full-scale track. The accelerated pavement test was not carried out, while the pavement SFC value was mainly affected by environmental factors such as temperature. Through the sensor monitoring of the SFC detection vehicle, it is found that the vehicle speed fluctuates in the actual detection process, although the standard detection speed is 50 km/h, while the surface temperature of different pavement structures is also different, so it is necessary to take the speed and temperature correction of SFC values. According to the current correction method in the Chinese standard, the SFC index is modified. The SFC values of different pavement structures before and after speed and temperature correction are shown in Table 2.
Table 2.
Correction of SFC values for different pavement structures on RIOHTrack full-scale track.
For the same pavement structure, there is no obvious difference except the influence of the environment on the pavement structure. When the same equipment is adopted in the SFC test under the same speed and other conditions, the detection results of SFC values should be basically consistent after temperature correction. Through the comparison of the two sets of SFC detection data on 25 March 2016 and 25 May 2016, the SFC values before and after temperature correction are shown in Figure 7.
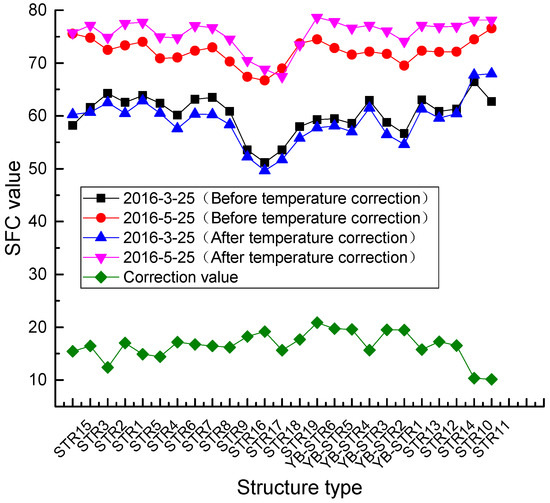
Figure 7.
Comparison of SFC values before and after temperature correction.
Through the above analysis, it was found that there is an obvious difference between the two test results through the speed and temperature correction of the pavement SFC value under the same conditions such as speed, pavement structure and loading. The maximum SFC value difference is 20.89, while the average difference is 16.52. It is necessary to establish a new temperature correction method so as to truly reflect the skid resistance performance of pavement, which is helpful to ensure the safety of road driving.
3.3. Analysis of SFC Influencing Factors
The Chinese current pavement skid resistance safety standard is formulated based on a speed of 50 km/h, so the speed is used as the standard speed in the specification. There is inconsistency between the different standards in China. The SFC test result of 60 km/h is adopted in the standard of specifications for the design of highway asphalt pavement (JTG D50-2017), which is used for road handover and acceptance [21]. In order to study the influence of different vehicle speeds on the asphalt pavement SFC value, the test data obtained on 13 June 2017 with the speeds of 30 km/h, 40 km/h, 50 km/h, 60 km/h and 70 km/h were used to analyze the influence of different speeds and structures on the detection results of SFC, as shown in Figure 8. This analysis detected the following:
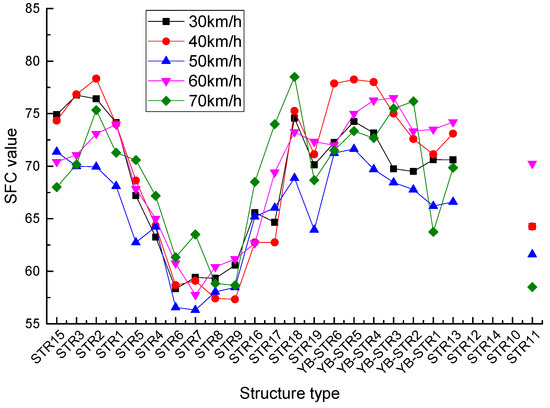
Figure 8.
SFC at different speeds.
- It is not that the higher the speed, the lower the SFC value. At the speed of 50 km/h, the overall result of the SFC value is smaller, which is the most favorable to the skid resistance of pavement.
- Different structures have different degrees of sensitivity to speed in the test of SFC value. The test results of SFC value have strong structure dependence. Among them, the test results with STR8 and STR9 structures are basically consistent at different speeds, while the maximum difference in STR17 and STR11 structures is 11.8. It can be seen that different pavement structures have an obvious influence on the test results. In the process of SFC correction, it is necessary to consider the correction parameter of pavement structure in addition to the correction of temperature and speed.
Based on the SFC data obtained on 5 June 2018, the measurement results under different test conditions are compared and analyzed, as shown in the Figure 9. This analysis detected the following:
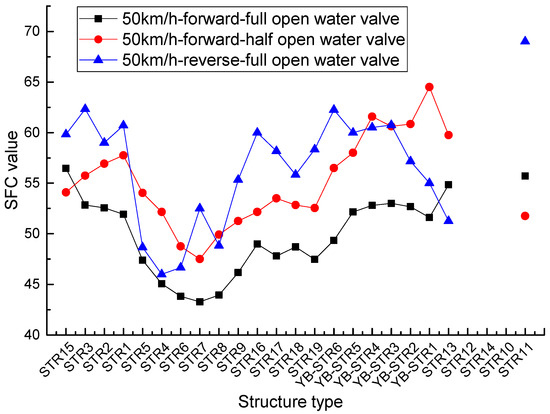
Figure 9.
SFC under different conditions.
- At the same speed of 50 km/h, there is a large difference between the forward measurement and the reverse measurement. The SFC value of forward measurement is smaller than that of reverse measurement. Due to the effect of vehicle load on the long-term traffic road, the degree of road surface polishing is more serious in the normal driving path direction. Therefore, the skid resistance of the road surface is lower when measuring along the forward direction. It is necessary to carry out SFC measurement in the driving direction along the carriageway, which is the most unfavorable condition for road skid resistance performance. The test results can truly reflect the skid resistance performance of pavement.
- The thickness of water film affects the detection results of SFC value. The water tank capacity of the SFC detection vehicle is six tons, and its water effluent rate is directly proportional to its driving speed, so as to ensure that the water film thickness of the pavement is between 0.5 and 1.0 mm. When the water valve is fully open, the water film thickness can meet the test requirements in the test process. While the water valve is semi-open, the water film thickness is smaller. Through the actual detection, it is found that the SFC value obtained by the semi-open water valve state is significantly larger than that of the fully open water valve. It was mainly influenced by the water on the skid resistance performance. The semi-open water valve state has a thinner surface water film and a smaller reduction in the skid resistance performance of the pavement, so the SFC value is larger. The skid resistance of the pavement structure is relatively safe.
Through the above analysis, it is found that the factors of detection speed, direction and water quantity have an important impact on the detection results of SFC value. The detection result of SFC value is small and safe in the carriageway direction and full opening of the water valve. The test results of SFC have strong structure dependence, and different structures have different degrees of sensitivity to speed. In addition to the correction of temperature and speed, the parameter of pavement structure should be considered.
4. Temperature Correction of BPN Index
British pendulum number (BPN) is one of the most important indexes of pavement skid resistance measured by the British pendulum tester. It was first invented in England and gradually adopted around the world. Since it is greatly affected by the road surface temperature, many countries in the world adopt 20 °C as the standard temperature, such as Britain, Japan, the United States and so on. They correct the BPN index under the measured temperature to the standard temperature.
In the Chinese standard of field test methods of subgrade and pavement for highway engineering (JTG E60-2008), the temperature at the pavement surface is adopted to correct the BPN temperature. According to the temperature correction value (ΔBPN) in Table 3, the BPN value under the measured temperature t °C (BPNt) is corrected to the BPN value under the standard temperature of 20 °C (BPN20) according to the following formula. The modified formula of BPN value is shown in Equation (2), and the temperature correction value is shown in Table 3.
where BPN20 is the BPN value at standard temperature of 20 °C; BPNt is the BPN value at pavement temperature of T °C; ΔBPN is the temperature correction value, according to Table 3.
Table 3.
Temperature correction of British pendulum number (BPN) value [18].
In the actual process of temperature correction, the BPN correction value is obtained by the interpolation method, which needs to be corrected for each specific temperature range. It is not easy to use in practical engineering. At the same time, the existing temperature correction parameters cannot meet the actual temperature correction requirements. The actual temperature in summer will exceed 40 °C, while the temperature in winter will also be less than 0 °C. This leads to the temperature correction of skid resistance performance not being accurate enough.
Based on the four measurement results of BPN value in March, May, July and October 2016, the pavement BPN index is converted according to the temperature correction method specified in the existing regulations, as shown in Figure 10. It is found that the BPN value of the same measuring point and standard temperature of 20 °C are still quite different after temperature correction under the condition of no vehicle loading. Taking the test results of SAC13–70% pavement structure including STR4, STR5, STR6, STR7 and STR8 as an example, the maximum difference value of the four measurement results is as high as 30 units, with an average 22 unit difference even after temperature correction. The average value of variation coefficient is as high as 13%. Therefore, it can be seen that the BPN correction method used in the current specification of China is unable to correct the different temperatures accurately and effectively. Therefore, it is necessary to develop a new temperature correction method of pavement skid resistance performance to realize the accurate expression of pavement skid resistance performance.
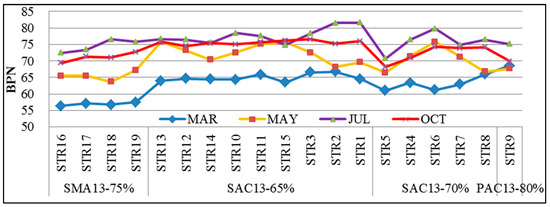
Figure 10.
BPN index of different pavement structures on the RIOHTrack full-scale track in 2016 (after temperature correction).
Due to the influence of accumulated load, the friction coefficient between tire and pavement is reduced. Through comparison, it was found that the BPN value in the traffic lane is obviously smaller than that of the passing lane. In the study, eleven BPN test results obtained in the morning, noon and afternoon on the RIOHTrack full-scale track in 2018 were selected to carry out temperature correction. The BPN values before and after temperature correction were compared and analyzed. The results are shown in Figure 11 and Table 4.
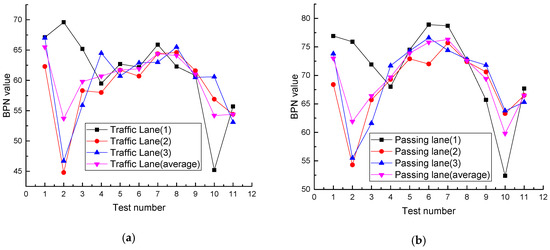
Figure 11.
Change in BPN value in different time periods (before temperature correction). (a) Traffic lane; (b) passing lane.
Table 4.
BPN on the RIOHTrack full-scale track in 2018 (before temperature correction).
Through the above analysis, it was found that, before the temperature correction, there were significant differences in the pavement BPN value indexes detected in different time periods. Due to the influence of the temperature difference between day and night, the maximum temperature difference detected in a day reaches 21.9 °C. Due to the low temperature of the pavement surface in the first detection, the BPN value is relatively large, and the BPN value results show different trends. In the first detection of 22 April 2018, there is no obvious inflection point. The temperature change has a significant effect on the skid resistance of pavement.
According to the Chinese standard, the temperature correction results of BPN index are shown in Table 5 and Figure 12.
Table 5.
Temperature correction results of BPN on the RIOHTrack full-scale track in 2018 (Chinese standard).
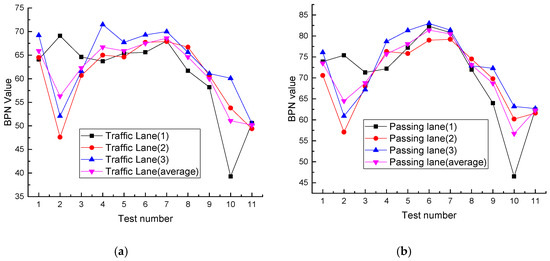
Figure 12.
Temperature correction results of BPN on the RIOHTrack full-scale track in 2018 (Chinese standard). (a) Traffic lane; (b) passing lane.
Through the analysis, it is found that the change trend of the BPN value is consistent before and after the temperature correction, which shows a wave-shaped change and reaches the highest value in August in summer. The traffic lane on the RIOHTrack full-scale track remains loaded, while the passing lane is not loaded. There is a phenomenon that the BPN change trend of the traffic lane is the same as the passing lane. It can be inferred that the change in pavement skid resistance performance is mainly affected by the coupling effect of load and environmental factors.
Referring to the modified method [20] proposed by the Japanese Road Association, the temperature correction method of BPN value is adopted to correct the pavement BPN value of the STR9 structure on the RIOHTrack full-scale track, as shown in Equation (3). The calculation results are shown in Table 6.
where BPN20 is the BPN value at standard temperature of 20 °C; BPNt is the BPN value at pavement temperature of t °C; t is the pavement test temperature.
Table 6.
Comparison of temperature correction results of BPN on the RIOHTrack full-scale track in 2018 (different national standards).
The temperature correction formula proposed by the Transport and Road Research Laboratory (TRRL) is used to correct the pavement BPN value. The calculation formula is shown in Equation (4):
where t is the pavement test temperature (°C); C20 is the BPN value converted into temperature 20 °C; Ct is the BPN value measured at temperature t °C.
The temperature correction results of BPN index in different countries are shown in the Table 6 and Figure 13.
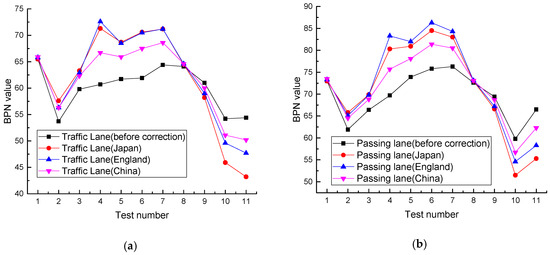
Figure 13.
Variation trend of pavement BPN value after temperature correction by different standards. (a) Traffic lane; (b) passing lane.
There is a general rule in the current temperature correction methods of BPN in different countries. When the temperature exceeds the standard value of 20 °C, it is considered that the detection BPN value is small and needs to be increased; when the temperature is lower than the standard value of 20 °C, the detection BPN value is large and needs to be reduced.
5. Temperature Correction Model of Pavement Skid Resistance Performance Based on Boltzmann Model
The asphalt surface layer is the location where the vehicle tires are in direct contact. The change of skid resistance of asphalt surface layer is very important to ensure the traffic safety of the road. Since asphalt is a temperature sensitive material, the asphalt surface layer is more vulnerable to the influence of temperature change compared with other layers. Its temperature change will directly affect the measurement results of the pavement skid resistance performance index. At the same time, the impact of temperature on the skid resistance of asphalt pavement is limited. It is assumed that there is a certain range of temperature influence on the skid resistance of asphalt concrete pavement. The temperature effect of asphalt surface layer is mainly considered when studying the influence of temperature on pavement skid resistance performance.
Based on the daily equivalent temperature of a 4 cm asphalt surface layer in 2018 and the SMTD value of the SAC13–65% structure, the relationship model between asphalt pavement texture depth and asphalt surface layer daily equivalent temperature was established using the Boltzmann model. The model form is shown in Equation (5), the corresponding fitting curve is shown in Figure 14, and the correlation coefficient is shown in Table 7.
where SMTDT is texture depth of asphalt concrete pavement under measured temperature, mm; is the daily equivalent temperature of asphalt surface layer, °C; A1 is the minimum asymptotic value of texture depth of asphalt concrete pavement, mm; A2 is the maximum asymptotic value of texture depth of asphalt concrete pavement, mm; T0 is the temperature value when the texture depth is (A1–A2)/2, °C; is the temperature step size.
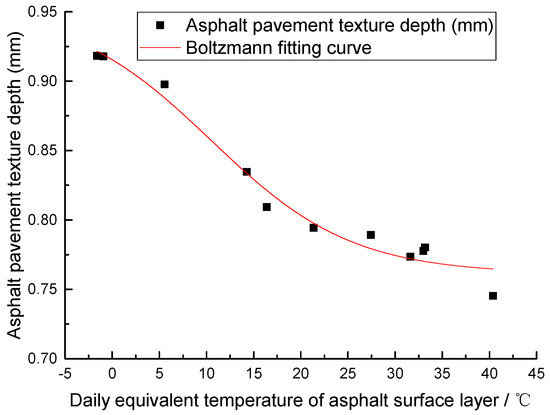
Figure 14.
Boltzmann fitting curve between sensor measured texture depth by laser method (SMTD) and temperature of asphalt pavement.
Table 7.
Parameters of the relationship model between texture depth and temperature of asphalt surface.
Based on the daily equivalent temperature of the 4 cm asphalt surface layer in 2018 and the BPN value of the PAC13–80% structure, the relationship model between BPN value and asphalt surface layer daily equivalent temperature was established using the Boltzmann model. The model form is shown in Equation (6), the corresponding fitting curve is shown in Figure 15, and the correlation coefficient is shown in Table 8.
where BPNT is the BPN of asphalt concrete pavement under measured temperature; is the daily equivalent temperature of asphalt surface layer, °C; B1 is the minimum asymptotic value of BPN of asphalt concrete pavement; A2 is the maximum asymptotic value of BPN of asphalt concrete pavement; T0 is the temperature value when the BPN is (B1−B2)/2, °C; is the temperature step size.
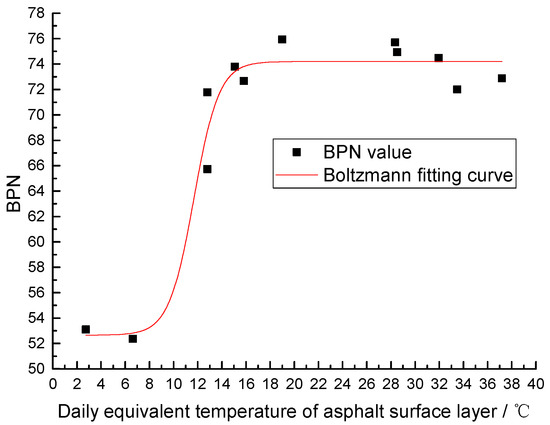
Figure 15.
Boltzmann fitting curve between BPN and temperature of asphalt pavement.
Table 8.
Parameters of the relationship model between BPN and temperature of asphalt surface.
In this paper, the equivalent temperature of the asphalt surface layer is used as the correction temperature for pavement structure depth and BPN value index, which directly reflects the influence of pavement internal temperature on pavement skid resistance performance and overcomes the deficiency of the temperature correction effect by using atmospheric temperature. The correction coefficient of model fitting can be calculated by the Boltzmann model, and the pavement texture depth and BPN value under standard temperature can be calculated. The simulation fitting accuracy of the Boltzmann model is 0.977 and 0.957, respectively. By using the equivalent temperature of the asphalt surface layer to correct the temperature of the pavement structure depth index, the error of the temperature correction can be reduced. The modified pavement structure depth index is more in line with the actual pavement skid resistance performance state, which truly reflects the influence of temperature changes in four seasons on the asphalt pavement structure depth index and realizes the comparison of skid resistance performance of different asphalt pavement structures.
6. Correlation Analysis among Different Skid Resistance Performance Indexes
In the detection of RIOHTrack full-scale track, two different detection methods were adopted to detect the skid resistance performance of different pavement structures, named the direct method and indirect method. The pavement skid resistance performance indexes of different pavement structures including SFC, BPN, MTD and SMTD were obtained.
In the research, the STR9 structure is taken as the research object. The correlation analysis of different skid resistance performance indexes is carried out, and the skid resistance performance indexes under different equivalent single axle load times (ESALs) are shown in Table 9.
Table 9.
Pavement skid resistance performance index of STR9 structure on the RIOHTrack full-scale track in 2018.
According to the test method for the determination of pavement structural depth by the manual sand laying method in China, the MTD index of the RIOHTrack full-scale track is calculated by Equation (7).
where MTD is the mean texture depth measured by the sand patch method (mm); V is the volume of sand (25 cm3); D is the average diameter of the spread sand (mm).
Through analysis, it is found that, with the increase in ESALs, the change in BPN value and MTD value is completely consistent, as shown in Figure 16. It reflects the consistency of different indexes in reflecting the skid resistance performance of the same structure.
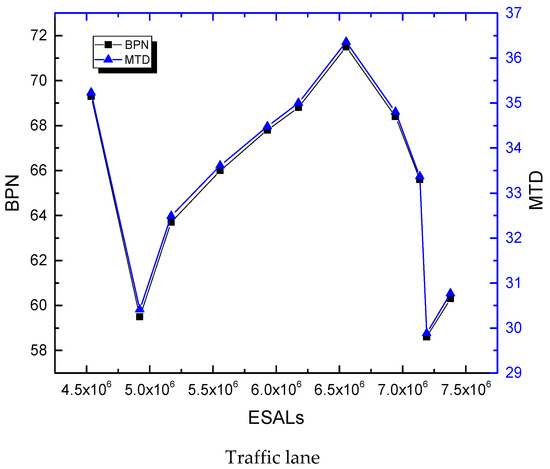
Figure 16.
Changes of BPN and MTD with ESALs.
By using Origin software for fitting analysis, it is found that there is a linear growth law between the BPN and MTD index, while the correlation coefficient reaches 0.999, as shown in Equation (8) and Figure 17.
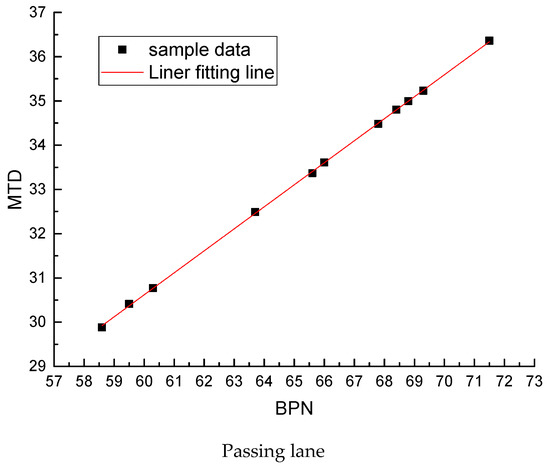
Figure 17.
Relationship between BPN and MTD.
7. Conclusions
In this paper, based on the RIOHTrack full-scale track, 19 kinds of asphalt pavement structure skid resistance performance indexes such as SFC, BPN, MTD and SMTD are tested by different types of detection equipment such as the BM-III British pendulum tester, multi-function testing vehicle (CISC III), sideway force coefficient measuring vehicle and so on. The decay law of pavement skid resistance performance under different ESALs was analyzed. The influence of different detection methods and conditions (such as temperature, speed, water quantity) on the skid resistance performance index of SFC is analyzed. The internal correlation of different pavement skid resistance performance indexes is excavated, which can improve the effectiveness and accuracy of pavement skid resistance performance index detection. Through this study, the following conclusions are drawn:
- There are some shortcomings in the existing temperature correction methods for BPN and SFC indexes in the existing specifications of China. The skid resistance performance indexes modified by the existing temperature correction methods still have large fluctuations, which cannot accurately reflect the impact of different temperatures on the skid resistance performance of pavement. Based on the assumption that there is a sensitive range of temperature influence on skid resistance performance, a new temperature correction method of skid resistance performance index based on the Boltzmann model and equivalent temperature of asphalt surface layer is proposed, which can truly reflect the decay law of skid resistance pavement performance.
- In the process of SFC detection, detection speed, detection direction and water sprinkling volume are important factors affecting the SFC test result. SFC detection is reasonable when it is tested along the traffic lane with full opening of the water valve. Meanwhile, the test results of SFC have strong structure dependence, and different structure forms have different degrees of sensitivity to pavement skid resistance. The influencing factors of pavement structure should be considered in the correction.
- The temperature correction methods of pavement BPN values in Japan, Britain and China are compared and analyzed. It is found that 20 °C is widely used as the standard temperature in different countries. When the temperature exceeds the standard value of 20 °C, it is considered that the detection BPN value is small and needs to be increased; when the temperature is lower than the standard value of 20 °C, the detection BPN value is large and needs to be reduced.
- Through the correlation analysis of BPN value and MTD value in the STR9 structure, it is found that there is a linear growth law between the two indicators, and the correlation coefficient reaches 0.999.
The pavement skid resistance performance is affected by many factors including material, environment, vehicle condition and so on. Depending on the RIOHTrack full-scale track, mining the value of pavement skid resistance performance test data and establishing an intelligent prediction model affected by multiple factors are the future research directions. This will provide a reference for the formulation of road design specifications, realize the rapid detection and analysis of pavement skid resistance performance and provide a guarantee for road traffic safety.
Author Contributions
Conceptualization, X.W. and L.W.; methodology, L.Z.; software, J.W.; validation, J.W., Q.X. and H.Y.; formal analysis, J.W.; investigation, J.W. and X.W.; resources, X.W. and L.W.; data curation, X.W., Q.X. and L.Z.; writing—original draft preparation, J.W.; writing—review and editing, J.W.; visualization, J.W.; supervision, X.W., L.W. and L.Z.; project administration, X.W. and L.Z.; funding acquisition, J.W. All authors have read and agreed to the published version of the manuscript.
Funding
This research was funded by the Central Public-Interest Scientific Institution Basal Research Fund (No. 2019-0123), to which the authors are grateful.
Acknowledgments
Thanks to the inspection and operation team of the RIOHTrack full-scale track at the Ministry of Transport Research Institute of Highway. Thanks for their great efforts in the test and detection process. Thanks to everyone who offered help and advice in the research.
Conflicts of Interest
There is no conflict of interest.
References
- Xiao, Q.; Xu, B.; Wang, X.; Zhou, Y. Study on feature and fitting of RIOHTRACK pavement temperature cureve. J. Highw. Transp. Res. Dev. 2019, 36, 1–6. [Google Scholar]
- Flintsch, G.W.; Luo, Y.; Al-Qadi, I.L. Analysis of the effect of pavement temperature on the frictional properties of flexible pavement surfaces. In Proceedings of the 84th Transportation Research Board Annual Meeting, Washington, DC, USA, 9–13 January 2005. [Google Scholar]
- Wang, H.; Flintsch, G.W. Investigation of Shortand Long-Term Variations of Pavement Surface Characteristics at the Virginia Smart Road; Transportation Research Board, National Research Council: Washington, DC, USA, 2007. [Google Scholar]
- Ahammed, M.A.; Tighe, S.L. Effect of short-term and long-term weather on pavement surface friction. Int. J. Pavement Res. Technol. 2010, 3, 295–302. [Google Scholar]
- Khasawneh, M.A.; Liang, R.Y. Temperature effect on frictional properties of HMA at different polishing stages. Jordan J. Civ. Eng. 2012, 6, 39–53. [Google Scholar]
- Hadiwardoyo, S.P.; Sinaga, E.S.; Fikri, H. The influence of Buton asphalt additive on skid resistance based on penetration index and temperature. Constr. Build. Mater. 2013, 42, 5–10. [Google Scholar] [CrossRef]
- Wang, D.; Chen, X.; Yin, C.; Oeser, M.; Steinauer, B. Influence of different polishing conditions on the skid resistance development of asphalt surface. Wear 2013, 208, 71–78. [Google Scholar] [CrossRef]
- Kang, H. Temperature Correction Research of Lateral Force Coefficient of Asphalt Pavement According to the Climate in Guangdong Province; Guangzhou University: Guangzhou, China, 2015. [Google Scholar]
- Deng, X. Experimental Study on Temperature Correction of Transverse Force Coefficient of Asphalt Pavement Based on Different Mixture Types. Hunan Commun. Sci. Technol. 2017, 43, 13–15. [Google Scholar]
- Ziari, H.; Barakoohi, A.T.; Moniri, A. Laboratory investigation of the effect of temperature on frictional properties of concrete pavements containing crushed glass. Int. J. Pavement Res. Technol. 2017, 10, 297–303. [Google Scholar] [CrossRef]
- El-Desouky, A. Investigating the effect of temperature variations on the measured airfield pavement skid resistance. Constr. Build. Mater. 2018, 161, 649–653. [Google Scholar] [CrossRef]
- Yong, W.; Shuang, T. Experimental study of environmental factors on skid resistance of the asphalt pavement with sand depositing. J. Water Resour. Archit. Eng. 2018, 16, 216–219. [Google Scholar]
- Yong, W.; Teng, Y.; Jiangbo, Y.; Huaxin, C.; Dongliang, K. Research on skid resistance attenuation of asphalt pavement by accelerated wear. Road Mach. Constr. Mech. 2016, 33, 71–74. [Google Scholar]
- Plati, C.; Pomoni, M.; Georgouli, K. Quantification of skid resistance seasonal variation in asphalt pavements. J. Traffic Transp. Eng. (Engl. Ed.) 2020, 7, 237–248. [Google Scholar] [CrossRef]
- Xie, X.; Lu, G.; Liu, P.; Zhou, Y.; Wang, D.; Oeser, M. Influence of temperature on polishing behaviour of asphalt road surfaces. Wear 2018, 402–403, 49–56. [Google Scholar]
- Ministry of Transport; Research Institute of Highway. Field Test Methods of Subgrade and Pavement for Highway Engineering; JTG E60-2008; People’s Communications Press: Beijing, China, 2008.
- Wang, X.D. Design of Pavement Structure and Material for Full-scale Test Track. J. Highw. Transp. Res. Dev. 2017, 34, 30–37. [Google Scholar]
- Song, H. Application Handbook of Field Test Methods of Subgrade and Pavement for Highway Engineering; People’s Communications Press: Beijing, China, 2008; p. 181. [Google Scholar]
- Hongzhou, Z.; Yiyuan, L. Present situations of research on anti-skid property of asphalt pavement. Highway 2018, 1, 35–46. [Google Scholar]
- Song, H.; Jinzhi, Q. Research on temperature affected sideway force coefficient. J. Highw. Transp. Res. Dev. 2005, 12, 32–34. [Google Scholar]
- Ministry of Transport of the People’s Republic of China. Specifications for Design of Highway Asphalt Pavement; JTG D50-2017; People’s Communications Press: Beijing, China, 2017.
© 2020 by the authors. Licensee MDPI, Basel, Switzerland. This article is an open access article distributed under the terms and conditions of the Creative Commons Attribution (CC BY) license (http://creativecommons.org/licenses/by/4.0/).