Article

Performance Optimization of Original Aluminum Ash Coating

1
School of Mechanical Engineering, Nantong University, Nantong 226019, China
2
Faculty of Engineering, Tokushima University, Tokushima 770-8506, Japan
*
Author to whom correspondence should be addressed.
Coatings 2020, 10(9), 831; https://doi.org/10.3390/coatings10090831
Submission received: 9 August 2020 / Revised: 21 August 2020 / Accepted: 26 August 2020 / Published: 27 August 2020
(This article belongs to the Special Issue Thin Films and Coatings for Energy Application)

Abstract

:
Aluminum ash is a kind of industrial solid waste. Original aluminum ash (OAA) can be prepared into original aluminum ash spray powder (OAASP) through hydrolysis treatment, and the original aluminum ash coating (OAAC) can be prepared on the surface of the substrate by plasma spraying. In order to optimize the performance of the OAAC, the OAASP was screened to select the appropriate particle size to improve the flowability of the powder. Then, the influence of the alumina content on coating performance was studied through comparative experiments. The micro morphology of the coating was analyzed, and the performance parameters of the coating were tested. The results show that the spray powder with a particle size of 120–150 mesh accounts for the largest proportion of OAASP, and its flowability is better than that of unsieved OAASP, which is suitable for coating preparation. The performance of the coating can be improved by adding high-purity alumina. When the Al2O3 addition is 50%, the porosity of the coating is 0.131%, the adhesive strength is 17.12 MPa, the microhardness is 713.36 HV, and the abrasion rate 10.31 mg/min. Compared with the coating without Al2O3, the porosity is decreased by 19.63%, the adhesive strength is increased by 5.35%, the microhardness is increased by 17.61%, and the abrasion rate is decreased by 19.83%. There are regions with different brightness on the surface of the coating with Al2O3. After semiquantitative analysis, the main phase in the bright region is Al2O3, and the main phases in the dark and gray regions are Al2O3, SiO2, and Fe3O4. The performance of the OAAC can be optimized by improving the flowability of the sprayed powder and increasing the alumina content.

1. Introduction

Currently, with the lack of resources and serious environmental pollution, the aluminum industry is facing dual pressures from resources and the environment [1,2], and it is particularly important to improve the comprehensive utilization efficiency of aluminum ash. According to the data released by Chinalco.com, China’s primary aluminum output is 31.41 million tons, aluminum material 52.36 million tons, and alumina output 58.98 million tons. According to statistics, in the entire process of processing and application, one ton of aluminum will produce 180–290 kg of aluminum ash [3,4]. At present, the use of aluminum ash is basically to recover the metal aluminum in it. Most of the residual ash after the extraction of metal aluminum is directly stored or landfilled, and a small part is used to make fillers for construction materials [5,6,7]. When being landfilled, about 95% of the aluminum ash has not been harmlessly treated, which will cause toxic metal ions to flow into the groundwater and cause serious environmental pollution [8]. Some valuable components in aluminum ash have not been recovered, resulting in the waste of resources, such as Al, Al2O3, AlN, etc. [9]. The reaction of aluminum ash with water can also produce toxic gases such as ammonia, methane, phosphine, and hydrogen sulfide, which seriously pollute the environment.
Aluminum ash, also known as aluminum slag, is a kind of scum produced in the industrial production of primary and secondary aluminum, including two main forms: original aluminum ash (OAA) and ultimate aluminum ash (UAA) [10]. OAA is also called white aluminum ash due to its off-white color. The main components are metallic aluminum and aluminum oxide, and the aluminum content can reach 30% to 70%. The composition of UAA is relatively complex, mainly containing a small amount of aluminum, salt flux, oxide and other black aluminum ash and aluminum scrap [11]. Because OAA contains more metal aluminum, the overall performance of OAA is higher than that of UAA. Currently, the shortage of energy and materials has become a worldwide problem, how to turn aluminum ash into treasure is very important [12,13,14]. With the strengthening of environmental protection efforts, companies have gradually begun to attach importance to this abandoned resource. After unremitting exploration by experts and scholars, they have gradually mastered the process of using aluminum ash to prepare refractory materials [15,16], steelmaking deoxidizers [17,18], inorganic flocculants [19,20,21], chemical raw materials [22,23,24], and building materials [25,26]. However, in the process of producing the above-mentioned products, it is easy to cause secondary pollution, and the product quality is low and cannot be widely promoted and applied, resulting in the cumulative amount of aluminum ash still increasing year by year. Therefore, it is urgent to find a new process for the application of aluminum ash.
Plasma spray technology has the advantage of processing various low-grade minerals and wastes to obtain value-added products. We tried to use aluminum ash as the spray powder, and the aluminum ash coating was prepared on the surface of 45 steel based on atmospheric plasma spraying technology to repair or strengthen the performance of the 45 steel substrates. We published the method and principle of using OAA to prepare coating in the journal of Coatings [27]. This manuscript will not elaborate on this but will focus on the performance optimization experiments of coatings.
In reference [27], we prepare OAA into OAASP by hydrolysis, grinding, and granulation, and use plasma spray equipment to make coatings on 45 steel substrates. Through the microstructure analysis and indicators test of the coating, it is verified that the coating prepared by OAA displays a significant performance. In addition, we also discussed the influence of spraying process parameters on coating performance, and the most suitable spraying process parameters for OAASP were determined through orthogonal experiments. Based on the above research, this article will study the influence of powder flowability and high-purity alumina on the coating performance under the optimal spraying process parameters.
In this article, OAA was used as a raw material, and an aluminum ash coating was prepared on the surface of 45 steel based on atmospheric plasma spraying technology. Then, we studied the effects of spray powder particle size on the flowability of OAASP, and preferred spray powder with better flowability. Different proportions of Al2O3 were added to OAASP to prepare coatings, and the performance parameters of the coatings were tested under different experimental conditions. By optimizing the flowability of OAASP and the content of Al2O3, the overall performance of OAAC was improved.

2. Materials and Methods

2.1. Main Materials

The main material used in the experiment is original aluminum ash, and its chemical composition is shown in Table 1. The main elements in the original aluminum ash are Al, Fe, and Si, among which Al has the most content, accounting for 61.802%. In addition, the original aluminum ash contains multiple trace elements such as Zn, Mn, and Ti.
Due to the fact that 45 steel is a high-quality carbon structural steel with high strength and plasticity, it was selected as the substrate material. Table 2 shows the chemical composition of the 45 steel used in the experiment, with a carbon content of 0.45%. The size of 45 steel used as the substrate for spraying was 20 × 20 × 10 mm3.

2.2. Equipment and Testing Methods

2.2.1. Experiment Equipment

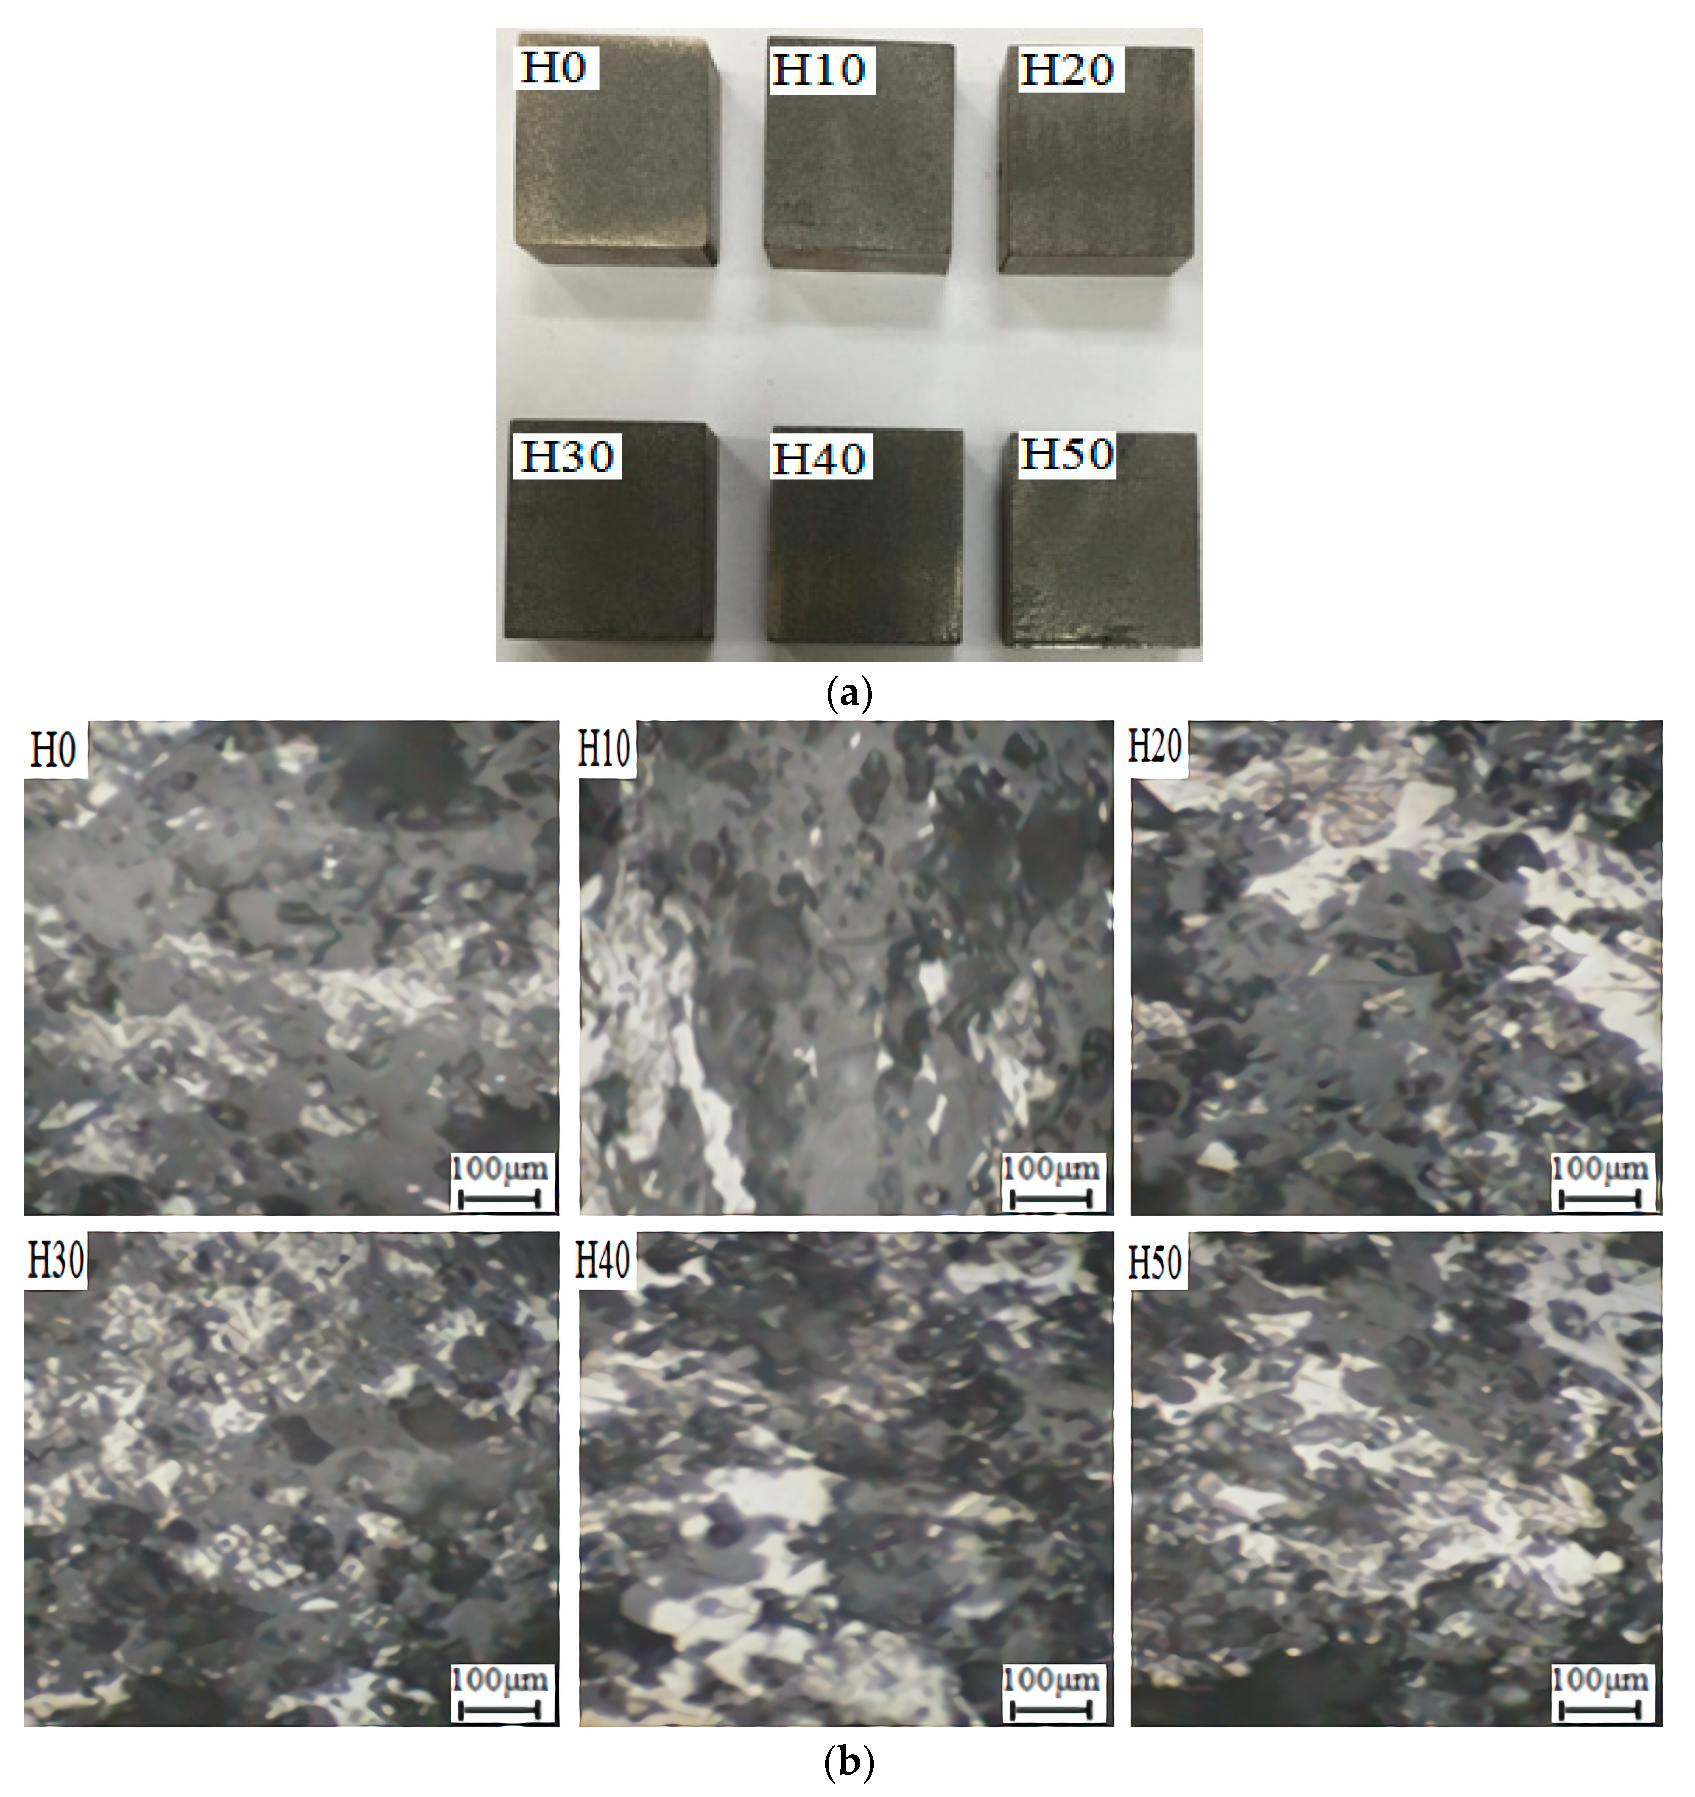
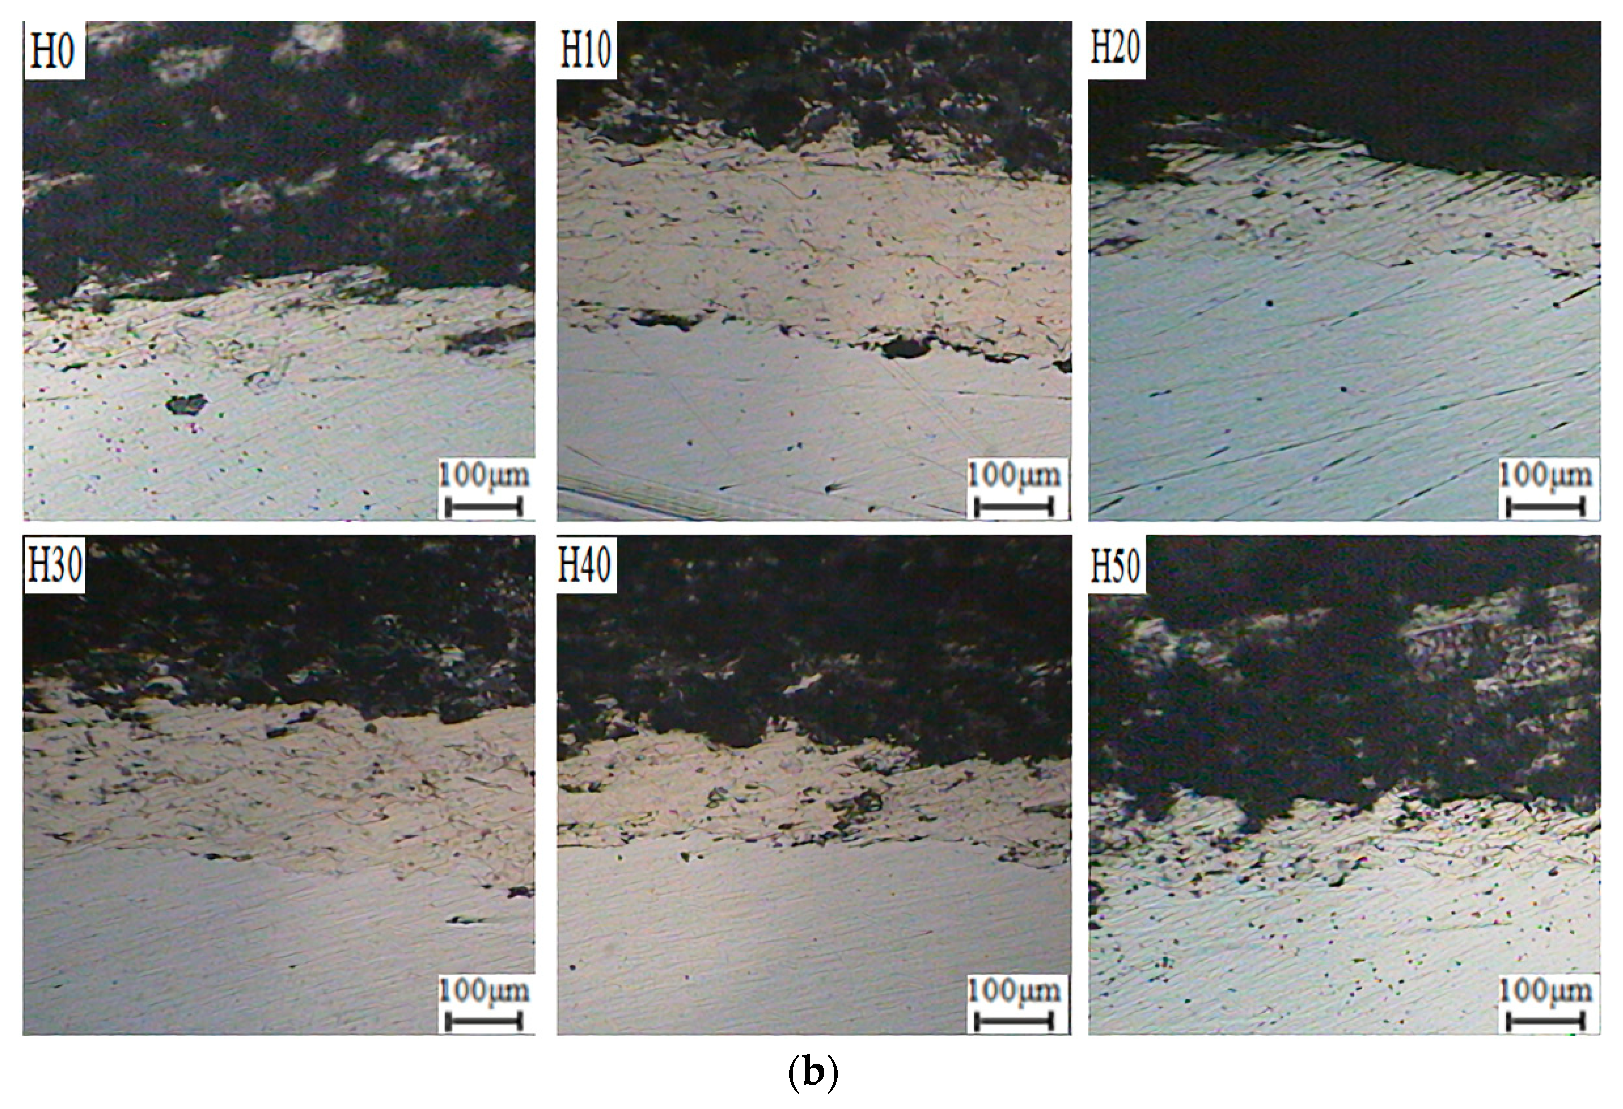
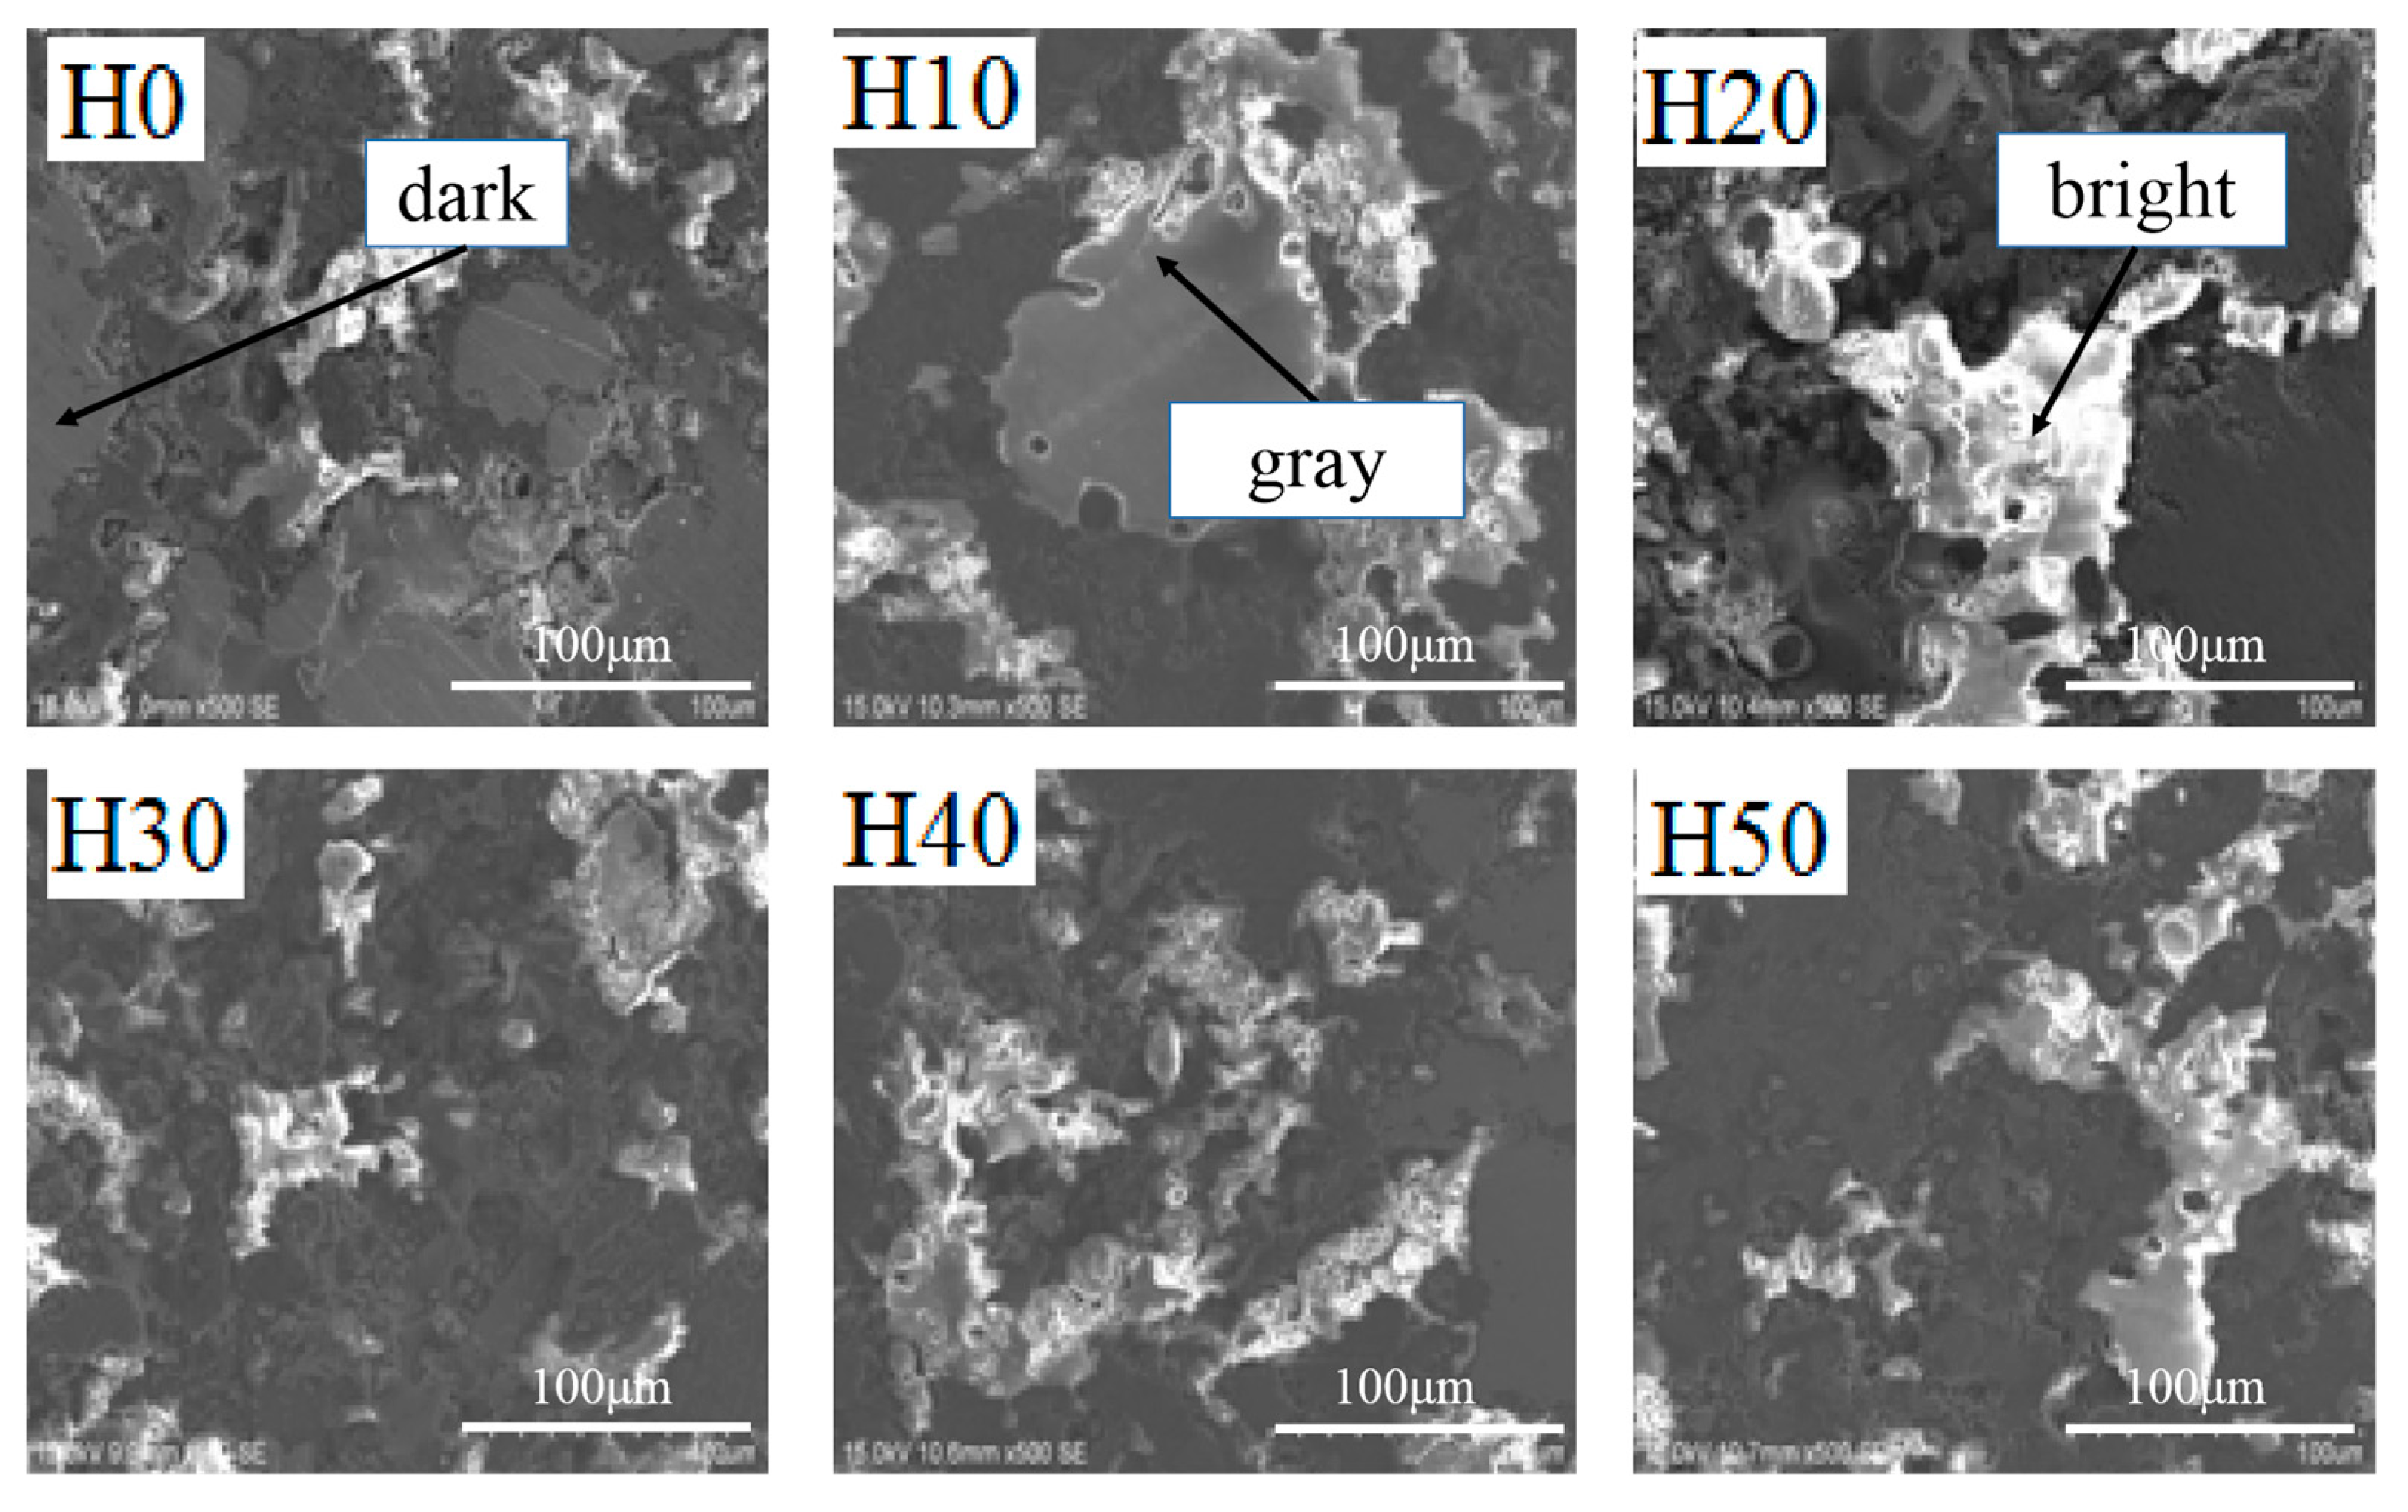
An atmospheric plasma spray equipment was used to prepare coatings on the surface of 45 steel substrates. The type of the spray equipment is FH-80, produced by Fahan Spraying Machinery Co., Ltd. (Shanghai, China). Scanning electron microscope (SEM, the S-3400 type, produced by Hitachi, Ltd., Tokyo, Japan) was used to observe the micro morphology of OAASP with different particle sizes. The surface and cross-section of the samples were polished. Then, the coating surface and cross-section morphology were observed with a metallurgical microscope (BX12C type, Shanghai Shuangxu Electronics Co., Ltd., Shanghai, China).
The X-ray diffraction (XRD, D/Max 2500PC Rigaku, Japan Science and Technology Co., Ltd., Tokyo, Japan) was used to analyze the phase and chemical composition of the coating. The Kα rays of Cu were selected, the tube voltage was 40 kV, and the tube current was 100 mA. The θ~2θ step scanning method was adopted, the step length was 0.02° (2θ), and the scanning speed was 2°~4°/min.
The Energy Dispersive Spectrometer (EDS, the Quantax75 type, produced by Japan Hitachi, Ltd., Hitachi, Japan) was used to analyze the types and contents of elements in different brightness regions of the coating. Each element has its own characteristic X-ray wavelength, and the size of the characteristic wavelength depends on the characteristic energy released during the energy level transition. The EDS used the characteristic energy of different X-ray photons of the element to perform component analysis.

2.2.2. Testing Methods

The performance of the coating was evaluated by porosity, adhesive strength, microhardness, and abrasion rate, and the angle of repose was used to evaluate the flowability of the powder.
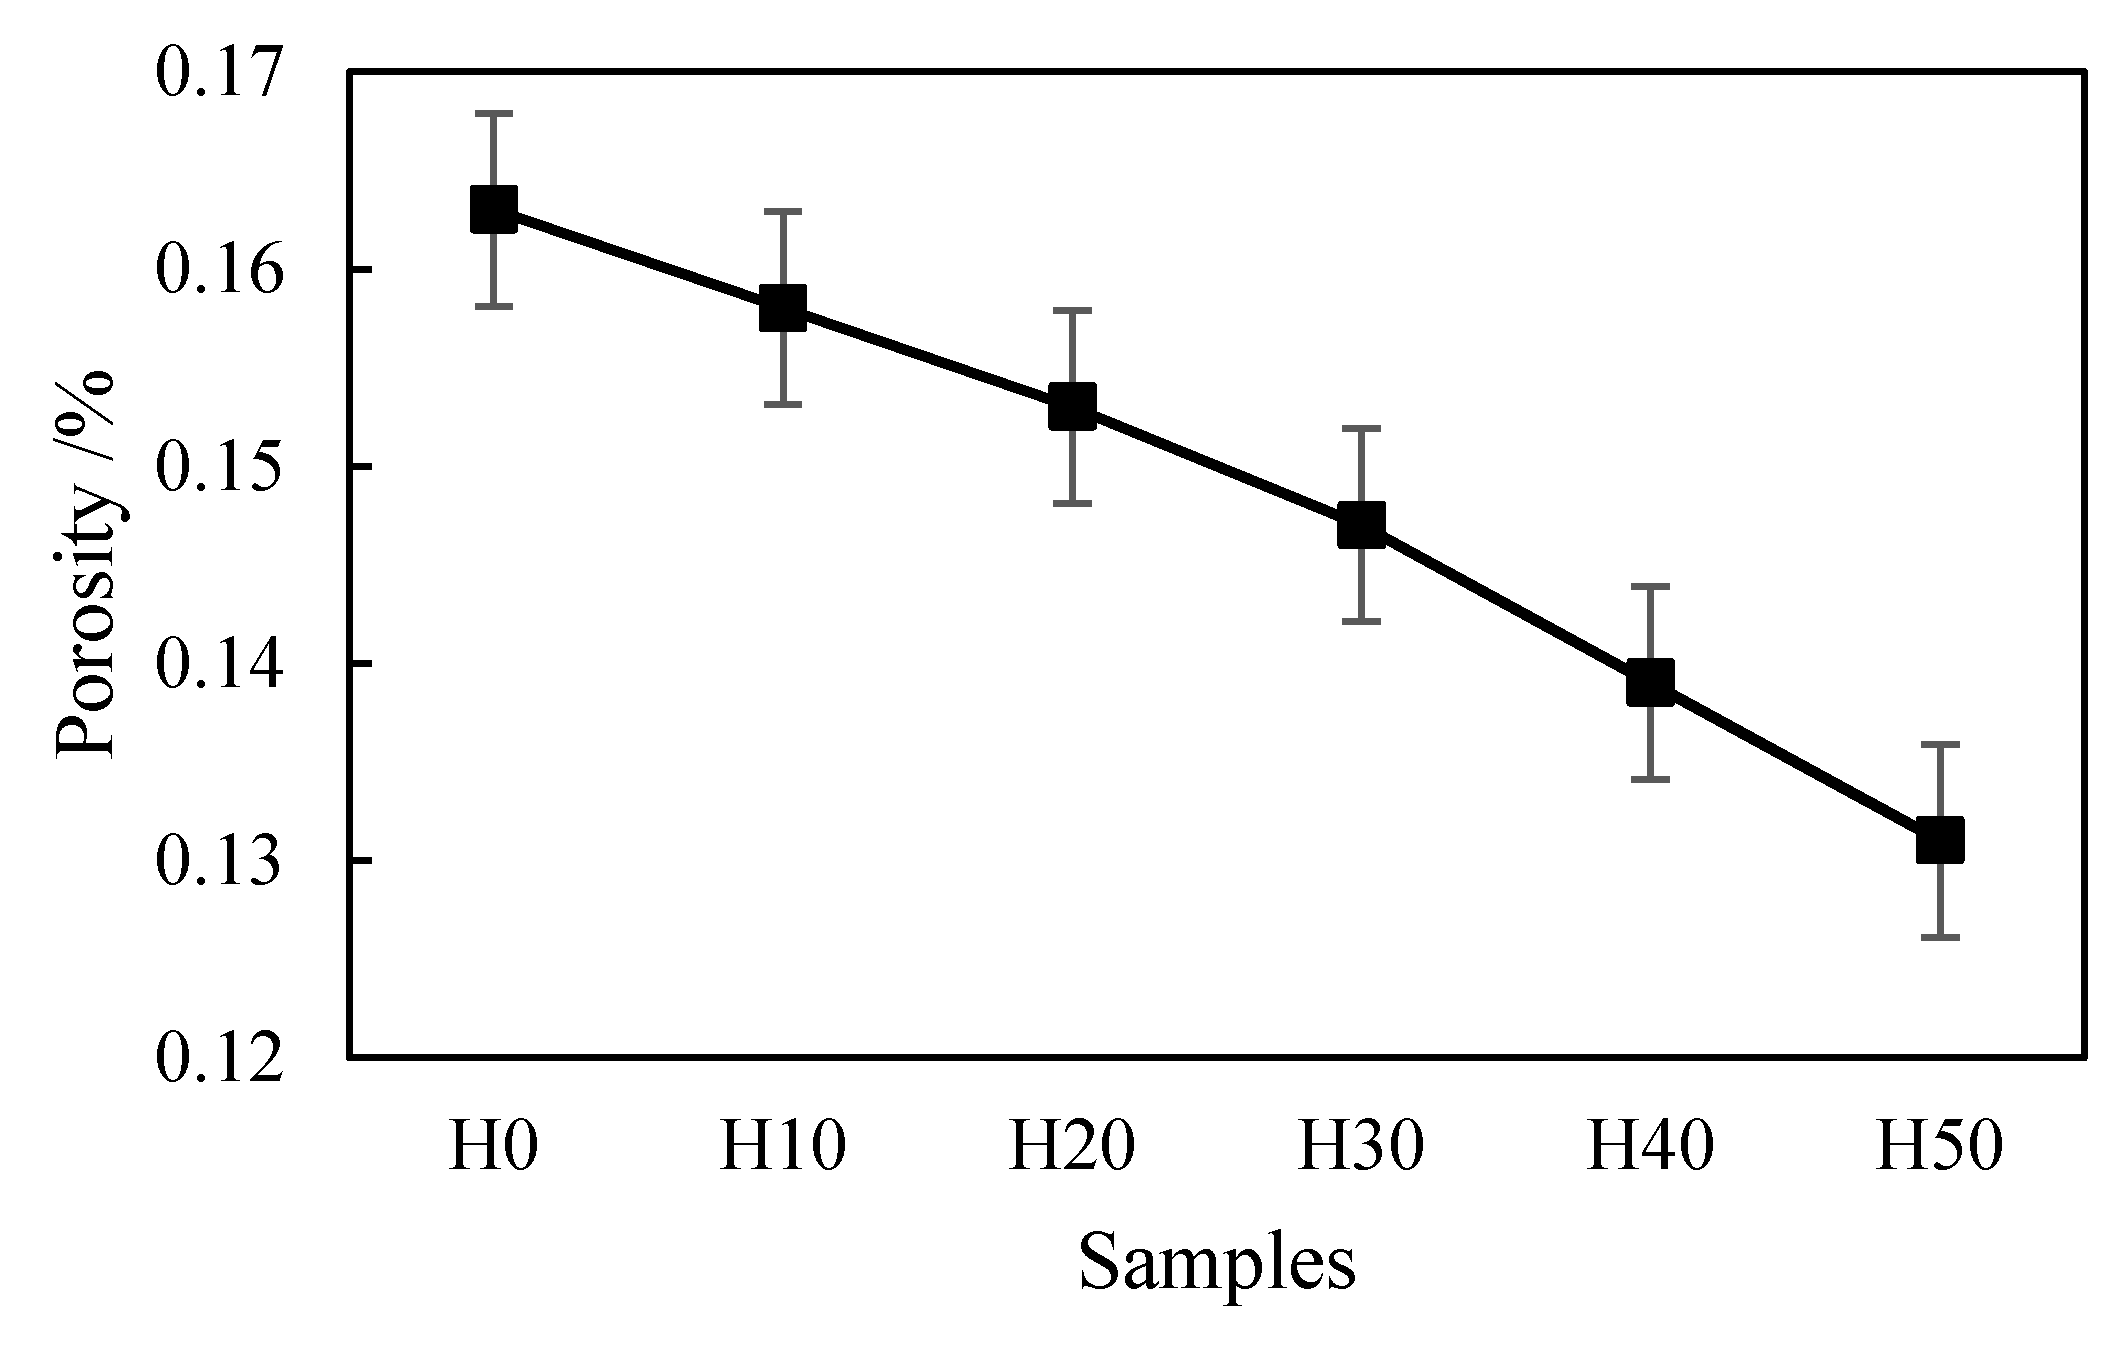
Thermal spray coating is a layered structure formed by the stacking of molten particles, and there must be pores between different droplets. For applications with high temperature resistance and wear resistance, the fewer pores in the coating, the better the performance. The quantitative index of pores is porosity. In our experiment, the porosity was measured by Archimedes drainage method, and the calculation formula was (m2m0)/m1. Where m0 refers to the weight of the dried coating. Then, the dry coating was put into distilled water to obtain the mass of the discharged water m1. Furthermore, the test piece was removed from the water and weighed to obtain the mass m2. Finally, the porosity of the coating could be obtained by the above formula.
Adhesive strength is an important quantitative index for evaluating the quality of plasma sprayed coatings, and it reflects the mechanical combine ability between the bonding layer and the OAAC. With reference to the Chinese national standard of GB/T 8642-2002 “Thermal Spraying-Determination of Tensile Adhesive Strength” [28], the tensile method was used to measure the adhesive strength. The used equipment was a universal mechanical testing machine, CMT5105 type, produced by MTS Industrial Systems Co., Ltd. (Shenzhen, China). The thickness of the coating sample used to measure the adhesive strength was about 0.5 mm, and the roughness was ≤3.2 μm after being polished. After the surface of the coating was cleaned and dried, the coating and the counterpart were glued through the epoxy resin glue. Then, the prepared sample was placed in an oven at 100~120 °C to dry. When conducting the tensile test, the tensile speed was less than 160 N/s. The formula for calculating the adhesive strength of the coating was σb = F/A. In the formula, σb is the adhesive strength of the coating, N/mm2; F is the maximum load of the sample to break, N; and A is the area of the coating sample, mm2.
Wear resistance is an important indicator to measure the quality of the coating. The better the wear resistance, the longer the service life of the coating. The abrasion rate was measured by a ring three-body wear tester, MMH-5 type, produced by Hansen Precision Instrument Co., Ltd. (Jinan, China). First, the sample was clamped on the mold. Then, we added a gravity block to the mold to adjust the pressure. The weight of the block could press the sample on the sandpaper to ensure that the coating was in contact with the sandpaper and the pressure was constant. After the power was turned on, the mold rotated, and the sample slid with the sandpaper, causing friction and wear. In addition, 80 mesh alumina sandpaper was selected as the sandpaper. Then, the sample was cleaned and dried. The FA-2004N electronic balance (produced by Grand Instrument and Equipment Co., Ltd., Shanghai, China) was used for weight measurement, and the average weight loss was calculated by multiple measurements. If the weight of the sample before abrasion is m1 and the weight after abrasion is m2, the calculation formula of the abrasion rate can be obtained by (m1m2)/t, where t is the abrasion time.
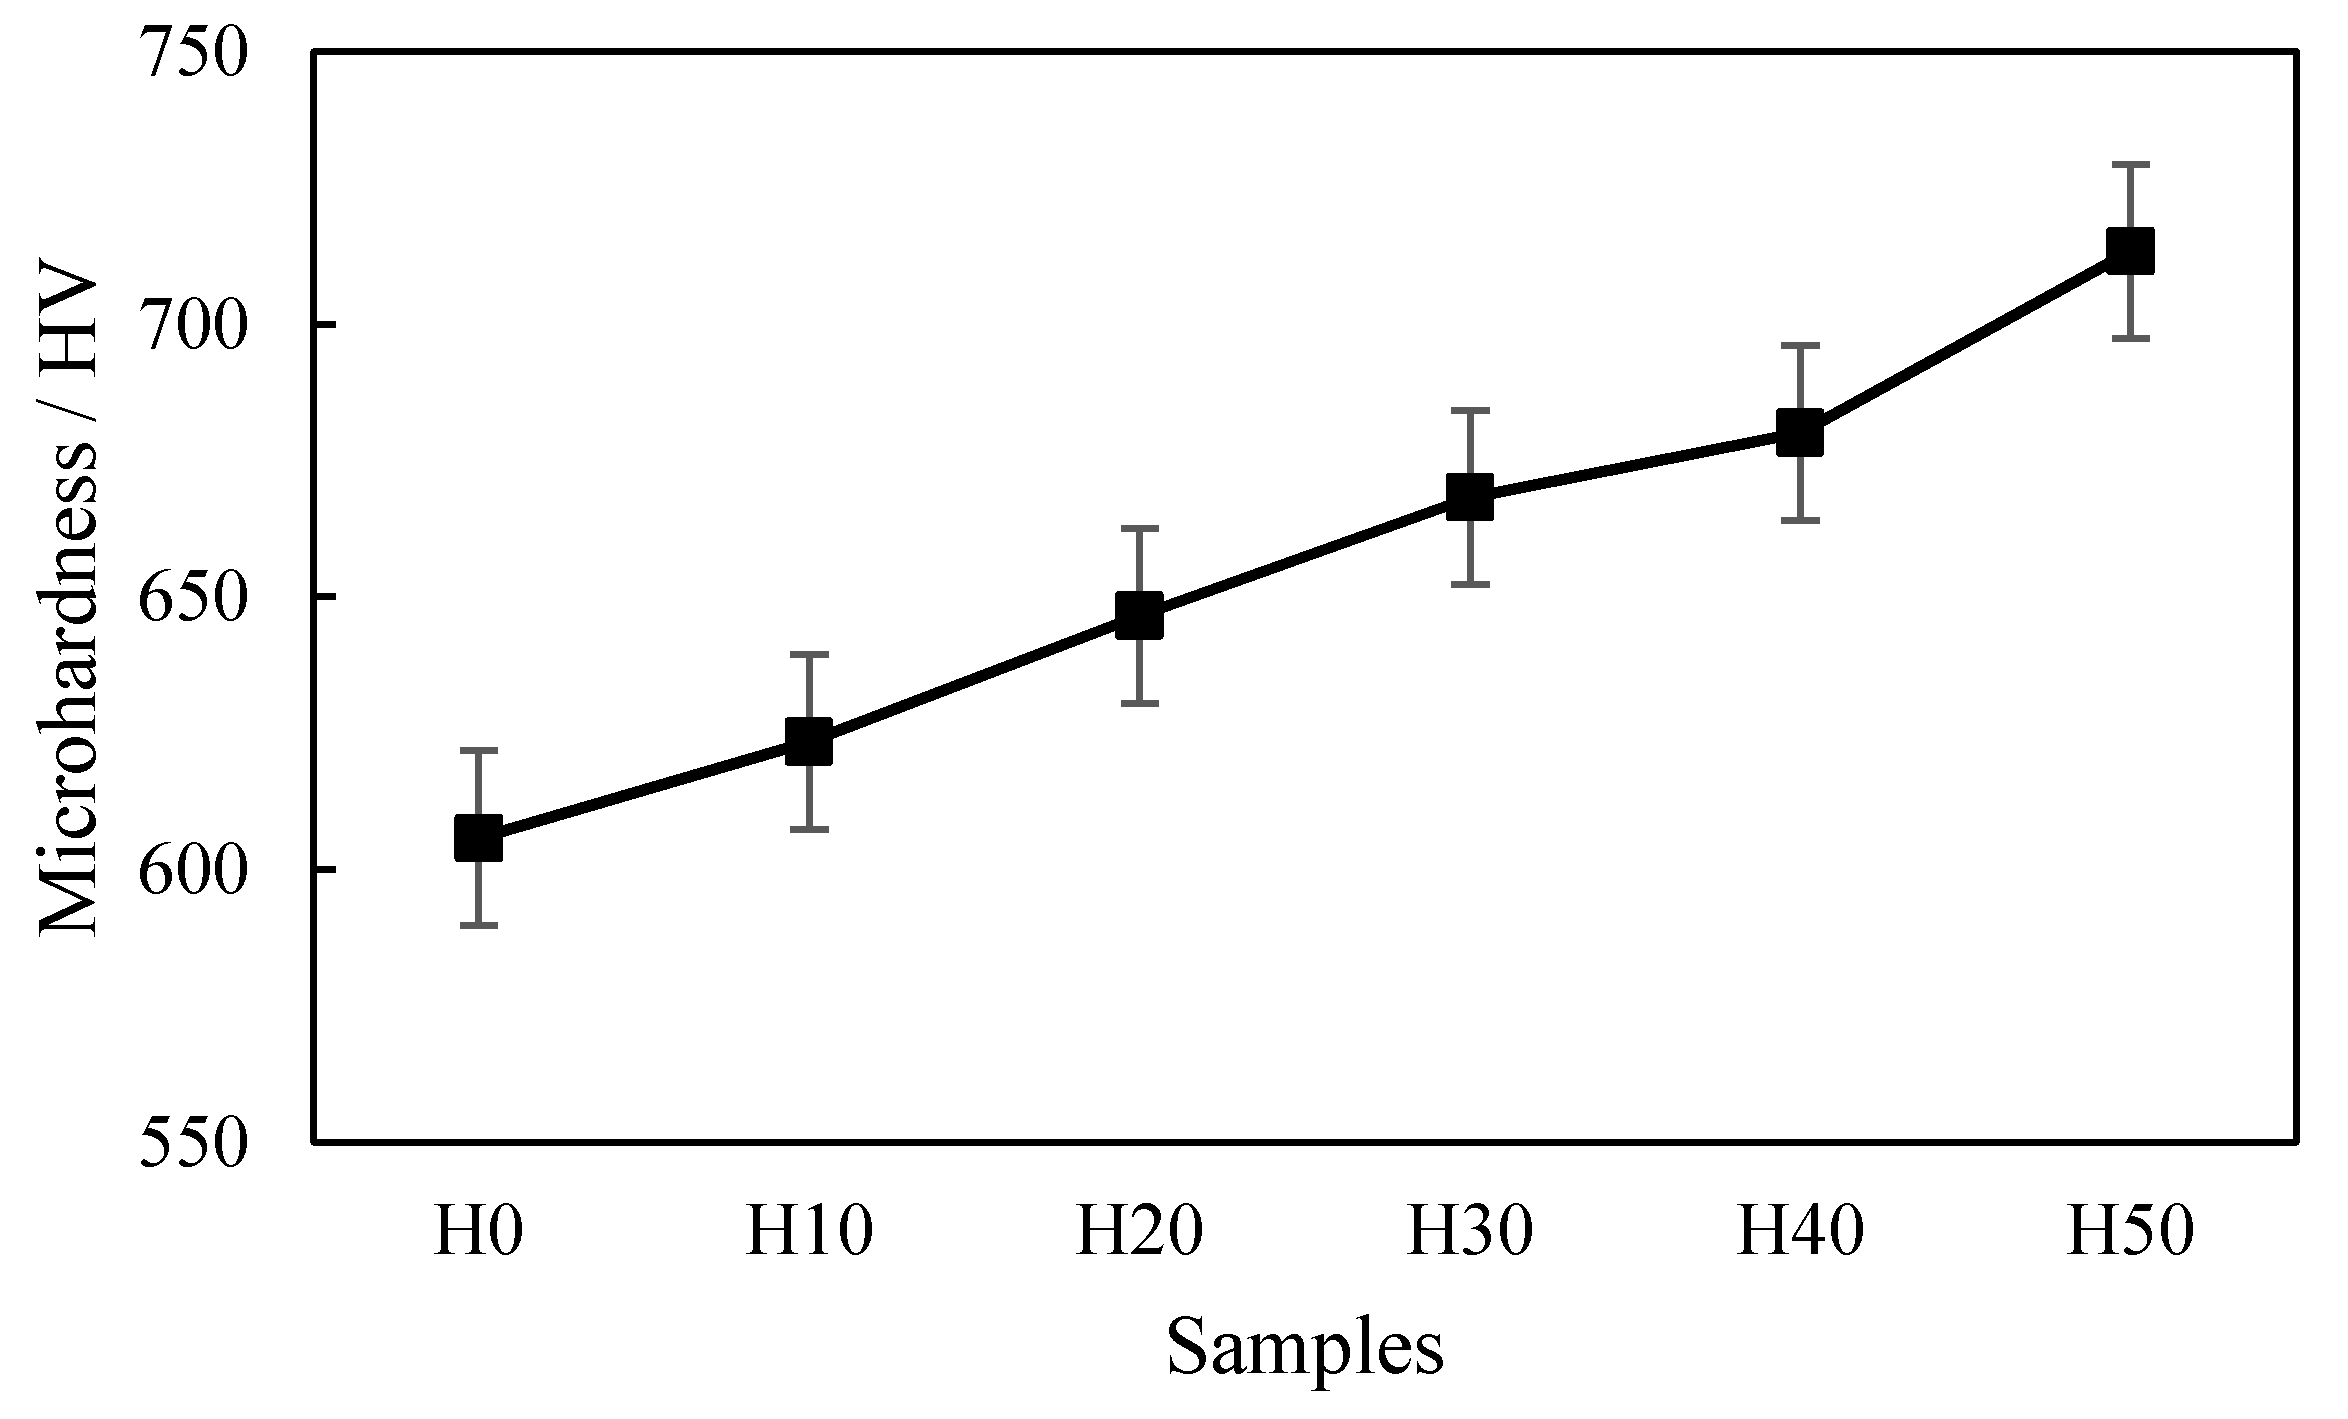
According to Chinese national standard GB 4342-84 [29], the Vickers hardness was used to measure the microhardness of the coating. The TMV-1 digital micro Vickers hardness tester (produced by Time Group Inc., Beijing, China) was used to measure the microhardness of the coating section. The principle was to calculate the Vickers hardness according to the diagonal length of the indentation, through the formula HV = 1.8544 × F/(d2). In the formula, HV is the Vickers microhardness of the coating, MPa; F is the force, N; and d is the diagonal length of the indentation, mm. Then 10 relatively smooth areas selected on the surface of the coating were tested, and the results were averaged.
The angle of repose is the maximum angle formed by the free slope of the powder accumulation layer and the horizontal plane. The angle of repose can not only be measured directly but also can be obtained by calculation. The calculation formula was tan θ = h/r. In the formula, θ is the angle of repose, °; h is the height of the powder layer, mm; and r is the radius of the circle, mm. The smaller the angle of repose, the smaller the friction, and the better the flowability of the powder. It is generally believed that θ ≤ 40° can meet the needs of production flowability.

3. Optimization of Flowability of Original Aluminum Ash Spray Powder

3.1. Particle Size Distribution of OAASP

According to the reference [27], the aluminum ash is made into OAASP through hydrolysis and ball milling methods. However, the particle size distribution of the powder particles after ball milling is not uniform, which affects the powder flowability. Particle size refers to the size of powder particles. The powder after ball milling is a sphere, thus the particle size is expressed as the diameter of the sphere. Compared with high-purity alumina powder, the flowability of OAASP still has much room for improvement. In the granulation process of OAASP, only a 100-mesh sieve was used for preliminary screening the particles without subdividing, resulting in the uneven particle size distribution of OAASP. Therefore, we could use standard sieves with different meshes to subdivide the particle size to improve the flowability of OAASP.
Standard sieves with different mesh numbers were used to classify OAASP. According to the particle size of OAASP, they were divided into 100 to 120 mesh, 120 to 150 mesh, 150 to 200 mesh, and more than 200 mesh. We weighed the sieved powder and calculated the mass percentage of the powder with different particle sizes. Figure 1 shows the particle size distribution of OAASP. Powders with particle sizes ranging from 100 to 120 mesh accounted for the smallest proportion—6.45%, and those with particle sizes ranging from 120 to 150 mesh accounted for the largest proportion—46.94% of the total. It can be seen that the main particle size distribution range of OAASP was 120–150 mesh.

3.2. Microstructure of OAASP with Different Particle Sizes

The SEM was used to observe the micro morphology of OAASP with different particle sizes. Figure 2 and Figure 3 are SEM images magnified 1000 and 5000 times, respectively. We can see that under the same magnification, the size of the powder particles in the range of different meshes varied greatly. The shape of the powder particles after sieving was more regular, which was close to spherical.

3.3. Composition of OAASP with Different Particle Sizes

The components of OAASP with different particle sizes were measured by XRD, and the results are shown in Figure 4. The main phases were Al, Al2O3, AlN, and SiO2, etc., which were basically the same as the unscreened OAASP phases. In addition, the phase of OAASP with different particle sizes did not change with the particle size.

3.4. The Flowability of OAASP with Different Particle Sizes

The angle of repose of OAASP with different particle sizes was measured by the angle of repose tester, and the flowability was analyzed. The result is shown in Figure 5. After the OAASP was sieved, the angles of repose of powders with different particle sizes were all lower than the unsieved OAASP. Since the flowability of the powder was inversely proportional to the angle of repose, the method of particle size screening could improve the flowability of OAASP. It can be seen from Figure 5 that the angle of repose of the 120–150 mesh which accounted for the largest proportion was 28.72°. Therefore, based on the OAASP particle size distribution and its flowability, OAASP with 120–150 meshes was preferred as the spray powder.

4. Optimization of Alumina Content of OAASP

4.1. The Preparation Process of Original Aluminum Ash Coating (OAAC) with Different Proportions of Al2O3

According to the results of flowability optimization experiments, OAASP with better flowability of 120–150 mesh was preferred as the raw material. Then, the OAASP and alumina powder (−45–+15 μm) were mixed in different proportions and mechanically stirred. Finally, the prepared powder was dried and made into samples. The preferred process parameters in reference [27] were used for spraying; that is, the spray current was 600 A, the spray voltage was 60 V, the main gas flow was 33 slpm, and the powder flow rate was 22 g/min. The process flow for preparing OAAC is shown in Figure 6.

4.2. Preparation of Spraying Powder with Different Proportions of Al2O3

Considering the cost of spray powder, 0–50% high-purity alumina was added as a modifier to improve the performance of OAAC. The specific formulation of spray powder is shown in Table 3.

4.3. The Flowability of Spray Powder with Different Proportions of Al2O3

The angle of repose of the spray powder with different proportions of Al2O3 was tested, and the test results are shown in Figure 7. With the increase in alumina content, the angle of repose of the powder decreased and the flowability improved. Therefore, by selecting 120–150 mesh OAASP and adding different proportions of Al2O3, the flowability of the spray powder could be improved.

4.4. Microstructure and Performance Analysis of OAAC with Different Proportions of Al2O3

4.4.1. Microstructure of OAAC

The OAAC with different proportions of Al2O3 was polished, and the surface of the coating and the cross-section morphology of the samples was observed through a metallographic microscope, as shown in Figure 8 and Figure 9. Similar to OAAC [27], there were areas with different brightness on the coating surface. The prepared coating had a certain thickness and could protect the substrate. The cross-section of the sample had obvious delamination. The upper layer was the coating formed by OAASP, the middle layer was the transition layer, and the lower layer was the 45 steel substrate.
There were many pits on the surface of the coating, and the roughness of coating was relatively large. The surface morphology of the coating was observed by SEM, which is shown in Figure 10. Figure 10 represents the SEM images magnified 500 times. Similar to OAAC [27], there were different regions on the surface, namely a bright region, gray region, and dark region.

4.4.2. The Composition of Coatings with Different Proportions of Al2O3

The EDS analysis was performed on OAAC with different proportions of Al2O3, and the results are shown in Table 4. According to the main chemical composition, we can speculate that the main phase in the bright regions wasAl2O3, and the main phases in the gray and dark regions were Al2O3, SiO2, and Fe3O4. Compared with the OAAC, the phase change of the coating after adding different proportions of alumina was not much.
As shown in Figure 11, different proportions of alumina were added to the 120–150 mesh OAASP, and the coating phases prepared by using the mixed powder were consistent, which is similar to the experimental results of OAAC in reference [27]. The main phases in the coating were Al, Al2O3, AlN, etc. Among them, Al2O3 had three phases: α, γ, and δ. α-Al2O3 was the most stable form of Al2O3 crystal morphology. γ-Al2O3 and δ-Al2O3 could be transformed into α-Al2O3 at a high temperature. It can be inferred that no new phases were formed when the aluminum ash coating was prepared by high temperature and low-pressure plasma. Even if a new phase is formed, its content is so low that XRD cannot analyze the phase, such as Zn, Mn, Ti, and other trace elements in aluminum ash. Since the XRD phase analysis is semiquantitative, phases with a lower content cannot be analyzed.

4.4.3. The Performance of Coatings with Different Proportions of Al2O3

The Archimedes drainage method was used to test the porosity of aluminum ash coatings with different proportions of Al2O3. The test results are shown in Table 5. H0 was a coating prepared by 120–150 mesh OAASP without Al2O3, and its porosity was 0.16%. As the content of high-purity alumina increased, the porosity of the coating decreased linearly, and the coating gradually became dense, as shown in Figure 12. After adding alumina, the average porosity of the coating was 0.15%, and the compactness of the coating was better than H0.
The adhesive strength of aluminum ash coatings with different proportions of Al2O3 was tested by a universal testing machine, and the results are shown in Figure 13. With the increase in high purity alumina, the adhesive strength of the coating showed a linear increase trend. When the increase in alumina was 50%, the adhesive strength of the coating was 17.12 MPa, which was higher than the OAAC under the preferred spraying process, but slightly lower than the conventional alumina ceramic coating.
A Vickers hardness tester was used to measure the microhardness of the aluminum ash coatings with different proportions of Al2O3. Ten relatively smooth regions on the coating surface were selected for hardness testing, and the average value was calculated. The average Vickers microhardness of aluminum ash coatings with different proportions of Al2O3 were plotted as a line chart, as shown in Figure 14. As the content of high purity alumina increased, the microhardness of the coating showed a linear increase trend. When the alumina content was 50%, the microhardness of the coating was 713.36 HV, which was 17% higher than H0 and 141% higher than the base material of 45 steel. Therefore, the addition of high-purity alumina can significantly increase the microhardness of the coating.
The aluminum ash coating samples with different proportions of Al2O3 were cleaned, and the experimental results are shown in Table 6 and Figure 15. As the content of high-purity alumina increased, the abrasion rate of the coating decreased, which indicated that the compactness of the coating increased. When the high-purity alumina was added at 50%, the abrasion rate was 10.31 × 10⁻³ g/min. Compared with H0, the abrasion rate of H50 was reduced by 19.83%.

4.4.4. Discussion

Porosity, adhesive strength, microhardness, and abrasion rate were selected as indicators for evaluating coating performance. The results are shown in Table 5. In the Table 7, H100 is high-purity alumina ceramic coating. It can be seen that with the increase in high-purity alumina, the above-mentioned four indicators of the coating prepared by aluminum ash have a certain degree of improvement. When the Al2O3 addition amount was 50%, the porosity of the coating was 0.131%, the adhesive strength was 17.12 MPa, the microhardness was 713.36 HV, and the abrasion rate 10.31 × 10⁻³ g/min. Compared with H0 coating, the porosity decreased by 19.63%, the adhesive strength increased by 5.35%, the microhardness increased by 17.61%, and the abrasion rate decreased by 19.83%. However, the performance of the coating after adding Al2O3 was lower than that of the high-purity alumina ceramic coating. It can be inferred that the content of alumina in the coating has a decisive effect on its performance. With the addition of Al2O3, the overall performance of the coating was significantly improved.

5. Conclusions

  • Through the particle size screening of OAASP, the powder in the range of 120–150 mesh was selected as the spray material. After mixing it with standard alumina powder (−45–+15 μm) particle size and regranulation, the flowability of the powder was improved.
  • With the addition of high-purity alumina, the overall performance of the aluminum ash coating was improved to varying degrees. Considering the cost and other factors, the amount of Al2O3 added was 50%. In this case, the porosity of the coating was 0.131%, the adhesive strength was 17.12 MPa, the microhardness was 713.36 HV, and the abrasion rate 10.31 × 10⁻³ g/min. Compared with the coating without Al2O3, the porosity decreased by 19.63%, the adhesive strength increased by 5.35%, the microhardness increased by 17.61%, and the abrasion rate decreased by 19.83%.
  • The aluminum ash coatings with different proportions of Al2O3 have different brightness regions on the surface. According to semiquantitative analysis by EDS and XRD, the main phase in the bright region was Al2O3, and the main phases in the dark and gray regions were Al2O3, SiO2, and Fe3O4.
  • The content of alumina in the coating has a decisive effect on its performance. Therefore, in order to improve the quality of the coating, on the one hand, the spray powder can be purified to increase the alumina content. On the other hand, an appropriate amount of alumina can be added to increase the alumina content.

Author Contributions

Conceptualization, H.N. and T.G.; methodology, S.L.; validation, J.Z.; formal analysis, H.N. and S.L.; investigation, J.Z. and X.W.; resources, H.N.; writing—original draft, J.Z.; writing—review and editing, H.N.; visualization, J.Z.; supervision, H.N. All authors have read and agreed to the published version of the manuscript.

Funding

This research was supported by A Priority Academic Program Development of Jiangsu Higher Education Institutions (PAPD); Nantong Applied Research Project, grant number JC2018115 and JC2019129; Ministry of Education’s Cooperative Education Project, grant number 201901189019.

Conflicts of Interest

The authors declare no conflict of interest.

References

  1. Das, S.K.; Green, J.A.S. Aluminum industry and climate change—Assessment and responses. JOM 2010, 62, 27–31. [Google Scholar] [CrossRef]
  2. Chen, W.Q.; Wan, H.Y.; Wu, J.N. Life cycle assessment of aluminum and the environmental impacts of aluminum industry. Light Met. 2009, 5, 3–10. [Google Scholar]
  3. Zhang, H.; Zhang, X.; Zhao, X.; Tang, Y.; Zuo, Y. Preparation of Ti–Zr-based conversion coating on 5052 aluminum alloy, and its corrosion resistance and antifouling performance. Coatings 2018, 8, 397. [Google Scholar] [CrossRef] [Green Version]
  4. Wu, C.Y.; Yu, H.F.; Zhang, H.F. Extraction of aluminum by pressure acid-leaching method from coal fly ash. Trans. Nonferrous Met. Soc. China 2012, 22, 2282–2288. [Google Scholar] [CrossRef]
  5. Aubert, J.E.; Husson, B.; Vaquier, A. Metallic aluminum in MSWI fly ash: Quantification and influence on the properties of cement-based products. Waste Manag. 2004, 24, 589–596. [Google Scholar] [CrossRef]
  6. Kuroki, S.; Hashishin, T.; Morikawa, T. Selective synthesis of zeolites A and X from two industrial wastes: Crushed stone powder and aluminum ash. J. Environ. Manag. 2019, 231, 749–756. [Google Scholar] [CrossRef]
  7. Luo, H.; Hsiao, D.H.; Lin, D. Cohesive soil stabilized using sewage sludge ash/cement and nano aluminum oxide. Int. J. Transp. Sci. Technol. 2012, 1, 83–99. [Google Scholar] [CrossRef] [Green Version]
  8. Amarine, M.; Lekhlif, B.; Sinan, M. Treatment of nitrate-rich groundwater using electrocoagulation with aluminum anodes. Groundw. Sustain. Dev. 2020, 100371. [Google Scholar] [CrossRef]
  9. Jing, G. Recycling and utilization of the electrolytic aluminium ash and slag. Mater. Rev. 2013, 27, 285–289. [Google Scholar]
  10. Shuaishuai, L.; Jiaqiao, Z.; Hongjun, N.; Xingxing, W.; Yu, Z.; Tao, G. Study on preparation of aluminum ash coating based on plasma spray. Appl. Sci. 2019, 9, 4980. [Google Scholar]
  11. Li, B.H.; Deng, Z.Y.; Wang, W.X.; Fang, H.S.; Zhou, H.B.; Deng, F.X.; Huang, L.; Li, H.Y. Degradation characteristics of dioxin in the fly ash by washing and ball-milling treatment. J. Hazard. Mater. 2017, 339, 191–199. [Google Scholar] [CrossRef]
  12. Ni, H.; Wang, K.; Lv, S.; Wang, X.; Zhuo, L.; Zhang, J. Effects of concentration variations on the performance and microbial community in microbial fuel cell using swine wastewater. Energies 2020, 13, 2231. [Google Scholar] [CrossRef]
  13. Lv, S.; Zhang, J.; Ni, H.; Wang, X.; Zhu, Y.; Chen, L. Study on the coupling relationship of low temperature flowability and oxidation stability of biodiesel. Appl. Sci. 2020, 10, 1757. [Google Scholar] [CrossRef] [Green Version]
  14. Ni, H.; Wang, K.; Lv, S.; Wang, X.; Zhang, J.; Zhuo, L.; Li, F. Effects of modified anodes on the performance and microbial community of microbial fuel cells using swine wastewater. Energies 2020, 13, 3980. [Google Scholar] [CrossRef]
  15. Abyzov, V.A. Refractory cellular concrete based on phosphate binder from waste of production and recycling of aluminum. Procedia Eng. 2017, 206, 783–789. [Google Scholar] [CrossRef]
  16. Abyzov, V.A. Lightweight refractory concrete based on aluminum-magnesium-phosphate binder. Procedia Eng. 2016, 150, 1440–1445. [Google Scholar] [CrossRef] [Green Version]
  17. Zhan, D.P.; Zhang, H.S.; Jiang, Z.H. Effects of AIMnCa and AIMnFe alloys on deoxidization of low carbon and low silicon aluminum killed steels. J. Iron Steel Res. Int. 2008, 15, 15–18. [Google Scholar] [CrossRef]
  18. Zhang, G.H.; Chou, K.C. Deoxidation of molten steel by aluminum. J. Iron Steel Res. Int. 2015, 22, 905–908. [Google Scholar] [CrossRef]
  19. Peng, H.L.; Zhong, S.X.; Xiang, J.X.; Lin, Q.T.; Yao, C.; Dong, J.H.; Yin, G.C.; Yao, K.; Zeng, S.Y.; Zhong, J. Characterization and secondary sludge dewatering performance of a novel combined aluminum-ferrous-starch flocculant (CAFS). Chem. Eng. Sci. 2017, 173, 335–345. [Google Scholar] [CrossRef]
  20. Lin, Q.T.; Peng, H.L.; Zhong, S.X.; Xiang, J.X. Synthesis, characterization, and secondary sludge dewatering performance of a novel combined silicon–aluminum–iron–starch flocculant. J. Hazard. Mater. 2015, 285, 199–206. [Google Scholar] [CrossRef]
  21. Kachalova, G.S. Modern Coagulants and Flocculants in the Cleaning of Washing Waters of Water Treatment Plants; IOP Conference Series: Earth and Environmental Science; IOP Publishing: Bristol, UK, 2018; Volume 451. [Google Scholar]
  22. Tripathy, A.K.; Mahalik, S.; Sarangi, C.K.; Tripathy, B.C.; Sanjay, K.; Bhattacharya, I.N. A pyro-hydrometallurgical process for the recovery of alumina from waste aluminium dross. Miner. Eng. 2019, 137, 181–186. [Google Scholar] [CrossRef]
  23. Ramaswamy, P.; Ranjit, S.; Bhattacharjee, S.; Gomes, S.A. Synthesis of high temperature (1150 °C) resistant materials after extraction of oxides of Al and Mg from aluminum dross. Mater. Proc. 2019, 19, 670–675. [Google Scholar] [CrossRef]
  24. Leiva, C.; Galiano, Y.L.; Arenas, C.; Fariñas, B.A.; Pereira, F. A porous geopolymer based on aluminum-waste with acoustic properties. Waste Manag. 2019, 95, 504–512. [Google Scholar] [CrossRef]
  25. Dirisu, J.O.; Fayomi, O.S.I.; Oyedepo, S.O.; Jolayemi, K.J.; Moboluwarin, D.M. Critical evaluation of aluminium dross composites and other potential building ceiling materials. Procedia Manuf. 2019, 35, 1205–1210. [Google Scholar] [CrossRef]
  26. Echarri-Iribarren, V.; Echarri-Iribarren, F.; Rizo-Maestre, C. Ceramic panels versus aluminium in buildings: Energy consumption and environmental impact assessment with a new methodology. Procedia Manuf. 2019, 233, 959–974. [Google Scholar] [CrossRef]
  27. Ni, H.; Zhang, J.; Lv, S.; Wang, X.; Zhu, Y.; Gu, T. Preparation and performance optimization of original aluminum ash coating based on plasma spraying. Coatings 2019, 9, 770. [Google Scholar] [CrossRef] [Green Version]
  28. GB/T 8642-2002. Thermal Spraying-Determination of Tensile Adhesive Strength; China Machinery Industry Federation: Beijing, China, 2002. (In Chinese) [Google Scholar]
  29. GB4342-84. Metal Microscopic Vickers Hardness Test Method; China Ministry of Metallurgical Industry: Beijing, China, 1984. (In Chinese) [Google Scholar]
Figure 1. Particle size distribution of original aluminum ash spray powder (OAASP).
Coatings 10 00831 g001
Figure 2. The SEM images magnified 1000 times: (a) 100–120 mesh; (b) 120–150 mesh; (c) 150–200 mesh; (d) >200 mesh.
Coatings 10 00831 g002
Figure 3. The SEM images magnified 5000 times: (a) 100–120 mesh; (b) 120–150 mesh; (c) 150–200 mesh; (d) >200 mesh.
Coatings 10 00831 g003
Figure 4. XRD pattern of OAASP with different particle sizes.
Coatings 10 00831 g004
Figure 5. The angle of repose of OAASP with different particle sizes.
Coatings 10 00831 g005
Figure 6. The process flow for preparing original aluminum ash coating.
Coatings 10 00831 g006
Figure 7. The angle of repose of the spray powder with different proportions of Al2O3.
Coatings 10 00831 g007
Figure 8. Surface morphology of coatings: (a) appearance of the samples; (b) morphology of the coatings.
Coatings 10 00831 g008
Figure 9. Cross-sectional morphology of the samples: (a) appearance of the cross-sections; (b) morphology of the cross-sections.
Coatings 10 00831 g009aCoatings 10 00831 g009b
Figure 10. SEM images magnified 500 times of coatings with different proportions of Al2O3.
Coatings 10 00831 g010
Figure 11. XRD patterns of aluminum ash coatings with different proportions of Al2O3.
Coatings 10 00831 g011
Figure 12. Porosity of aluminum ash coatings with different proportions of Al2O3.
Coatings 10 00831 g012
Figure 13. The adhesive strength of coatings with different proportions of Al2O3.
Coatings 10 00831 g013
Figure 14. The microhardness of coatings with different proportions of Al2O3.
Coatings 10 00831 g014
Figure 15. The abrasion rate of coatings with different proportions of Al2O3.
Coatings 10 00831 g015
Table 1. Chemical components of the original aluminum ash.
ElementAlFeCaCuSiTiZnClMnOthers
wt.%61.80213.3014.3722.16710.1430.9860.7431.1371.6613.688
Table 2. Chemical composition of the 45 steel.
ElementCCrMnNiPSSiFe
wt.%0.450.200.650.200.030.020.25Bal.
Table 3. Preparation of spraying powder with different proportions of Al2O3.
Coating Samples120–150 Mesh OAASP/%Al2O3/%
H01000
H109010
H208020
H307030
H406040
H505050
Table 4. EDS analysis results of different brightness regions.
SamplesBright RegionGray RegionDark Region
ElementWeightAtomElementWeightAtomElementWeightAtom
H0O53.0666.53Al64.5075.58O14.4022.68
Mg9.267.52Si7.538.48Al74.4869.56
Al32.5023.80Cr1.861.13Si6.475.81
Si1.300.91Mn2.851.64Fe2.050.93
Ca0.980.49Fe23.2513.16Cu2.601.03
Fe2.100.74------
H10O39.1552.19Al59.7871.17O18.7728.92
Mg2.332.05Si9.6711.05Al59.0653.59
Al56.5744.72Cr3.882.40Si16.8314.77
Ca1.951.04Mn4.642.71Fe5.342.36
---Fe22.0312.67---
H20O59.0570.86Al61.0772.60O12.3722.28
Al40.9529.14Si9.0310.32Al54.5658.29
---Cr2.921.80Si4.534.65
---Mn3.482.03Cr1.190.66
---Fe19.8911.43Fe27.3614.12
---Cu3.611.82---
H30O55.6667.92O8.7016.01O11.0518.96
Al44.3432.08Al51.4554.17Al63.4664.57
---Si13.5314.18Si8.568.37
---Mn3.411.83Mn1.170.94
---Fe11.499.75Fe11.115.46
---Cu4.432.05Cu3.951.17
H40O45.8860.99O9.5715.49O3.1210.27
Mg5.815.08Al72.0569.15Al94.7184.44
Al32.8525.89Si15.3314.12Si2.175.29
Si2.561,94Cu3.071.25---
Ca7.894.19------
Fe5.011.91------
H50O54.4967.02O6.1910.90O12.2518.93
Al41.6532.56Al72.4175.65Mg6.987.10
Ca0.870.43Si5.475.48Al80.7773.98
---Cr1.230.67---
---Mn1.910.98---
---Fe10.605.35---
---Cu2.210.98---
Table 5. The test results of coating porosity.
Samplesm0/gm1/gm2/gPorosity/%
H032.55414.167632.56090.163
H1032.59574.169932.60230.158
H2032.58874.175732.59510.153
H3033.63764.293833.64390.147
H4032.59774.181832.60350.139
H5032.07984.127432.08520.131
Table 6. Test results of coating abrasion rate.
Samplesm1/gm2/gAbrasion Rate/(10−3 g/min)
H032.69732.56812.86
H1032.62132.49712.33
H2032.60432.48511.84
H3032.57232.45911.39
H4032.90532.79610.87
H5032.65832.55510.31
Table 7. Performance test results of the coatings with different proportions of Al2O3.
SamplesPorosity/%Adhesive Strength/MPaMicrohardness/HVAbrasion Rate/(10−3 g/min)
H00.16316.25606.5412.86
H100.15816.52625.3212.33
H200.15316.73648.6411.84
H300.14716.82667.7411.39
H400.13916.90681.9710.87
H500.13117.12713.3610.31
H1000.1–0.1220–25950–10007–7.5

