Abstract
As a common mechanical material for mining machinery, Q345 is prone to oxidation due to the moist working environment. At present, laser cleaning is often used to remove rust oxides from the substrate. The pollutant of mining machinery is comprised of a heavy oxide layer and organic ingredients, which are difficult to remove and require high energy per pulse. However, excessive energy is capable of easily destroying surface integrity, such as increasing surface roughness (Ra), generating ablative pits, oxidizing, decreasing microhardness (HV), and decreasing corrosion resistance. Therefore, this paper focused on investigating the surface integrity of mining parts under different laser powers, repetition rates and overlapping rates of the laser spots. The results showed that the surface integrity of the samples gradually improved as the energy per pulse and overlapping rates increased. However, excessive energy caused a negative effect on surface integrity. Based on the comprehensive analysis, optimal parameters were obtained when the power was 280 W, the repetition rate was 10 kHz (pulse duration 84 ns), and the overlapping rate of the laser spot was 70%. This work can provide theoretical guidance for the laser cleaning of mining machinery.
1. Introduction
As an important part of the manufacturing industry, there is a huge annual demand and production volume of mining machinery worldwide. Considering that Q345 steel has high strength and hardness, good wear resistance, and thermal conductivity, it is widely used in mining machinery parts. However, the working environment in the mining field is harsh, and the steel easily reacts electrochemically with oxygen to form rusty oxides, which greatly reduces the life and performance of the parts and causes huge economic losses. Traditional cleaning technology in the industrial field, e.g., high-pressure water jet technology, shot blasting and chemical cleaning, not only causes great damage to the surface of the sample, but is also contrary to the national environmental protection and green cleaning requirements [1,2]. As an emerging cleaning technology, laser cleaning technology removes attachments to achieve cleanliness by forming a series of physicochemical reactions with contaminants on the surface of the substrate to produce ablation, thermal expansion, vibration, among others [3]. Largely, laser cleaning meets the needs of industrial development and is gradually replacing traditional industrial cleaning technology due to its non-contact cleaning, precision, high adaptability, and eco-friendliness.
Regarding the removal of rusty oxides on the surface of metals, scholars have carried out a certain degree of research in the past decade. For laser cleaning equipment, Ristic et al. used an Nd: YAG laser to clean the corrosion of embroidered items, and concluded that a shorter wavelength provides higher removal efficiency and lower threshold laser fluence for the removal of the surface corrosion and dirt layers [4]. Linda et al. used a TEA CO2 laser to clean rust on the steel of ships, the results of which showed that rust can be efficiently removed by suitable parameters without damage to the substrate [5]. In order to remove the paint and dust layers from metal surfaces and to obtain a hydrophobic surface, Kayahana et al. used a low-power fiber laser to clean metals surfaces [6]. Iacopo et al. used an Nd: YAG laser to investigate the laser derusting and passivation processes of the iron objects of conservation interest, revealing that a longer pulse duration leads to phase changes on the rust layer and the formation of a homogeneous black-grayish coating on the surface after treatment [7]. To determine the laser cleaning efficiency and material surface properties after cleaning, Ali et al. investigated the microstructure and mechanical properties of low-carbon steel alloys under different peak powers and repetition rates, showing that the depth of the laser cleaning area can be controlled by the output parameters and that the microhardness increases by approximately 13% [8]. Chan et al. conducted orthogonal experiments to study the effect of laser treatment on the corrosion resistance of steel surfaces. Based on an analysis of variance (ANOVA), it was confirmed that power is the most significant laser parameter, which has the biggest effect on the corrosion resistance of stainless steel in a neutral solution [9]. Wang et al. studied the effect of laser parameters on the cleaning and performance of A3 steel, improving the microhardness and corrosion resistance of the cleaned surfaces by increasing of the laser fluence [10]. Choubey et al. used a microsecond pulse duration and a high peak power laser to clean a variety of metals for conservation, and found that the cleaning efficiency of Inconel materials can reach 98% [11]. Actually, an Nd:YAG laser has a higher output peak power compared to a fiber or TEA CO2 laser, and with the rapid development of laser technology, the surface flatness of materials to be cleaned by laser cleaning technology has been studied most in depth [12,13,14].
For mining machinery parts, the thickness of surface attachments is greater and the composition is more complicated than floating rust, thus, it is harder to remove it. To the best of authors’ knowledge, there are very few research works on the pollutants of oxide layers with organic ingredients for mining parts. Considering that the cleaning effect is poor at lower powers, we used a high-power laser for the cleaning experiments in this paper. However, excessive energy may cause damage (melting of the substrate, appearance of ablative pits and new oxide layers, etc.) to the matrix and may affect some key performance of parts. Therefore, we mainly conducted a systematic analysis of the key properties (roughness, hardness, corrosion resistance, etc.) of mining parts before and after cleaning while exploring the efficiency of high laser power during oxide removal from mining parts.
2. Materials and Experimental Methods
2.1. Experimental Setup
The experimental setup for cleaning the oxide layers from mining parts mainly included a high-power pulse laser, a laser torch, a control device and a dust pelletizing system, as shown in Figure 1. The water-cooling and optical systems control the laser in order to output high-quality laser beams, and then transmit them to the laser torch, which acts on the surface of the sample through the optical fiber. The main parameters of a laser torch are that fiber numerical aperture NA is 0.22 mm, the focal length of the collimating lens is 60 mm, and the focal length of the field lens is 100 mm. The dust pelletizing system greatly reduces the harm of dust and other substances to the human body and to the environment. The laser used herein was a solid-state laser with flat-topped laser energy. Figure 2 shows the energy profile of the laser beam. Compared to a Gaussian beam, its cleaning quality and efficiency are higher. The parameters of the laser equipment are shown in Table 1. Besides, the laser pulse duration is an important parameter that affects the cleaning processes. However, for our equipment, the laser pulse duration cannot be set manually. To test the pulse duration, an experiment was carried out. The relationship between the pulse duration and the repetition rate is shown in Figure 3. In light of this regression function, the variation of repetition rate during 8–13 kHz is able to reflect the variation of pulse duration in the following work.
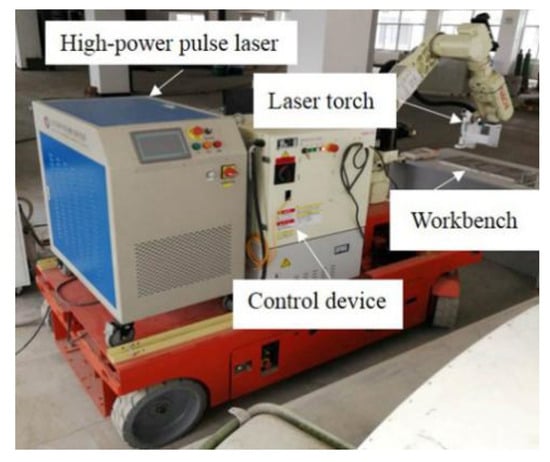
Figure 1.
Schematic diagram of the experimental setup for laser cleaning.
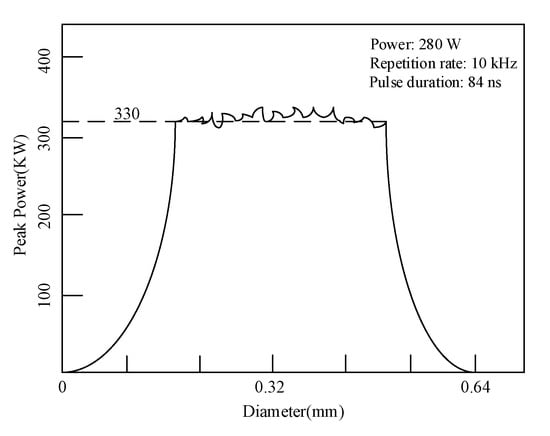
Figure 2.
Energy profile of laser beam.

Table 1.
Main working parameters of the laser.
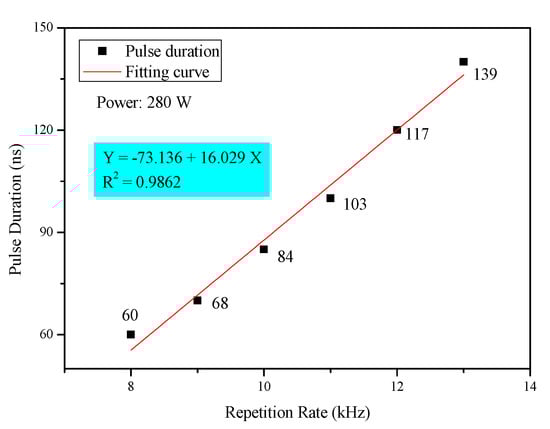
Figure 3.
The relationship between the pulse duration and the repetition rate.
2.2. Sample Preparation
The sample was taken from the part of the scraper that becomes the most corroded in the mining field. Considering the serious pollution and the large size of the sample, it was cut into 20 mm × 20 mm × 10 mm pieces using a wire cutter. The deposit on the surface of the sample was analyzed by scanning electron microscopy (SEM). The deposits mainly consisted of oil pollutants, loose minerals, and oxides with an approximate thickness of 500 μm, as shown in Figure 4a. In order to remove the loose materials from the surface of the sample, we used an ultrasonic cleaning machine for 5 min before laser cleaning, the effect of which is shown in Figure 4b,c. The main chemical components of sample matrix and deposit were analyzed as shown in Table 2. The matrix material of the sample to be cleaned was Q345, and the surface deposit was mainly rusting and other oxides, mostly in the shape of blocks and sheets, with poor compactness and homogeneity [15]. However, the removal was probably more difficult compared to that of floating rust generated on the surface of ordinary steel.
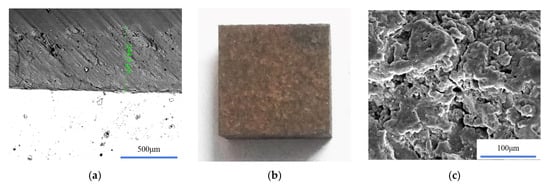
Figure 4.
Mining parts with a deposit layer: (a) Thickness of original sample; (b) Surface morphology after ultrasonic cleaning; (c) Microscopic appearance after ultrasonic cleaning.
Table 2.
Chemical composition of the matrix and the deposit.
2.3. Experimental and Analytical Methods
During the cleaning process, the laser beam was moved by a single-axis optical scanning galvanometer, and then formed into a quasi-linear spot with a length of approximately 10 mm. A schematic diagram of the cleaning process and the relationship between the parameters are shown in Figure 5, where η, L, D, V, and f refer to the overlapping rate, the distance of adjacent spots, the spot diameter, the scanning speed, and the repetition rate, respectively.
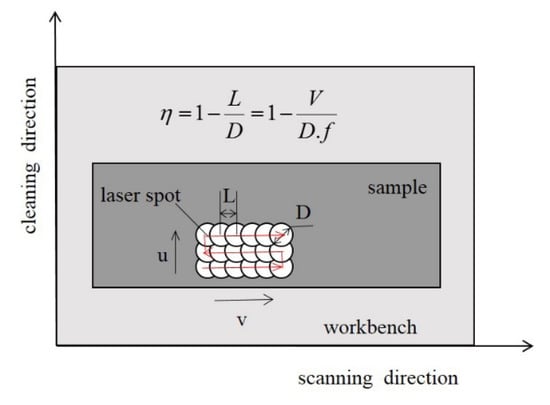
Figure 5.
Schematic diagram of the cleaning strategy.
A single factor experiment was used to investigate the surface properties (i.e., surface roughness, microhardness, corrosion resistance) as well as the removal efficiency of the surface oxide layers from the sample under different laser powers (i.e., 200, 220, 240, 260, 280, 300 W), repetition rates (8–13 kHz), and overlapping rates of the laser spot (30–80%). The power and repetition rate both determine the energy per pulse, while the overlapping rates of the laser spot are related to the cleaning rate. Considering that the deposit components were mainly oxides (i.e., Fe, O, and C), the cleaning efficiency was characterized by the relative content of several elements. The surface properties were measured with a white light interferometer (Wyko NT9800/9300, Bruker, Billerica, MA, USA), a three-electrode electrochemical experiment (Gamry, Warminster, PA, USA), and a hardness tester (HVS-1000, Shunnuo, Kunshan, China) before and after cleaning, assisted by a scanning electron microscope (JSM-IT500, Jeol, Tokyo, Japan) and an energy dispersive spectrometer (Ultim Extreme, Oxford, UK) to analyze the sample morphology and chemical composition. The white light interferometer selected the average value of three different areas to record the surface roughness under 50× magnification after cleaning. Due to the high hardness of the hardened layer after laser cleaning, the microhardness was tested by a Vickers hardness tester (HVS-1000, Shandong Liangong Group, Shandong, China) on a sample (size 20 mm × 20 mm × 10 mm), with a loading time of 15 s and a load of 300 g. The test process was measured on the sample surface, and an average value of three measurements was selected. The mining samples were subjected to a three-electrode electrochemical experiment (the sample to be tested was a working electrode, the auxiliary electrode was a Pt electrode, and the reference electrode was saturated calomel electrode) in a 3.5 wt.% NaCl solution at room temperature. According to the requirements of industrial cleaning efficiency and laser performance, the cleaning process was unidirectional and the cleaning speed was controlled at 3 mm/s.
3. Results and Discussion
3.1. Surface Topography
3.1.1. Macroscopic Morphology
Surface roughness is not only related to the efficiency of laser cleaning, but also to the coating performance of the parts after cleaning. The experiment explored the variation of the surface roughness of the samples as a result of different laser powers, overlapping rates of the laser spot, and repetition rates (pulse duration), the results of which are shown in Figure 6. The three-dimensional (3D) morphology of the mining sample before and after cleaning is shown in Figure 7.
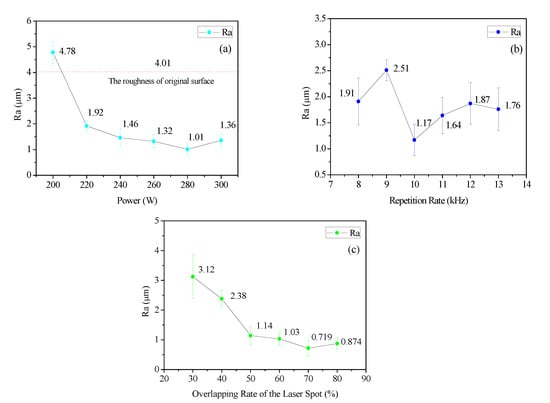
Figure 6.
Surface roughness of the corroded sample after laser cleaning under different (a) powers, (b) repetition rates, and (c) overlapping rates of the laser spots.
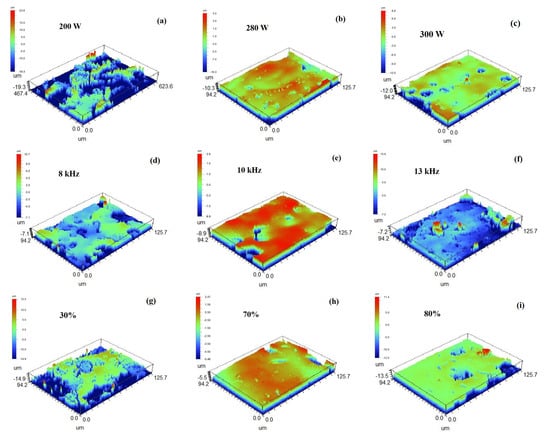
Figure 7.
Three-dimensional (3D) morphology of the corroded sample after laser cleaning: (a) 200 W; (b) 280 W; (c) 300 W; (d) 8 kHz; (e) 10 kHz; (f) 13 kHz; (g) 30%; (h) 70%; (i) 80%.
To explore the variation of the surface roughness of the corroded sample with different laser power, we selected a moderate repetition rate of 10 kHz and a moderate overlapping rate of 50%. In the preliminary test, the complex deposit began to change significantly at 200 W, that is, the loose oxides began to fall off of the surface of the mining sample. Therefore, the range of power explored was 200–300 W. As shown in Figure 6a, between 200 and 280 W, with an increase in laser power, the surface roughness of the sample gradually decreased and the removal effect was first fast and then slowed down. Considering that this process was a gradual removal process of rusted oxides, and that during this process, the sparse and uneven oxide layer and the removal mechanism changed, a non-uniform removal rate occurred. When the laser power was greater than 280 W, the surface roughness rose slightly.
The laser power and overlapping rate were fixed to 280 W and 50%, respectively, and the variation in the surface roughness of the corroded sample was explored under different repetition rates, as shown in Figure 6b. It can be seen that there was no obvious regular change in the surface roughness as the repetition rate changed. This can be explained by the fact that the repetition rate not only affects the laser energy density, but also affects the number of times it acts on the same area under the same galvanometer cycle. Hence, the repetition rate was fixed to 10 kHz, according to the curve in the following analysis.
The laser power and repetition rate were fixed to 280 W and 10 kHz, respectively, and the variation of the surface roughness of the corroded sample was explored under different overlapping rates, as shown in Figure 6c. As shown in Figure 7, more oxide was still attached to the surface of the matrix, and the roughness value was higher when the overlapping rate was low. As the overlapping rate increased, the surface roughness gradually decreased, and a minimum value of 0.719 μm was obtained at 70%.
Through the above analysis and discussion, flatness of the corroded sample surface was achieved by selecting specific process parameters. The minimum surface roughness value was obtained when the laser power was 280 W, the repetition rate was 10 kHz (pulse duration 84 ns), and the overlapping rate was 70%. To verify whether the variation of roughness was due to the existence of oxide or the damage of substrate, SEM was used.
3.1.2. Microscopic Morphology
The microscopic morphology of the surface of the corroded samples under different laser parameters is shown in Figure 8. When the laser power (Figure 8a) was 220 W, there were still some obvious residual streaky attachments on the surface of the sample. With the increase in laser power, the oxides were gradually removed. When the laser power reached 280 W, there was basically no obvious residue on the surface. In this process, because the laser acted on the substrate, the surface materials produced a solid–liquid–solid phase transition, and slight burning traces of ablation and small holes were left [16,17]. When the laser power was increased to 300 W, the diameter of the hole became larger and the ablation marks on the surface were more conspicuous, so the surface roughness was bound to increase.
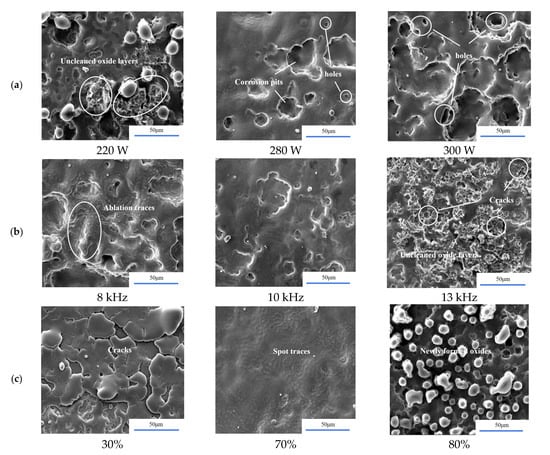
Figure 8.
Morphology of the corroded sample cleaned by laser under scanning electron microscopy (SEM) under different (a) powers, (b) repetition rates, and (c) overlapping rates.
For the repetition rate (Figure 8b), when it was fixed to 8 kHz, an “edge accumulation” effect can be seen, that is, the laser beam acted on the surface of the corroded sample to form metal molten craters of a papillary shape, and in the edge of the craters existed a molten resolidified substance due to the pressure and liquid phase blast [18,19]. When the repetition rate was 10 kHz, as shown above, the effect of the surface cleaning was better. When the repetition rate increased to 13 kHz, more massive attachments were visible on the surface, mainly related to the lower energy per pulse.
The overlapping rate had a significant effect on the cleaning efficiency as shown in Figure 8c. When the overlapping rate was 30%, there was still a rusted oxide layer on the surface of the matrix. The oxide layer experienced cracks after melting and attached to the matrix with a sheet structure. In this process, cracks appeared in the surface, proving that thermal stress was generated at the interface between the oxide layers and the matrix during cleaning. The upward force of the thermal stress on the adhesion layer caused micro-cracks, thereby helping the attachment to detach from the surface of the matrix. With an increase in the overlapping rate of laser spots, the cleaning effect was significantly improved. When it reached 70%, the surface basically became free of rust oxides, and ablation micro-stripes and spot marks were visible on the surface. When the overlapping rate increased to 80%, regular particulate material appeared in some areas on the surface of the matrix. Energy dispersive spectroscopy (EDS) dot analysis indicated that the particulate matter was mainly iron oxide, as shown in Figure 9. Due to the formation of a new oxide layer on the surface, the cleaning effect was slightly reduced.
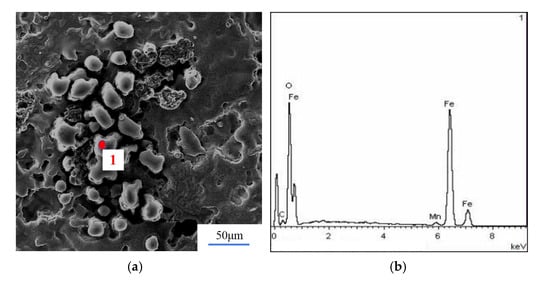
Figure 9.
Attachment composition under energy dispersive spectroscopy (EDS) analysis. (a) The selected point; (b) Main elements.
Through the above macro- and micro-morphological analysis, it can be concluded that the removal efficiency of the oxide layer from the surface was best at a laser power of 280 W, a repetition rate of 10 kHz (pulse duration 84 ns), and an overlapping rate of 70%. To verify this, EDS was used to analyze the relative content of the main chemical elements on the surface of the sample before and after cleaning.
3.2. Element Content
The macro-cleaning effect of the corroded sample under different laser powers, repetition rates, and overlapping rates is shown in Figure 10. At the same time, in order to further verify the cleaning efficiency of the laser for removing the oxide from the surface of the mining sample, energy dispersive spectroscopy (EDS) was used to analyze the microelement composition and content of the sample before and after cleaning [20].
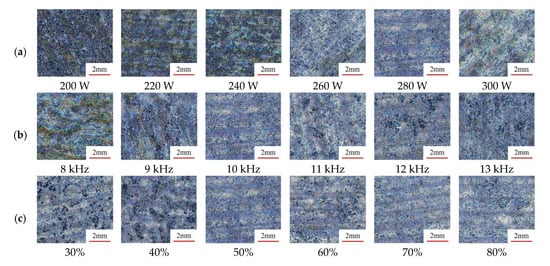
Figure 10.
Cleaning effect of the corroded sample under different (a) powers, (b) repetition rates, and (c) overlapping rates.
With the increase in power, the rust oxides on the surface gradually fell off and the thickness of the oxide layer decreased, as shown in Figure 10a. When the laser power reached 260 W, the surface of the sample began to expose the metal matrix, but there were still many residual attachments. When the power reached 280 W, the oxide on the surface was basically removed, and the surface showed a metallic luster. As the power continued to increase, the surface gradually transformed into dark black, and a new oxide layer appeared on the matrix. In Figure 10b, because the repetition rate was related to the number of cleans in addition to the energy per pulse, 10 kHz was selected as the fixed value due to its better cleaning effect. For the overlapping rate of the laser spots, when the overlapping rate was in low-state, the same area that two adjacent spots acted on was small and the energy input was low, which led to a poor cleaning effect, as shown in Figure 10c. In this process, an overlapping rate of 70% had the best cleaning effect. When the overlapping rate reached 80%, the surface of the matrix became yellowed, owing to the large heat input, which was in an over-cleaning state. What is more, ablation pits and some new oxide layers appeared, which can be seen from their microscopic morphology.
EDS was used to analyze the main chemical components that may exist on the surface. Based on the EDS analysis in Table 2, it can be seen that the pollutant components of the mining sample were mainly rust oxides, that is, iron oxides. There were a few oil or mineral components due to the insufficiency of the ultrasonic cleaning, which resulted in high carbon content. Therefore, in order to verify the laser cleaning effect under different parameters, the removal efficiency of the dirt was analyzed with the content of three elements (i.e., Fe, O, and C). As can be seen in Figure 11a, with an increase in laser power, the iron content ratio gradually increased and the oxygen content ratio gradually decreased, which means that the rust oxide layer was being continuously removed. However, when the laser power exceeded 280 W, the oxygen content showed a slight upward trend. The main reason was that the laser power input was too high to cause an over-cleaning state. Meanwhile, the cleaning quality slightly declined, related to the forming of new oxide films. Actually, when the repetition rate was fixed, the variation of power determined the energy per pulse, with an adverse effect on cleaning quality when the energy per pulse was too high or too low. The repetition rate has no obvious rules for the cleaning effect. From the above macro-cleaning effect, it can be seen that the surface cleaning effect was the highest at 10 kHz and the oxygen content was the lowest under this parameter, and so the cleaning effect was relatively good. The overlapping rate of the laser spots had a significant effect on the cleaning efficiency. With an increase in the overlapping rate, the overlapping areas of adjacent spots increased. In other words, the energy input increased in the same areas, and the cleaning effect increased. The result was that the iron content rose, while the oxygen content decreased. As can be seen from Figure 11c, the oxygen content reached a minimum of 7.92%, compared with 33.82% in the original sample content with a laser power of 280 W, a repetition rate of 10 kHz, and an overlapping rate of 70%. The overlapping rate increased from 70% to 80%, and the oxygen content increased slightly. Considering that the energy per unit of area was too high, some areas of thermal damage appeared on the surface, thereby increasing the content of oxygen, with the appearance of the new oxides. Moreover, it can be seen that the content of carbon did not change much during the cleaning process, which was maintained between 3% and 4%. This may be due to the carbonization of oil stains or the falling of mineral particles on the surface of the sample during the cleaning process, so that the value of the element content remained relatively stable.
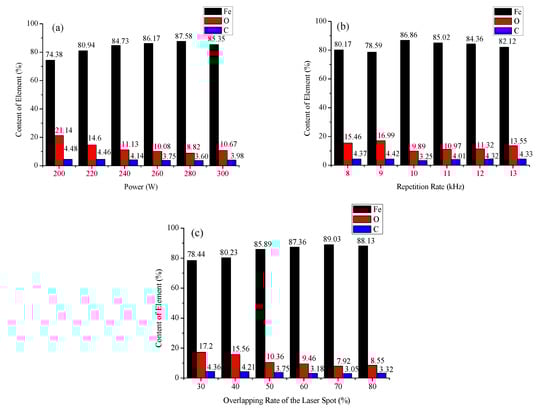
Figure 11.
The variation rules of main elements under different (a) powers, (b) repetition rates, and (c) overlapping rates.
Based on the above analysis of the macroscopic morphology, microscopic morphology, and main element contents, the data were basically in a consistent state, that is, the cleaning efficiency was the highest at a laser power of 280 W, a repetition rate of 10 kHz (pulse duration 84 ns), and an overlapping rate of the laser spots of 70%. However, for the mining parts, the enhancement of the performance (hardness, corrosion resistance, etc.) is also crucial under the conditions of ensuring cleaning and reuse [21]. Therefore, the following analysis of the corroded sample was based on the performance of the microhardness and corrosion resistance after laser cleaning.
3.3. Microhardness
The variation in the microhardness of the laser-cleaned mining corroded parts under different parameters is shown in Figure 12. It can be seen that with a gradual increase in laser power, the hardness of the sample showed a gradual upward trend and was greater than the matrix’s hardness value (300 HV). When the laser power reached 300 W, the surface hardness was able to reach 420 HV. This can be explained by the fact that the laser cleaning process is a heat treatment process. Energy per pulse is related to the heat input; when the energy per pulse increased, the grain of the microstructure for the sample surface refined, which improved the ability to avoid dislocations between grain boundaries. This will generate a hardened layer on the matrix. In further experiments, a heat-affected layer was formed on the surface of the matrix to improve the mechanical properties of the sample, which increased the hardness and strength of the material, as shown in Figure 13 [22]. It can be seen from Figure 12b that the repetition rate had a significant influence on the hardness value of the material. When the period of the galvanometer was fixed, the size of the repetition rate can be regarded as the number of pulses acting on the unit area. With an increase in the repetition rate, the hardness value of the sample surface increased significantly, and when the repetition rate was fixed to 12 kHz, the hardness value was able to reach 480 HV, which was 60% higher than the matrix’s value. In this process, it can be seen that the hardness raised with the repetition rate increased. Generally, the hardness is affected by two factors: the heat treatment by laser power, and the impact force generated by laser pulse [23]. Since the power was fixed in this process, the increasing hardness can be explained by the impact effect of the pulse on the sample surface, which was increasing with the repetition rate. In further analysis, as the repetition rate increased, the number of impacts generated by the pulse increased, and the hardened layer produced by the surface layer under the action of compressive stress was denser and the hardness was greater. On the other hand, due to the presence of thermal stress at the interface, the recoil force of the rusted oxides leaving the matrix also had a positive effect on the hardness. The hardness decreased slightly at 13 kHz, due to the rust oxides on the surface layers left by the high repetition rate. It can be seen from Figure 12c that an increase in the overlapping rate of the laser spots also gradually increased the microhardness of the surface layer. When the overlapping rate exceeded 50%, the increasing trend slowed down. The overlapping rate between the light spots was actually a heat input that affects the energy density per unit of area. The higher the overlapping rate, the better the heat treatment effect, the denser the surface lattices, and the greater the hardness value.
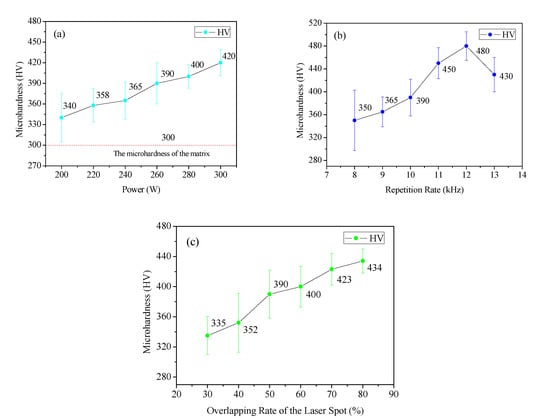
Figure 12.
Variation of the microhardness under different (a) powers, (b) repetition rates, and (c) overlapping rates.
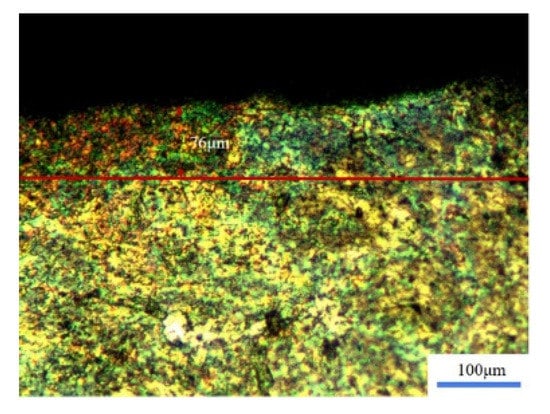
Figure 13.
Heat-affected layer after laser cleaning.
From the above analysis and as can be seen in Figure 12, the main parameter affecting the microhardness was the repetition rate (pulse duration) in the laser cleaning process, which mainly affected the number of pulses acting on the surface per unit of area. The greater the number of pulses, the greater the impact strength on the surface layer. In this process, combined with the heat treatment process with a high energy per pulse, the grain size was refined and the hardened layer generated was tight, so that the hardness value was significantly improved. Therefore, the laser cleaning process had positive significance for improving the hardness of materials.
3.4. Corrosion Resistance
In order to accelerate the corrosion resistance experiment, we simulated extreme conditions with a 3.5% sodium chloride solution and carried out a three-electrode electrochemical experiment. The polarization curve obtained by laser cleaning of the sample under different parameters is shown in Figure 14. The obtained polarization curve was fitted with a Tafel curve to obtain the corrosion voltage and corrosion current, as shown in Table 3. The corrosion potential characterizes the thermodynamic stability of the samples under electrochemical corrosion conditions, while the corrosion current reflects the corrosion rate and the breakdown potential is the lowest potential for pitting corrosion [24].
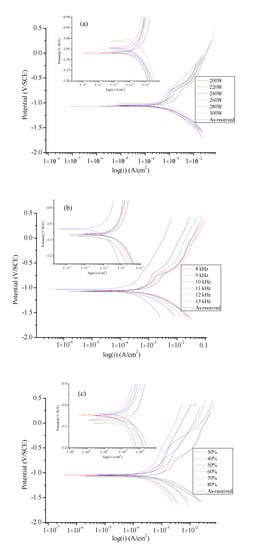
Figure 14.
Polarization curve under different (a) powers, (b) repetition rates, and (c) overlapping rates.
Table 3.
Electrochemical corrosion parameters of the sample under different laser parameters.
It can be seen from Figure 14a that the polarization curves of the laser cleaning process with different powers all showed a positive movement compared to that of the matrix. As the laser power increased from 200 to 300 W, the self-corrosion potential showed a gradual increasing trend, that is, the corrosion power of the sample surface after cleaning slightly increased. Meanwhile, the self-corrosion current decreased first and then increased, indicating that the corrosion resistance on the surface of the sample increased first and then decreased [25]. The minimum value at 280 W had the best corrosion resistance. At this time, the passivation platform was wider in the passivation area, and so the passivation state of the sample was more stable. Between 200 and 280 W, a decrease in the corrosion current meant that as the laser power increased, the loose oxide layer on the surface was removed. In this process, the laser also had a certain thermal effect on the surface of the matrix, refined the crystal lattice, and improved the surface flatness. Hence, the corrosion resistance has been improved. However, when the laser power was fixed to 300 W, the surface heat accumulation was too high, and there were many ablation pits and melted matter from the microscopic morphology, which led to damage of the matrix and a decrease in the corrosion resistance.
There was no obvious rule for the influence of the repetition rate (pulse duration) on the corrosion resistance performance, however, at 10 kHz, the data of the corrosion potential and the corrosion current were basically consistent with the data corresponding to the power. That is to say, the self-corrosion current was the smallest and corrosion resistance was the best. As shown in Figure 14c and Table 3, the overlapping ratio between the laser spots also had a significant influence on the corrosion resistance. When the overlapping rate was low, there were areas where the laser energy was not transmitted. From the micrograph morphology, there were some rusted oxides that had not been removed. In this process, a galvanic cell was formed between the oxide layer and the matrix, and the corrosion resistance was poor. As the overlapping rate increased, the rusted oxide of the surface was gradually removed; thus, the self-corrosion current was gradually reduced and the corrosion resistance was gradually increased. When the overlapping rate exceeded 50%, the laser energy gradually produced a slight effect on the matrix. Cleaning traces and crater holes appeared on the surface due to over-cleaning of the laser, which resulted in a decrease in the corrosion resistance instead.
In summary, as the laser power and the overlapping rate of the laser spots increased, the corrosion resistance of the cleaned sample gradually increased but stayed below the damage threshold of the matrix. When the laser power was fixed to 280 W, the repetition rate was fixed to 10 kHz (pulse duration 84 ns), and the overlapping rate was fixed to 70%, the corrosion current was able to reach to 487.7 , which was approximately 52.8% lower than the matrix’s 1034 , and the corrosion resistance of the surface was significantly improved.
4. Conclusions
In this paper, based on an Nd: YAG pulse laser, the effect of laser cleaning on the removal effectiveness of the oxide layers from the surface of mining corroded parts under different process parameters was explored, and the key performance of the parts’ surfaces before and after cleaning was analyzed. The main conclusions can be listed as follows:
- (1)
- The laser cleaning technology had a good removal effect on the oxide layer and other attachments from the surface of the mining parts. When the laser power was 280 W, the repetition rate was 10 kHz (pulse duration 84 ns), and the overlapping rate of the laser spots was 70%, the surface oxygen content was the lowest and the removal effect was the best.
- (2)
- For the 3D morphology on the surface of the sample before and after cleaning, the surface roughness gradually decreased as the heat input per unit of area increased, but when the heat input was too high, ablation pits and new oxides appeared on the surface of the sample, which led to a slight upward trend in the surface roughness. In this process, two main cleaning mechanisms existed, i.e., an ablation effect and a thermal stress effect, to remove oxides during the cleaning process.
- (3)
- The laser cleaning had a significant effect on the microhardness of the sample’s surface. Under the action of laser cleaning, the surface grain was refined and the resistance to dislocations generated between the grain boundaries increased. What is more, the impact effect of the laser spots under a high repetition rate or high pulse duration had the largest influence in the improvement of the hardness. Compared to the original sample, when increasing the rate of the surface hardness value, it was able to reach 60%.
- (4)
- After laser cleaning, the corrosion resistance of the surface of the mining sample was obviously improved. With an increase in the laser power and the overlapping rate of the laser spots, the surface’s anti-corrosion performance gradually improved. When the power and overlapping rate were too high, a new oxide layer and ablation pits appeared on the surface of the mining parts, which resulted in a lower corrosion resistance. The optimal corrosion resistance was improved by more than 62.9% compared to the original sample.
In summary, the optimal process parameters of the Nd: YAG laser cleaning for the removal of oxides from the mining samples were a laser power of 280 W, a repetition rate of 10 kHz (pulse duration 84 ns), and overlapping rate of the laser spots of 70%. These parameters had a positive effect on the reduction in the surface roughness, the increase in microhardness, and the improvement in corrosion resistance.
Author Contributions
Conceptualization, L.W. and M.M.; methodology, M.M.; validation, M.M., L.W., and J.L.; investigation, Y.R. and Y.Z.; data curation, M.M.; writing—original draft preparation, M.M.; writing—review and editing, L.W. and X.W.; supervision, L.W. and X.J.; project administration, J.L. and X.J. All authors have read and agreed to the published version of the manuscript.
Funding
This research was funded by the Shandong Key Research and Development Plan (No. 2018CXGC0807), the National Natural Science Foundation of China (No. 51875324), and Funding of State Key Laboratory of High Performance Complex Manufacturing, Central South University (No. Kfkt2018-08).
Conflicts of Interest
The authors declare no conflict of interest.
References
- Choi, J.P.; Lee, S.J. Efficient chip breaker design by predicting the chip breaking performance. Int. J. Adv. Manuf. Technol. 2001, 17, 489–497. [Google Scholar] [CrossRef]
- Hsu, C.Y.; Liang, C.C.; Teng, T.L.; Nguyen, A.T. A numerical study on high-speed water jet impact. Ocean Eng. 2013, 72, 98–106. [Google Scholar] [CrossRef]
- Watkins, K.G. Mechanisms of laser cleaning. In Proceedings of the High-Power Lasers in Manufacturing, Osaka, Japan, 7 February 2000; pp. 165–174. [Google Scholar]
- Ristic, S.; Polic, S. Laser cleaning of textile artifacts with metal threads: Process parameter optimization. Sci. Tech. Rev. 2014, 64, 45–52. [Google Scholar]
- Ke, L.; Zhu, H.; Lei, W.; Cheng, Z. Laser cleaning of rust on ship steel using TEA CO2 pulsed laser. In Proceedings of the Photonics and Optoelectronics Meetings (POEM) 2009: Industry Lasers and Applications, Wuhan, China, 21 October 2009; p. 75150G. [Google Scholar]
- Kayahana, E.; Candana, L.; Arasb, M.; Gundogdu, O. Surface cleaning of metals using low power fiber lasers. Acta. Phys. Pol. A 2018, 134, 371–373. [Google Scholar] [CrossRef]
- Iacopo, O.; Salvatore, S. Dependence of Nd:YAG laser derusting and passivation of iron artifacts on pulse duration. In Proceedings of the Fundamentals of Laser-Assisted Micro- and Nanotechnologies 2013, Petersburg, Russia, 24–28 June 2013; p. 906513. [Google Scholar]
- Ali, S.N.; Taha, Z.A.; Mansour, T.S. Laser cleaning using q-switched Nd:YAG laser of low carbon steel alloys. Adv. Condens. Matter. Phys. 2014, 2014, 1–6. [Google Scholar] [CrossRef]
- Chan, S.N.; Wong, W.Y.; Walvekar, R.; Kadhum, A.A.H.; Khalid, M. Parametric optimization of pulsed laser ablation on stainless steel for improving corrosion resistance by Taguchi method. Mater. Res. Express 2018, 6, 26533. [Google Scholar] [CrossRef]
- Wang, Z.; Zeng, X.; Huang, W. Parameters and surface performance of laser removal of rust layer on A3 steel. Surf. Coat. Technol. 2003, 166, 10–16. [Google Scholar] [CrossRef]
- Choubey, A.; Vishwakarma, S.C.; Vachhani, D.M.; Singh, R.; Misra, P.; Jain, R.K.; Arya, R.; Upadhyaya, B.N.; Oak, S.M. Study and development of 22 kW peak power fiber coupled short pulse Nd:YAG laser for cleaning applications. Opt. Lasers Eng. 2014, 62, 69–79. [Google Scholar] [CrossRef]
- Salimbeni, R.; Pini, R.; Siano, S. A variable pulse width Nd:YAG laser for conservation. J. Cult. Herit. 2003, 4, 72–76. [Google Scholar] [CrossRef]
- Lv, X.; Pan, Y.; Jia, Z.; Li, Z.; Ni, X. Surface damage induced by a combined millisecond and nanosecond laser. Appl. Opt. 2017, 56, 5060–5067. [Google Scholar] [CrossRef]
- Hatcher, G.D.; Ijomah, W.L.; Windmill, J.F.C. Design for remanufacture: A literature review and future research needs. J. Cleaner Prod. 2011, 19, 2004–2014. [Google Scholar] [CrossRef]
- Ma, X.L.; Nie, X.H.; Zhao, J.N.; Han, Y.F.; Pranav, S.; Wang, Y.; Guo, J. Coloring stability analysis of nanosecond pulsed laser induced surface coloring on stainless steel. Opt. Lasers Technol. 2020, 123, 105936. [Google Scholar] [CrossRef]
- Zhu, G.; Wang, S.; Cheng, W.; Wang, G.; Liu, W.; Ren, Y. Investigation on the surface properties of 5A12 Aluminum Alloy after Nd: YAG laser cleaning. Coatings 2019, 9, 578. [Google Scholar] [CrossRef]
- Anashkina, E.A.; Andrianov, A.V.; Leuchs, G. Single-shot reconstruction of a subpicosecond pulse from a fiber laser system via processing strongly self-phase modulated spectra. Results Phys. 2020, 16, 102848. [Google Scholar] [CrossRef]
- Mo, J.; Chen, Y. Silver jewelry microanalysis with dual-pulse laser-induced breakdown spectroscopy: 266 + 1064 nm wavelength combination. Appl. Opt. 2014, 53, 7516–7522. [Google Scholar] [CrossRef]
- Shen, Z.; Ding, T.; Ye, X.; Wang, X.; Ma, B.; Cheng, X.; Liu, H.; Ji, Y.; Wang, Z. Influence of cleaning process on the laser induced damage threshold of substrates. Appl. Opt. 2011, 50, C433–C440. [Google Scholar] [CrossRef]
- Peng, Y.; Wen, Y.; Zhang, D.; Luo, S.; Chen, L.; Zhu, Y. Optimal proportional relation between laser power and pulse number for the fabrication of surface-microstructured silicon. Appl. Opt. 2011, 50, 4765–4768. [Google Scholar] [CrossRef]
- Shi, T.; Wang, C.; Mi, G.; Yan, F. A study of microstructure and mechanical properties of aluminum alloy using laser cleaning. J. Manuf. Process. 2019, 42, 60–66. [Google Scholar] [CrossRef]
- Vrancken, B.; Thijs, L.; Kruth, J.P.; Van Humbeeck, J. Heat treatment of Ti6Al4V produced by selective laser melting: Microstructure and mechanical properties. J. Alloys Compd. 2012, 541, 177–185. [Google Scholar] [CrossRef]
- Li, M.; Xu, R. A new method for detecting jet impact force of laser cavity. Key Eng. Mater. 2013, 552, 463–469. [Google Scholar] [CrossRef]
- Ndiithi, N.J.; Kang, M.; Zhu, J.; Lin, J.; Nyambura, S.M.; Liu, Y.; Huang, F. Microstructural and corrosion behavior of high velocity arc sprayed FeCrAl/Al composite coating on Q235 steel substrate. Coatings 2019, 9, 542. [Google Scholar] [CrossRef]
- Conradi, M.; Sever, T.; Gregorčič, P.; Kocijan, A. Short- and long-term wettability evolution and corrosion resistance of uncoated and polymer-coated laser-textured steel surface. Coatings 2019, 9, 592. [Google Scholar] [CrossRef]
© 2020 by the authors. Licensee MDPI, Basel, Switzerland. This article is an open access article distributed under the terms and conditions of the Creative Commons Attribution (CC BY) license (http://creativecommons.org/licenses/by/4.0/).