Article

High Temperature Corrosion Behaviors of 20G Steel, Hastelloy C22 Alloy and C22 Laser Coating under Reducing Atmosphere with H2S

Key Laboratory of Energy Transfer and System of Power Station of Ministry of Education, North China Electric Power University, Beijing 102206, China
*
Author to whom correspondence should be addressed.
Coatings 2020, 10(7), 617; https://doi.org/10.3390/coatings10070617
Submission received: 30 May 2020 / Revised: 20 June 2020 / Accepted: 23 June 2020 / Published: 29 June 2020
(This article belongs to the Special Issue Corrosion Science and Surface Engineering)

Abstract

:
High-temperature corrosion behaviors of 20G steel, Hastelloy C22 alloy and C22 laser coating was evaluated by corrosion mass gain measurements at 450 °C. The corrosive atmosphere is 0.2 vol% H2S–0.1 vol% O2–N2, which simulated the severe high-temperature corrosion environment occurred under low-NOx combustion in pulverized-coal furnaces. Experimental results showed that the corrosion resistance of the C22 laser coating and the C22 alloy was obviously better than 20G steel. Furthermore, it should be noted that the C22 laser coating fabricated in this study displayed a higher corrosion resistance than the commercial C22 alloy although they had the same chemical composition. The severe pitting corrosion was observed in 20G steel with the corrosion products consisting of FeS2, Fe2O3 and Fe3O4. The C22 alloy and C22 laser coating exhibited the uniform corrosion and their main corrosion products were NiS2, CrS and a small amount of chromium and manganese oxides.

1. Introduction

With environmental issues becoming more prominent, low-NOx combustion technology have been widely applied in pulverized-coal furnaces. The basic design principle for the low -NOx combustion is to delay the mixing between fuel and air to create a region of low temperature reducing atmosphere, then the NOx formation reactions can be inhibited [1,2,3]. However, high-temperature corrosive gases of H2S resulting from the low-NOx combustion are produced, and the gases even cannot be completely oxidized before flowing out of the furnace [4,5,6,7]. The water wall tubes suffer more severe high temperature corrosion in reducing atmosphere, because the H2S can react with water wall to form porous, nonadherent, sulfide scale without protection [5,6,7,8]. The pressure and temperature of steam will be continuously increased with the application of supercritical and ultrasupercritical utility boilers, and a large number of experiments have shown that the corrosion mass gain increases with the increase of temperature [5,9,10]. Therefore, it is necessary to develop high corrosion resistant materials in the pulverized-coal furnaces with low-NOx combustion.
As an inactive element chemically, nickel-based alloys are widely used in modern industry for their ability of exceptional corrosion resistance [11,12,13,14]. As one of the nickel based alloys, Hastelloy C22 alloy has been studied extensively because of the outstanding resistance to pitting corrosion [15], crevice corrosion [16,17,18,19,20] and stress-corrosion cracking [21]. Studies have shown that Cr and Mo as one of the main alloying elements of C22 alloy can decrease corrosion rates by forming a thin chemically impervious surface [22,23,24], and Cr plays the a major role in maintaining passivity, while Mo plays a leading role in enhancing the passivation capacity of the passivation film after breakdown [23,25,26]. Moreover, C22 has been shown to have good corrosion resistance by forming dense oxides on the surface in high temperature molten salt corrosion environment [18] and is one of the few materials that are resistant to corrosive by solution containing hydrogen sulfide [27]. But few studies were aimed at high-temperature corrosion in reducing atmosphere, especially H2S corrosion of in the pulverized-coal furnaces with low-NOx combustion.
Considering that nickel metal is the deficient resource—and C22 alloy is more expensive than conventional wrought alloys [28]—it is not a suitable candidate of water wall tube for pulverized-coal furnaces. With superior surface properties of high energy density, metallurgical bonding, low dilution rate, refined microstructure, pore-free and small heat affected zone [29,30,31,32,33,34], laser-cladding technology shows dramatic potential to prepare corrosion resistant coatings. Generally, a cladding layer with a thickness of 300–500 μm has good corrosion resistance, which can significantly reduce the material cost and the comparative studies [18,35] show the hot corrosion resistance of C22 laser coating is better than that of C22 alloy. Thus, the preparation of C22 laser coating on 20G-steel surface by laser-cladding technology can significantly reduce the cost and improve the corrosion resistance.
In this study, in order to reduce the corrosion caused by low-NOx combustion in pulverized-coal furnaces, C22 laser coating was prepared on a 20G surface. At the same time, to investigate effect of H2S gas on the corrosion behavior of materials, a comparative study of 20G steel, C22 alloy and the C22 laser coating was carried out and the experimental results were discussed in detail.

2. Materials and Methods

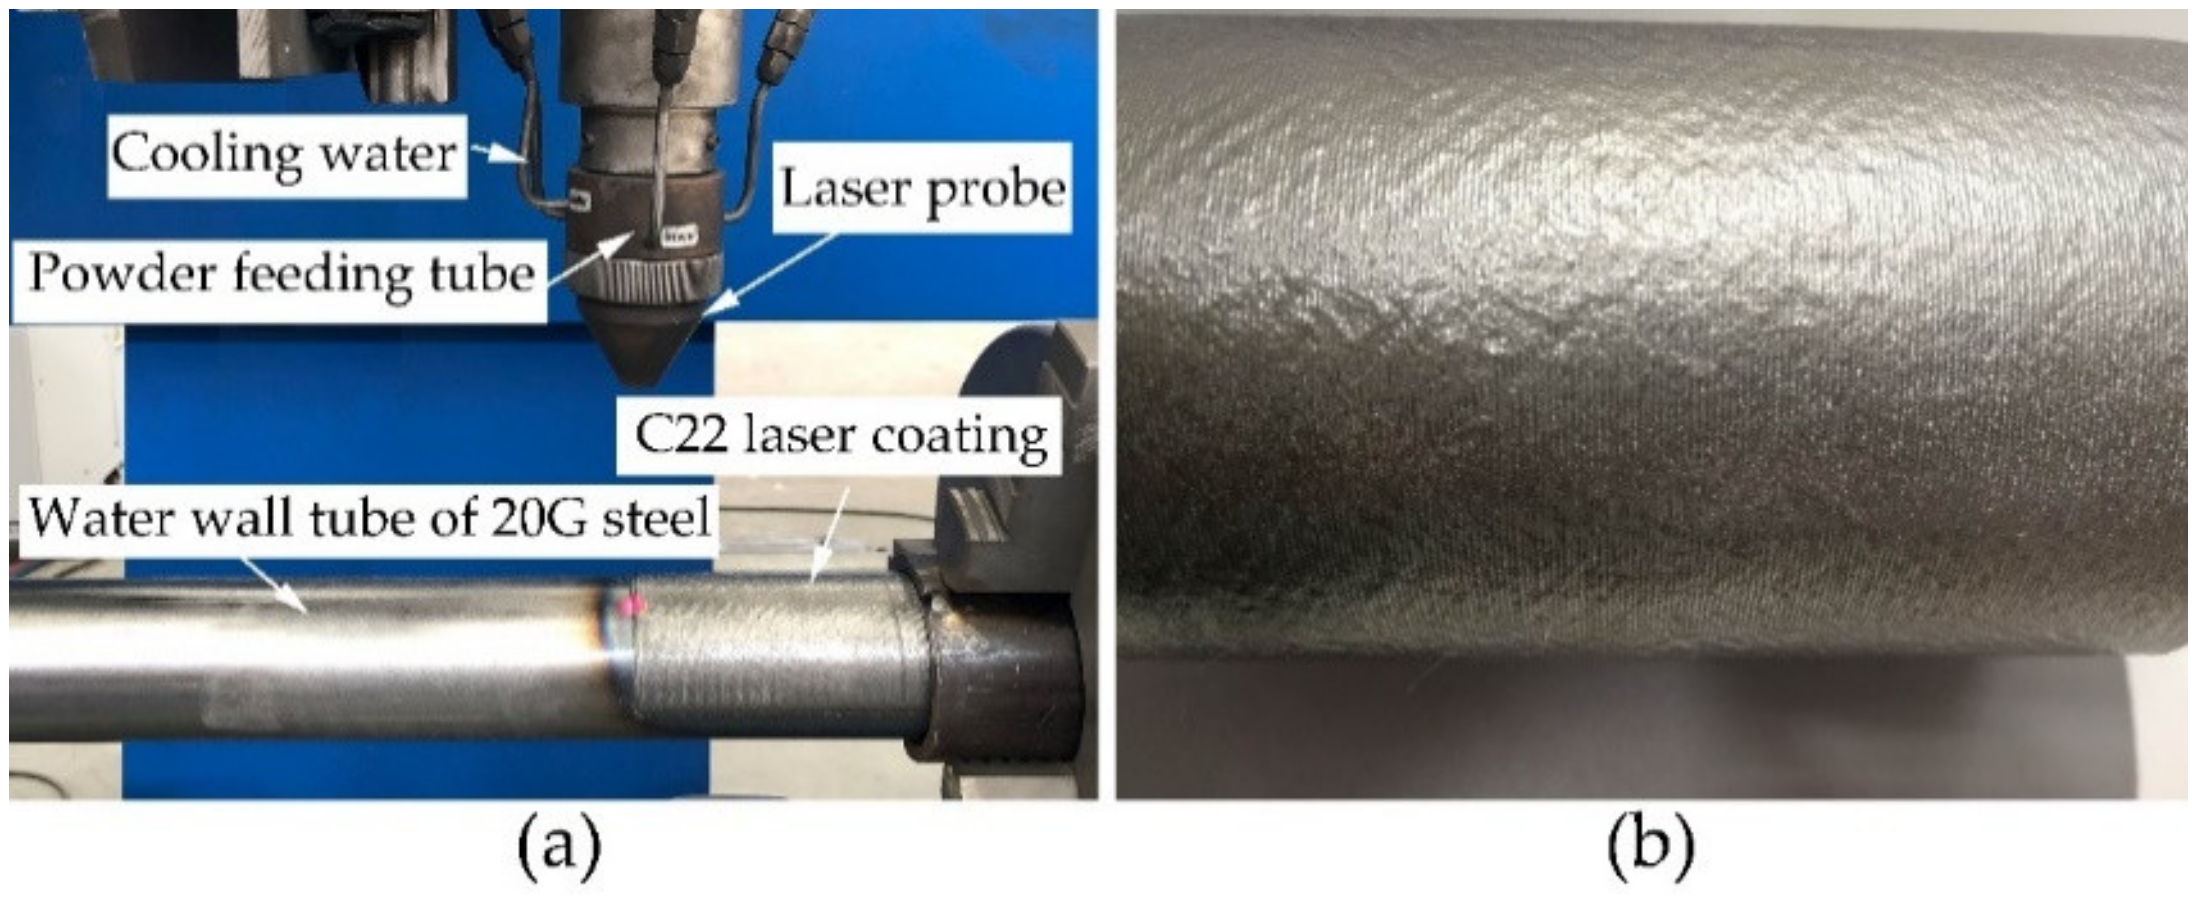
2.1. Materials and Laser-Cladding Process

The materials investigated in the study were C22 laser coating prepared on the substrate of water wall tube of 20G steel [36], the Hastelloy C22 alloy bar and 20G steel cut from water wall tube. The C22 powder (offered by Beijing General Research Institute of Mining and Metallurgy) used for the laser cladding on the surface of water-wall tubes of 20G steel was 250–300 mesh. The laser-cladding system used in the study was composed of a laser-cladding workbench, a pulsed fiber laser (ZKZM-2000, Xi’an, China) with power of 2000 W and beam spot of 1.4 mm in diameter as the energy source, a self-designed synchronous powder feeder. To prevent oxidation in cladding process, the powder of C22 was transported by carrier gas of argon with flow rate of 5 L/min. The laser-cladding parameter: power, 2000 W; scan speed, 5 cm/s, overlap rate: 50%, single-clad thickness: 500 μm. In order to reduce the effect of dilution rate on the corrosion resistance of the C22 laser coating, the thickness of the C22 coating prepared by multitrack cladding process was made 5 mm. The substrate of C22 laser coating was prepared from a 20G-steel water wall tube of diameter of 60 mm, which was polished and then degreased with acetone before cladding. Photograph of laser-cladding setup is shown in Figure 1a and C22 laser coating on the surface of 20G steel is shown in Figure 1b.
As a contrast, the materials of the industrial alloy of Hastelloy C22 and the water wall tube material of 20G steel were also investigated. The chemical compositions of C22 powder, the Hastelloy C22 alloy and 20G steel are shown in Table 1. The specimens of C22 laser coating and 20G steel were obtained from the top 2 mm of the laser-cladding coating and water wall tube of 20G steel, respectively, the specimens of C22 alloy were cut form a forge piece made of C22 alloy bar. All of specimens were cut into cubes of 20 mm × 10 mm × 2 mm approximately and grounded using emery papers of 200–1200 grit sizes, then specimens were washed with distilled water and cleaned with acetone. For test accuracy, three parallel samples were prepared for each specimen.

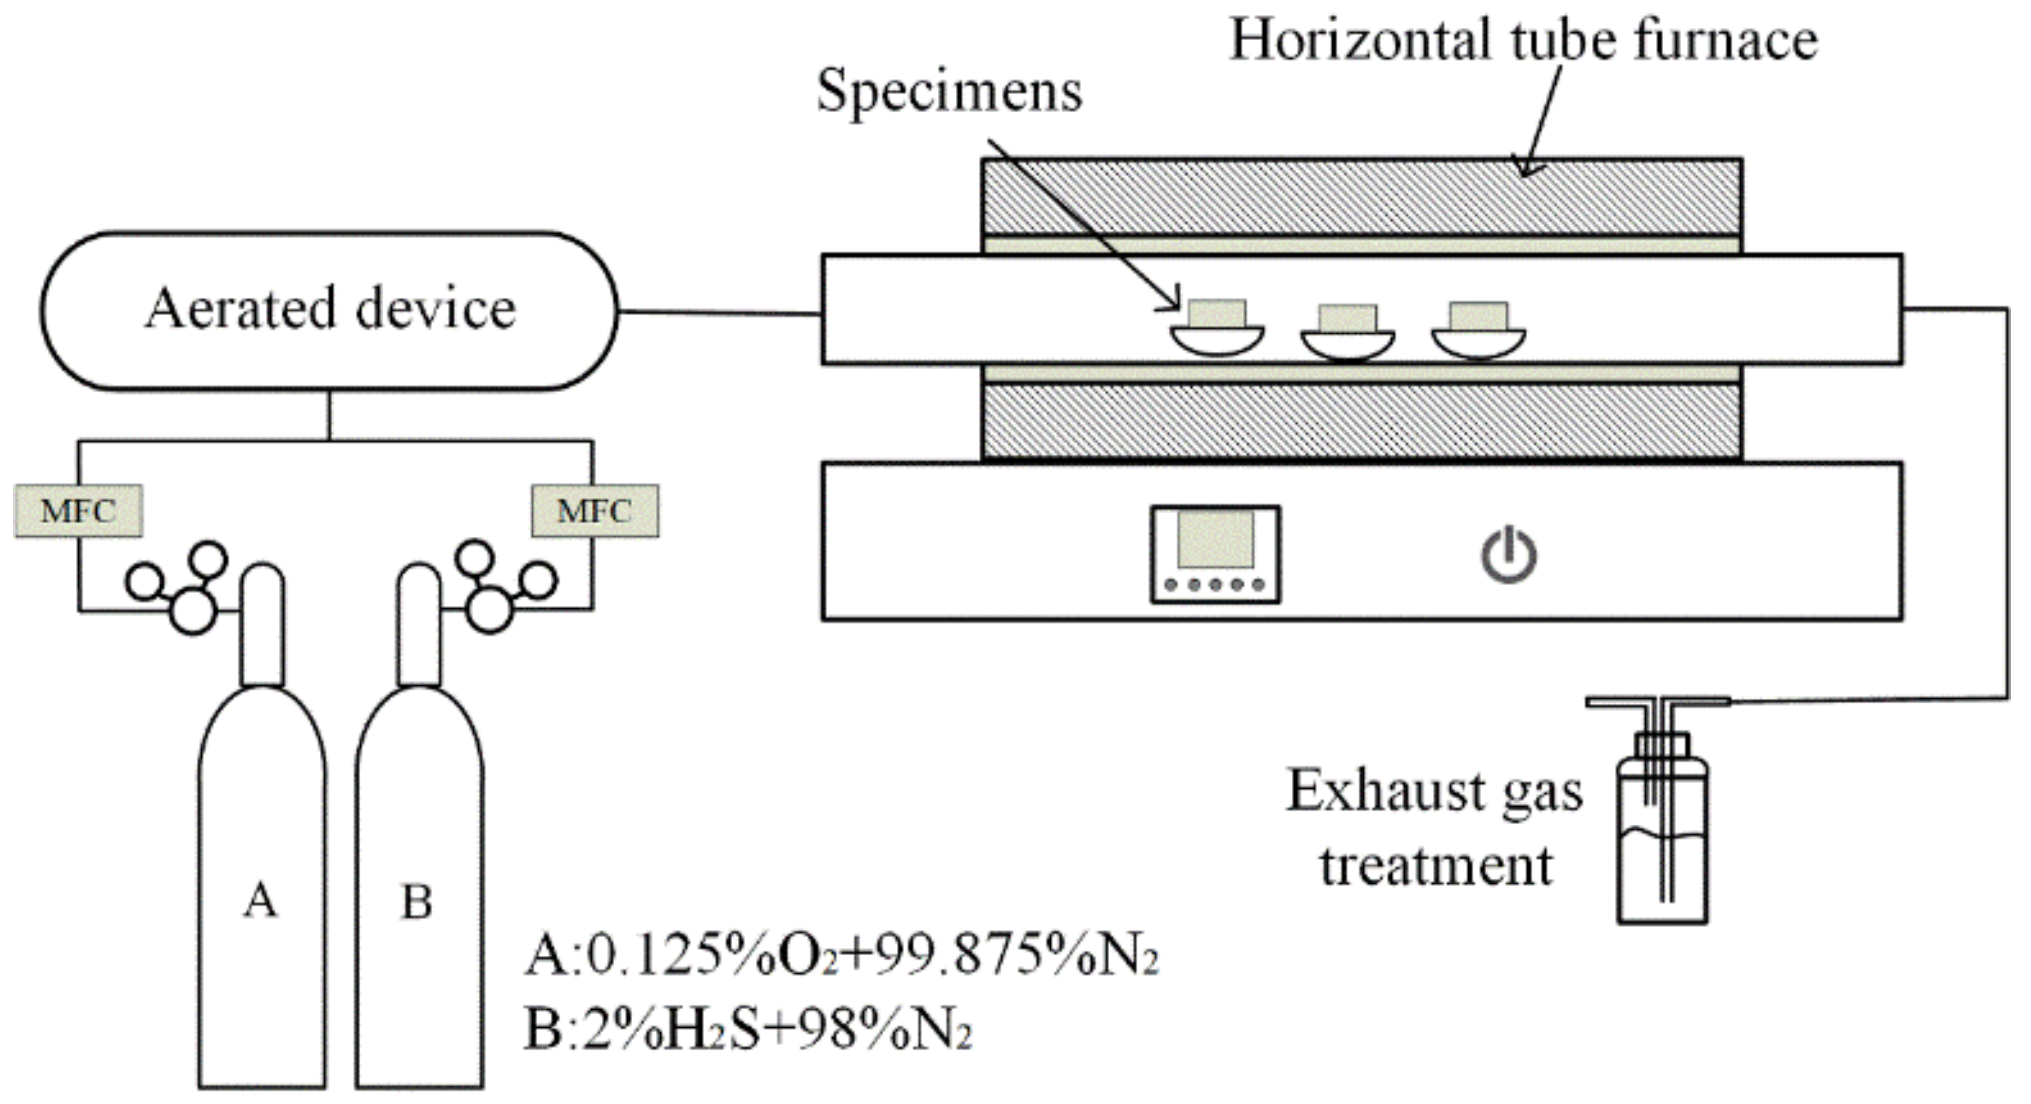
2.2. Hot Corrosion Studies

High temperature corrosion tests were carried out in a horizontal tube furnace equipped with an alundum tube which is shown in Figure 2 (as same with Xu et al. [8]). The reducing corrosion system was primarily comprised of three parts: preparation of reducing atmosphere, sophisticated temperature control and exhaust gas treatment. The preprepared gas was controlled by the mass flow controller (MFC) to enter the mixing device and form the reducing atmosphere. The mixed gas passed into the closed high-temperature quartz tube and corroded with the pretreated samples. A tubular resistance furnace was used to carry out the isothermal corrosion from 12 h a cycle up to 108 h at 450 °C. To avoid polluting the atmosphere, the flue gas from the quartz tube outlet was fed into the NaOH solution scrubber to remove the residual gas of H2S.
In low-NOx combustion, the corrosive medium near the low-NOx burner area was H2S and CO in the reducing atmosphere, and CO had a destructive effect on the protective film, forming a loose and porous FeO corrosion layer, and S and H2S could penetrate the oxide film and react directly with the substrate resulting in accelerating corrosion rate [37]. In the actual corrosion environment, the volume fraction of H2S gas was 0.05%–0.10%, volume fraction of O2 was less than 0.5% [4]. Meanwhile, in the reducing atmosphere, there was a large amount of CO about 5%–10% and a certain linear relationship with H2S [2]. The typical water wall temperature of pulverized-coal furnace was generally 400–450 °C. In order to study the effect of H2S on corrosion product of the materials of 20G, C22 alloy and C22 laser coatings in reducing atmosphere by low-NOx combustion in pulverized-coal furnaces, a mixture gas of 0.2 vol% H2S–0.1 vol% O2–N2 was used to simulate the gaseous corrosion of H2S at high temperature. Due to the low content of H2S and O2 in reducing corrosive atmosphere, H2S and O2 were premixed with N2 (balance gas) to reduce the experimental error, the mixing ratio column was shown in Figure 2 and the total gas flow rate in the experiment was 80 mL/min. The experimental temperature was set by a sophisticated temperature control instrument, which was connected to a thermocouple installed at the isothermal area of the horizontal tube furnace within error of ±1 °C and the experimental temperate was set at 450 °C. Because the samples stayed in a flowing reducing atmosphere, and isothermal zone of the horizontal tube furnace was in a restricted zone the crucible boat (80 mm × 20 mm × 15 mm) used to place the three parallel samples were fixed in the same place at the isothermal area to keep data consistency and experimental reproducibility.
Mass gain rate of corrosion was measured to evaluate the corrosion resistance of specimens according to the formula:
γ = Δ m A · T
where Δm is the average cumulative mass gain of three parallel specimens, i.e., the weight after the current corrosion minus the initial weight of the specimens, A is the average surface area of the parallel specimens measured prior to corrosion used screw-thread micrometer with the accuracy of 0.1 μm. T is the corrosion time, and γ is the mass gain per unit area. When a corrosion cycle was finished, the crucible boats were taken out immediately and left cooling to room temperature, then weighed used the electronic micro-balance with accuracy of 0.1 mg.
In order to determine the corrosion behavior of 20G steel, C22 alloy and C22 laser coating, the corrosion morphology and composition were observed through scanning electron microscopy (SEM, FEI Quanta 200F, Brno, Czech Republic) equipped EDS (EDAX, Mahwah, NJ, USA) after finishing the last corrosion cycle. The e-beam resolution of the EDS used was 123 eV. The acceleration voltage was set at 20 kV and the spot size of e-beam was about 1 μm. It had a detection limit of 0.1%. At the same time, in order to observe the corrosion morphology of cross section after corrosion, one of the three parallel samples was embedded in the epoxy resin. The embedded samples were wet-ground through successive emery papers of 200–1200 grit sizes followed by polishing, cleaning used alcohol and then observed by SEM and EDS. Phase identification of the corrosion products was performed on the bulk samples by Rigaku D/max-rA X-ray diffract meter (Tokyo, Japan) with Cu Kα radiation at 40 kV and 40 mA, between 2θ angles of 10° and 100° at a scanning rate of 8°/min.

3. Results

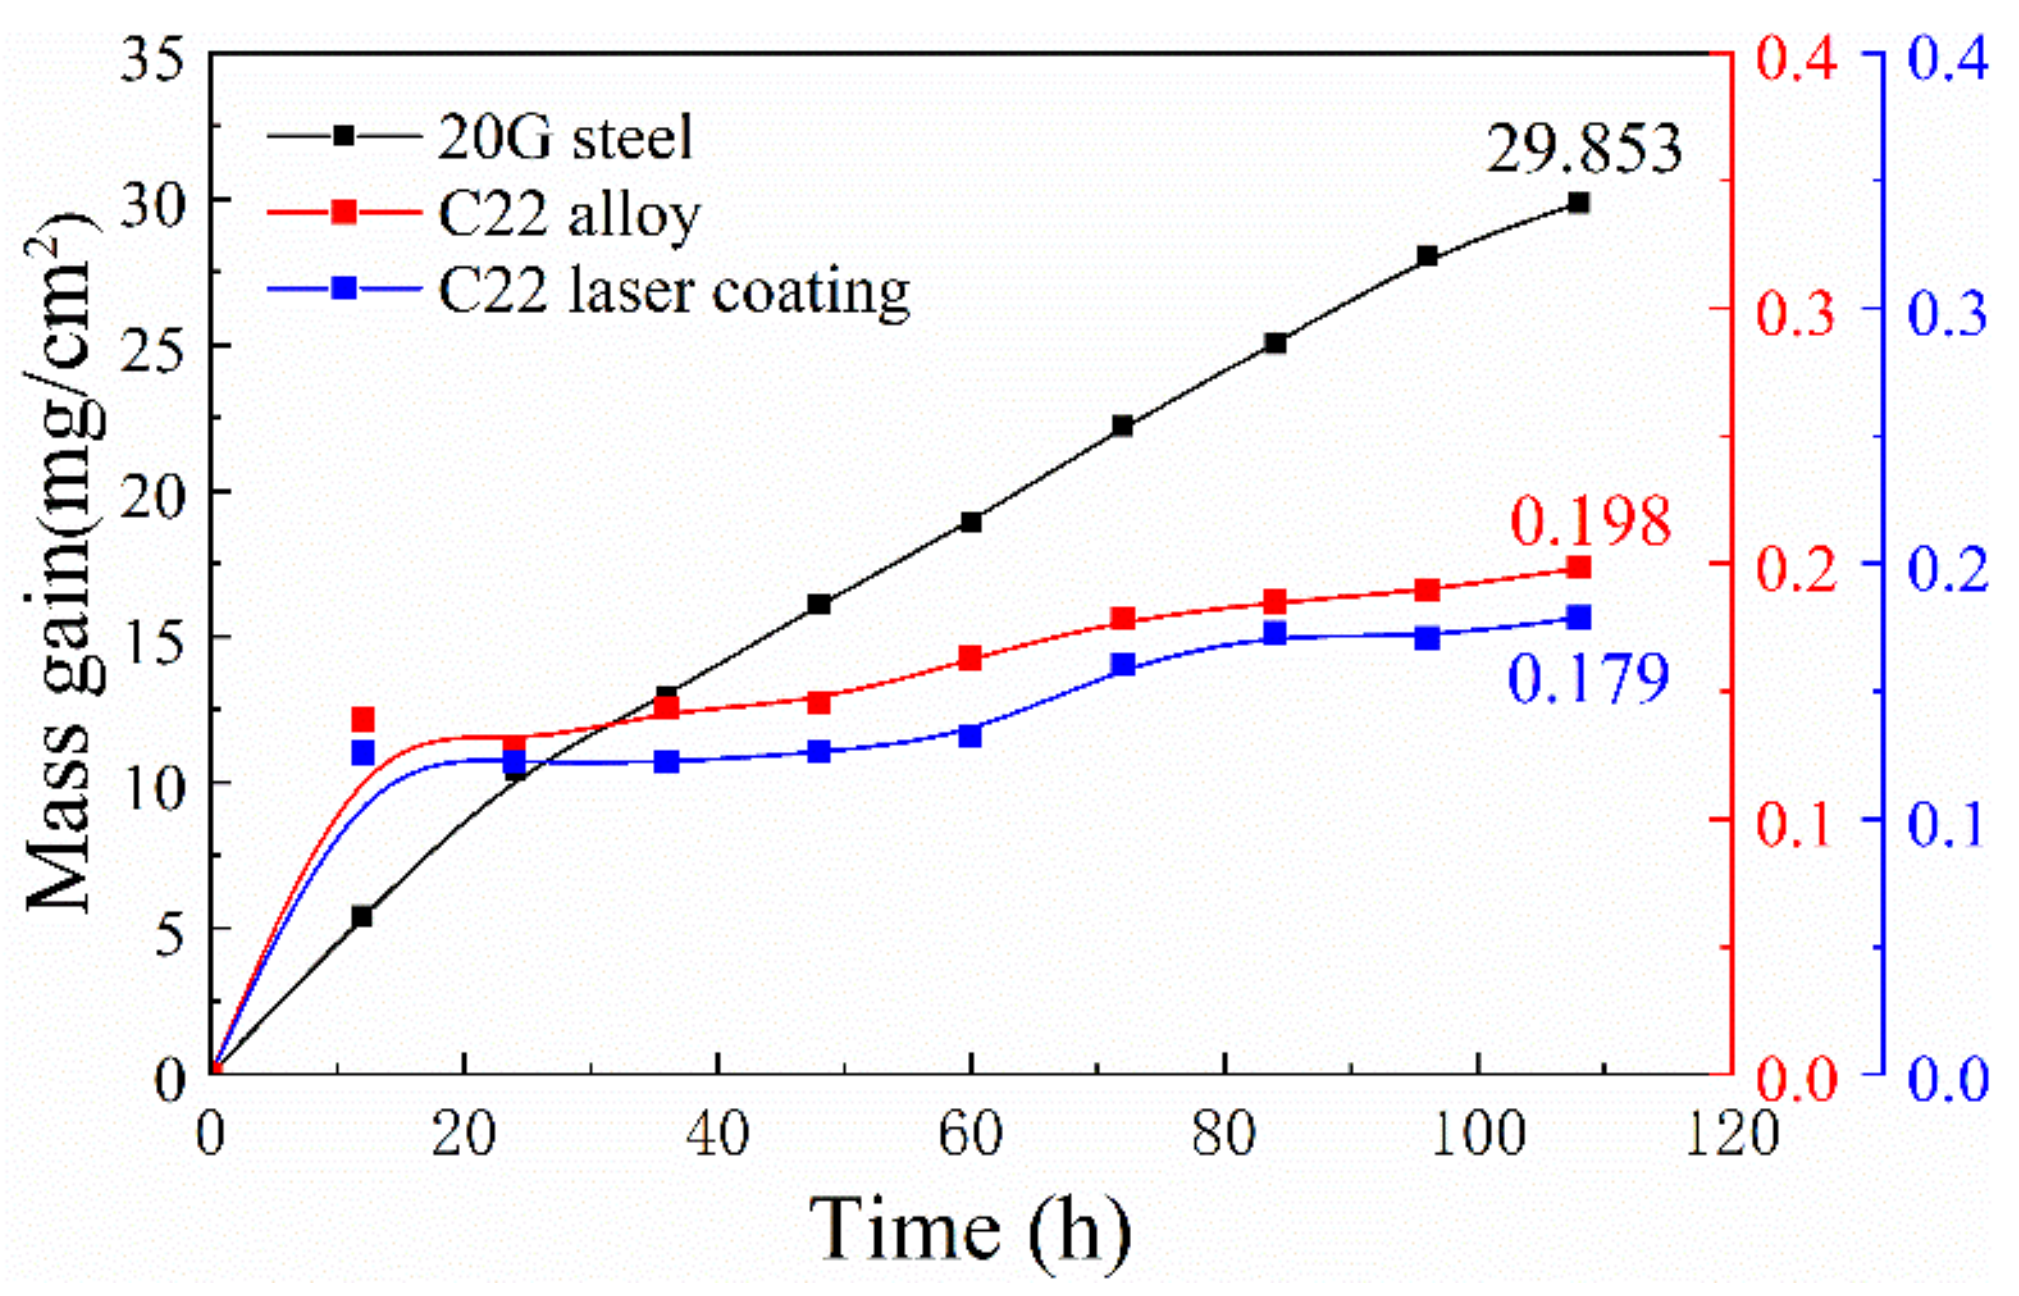
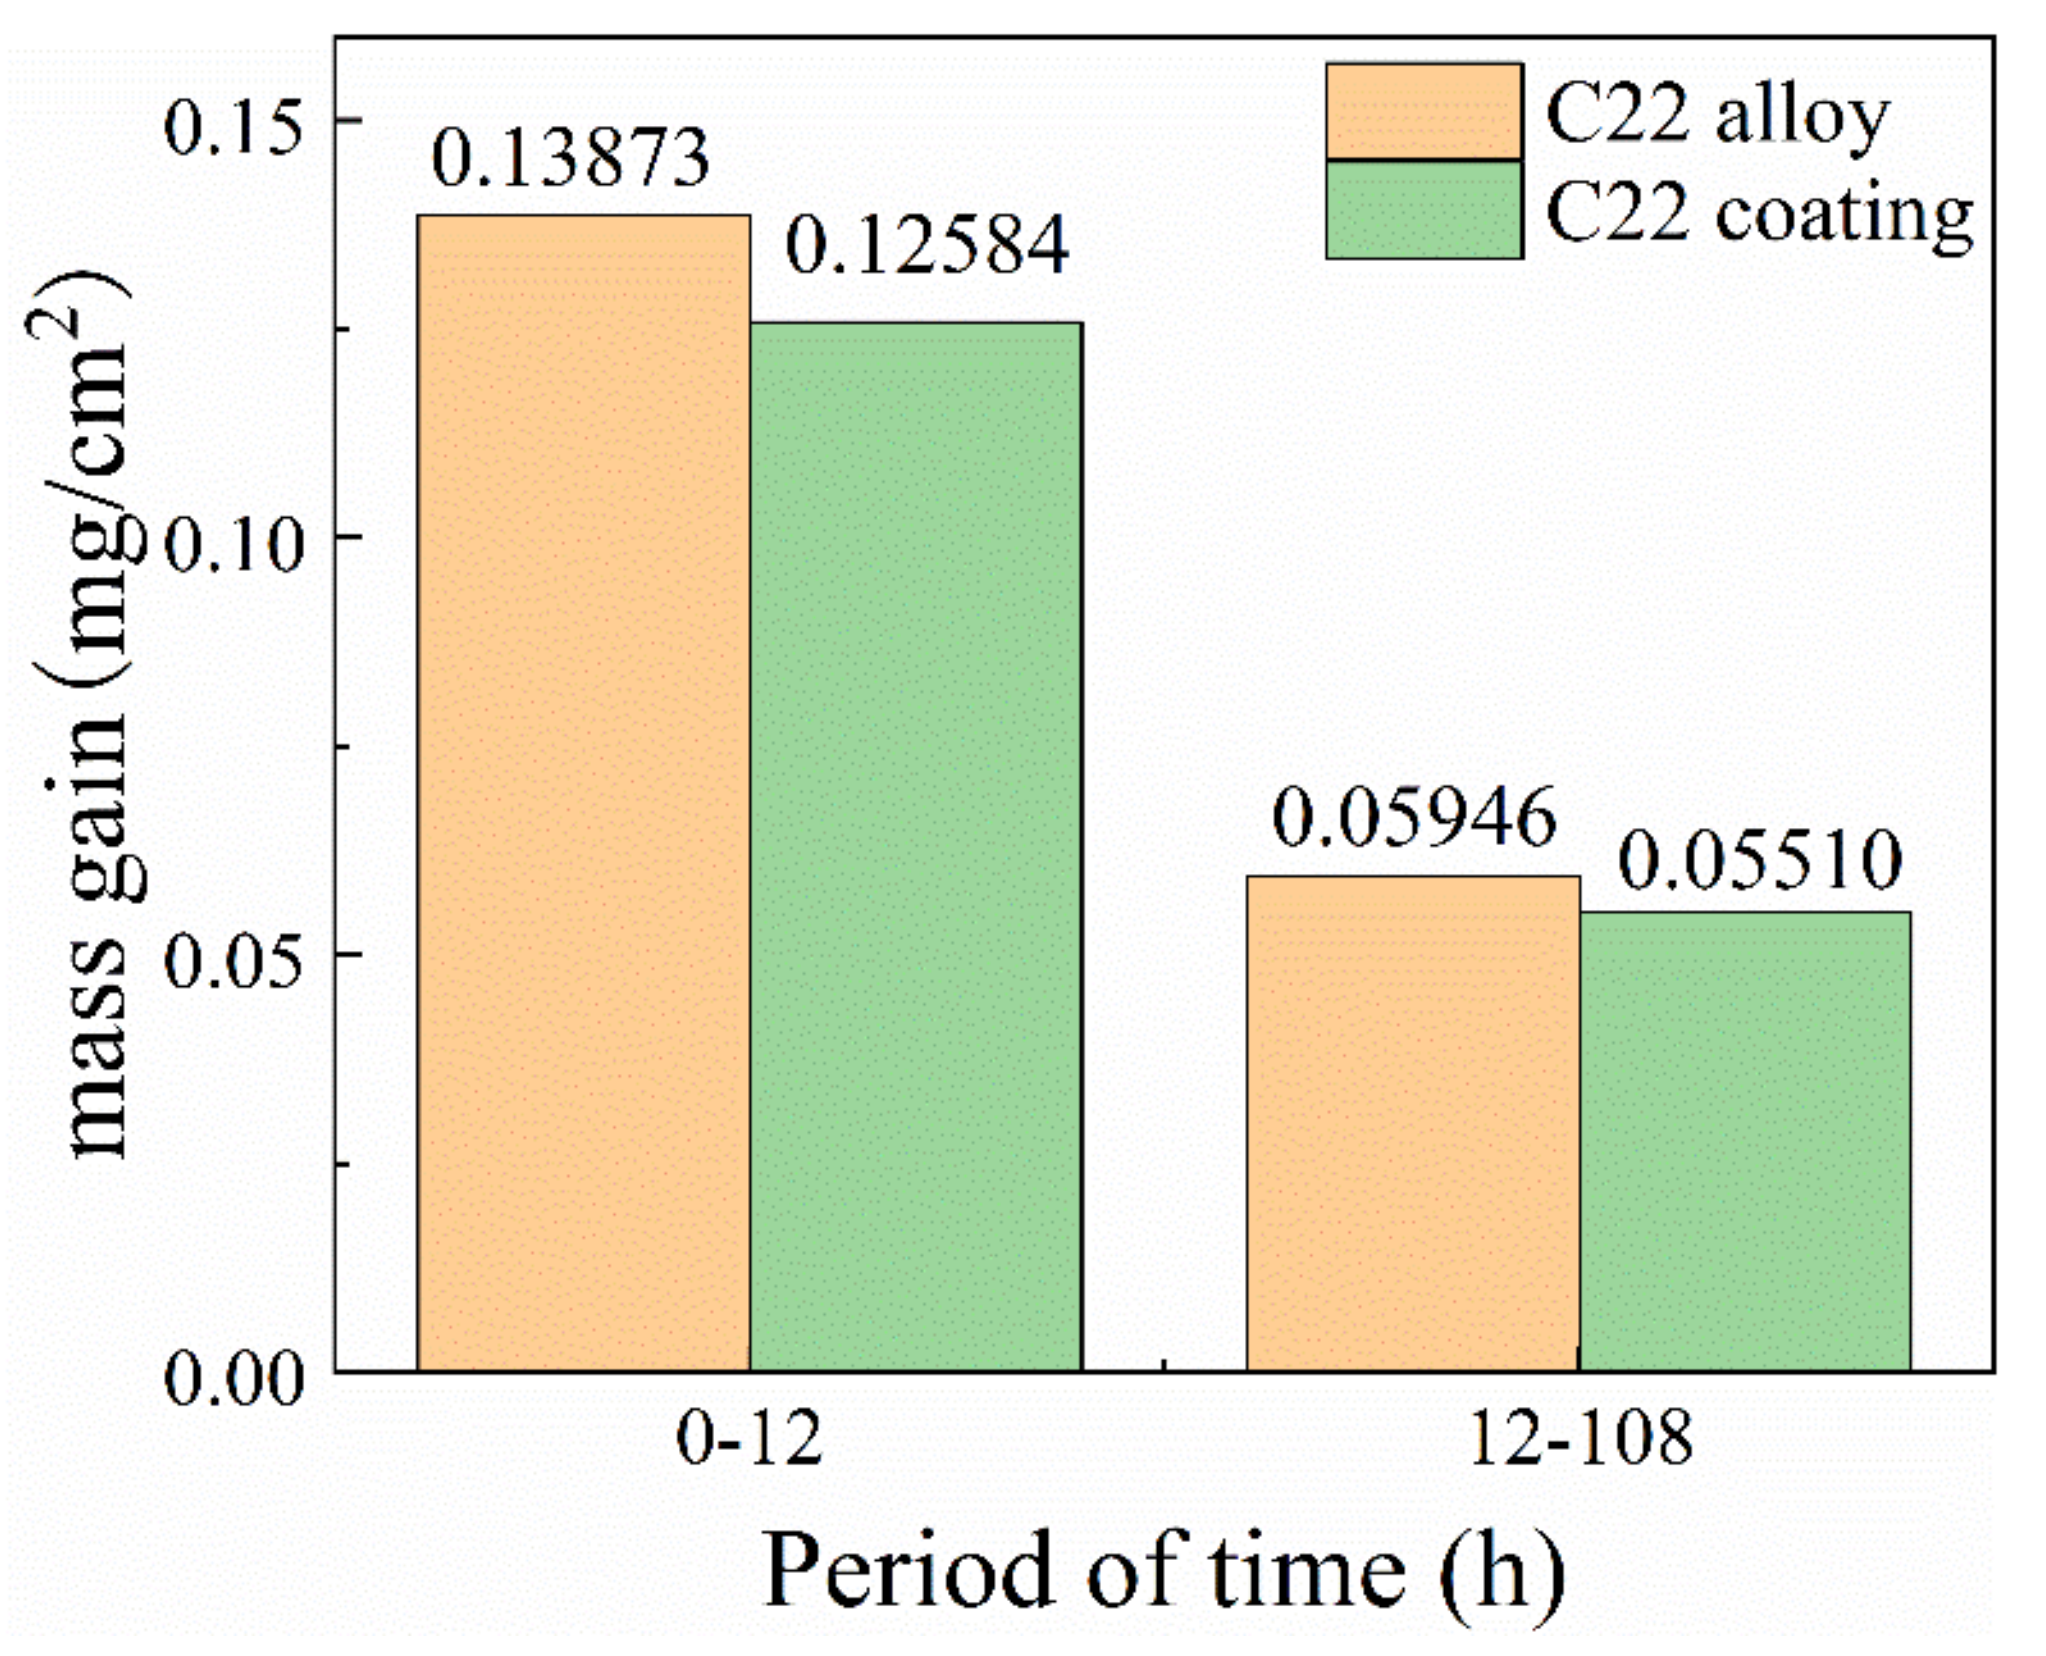
3.1. Corrosion Dynamics Curve

Figure 3 presents the average mass gain of 20G steel, C22 alloy and C22 laser coating corroded in reducing atmosphere composted with 0.2 vol% H2S–0.1 vol% O2–N2 for 108 h at 450 °C. As can be seen from Figure 3, there was a linear relationship between corrosion mass gain and time at temperature of 450 °C and the average corrosion rate was 2.76 × 10⁻¹ mg/(cm2·h). The corrosion regulation of C22 alloy and C22 laser coating was similar from the corrosion mass gain curve. The corrosion process was divided into two stages, the first stage was 0–12 h, C22 alloy and C22 laser coating had a significant corrosion mass gain (shown in Figure 4), and the corrosion rated were 1.156 × 10⁻² mg/(cm2·h), 1.048 × 10⁻² mg/(cm2·h), respectively. The second stage was 12–108 h, the corrosion mass gain of both tended to flatten out, and the slope of the corrosion weight gain curve of C22 alloy and C22 laser coating was not much different. In the second stage, the corrosion rate of C22 alloy and C22 laser coating were 6.194 × 10⁻⁴ mg/(cm2·h) and 5.740 × 10⁻⁴ mg/(cm2·h), respectively, which was far less than the corrosion mass gain in the first stage. As shown in Figure 3 and Figure 4, the corrosion resistance of C22 laser coating was better than that of C22 alloy, and the average corrosion rate of C22 laser coating was 1.68 × 10⁻³ mg/(cm2·h), which was less than1.84 × 10−3 mg/(cm2·h) of C22 alloy. At the same time, due to the good corrosion resistance of Ni and Cr [8], the corrosion rates of C22 alloy and C22 laser coating were lower by two orders of magnitude compared to the 20G steels.

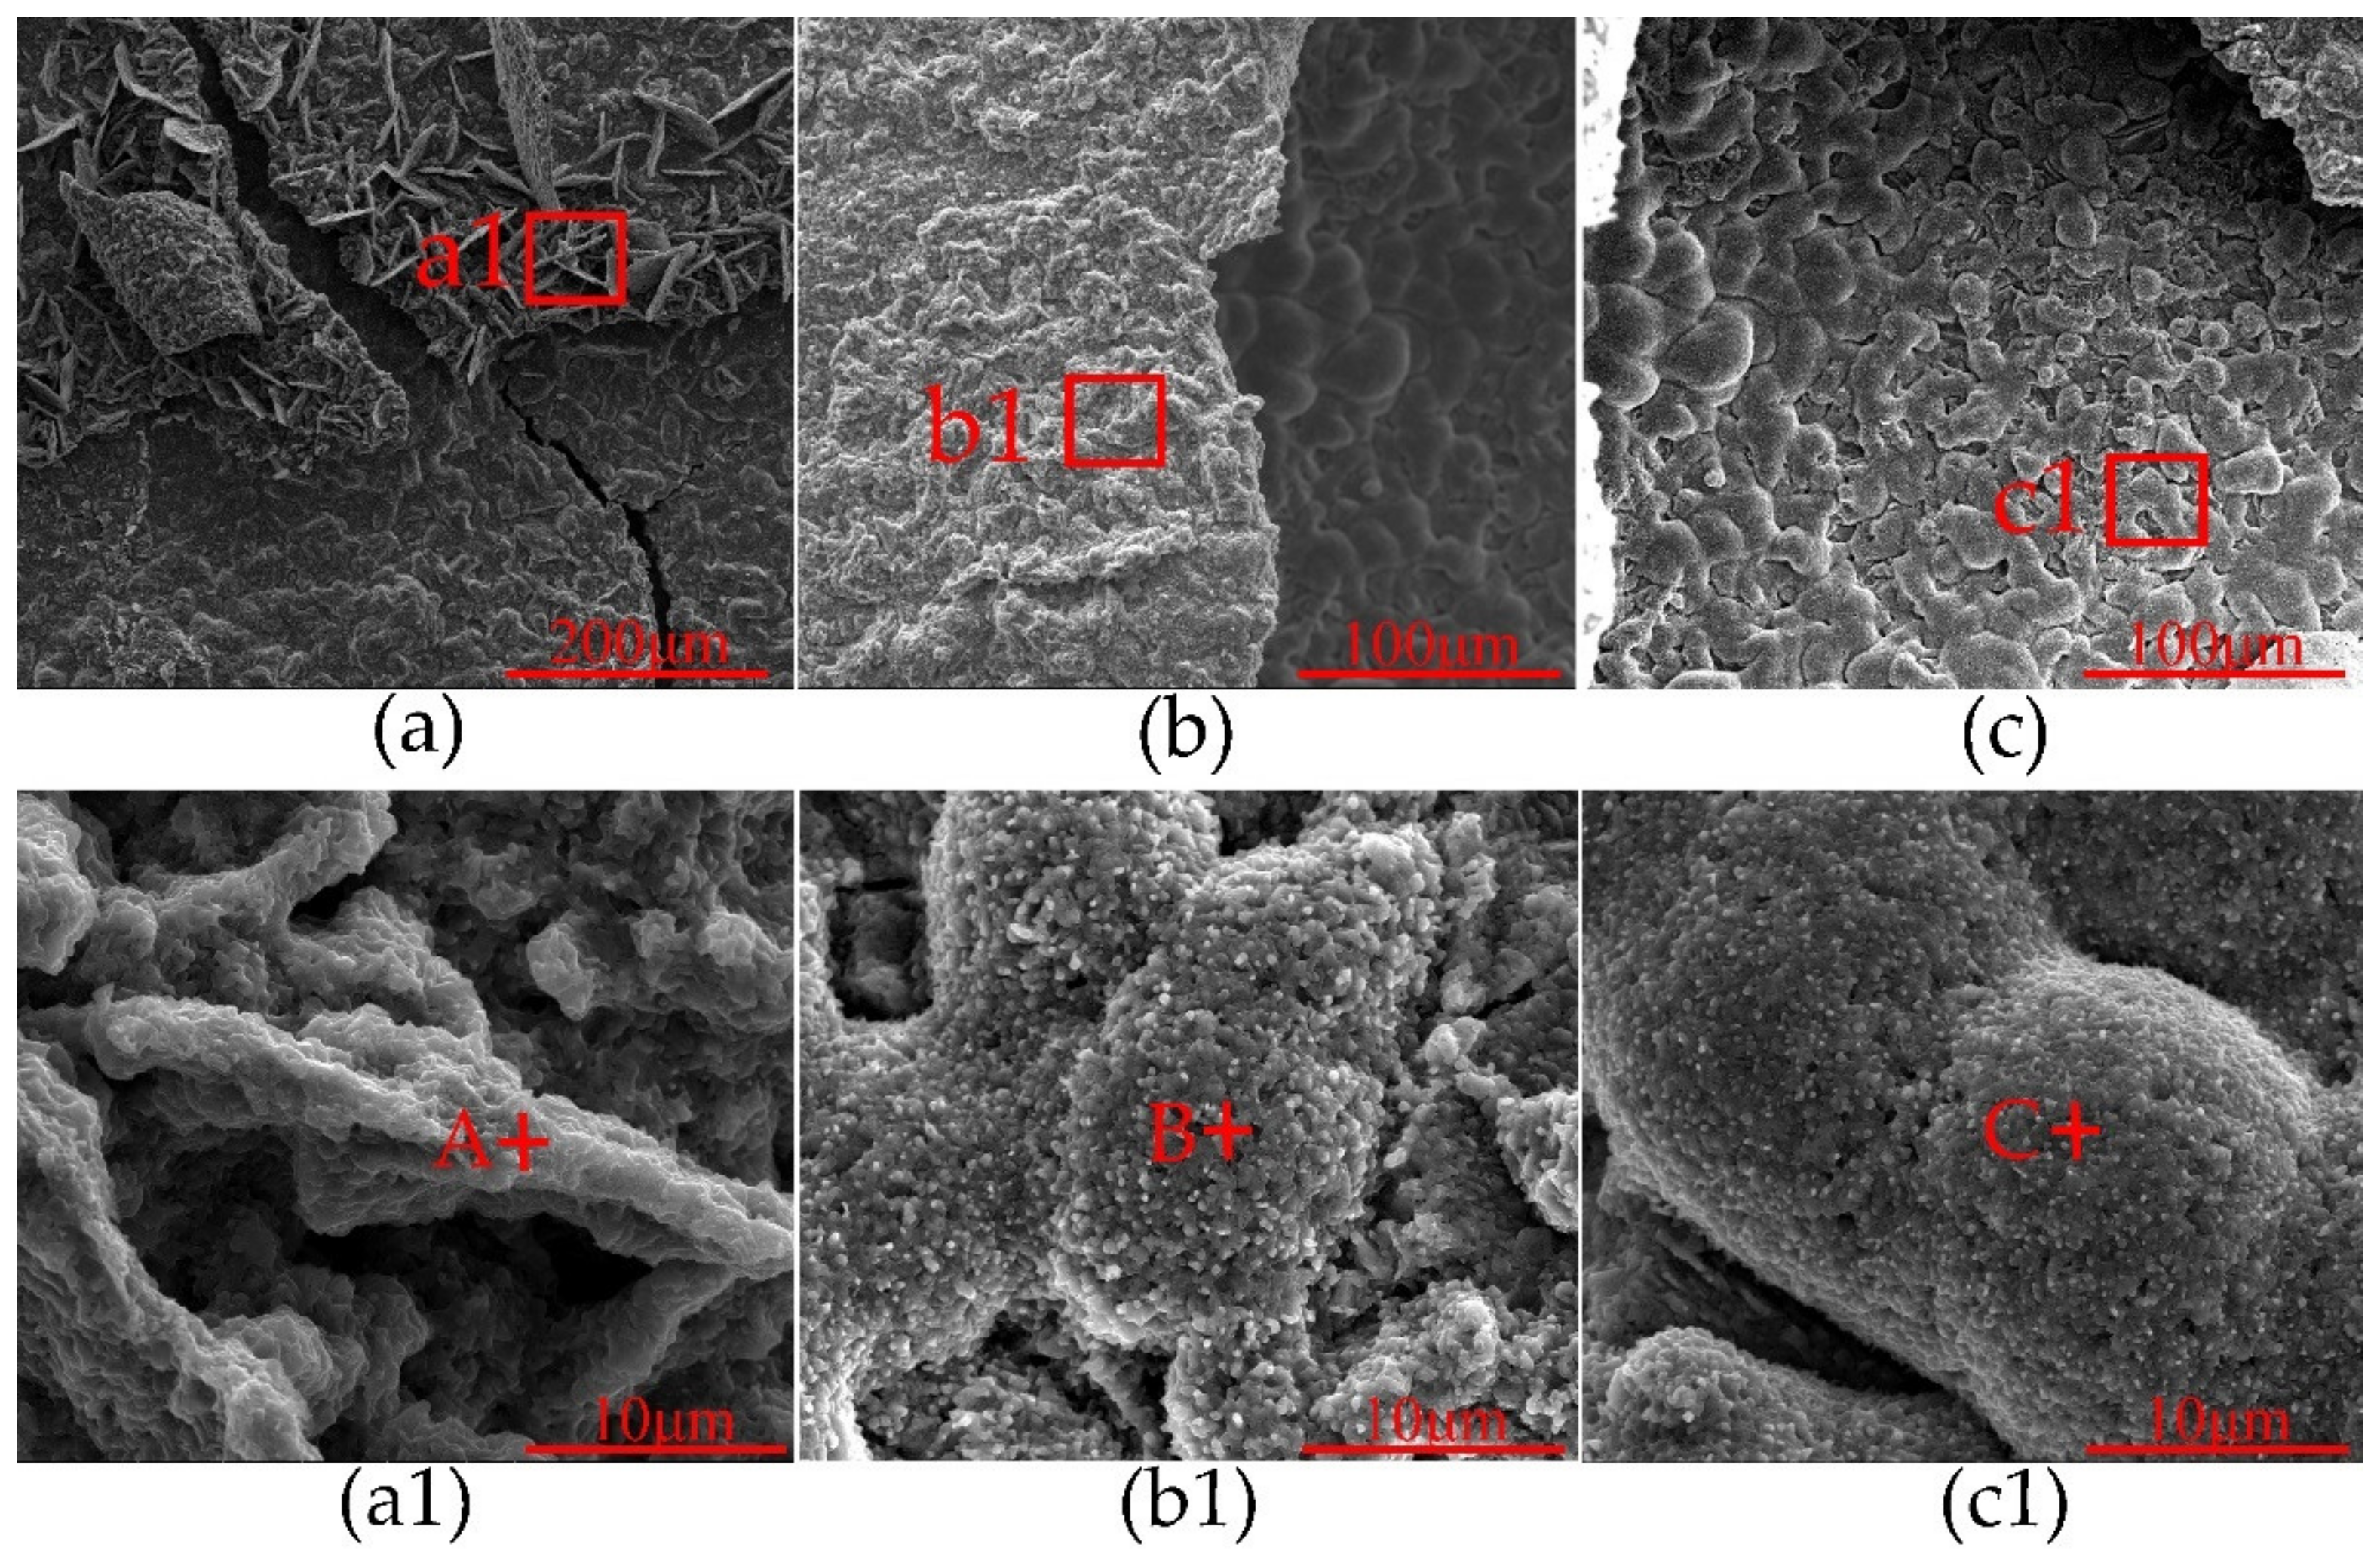
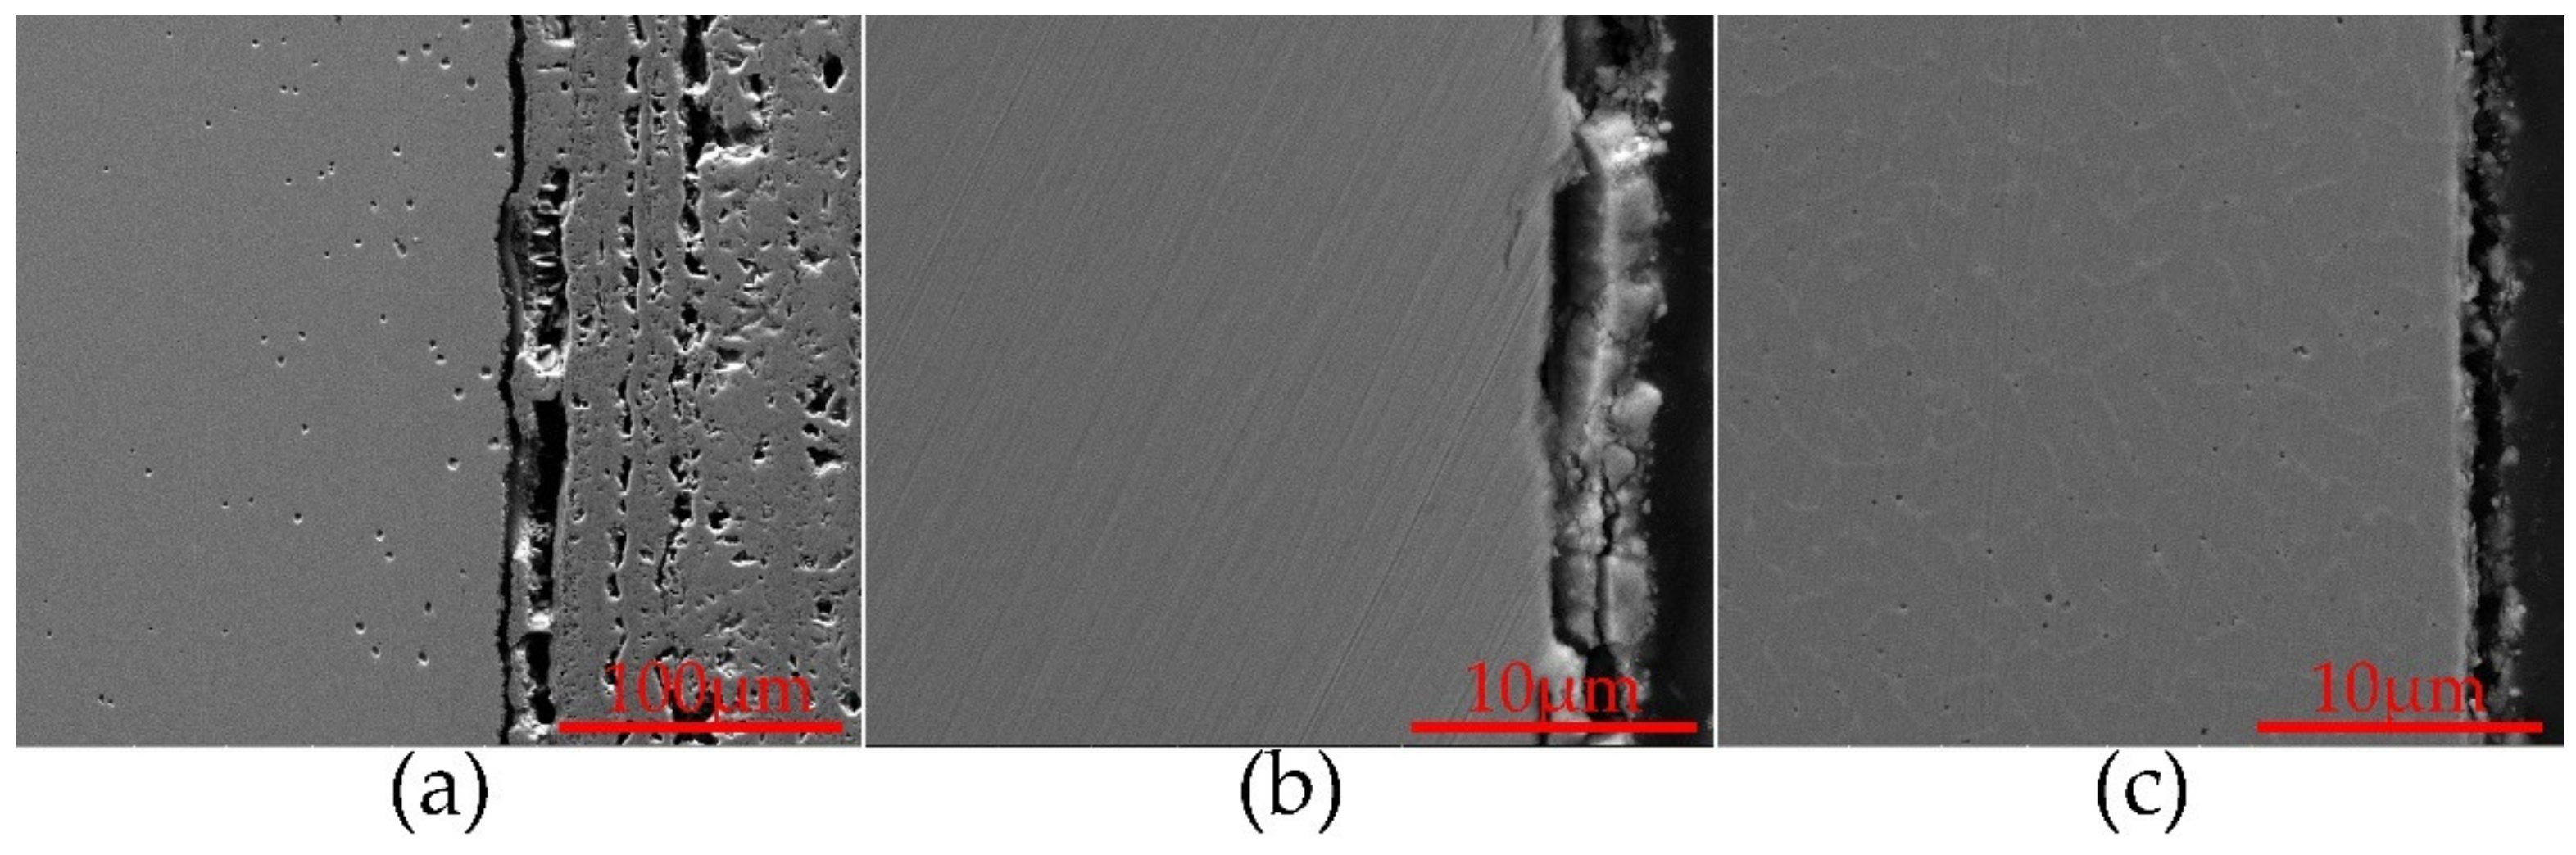
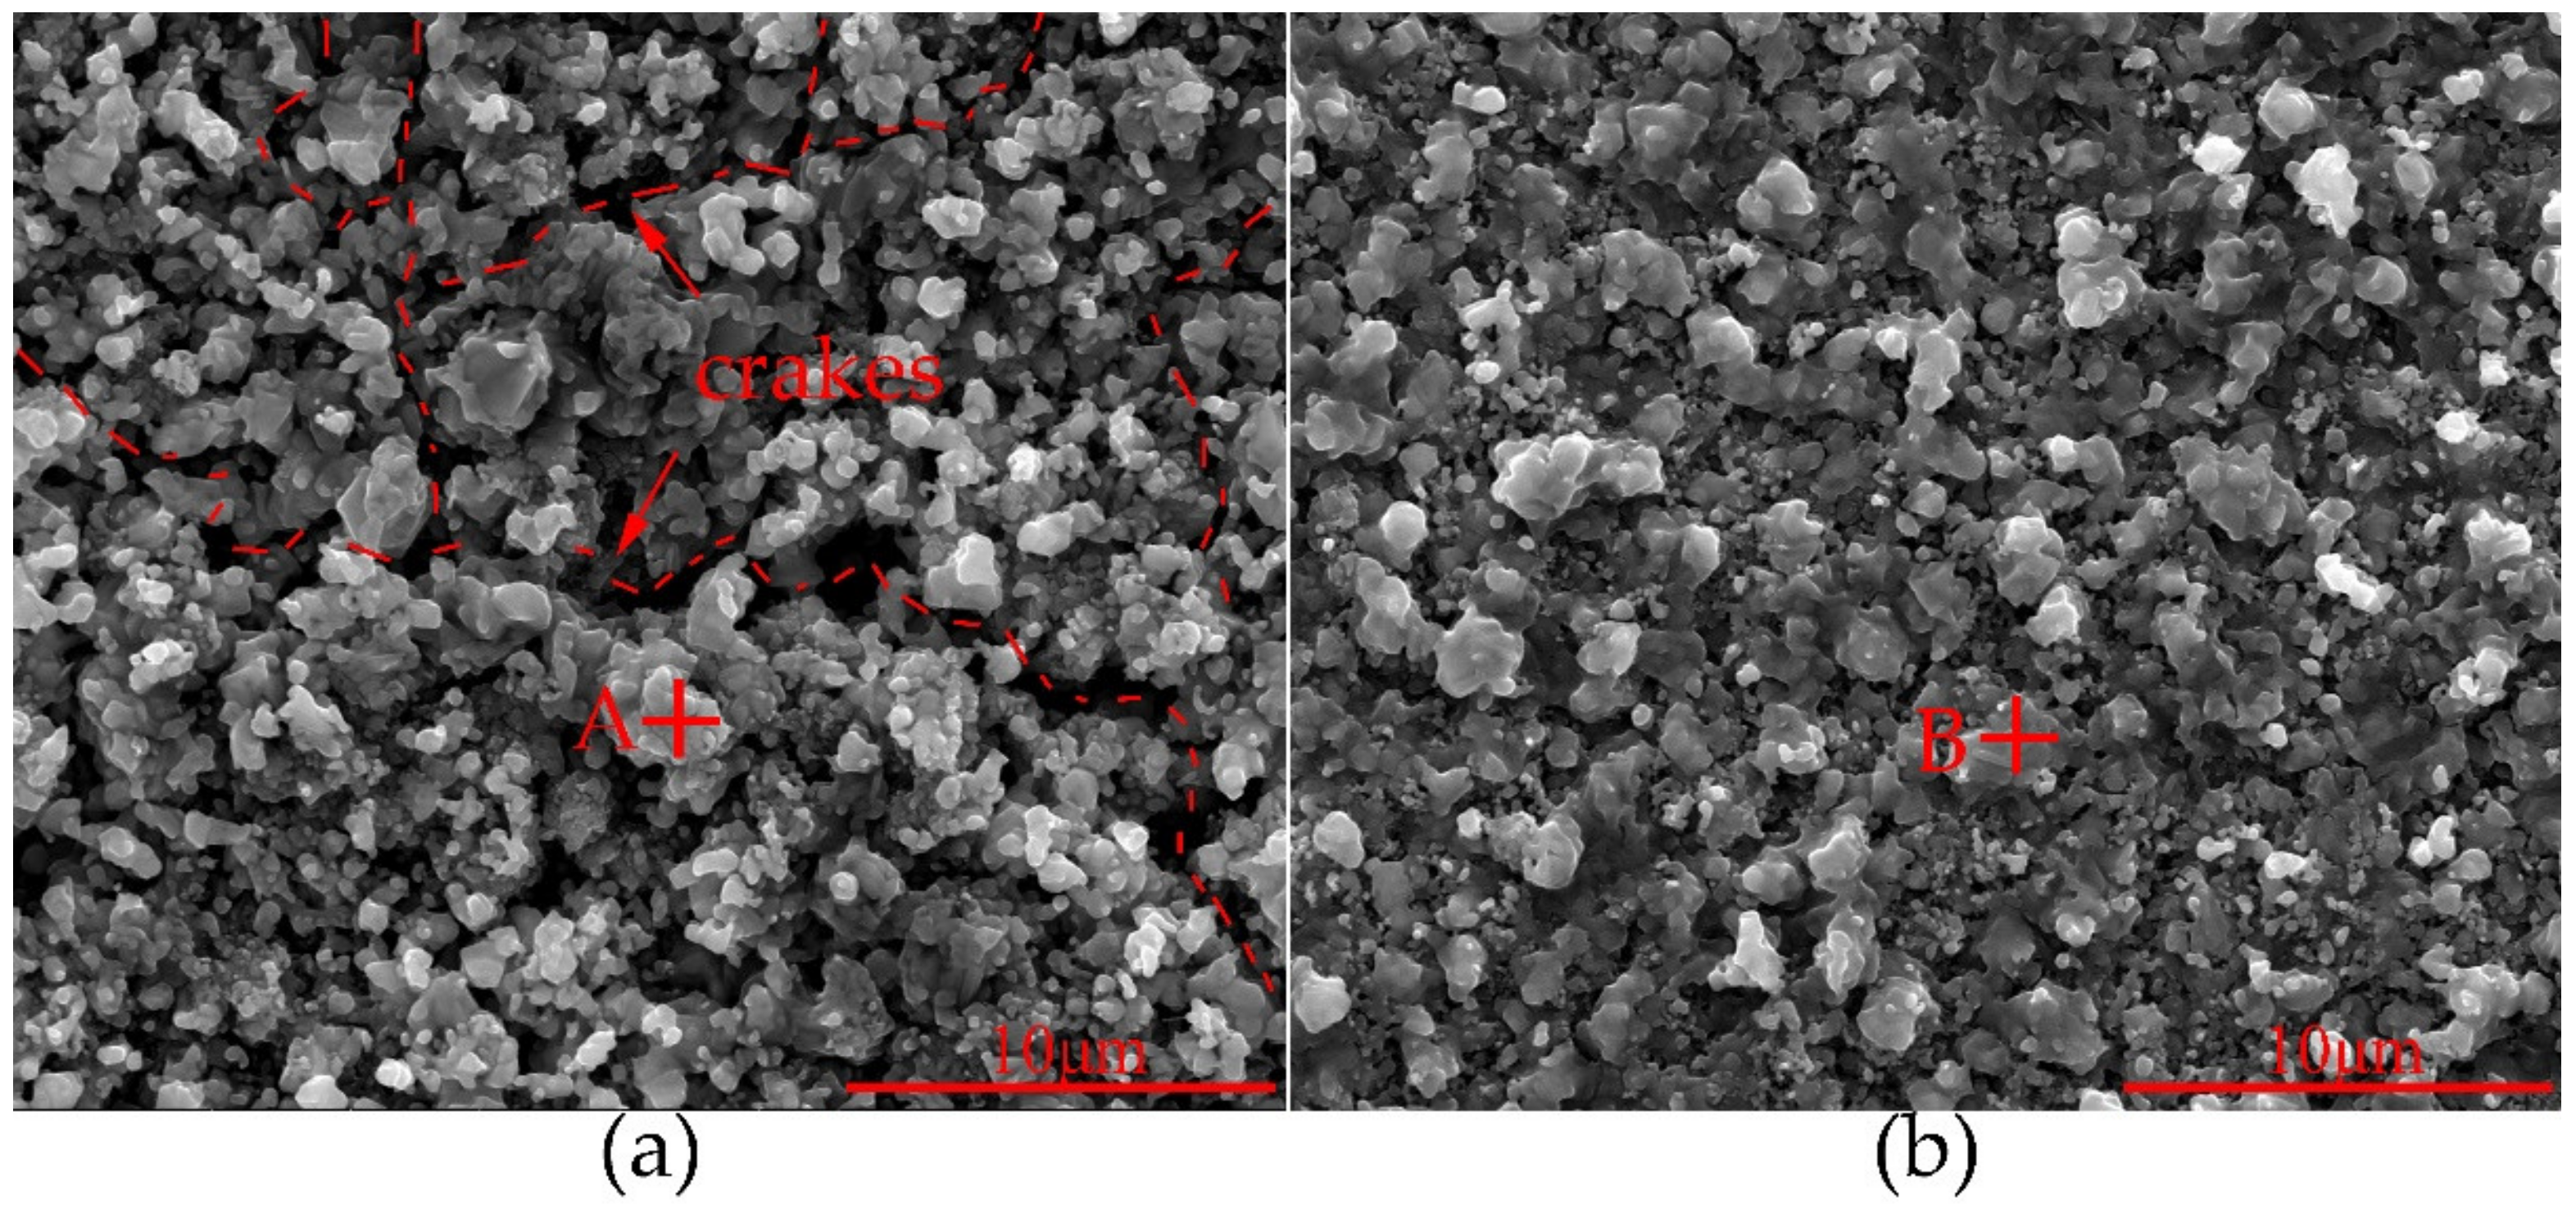
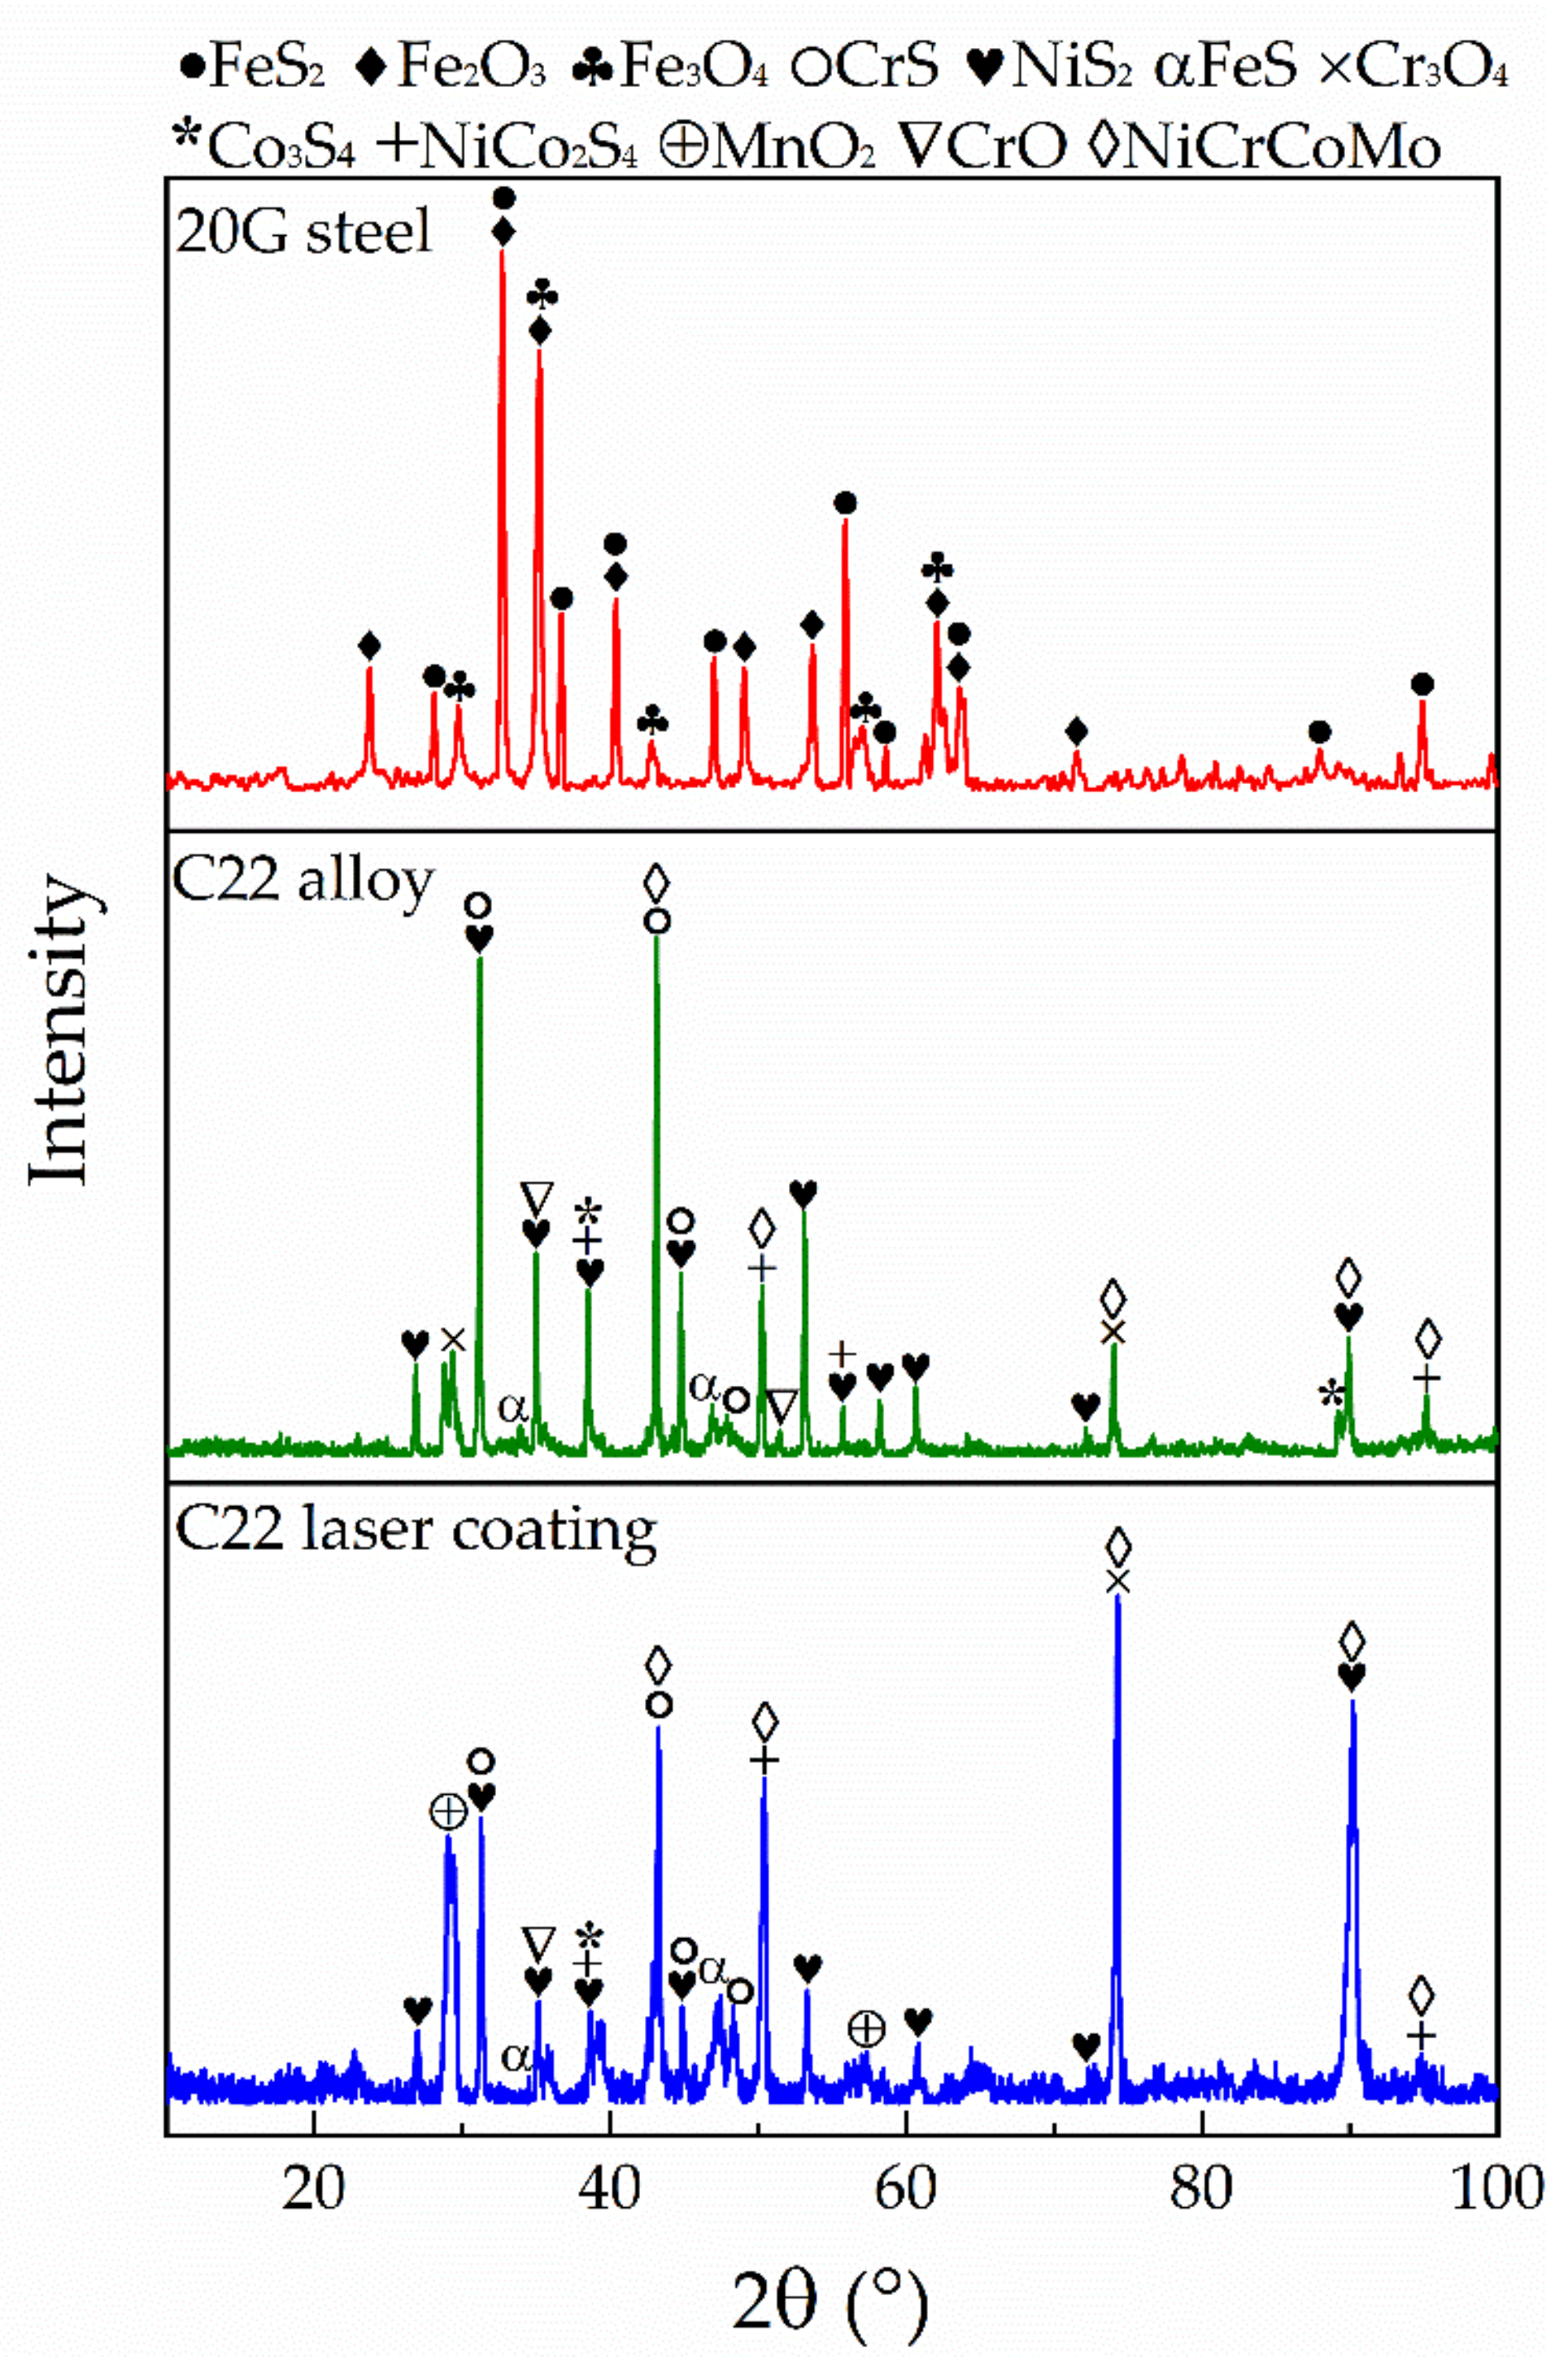
3.2. Corrosion of 20G Steel, C22 Alloy and C22 Laser Coating

Figure 5 shows the SEM surface micrographs of the corrosion products of 20G steel corroded in reducing environment of 0.2 vol% H2S–0.1 vol% O2–N2 for 108 h at 450 °C and Table 2 shows EDS spot scan results of the corrosion products of 20G steel. At test temperatures, the specimen surface was covered by three layers of corrosion products and some cracks were observed. The outermost layer of corrosion was covered with a large number of scale-like corrosion products, as shown in Figure 5a1; The surface of middle layer (Figure 5b1) and the innermost layer (Figure 5c1) were present as particle-shaped phases, while the difference of them was that the particle of the middle layer surface was coarser and the innermost layer was smaller and smoother. According to EDS results as shown in Table 2, the main components of the corrosion products of outmost layer and the middle layer was (Fe, O, S)-rich compositions, and (Fe, S)-rich compositions were identified as major phases in the corrosion products of the innermost layer. From the outmost layer to the innermost layer, the content of sulfur increased successively, while the content of oxygen decreased, and the innermost layer contains only elements Fe and S, no oxygen was found, which indicated that the substrate of 20G was first corroded to form sulfide of iron, then sulfides were oxidized by the oxygen with the corrosion time increased.
Figure 6 shows the SEM surface micrographs of the corrosion products of C22 alloy and C22 laser coating corroded in reducing environment of 0.2 vol% H2S–0.1 vol% O2–N2 for 108 h at 450 °C and Table 3 shows EDS spot scan results of the corrosion products. The corrosion behavior and corrosion products of C22 alloy and C22 laser coating exhibit very similar. The corrosion morphology both were particle-shaped, and the corrosion products were mainly composed of (Ni, Cr)-rich sulfides and some oxides. Compared with 20G-steel corrosion, the corrosion layers of C22 alloy and laser coating had no stratification and the surface corrosion products were denser than the 20G steel, which may be the reason that corrosion mass gains of C22 alloy and C22 laser coating were divided into two stages. In the early stage, the corrosion media of H2S and S penetrated more easily into the metal matrix. In the second stage of corrosion reaction, the osmotic pressure increased with the increase of corrosion products. However, since the corrosion products could not completely prevent the penetration of the corrosion media of H2S and S, the corrosion mass gain curve in the second stage was linear and the corrosion rate was lower than that in the first stage. At the same time, the corrosion products of C22 laser coating were denser than that of C22 alloy, and some cracks were observed as shown in Figure 6a, which may lead to the better corrosion resistance of C22 laser coating than C22 alloy (Figure 3) due to the refined microstructure of C22 laser coating [18,35].
Figure 7 displays the cross-sectional micrographs of 20G steel, C22 alloy and C22 laser coating corroded in reducing environment of 0.2 vol% H2S–0.1 vol% O2–N2 for 108 h at 450 °C. For the 20G steel (Figure 7a), there were obvious pitting pits near the substrate, which indicated that the corrosion mechanism of 20G steel was mainly pitting corrosion. Nonadherent products were found and there was a large number of pores in the corrosion products. Therefore, corrosion products were not protective, and the corrosion medium was still easy to react with the matrix, which could explain that why the corrosion dynamics curve of 20G steel was linear. Compared to 20G steel, the corrosion mechanism of C22 alloy (Figure 7b) and C22 laser coating (Figure 7c) presented uniform corrosion due to the, only the alloy surface was corroded, but no pitting corrosion was found. Moreover, the corrosion layer thickness of C22 alloy was thicker than that of C22 laser coating, because the corrosion products of C22 laser coating were denser than that of C22 alloy.
Figure 8 and Table 4 display the X-ray diffraction patterns of corrosion products formed on the surfaces of 20G steel, C22 alloy, C22 laser coating corroded in 0.2 vol% H2S-reducing environment for 108 h at 450 °C. A corrosion scale mainly composed of iron of oxides and sulfides, formed on the surface of 20G steel, and the Fe-rich peaks mainly correspond to Fe2O3, Fe3O4 and FeS2. Moreover, it could be found that the peaks of corrosion products of C22 laser coating and C22 alloy were the same, but the peak strength was different. At the same time, according to EDS resulted and XRD analysis, the major diffraction peaks correspond to NiS2, CrS and the sulfide (Co3S4, NiCo2S4) was identified and Cr3O4 and MnO2 were identified.

4. Discussion

The corrosion resistance of materials at high temperatures was dependent on the formation of protective oxide scales. H2S produced by low-nitrogen combustion in pulverized coal boilers is well known to be more corrosive than other oxidizing gases in high temperature corrosion, because it forms porous, nonadherent, sulfide scales that are not protective, which cause accelerated corrosion resulting in increased oxidation, metal wastage, internal attack.
For the 20G steel-corrosion in reduction atmosphere for 108 h at 450 °C, the corrosion process produced the porous, nonadherent, sulfide scale of surface of 20G steel (Figure 5 and Figure 7a), thus the corrosion products had no protective effect and the corrosion medium could be easy to pass through the corrosion products to directly corrode the substrate which resulted that corrosion dynamics curve was linear, and the corrosion rate was 2.76 × 10⁻¹ mg/(cm2·h). The main corrosion products of 20G were FeS2, Fe2O3, Fe3O4 and a large number of sulfurs condensed at the outlet of the furnace due to the decrease of temperature. The formation of sulfur was mainly caused by the oxidation of H2S and FeS2, the reaction equation was shown as follows the Equations (2) and (3) ( Δ G 450 ° C was the change of Gibbs free energy of the reaction equation) [9]:
3 FeS 2 + 2 O 2 Fe 3 O 4 + 6 S ,   Δ G 450 ° C = 466.461 kJ
4 FeS 2 + 3 O 2 2 Fe 2 O 3 + 8 S ,   Δ G 450 ° C = 715.410 kJ
2 H 2 S + O 2 2 S + 2 H 2 O ,   Δ G 450 ° C = 326.089 kJ
According to the SEM and XRD, the corrosion products were divided into three layers, the corrosion product of innermost layer was mainly fine and particle-shaped FeS2, without the presence of oxide, which indicts that reaction with matrix of 20G steel was mainly S and H2S, and the corrosion product was FeS2. Due to the co-existence of S and H2S, the corrosion reaction of the innermost layer of 20G steel was as follows the Equations (5) and (6):
Fe + 2 H 2 S FeS 2 + 2 H 2 ,   Δ G 450 ° C = 46.228 kJ
Fe + 2 S FeS 2 ,   Δ G 450 ° C = 135.453 kJ
In the intermediate layer of the corrosion product, the corrosion product became rough, but it was still granular, and the presence of oxygen element was found in the corrosion product and according to XRD analysis, the oxides were mainly Fe2O3 and Fe3O4, which resulted from the oxidation of the innermost corrosion product of FeS2 by oxygen in the gas. As the corrosion time increased, the FeS2 in the corrosion layer was further oxidized and the and the morphology of the corrosion products changed from granular to scale-like. Thus, the corrosion reaction of the intermediate and outermost layer of 20G steel was as follows Equations (2), (3) and (7):
4 Fe 3 O 4 + O 2 6 Fe 2 O 3 ,   Δ G 450 ° C = 280.383 kJ
According to Δ G 450 ° C of Equations (5) and (6), although both H2S and S could react with Fe, S was easier to react with Fe compared with H2S, so S corrosion dominated in the corrosion process of 20G steel.
As shown in Figure 3, the corrosion rates of the C22 alloy and the C22 laser coating were 1.8351 × 10⁻³ mg/(cm2·h) and 1.6755 × 10⁻³ mg/(cm2·h), respectively, while the corrosion rate of 20G steel was 2.764 × 10⁻¹ mg/(cm2·h). The corrosion resistance of the C22 alloy and the C22 laser coating was increased significantly as compared with that of 20G steel. At the same time, the fine granular corrosion products were distributed on the surface of C22 alloy and the C22 laser coating, but the corrosion products of C22 laser coating were denser than that of C22 alloy, resulting in a better corrosion resistance due to the refined microstructure of C22 laser coating [18,35] as shown in Figure 5 and Figure 7.
The corrosion process of the C22 alloy and the C22 laser coating divided into two stage and Figure 4 shows the difference of mass gain between the two stages of the corrosion reaction. In the first stage of the reaction, H2S and S contacted with the metal matrix directly and form the corrosion products easily—resulting in a high corrosion rate. In the second stage, the osmotic pressure of H2S decreased with the increasing of corrosion products, which leads to a slow diffusion rate of H2S to metal matrix [8], thus the corrosion rate of the second stage was slower than that of the first stage.
According to XRD analysis (Figure 8), the corrosion products of C22 alloy and C22 laser coating were the same, consisting of sulfide (mainly composed NiS2 and CrS with some less Co3S4, NiCo2S4, Cr2S3) and oxide (Cr3O4 and MnO2). Moreover, large amounts of sulfur were deposited at the outlet of the furnace due to the low temperature during corrosion like the corrosion of 20G steel, thus the corrosion medias in the corrosion process of C22 alloy and C22 laser coating were S, H2S, O2. Therefore, according to the corrosion process of 20G, the corrosion equation of C22 could be deduced as follow the Equations (4) and (8)–(15):
Ni + 2 H 2 S NiS 2 + 2 H 2 ,   Δ G 450 ° C = 18.679 kJ
Cr + H 2 S CrS + H 2 ,   Δ G 450 ° C = 94.431 kJ
2 Cr + 3 H 2 S Cr 2 S 3 + 3 H 2 ,   Δ G 450 ° C = 221.838 kJ
3 Co + 4 H 2 S Co 3 S 4 + 4 H 2 ,   Δ G 450 ° C = 124.473 kJ
2 Ni + 2 S NiS 2 ,   Δ G 450 ° C = 107.903 kJ
Cr + S CrS ,   Δ G 450 ° C = 139.043 kJ
2 Cr + 3 S Cr 2 S 3 ,   Δ G 450 ° C = 355.676 kJ
3 Co + 4 S Co 3 S 4 ,   Δ G 450 ° C = 302.923 kJ
Like the corrosion of 20G steel, the S corrosion dominated in the corrosion process of C22 alloy and C22 laser coating at 450 °C according Δ G 450 ° C of Equations (8)–(15). Moreover, because the corrosion layer was very thin, there was no obvious stratification of the corrosion products of C22 alloy and C22 laser coating (the separation between the corrosion layer and the matrix was due to the external force during grinding process).

5. Conclusions

High temperature corrosion test of 20G steel, C22 alloy and C22 laser coating was conducted in 0.2 vol% H2S–0.1 vol% O2–N2 at 450 °C (Simulating low-NOx combustion in pulverized-coal furnaces). The corrosion mass gain curve of 20G steel in the reducing atmosphere was linear. The corrosion process mainly produces FeS2, Fe2O3 and Fe3O4 which were porous and nonadherent without protection, and the corrosion mechanism was pitting. The nominal composition and corrosion products of C22 alloys was similar with that of C22 laser coating and the corrosion products of C22 alloy of C22 laser coating includes sulfide (mainly composed NiS2 and CrS) and oxide (Cr3O4 and MnO2). At the same time, the corrosion resistance of C22 laser coating was better than of C22 alloy due to the refined microstructure of C22 laser coating. Consequently, the C22 coating fabricated by laser-cladding method on the surface of 20G was an effective method to improve the corrosion resistance of it.

Author Contributions

Conceptualization, Z.L. and C.L.; methodology, C.L.; formal analysis, C.L. and Y.G.; investigation, C.L.; resources, Z.L., C.Z.; writing—original draft preparation, C.L.; supervision, Z.L.; project administration, Z.L.; funding acquisition, Z.L. All authors have read and agreed to the published version of the manuscript.

Funding

This research was funded by the Fundamental Research Funds for the Central Universities, Grant No. 2019QN030 and 2017XS059.

Conflicts of Interest

The authors declare no conflicts of interest. The funders had no role in the design of the study; in the collection, analyses or interpretation of data; in the writing of the manuscript or in the decision to publish the results.

References

  1. Fan, W.; Lin, Z.; Kuang, J.; Li, Y. Impact of air staging along furnace height on NOx emissions from pulverized coal combustion. Fuel Process. Technol. 2010, 91, 625–634. [Google Scholar] [CrossRef]
  2. Flamma, M. Low NOx combustion technologies for high temperature applications. Energy Convers. Manag. 2001, 42, 1919–1935. [Google Scholar] [CrossRef]
  3. Javed, M.T.; Irfan, N.; Gibbs, B.M. Control of combustion-generated nitrogen oxides by selective non-catalytic reduction. J. Environ. Manag. 2007, 83, 251–289. [Google Scholar] [CrossRef] [PubMed]
  4. Yang, W.; You, R.; Wang, Z.; Zhang, H.; Zhou, Z.; Zhou, J.; Guan, J.; Qiu, L. Effects of near-wall air application in a pulverized-coal 300 MWe utility boiler on combustion and corrosive gases. Energy Fuels 2017, 31, 10075–10081. [Google Scholar] [CrossRef]
  5. Chou, S.F.; Daniel, P.L.; Blazewicz, A.J.; Dudek, R.F. Hydrogen sulfide corrosion in low-NOx combustion systerms. J. Mater. Energy Syst. 1986, 7, 361–369. [Google Scholar] [CrossRef]
  6. Zhou, H.; Yang, Y.; Dong, K.; Liu, H.; Shen, Y.; Cen, K. Influence of the gas particle flow characteristics of a low-NOx swirl burner on the formation of high temperature corrosion. Fuel 2014, 134, 595–602. [Google Scholar] [CrossRef]
  7. Harb, J.N.; Smith, E.E. Fireside corrosion in pc-fired boilers. Prog. Energy Combust. Sci. 1990, 16, 155–190. [Google Scholar] [CrossRef]
  8. Xu, L.-G.; Huang, Y.-J.; Wang, J.; Zou, L.; Yue, J.-F. High-temperature corrosion properties of water wall material 15CrMoG under reducing atmosphere. J. Zhejiang Univ. (Eng. Sci.) 2018, 52. [Google Scholar] [CrossRef]
  9. Zhao, Q.; Zhang, Z.; Cheng, D.; Wang, Y.; Deng, X. High temperature corrosion of water wall materials T23 and T24 in simulated furnace atmospheres. Chin. J. Chem. Eng. 2012, 20, 814–822. [Google Scholar] [CrossRef]
  10. Xu, W.; Tan, H.; Liu, Y.; Wei, B.; Hui, S.e. Research on determination of high temperature corrosion tendency of water walls and limiting concentration range of H2S near walls. Electr. Power 2018, 51. [Google Scholar] [CrossRef]
  11. Jones, R.H.; Baer, D.R.; Windisch, J.C.F. Corrosion enhanced enrichment of sulfur and implications for alloy 22. In Proceedings of the NACE International Corrosion Conference, San Diego, CA, USA, 12–16 March 2006. [Google Scholar]
  12. Petrov, A.I.; Razuvaeva, M.V. Stress corrosion cracking of metals and alloys in aggressive H2S–CO2–Cl environments. Tech. Phys. 2020, 64, 1814–1820. [Google Scholar] [CrossRef]
  13. Rebak, R.B.; Szklarska-Amialowska, Z. The mechanism of stress corrosion cracking of alloy 600 in high temperature water. Corros. Sci. 1996, 38, 971–988. [Google Scholar] [CrossRef]
  14. Davis, J.R. Nickel, Cobalt, and Their Alloys, 1st ed.; ASM International Materials Park: Cleveland, OH, USA, 2000; pp. 125–186. [Google Scholar]
  15. Pardo, A.; Merino, M.C.; Coy, A.E.; Viejo, F.; Arrabal, R.; Matykina, E. Pitting corrosion behaviour of austenitic stainless steels—Combining effects of Mn and Mo additions. Corros. Sci. 2008, 50, 1796–1806. [Google Scholar] [CrossRef]
  16. Ebrahimi, N.; Jakupi, P.; Korinek, A.; Barker, I.; Moser, D.E.; Shoesmith, D.W. Sigma and random grain boundaries and their effect on the corrosion of the Ni-Cr-Mo alloy 22. J. Electrochem. Soc. 2016, 163, C232–C239. [Google Scholar] [CrossRef]
  17. Jakupi, P.; Noël, J.J.; Shoesmith, D.W. Intergranular corrosion resistance of ∑3 grain boundaries in alloy 22. Electrochem. Solid-State Lett. 2010, 13. [Google Scholar] [CrossRef]
  18. Liu, S.; Liu, Z.; Wang, Y.; Tang, J. A comparative study on the high temperature corrosion of TP347H stainless steel, C22 alloy and laser-cladding C22 coating in molten chloride salts. Corros. Sci. 2014, 83, 396–408. [Google Scholar] [CrossRef]
  19. He, X.; Dunn, D.S. Crevice corrosion penetration rates of alloy 22 in chloride-containing waters. Corros. Sci. 2007, 63, 145–158. [Google Scholar] [CrossRef]
  20. Jakupi, P.; Wang, F.; Noël, J.J.; Shoesmith, D.W. Corrosion product analysis on crevice corroded Alloy-22 specimens. Corros. Sci. 2011, 53, 1670–1679. [Google Scholar] [CrossRef]
  21. Chiang, K.T.; Dunn, D.S.; Cragnolino, G.A. Effect of simulated ground water chemistry on stress corrosion cracking of alloy 22. Corros. Sci. 2007, 63, 940–950. [Google Scholar] [CrossRef]
  22. Newman, R.C. The dissolution and passivation kinetics of stainless alloys containing molybdenum-1. Coulometric studies of Fe-Cr and Fe-Cr-Mo alloys. Corros. Sci. 1985, 25, 331–339. [Google Scholar] [CrossRef]
  23. Hayes, J.R.; Gray, J.J.; Szmodis, A.W.; Orme, C.A. Influence of chromium and molybdenum on the corrosion of nickel-based alloys. Corros. Sci. 2006, 62, 491–500. [Google Scholar] [CrossRef]
  24. Lloyd, A.C.; Noël, J.J.; McIntyre, S.; Shoesmith, D.W. Cr, Mo and W alloying additions in Ni and their effect on passivity. Electrochim. Acta 2004, 49, 3015–3027. [Google Scholar] [CrossRef]
  25. Jakupi, P.; Noël, J.J.; Shoesmith, D.W. The evolution of crevice corrosion damage on the Ni–Cr–Mo–W alloy-22 determined by confocal laser scanning microscopy. Corros. Sci. 2012, 54, 260–269. [Google Scholar] [CrossRef]
  26. Jakupi, P.; Zagidulin, D.; Noël, J.J.; Shoesmith, D.W. The impedance properties of the oxide film on the Ni–Cr–Mo Alloy-22 in neutral concentrated sodium chloride solution. Electrochim. Acta 2011, 56, 6251–6259. [Google Scholar] [CrossRef]
  27. Wang, Q.-Y.; Wang, X.-Z.; Luo, H.; Luo, J.-L. A study on corrosion behaviors of Ni–Cr–Mo laser coating, 316 stainless steel and X70 steel in simulated solutions with H2S and CO2. Surf. Coat. Technol. 2016, 291, 250–257. [Google Scholar] [CrossRef]
  28. Haemers, T.A.M.; Rickerby, D.G.; Lanza, F.; Geiger, F.; Mittemeijer, E.J. Laser cladding of stainless steel with hastelloy. Adv. Eng. Mater. 2001, 3, 242–245. [Google Scholar] [CrossRef]
  29. Barnes, S.; Timms, N.; Bryden, B.; Pashby, I. High power diode laser cladding. J. Mater. Process. Technol. 2003, 138, 411–416. [Google Scholar] [CrossRef]
  30. Cui, C.; Guo, Z.; Liu, Y.; Xie, Q.; Wang, Z.; Hu, J.; Yao, Y. Characteristics of cobalt-based alloy coating on tool steel prepared by powder feeding laser cladding. Optics Laser Technol. 2007, 39, 1544–1550. [Google Scholar] [CrossRef]
  31. Huang, Y. Characterization of dilution action in laser-induction hybrid cladding. Optics Laser Technol. 2011, 43, 965–973. [Google Scholar] [CrossRef]
  32. Chen, L.; Bai, S.-L. The anti-corrosion behavior under multi-factor impingement of Hastelloy C22 coating prepared by multilayer laser cladding. Appl. Surf. Sci. 2018, 437, 1–12. [Google Scholar] [CrossRef]
  33. Fujimagari, H.; Hagiwara, M.; Kojima, T. Laser cladding technology to small diameter pipes. Nucl. Eng. Des. 2000, 195, 289–298. [Google Scholar] [CrossRef]
  34. Wang, Q.-Y.; Zhang, Y.-F.; Bai, S.-L.; Liu, Z.-D. Microstructures, mechanical properties and corrosion resistance of Hastelloy C22 coating produced by laser cladding. J. Alloys Compd. 2013, 553, 253–258. [Google Scholar] [CrossRef]
  35. Li, X.-Z.; Liu, Z.-D.; Li, H.-C.; Wang, Y.-T.; Li, B. Investigations on the behavior of laser cladding Ni–Cr–Mo alloy coating on TP347H stainless steel tube in HCl rich environment. Surf. Coat. Technol. 2013, 232, 627–639. [Google Scholar] [CrossRef]
  36. Standardization Administration of China. GB/T 5310–2017: Seamless Steel Tubes and Pipes for High Pressure Boiler; Standards Press of China: Beijing, China, 2017; p. 7. [Google Scholar]
  37. Zhao, H.; Wei, Y. Discussion on the mechanisms and factors of the gas side high temperature corrosion in water wall tubes for coal fired boilers. Power Eng. 2002, 22, 1070–1074. [Google Scholar] [CrossRef]
Figure 1. Photographs of: (a) laser-cladding setup; (b) C22 laser coating prepared on water wall tube surface of 20G steel.
Coatings 10 00617 g001
Figure 2. Experimental setup for the corrosion test.
Coatings 10 00617 g002
Figure 3. Average mass gain of 20G steel, C22 alloy and C22 laser coating corroded in reducing atmosphere for 108 h at 450 °C.
Coatings 10 00617 g003
Figure 4. Comparison of corrosion mass gain between 0–12 h and 12–108 h of C22 alloy and C22 laser coating corroded in reducing atmosphere for 108 h at 450 °C.
Coatings 10 00617 g004
Figure 5. SEM surface micrographs of the corrosion products of: (a) outermost layer; (b) middle layer; (c) the innermost layer of 20G steel corroded in reducing atmosphere for 108 h at 450 °C.
Coatings 10 00617 g005
Figure 6. SEM surface micrographs of the corrosion products of: (a) C22 alloy; (b) C22 laser coating corroded in reducing atmosphere for 108 h at 450 °C.
Coatings 10 00617 g006
Figure 7. SEM cross-sectional micrographs of: (a) 20G steel; (b) C22 alloy; (c) C22 laser coating corroded in reducing atmosphere for 108 h at 450 °C.
Coatings 10 00617 g007
Figure 8. XRD patterns of corrosion products of 20G steel, C22 alloy and C22 laser coating corroded in reducing atmosphere for 108 h at 450 °C.
Coatings 10 00617 g008
Table 1. Chemical compositions of C22 powder, C22 alloy and 20G steel.
AlloyElement (wt%)
NiCCrMoMnFeSiCoVWSP
C22 powderBal.0.0821.313.22.92.0 3.0
C22 alloyBal.0.00122.013.80.455.00.0781.830.33.20.0080.02
20G0.17–0.230.35–0.65Bal.0.17–0.37<0.015<0.025
Table 2. EDS results for the typical phases of 20G steel corroded in reducing atmosphere for 108 h at 450 °C in Figure 5.
TitleElements (at%)
SFeO
A18.7827.9753.24
B21.2539.6439.10
C69.3039.700
Table 3. EDS results for the typical phases of C22 alloy and C22 laser coating corroded in reducing atmosphere for 108 h at 450 °C in Figure 6.
PointElements (at%)
CrSMnFeCoNiWMoO
A19.2838.460.291.350.2420.820.277.9211.31
B23.1437.390.162.030.4917.758.1410.90
Table 4. Phase constitution of corrosion products 20G steel, C22 alloy and C22 laser coating corroded in reducing atmosphere for 108 h at 450 °C.
Title 1Phase Identification
20G steelFeS2 + Fe2O3 + Fe3O4
C22 alloyCrS + NiS2 + FeS + Co3S4 + NiCo2S4 + Cr3O4 + MnO2 + CrO + NiCrCoMo
C22 laser coatingCrS + NiS2 + FeS + Co3S4 + NiCo2S4 + Cr3O4 + MnO2 + CrO + NiCrCoMo

