Abstract
In heat exchange applications, the heat transfer efficiency could be improved by surface modifications. Shot peening was one of the cost-effective methods to provide different surface roughness. The objectives of this study were (1) to investigate the influences of the surface roughness on the heat transfer performance and (2) to understand how the shot peening process parameters affect the surface roughness. The considered specimens were 316L stainless steel hollow tubes having smooth and rough surfaces. The computational fluid dynamics (CFD) simulation was used to observe the surface roughness effects. The CFD results showed that the convective heat transfer coefficients had linear relationships with the peak surface roughness (Rz). Finite element (FE) simulation was used to determine the effects of the shot peening process parameters. The FE results showed that the surface roughness was increased at higher sandblasting speeds and sand diameters.
1. Introduction
Stainless steels have been used in endless applications ranging from construction, transportation, medical, nuclear, and chemical industries due to their excellent properties [1]. Mainly because of its ability to resist corrosion, this material has long been used in virtually all cooling waters and many chemical environments [2]. One of the most common uses of stainless steel is as a heat exchanger, because it works well in high-temperature conditions (resistance to corrosion, oxidation, and scaling). Generally, stainless steel surfaces are also easy to clean. Most importantly, this material is economical in terms of cost and long-term maintenance service. The heat transfer efficiency of exchangers can be improved by modifying the geometry of the heat exchange tube/plate and altering fluid flows patterns. Recently, surface modification or texturing has shown its potential in many technological developments, such as friction reduction [3,4,5], biofouling [6,7], artificial parts [8], and even stem cell research [9]. As a result, the trend in using surface modification/texturing in heat transfer enhancement has been on the rise, and some of the reviewed literature is presented below.
The influences of dimple/protrusion surfaces on the heat transfer were investigated by Jing et al. (2018) [10]. Chen et al. (2012) found out that the asymmetric dimple with skewness downstream was better than the symmetric shape in heat exchange [11]. The asymmetric flow structures were numerically evaluated by Turnow et al. (2018), and the heat transfer was found to be improved with the asymmetric vortex structures [12]. Du et al. (2018) discovered that the dimple location significantly affected the flow structure and heat transfer [13]. The enhanced heat transfer by dimples was also found in the work of Zheng et al. (2018) [14]. Wang et al. (2018) observed that a bleed hole in a dimpled channel helped improve the heat transfer [15]. Xie et al. (2018) numerically studied the 3D turbulent flow and convective heat transfer of the dimpled tube [16]. Both dimples and protrusions were investigated by the same research group, and they found both the dimpled and protruded surface flow mixing, which provided a better heat transfer rate [17]. The authors went on to study the effect of the teardrop surface and found flow mixing improvement [18]. Some other dimples and surface textured shapes for heat transfer enhancement in various conditions can also be found in many research studies [19,20,21]. By looking at the effects of surface roughness on heat transfer, many studies have also shown similar findings. Dierich and Nikrityuk (2013) observed that the roughness influenced the surface-average Nusselt number, and the authors also introduced the heat transfer efficiency factor [22]. Pike-Wilson and Karayiannis (2014) did not find a clear relationship between the heat transfer coefficient and surface roughness [23]. Ventola et al. (2014) proposed the heat transfer model, taking into account the size of the surface roughness and turbulent fluid flow [24]. Tikadar et al. (2018) looked at heat transfer characteristics in a roughed heater rod. They found that there was an abrupt increase in the heat transfer coefficient at the transition region from the smooth to the surface roughness area [25].
Several manufacturing processes can create surface textures on metals; for instance, laser texturing [26], rolling [27], elliptical vibration texturing [28], and extrusion forging and extrusion rolling processes [29]. Shot peening has been widely used to create surface irregularities (surface roughness) on metal parts [30]. Most of the research studies on the shot peening of stainless steels were focused on residual stress [31], fatigue and corrosion [32,33], surface characteristics [34,35], and tribology [36,37,38]. The main interest of this research is to determine the efficiency of heat transfer of a shot peened surface in stainless steel tube. Most of the literature mentioned above [10,11,12,13,14,15,16,17,18,19,20,21,22,23,24,25] used the finite volume method (FVM) to determine the heat transfer characteristics of textured surfaces. In addition, many studies utilized the finite element method (FEM) to understand the effects of shot peening process parameters [39,40,41,42,43,44,45,46,47]. The FVM was carried out in this study to analyze the heat convection performance of a considered shot peened surface in comparison with the smooth one. Then, the FEM was used to predict the shot peening parameters that would provide the enhanced heat transfer surface.
2. Materials and Methods
2.1. Heat Transfer of Pinned Fins
Since the heat exchanger of interest in this study was a 316L stainless steel tube, the heat transfer testing apparatus, as shown in Figure 1, was used. Table 1 presents the material properties of the considered tube in this study.
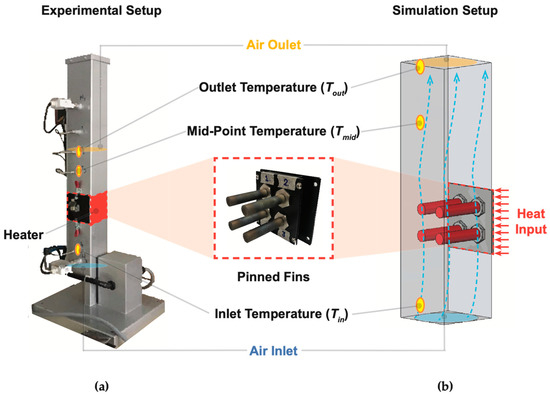
Figure 1.
The heat transfer performance testing apparatus: (a) Experimental setup; (b) Simulation setup.

Table 1.
Material properties of the 316L stainless steel tube considered in this study.
The primary purpose of the heat transfer experiment was to determine the heat convection performance of the tube surfaces: smooth surface and rough surface. The fin specimens were hollow tubes 21.34 mm in diameter, 100.00 mm in length, and 2.87 mm in thickness. Note that both ends of each fin were covered with thin circular plates. The smooth surfaces were prepared by machining and polishing to obtain the peak surface roughness (Rz) of 0.015 μm. The rough surfaces were prepared by machining and shot peening to obtain the peak surface roughness of (Rz) of 25 μm by using the sand diameter of 350 μm. In each test, four fins were pinned to the heater. The fan was installed below the heater at the Air Inlet location. Three thermocouples were attached to the following locations: Inlet Temperature (Tin), Mid-Point Temperature (Tmid), and Outlet Temperature (Tout) through the Air Outlet. The thermocouples (N-type) with the ±1% °C accuracy over the measured temperature span were used to record the temperatures. The temperature of the tested fins could be varied by changing the Heat Input. Once the desired temperature of the fins was set, the fan was turned on to provide the airflow passing the heated fins. The carried heat would flow past both Tmid and Tout, and the measured temperatures would be used to calculate the heat convection performance of the tube surfaces.
The finite volume method (FVM) was applied in this research to evaluate and predict the heat convection performance of various surfaces. The main components and dimensions of the FVM simulation are illustrated in Figure 2. The descriptions, symbols, and units of the necessary parameters used in this research are presented in Table 2.
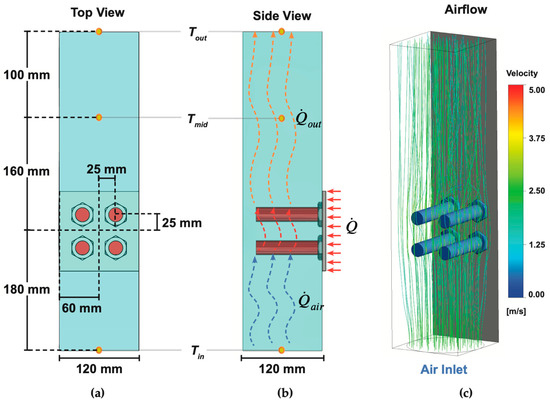
Figure 2.
The simulation setup: (a) Top view; (b) Side view; (c) Airflow.
Table 2.
The descriptions of the considered variables in heat convection.
The equation of the convective heat transfer coefficients (hconv) must be developed to evaluate the heat transfer performance of different surfaces. According to the energy balance:
The total air mass flow was:
The power of the heater could be described as:
Qin = mfinCpfin(Theat − Tin)
Since Tin = Tair, the temperature of the heater was obtained from:
Theat = [Qin/(mfinCpfin)] + Tin
The heat transfer rate was found to be:
Thus, the convective heat transfer coefficient could be determined by the following equation:
hconv = [AflowVairdairCpairCpfinmfin(Tout − Tin)]/[AconvQin]
If the new constant (C) was set to be:
then the convective heat transfer coefficient could be rewritten as:
C = AflowdairCpairCpfinmfin/Aconv
hconv = [CVair(Tout − Tin)]/Qin
In addition, Qin could be obtained from the following equation:
As a result, the convective heat transfer coefficient of the pinned fins could be determined from:
hconv = [CVair(Tout − Tin)]/[Qavgtheat]
Note that the C value could be calculated by using the variable values in Table 3. The variables Qavg, Vair, theat, and Tin were input variables. In addition, Tout = Tmid if the measured temperature point was at the Midpoint Temperature (Tmid).
Table 3.
The heat convection constants used in this study.
2.2. Computational Fluid Dynamics (CFD) Modeling
The common tool used in FVM to analyze the heat transfer performance was computational fluid dynamics (CFD). ANSYS CFX 2020 was the commercial software used to evaluate the heat transfer characteristics in this study, as shown in Figure 3. Although there were four fins in the experiments, only two fins of the right half were modeled because of the symmetric fluid flow along the horizontal direction. The half-geometry was modeled in two-dimensional (Half 2D), and the surface roughness along the circumference of each fin was modeled as shown. Figure 4 illustrates the enlarged cross-sectional view of the circumference that represented the actual surface roughness values. The total number of meshing elements was in the 10 million range to accurately capture the fidelity of the surface roughness variations. The k-epsilon turbulent model was used to provide airflow characteristics. The total energy assumption and the transient analysis were performed.
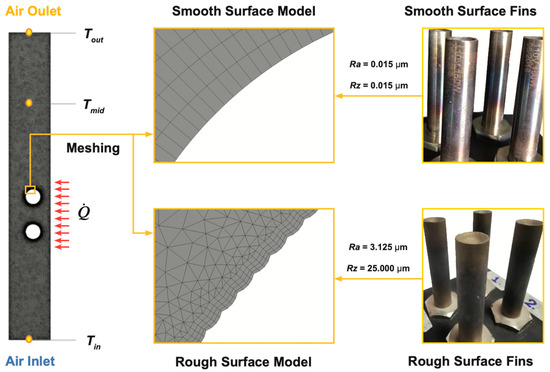
Figure 3.
The simulated surfaces and meshing of the smooth fins and shot peened fins.
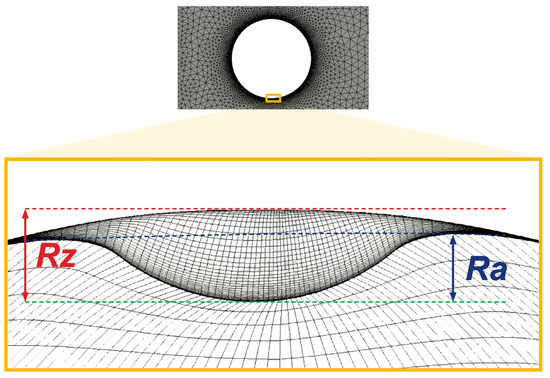
Figure 4.
The simulated rough surface and surface roughness parameters (Ra and Rz).
In the actual heat transfer experiment, the heater was turned on for 20 min (theat) to keep the uniform initial temperature of the fins. Afterward, the fan was turned on according to the set Air Velocity (Vair), and the temperatures on Tin, Tmid, and Tout were recorded every minute over the 10-min period. The same process was also set up in the CFD modeling, and the validation conditions of the CFD model were presented in Table 4. The average values of the recorded temperatures were calculated and compared to determine the validity of the CFD model.
Table 4.
The considered conditions of the heat convection experiments.
2.3. Convective Heat Transfer Coefficients of Different Surface Roughness
Then, the prediction of the convective heat transfer coefficients (hconv) of different surface roughness was carried out by using the validated CFD model. The primary factors considered here were surface roughness (Rz) and airflow speed (Vair). Table 5 presents the considered conditions of the convective heat transfer coefficients prediction. Then, the CFD results were used to calculate the hconv value of each condition.
Table 5.
The considered conditions of the convective heat transfer coefficients prediction.
2.4. Shot Peening Finite Element (FE) Simulation
Once the relationships between the surface roughness and heat transfer characteristics of 316L stainless steels were established, the tube surfaces must be modified to provide the precise surface roughness as desired. Nevertheless, controlling the shot peening process to achieve such precision was generally tricky, because the influences of the process parameters were not well understood and quantified, particularly on tube (curved) surfaces. As a result, the FE simulation of the shot peening process was carried out to observe the effects of Sand Diameter (DS), Impact Angle (θ), and Impact Velocity (VI), as displayed in Figure 5. The commercial MSC.DYTRAN 2019 was used in the FE analysis. The tube surface was modeled as a 3D hexahedral mesh (587,664 nodes and 566,272 elements). The geometry of the tube was based on the pinned fin from the heat transfer experiment. Note that the tube surface was smooth. The prescribed tube model was deformable, and the properties of the tube are shown in Table 1. The material model of the tube was elastic–plastic. The shot peening sand was modeled as a rigid circular (ball) shape having a 2D quadrilateral mesh (4648 nodes and 4646 elements). Initially, a sand ball was located on top of the tube surface. Afterward, the ball was blasted with a set impact angle and impact velocity. Then, the sand ball was removed, which showed a deformed or dimpled surface on the tube. Note also that this study only considered the single-shot sandblasting impact to determine the influences of the shot peening parameters. Table 6 presents the range and values of the considered shot peening parameters. The deformation results obtained FE simulations that were then used to obtain the surface roughness values (Rz) of each condition.
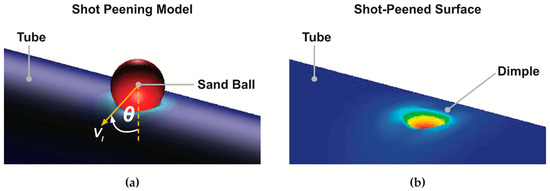
Figure 5.
The finite element (FE) simulation of the shot peening on tube surface: (a) Shot peening model; (b) Shot peened surface.
Table 6.
The considered parameters for the shot peening FE simulations.
3. Results
3.1. Effects of Surface Roughness to Heat Convection
The results of the CFD model validation with the heat transfer experiment are presented in Figure 6. Note that the results of the CFD calculations were mesh-independent. In Figure 6a, the temperature–velocity plot at Tout of the experimental and simulation surfaces was illustrated. The errors between the experiments and simulations at Tout ranged from 1% to 7% (Figure 6b). The temperature–velocity plot at Tmid was also displayed in Figure 6c, and the errors at Tmid were illustrated in Figure 6d. The highest error value at Tmid was approximately 3%. Considering the error values both at Tout and Tmid, the CFD model was considered valid in this study.
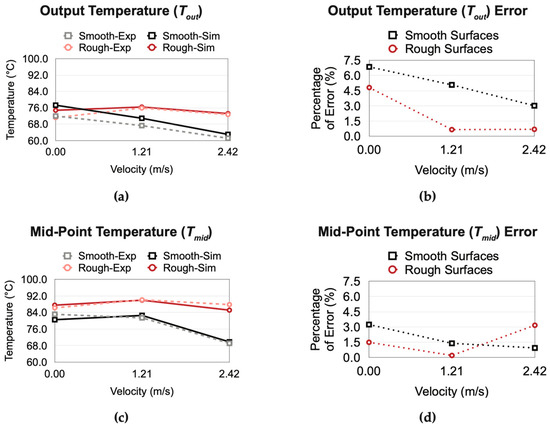
Figure 6.
The temperature comparisons among the smooth and rough surfaces: (a) Output Temperature (Tout); (b) Output Temperature (Tout) Error; (c) Mid-Point Temperature (Tmid); (d) Mid-Point Temperature (Tmid) Error.
In Figure 7, the temperature contour maps of the smooth and rough surfaces at varying flow speeds are shown. At V = 0 m/s, this condition was considered natural or free convection because the fan was not running, allowing the heated airflow to pass the measured temperature points naturally. If the air velocities were set to be 1.21 or 2.42 m/s, the conditions were forced convection. In the free convection conditions, the rough surfaces provided higher temperatures at both Tmid and Tout than the smooth surfaces did. In the forced convection scenarios, the temperatures at Tmid and Tout significantly dropped in comparison to those of the rough surfaces. The results implied that the rough surfaces provided a better heat transfer performance. The velocity contour maps in Figure 8 could also be used to explain the phenomena. In the natural convection conditions (no influence of air velocity), the heated airflows in the rough surfaces were already higher than those of the smooth surfaces, leading to the higher temperatures in Tmid and Tout. The main reason was due to the increased surface areas of the pinned fins, which allowed more air to exchange heat. With the influences of air velocity (forced convection), the increased in airflow speed generally led to reduced temperatures, which could be clearly noticed in the smooth surfaces. At higher airflow velocities, the small vortex (air swirling) around the dimpled areas accumulated to the large swirling around at the downstream side of the rough surfaces. This large air circulation area (vortex shading) had a lower air velocity, allowing more air to exchange heat with the fins. As a result, more airflow could carry heat from the rough surfaces to the measured temperature points. On the contrary, the smooth surfaces did not develop the large vortex sharing area downstream. Thus, only a fraction of low-velocity airflows downstream was generated around the smooth fins. As a result, there was a lower amount of air to exchange heat at high airflow velocities.
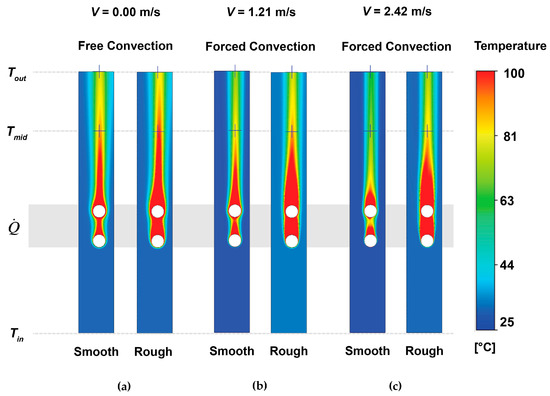
Figure 7.
The temperature contour maps of the simulated pinned fins of both smooth and rough surfaces at varying flow speeds: (a) V = 0.00 m/s; (b) V = 1.21 m/s; (c) V = 2.42 m/s.
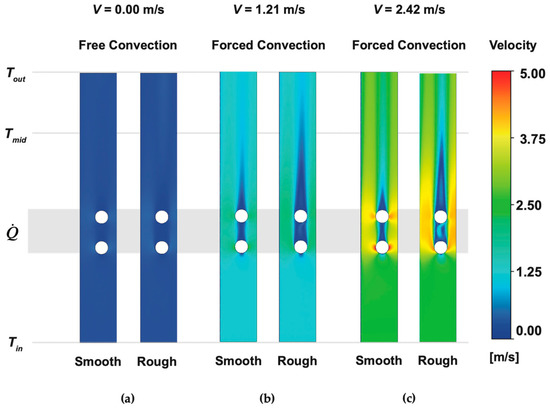
Figure 8.
The velocity contour maps of the simulated pinned fins of both smooth and rough surfaces at varying flow speeds: (a) V = 0.00 m/s; (b) V = 1.21 m/s; (c) V = 2.42 m/s.
The predicted temperatures and the convective heat transfer coefficients (hconv) of varying surface roughness are presented in Figure 9. The CFD results of the predicted temperatures were used to calculate the hconv of each condition. The higher value of hconv represented a higher heat transfer efficiency. According to the figure, the hconv values of the smooth surfaces were equal to zero in the natural convection cases. In the forced convection cases, the hconv values increased with airflow velocity and surface roughness. Comparing the hconv values between Tmid and Tout, the hconv values at Tout were lower, since the measured location was further away from the heat source. Increasing the airflow velocities from 1.21 to 2.42 m/s caused the hconv values to double. If the surface roughness values were increased up to 250 μm, the hconv could be increased up to 155% at V = 1.21 m/s and 192% at V = 2.42 m/s. Most importantly, if the rough surface conditions were considered (Rz = 25 to 250 μm), the linear relationships between the hconv and Rz values could be observed. Although the hconv values linearly increased with Rz, the surface roughness could not be increased without limits to enhance the heat transfer efficiency further. The most critical issues were the manufacturability of such a high-depth surface and the heat-transfer limits. In this study, the ratio of surface roughness (Rz = 250 μm) to pipe diameter (21.34 mm) or RSD was approximately 0.01. In the forced convection conditions, the convective heat transfer coefficient’s ratios between rough and smooth surfaces or hconv-RS ranged from 1 to 2.9. Thus, the ratio between hconv-RS and RSD ranged from 100 to 290, which could be used to compare with other tubes having different diameters and surfaces.
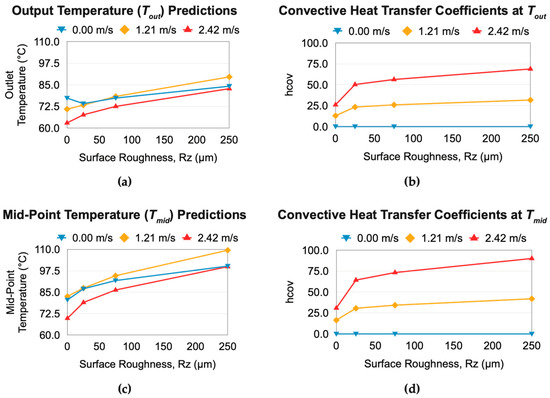
Figure 9.
The predicted temperatures and convective heat transfer coefficients: (a) Output Temperature (Tout) Predictions; (b) Convective Heat Transfer Coefficients at Tout; (c) Mid-Point Temperature (Tmid) Predictions; (d) Convective Heat Transfer Coefficients at Tmid.
The Reynold (Re) numbers of the considered conditions in this study to determine the fluid behaviors could be calculated by Equation (11).
where dair is the density of air, Vair is the velocity of air, D is the tube diameter, and νair is the dynamic viscosity of air. The Re numbers of the investigated surfaces at various airflow speeds can be seen in Figure 10. In the forced convection conditions, higher surface roughness led to higher friction and higher pressure loss (quite turbulent flow), which generally reduced the Re numbers. In the free convection conditions, the increased surface roughness did not affect the Re numbers. Note that the Re numbers at 250 μm were not zero (approximately 32).
Re = dairVairD/νair
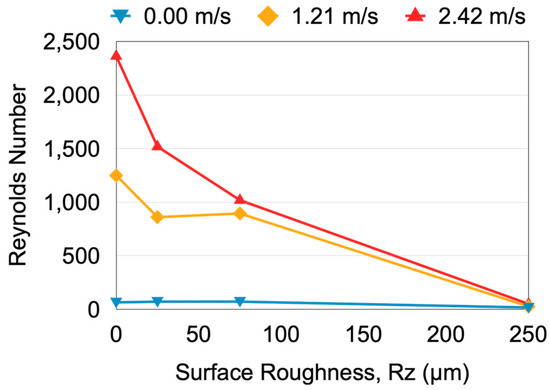
Figure 10.
The calculated Reynolds numbers at different surface roughness and airflow speeds.
3.2. Effects of Shot Peening Parameters to Surface Roughness
The effects of the shot peening parameters on surface roughness are presented in Figure 11. Note that the results of the FE calculations were mesh-independent. The Rz values were plotted against the impact angles at various impact velocities in Figure 11a,b. The Ra values were plotted against the impact angles at different impact velocities in Figure 11c,d. The FE results demonstrated that increasing sand diameters and impact velocities led to an increase in both Ra and Rz values in all the cases. Larger sand diameters and higher blasting speeds created higher momentum, leading to higher impact energy and causing higher deformed (dimpled) areas. However, increasing the impact angles led to the reduced impact areas and thus decreasing Ra and Rz values. Based on the results, it could be noticed that using the sand diameters of 100 μm up to 350 μm resulted in the Ra and Rz values ranging from 1 μm up to 18 μm, which would provide the increased hconv values up to 50% depending on the airflow velocities. However, sand diameters larger than 200 μm would be recommended due to the more considerable impact on dimpled areas. If only small sand diameters were available, increasing the sandblasting speeds would help increase the surface roughness values.
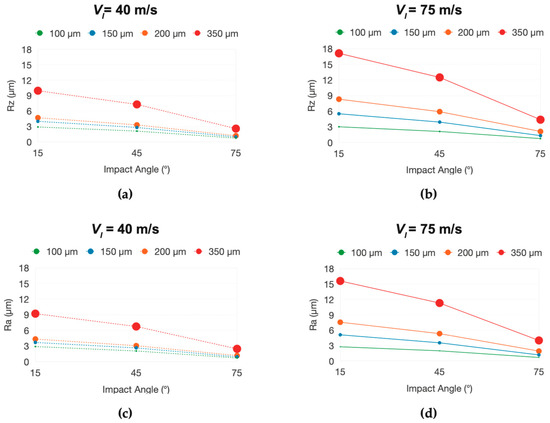
Figure 11.
The FE surface roughness results at varied impact angles and impact velocities: (a) Rz at VI = 40 m/s; (b) Rz at VI = 75 m/s; (c) Ra at VI = 40 m/s; (d) Ra at VI = 75 m/s.
4. Discussion
The results of this work were divided into two parts: (1) the effects of surface roughness on heat transfer efficiency (convective heat transfer coefficient), and (2) shot peening parameters on the surface roughness. The results of these two parts connected the actual performance of the heat exchange surface to the processing parameters. This connection has not yet been well established for heat exchanger manufacturers until this study. The linear relationship found between the convective heat transfer coefficient and peak surface roughness values (Rz) provided a general guideline of how a heat exchanger surface could be developed to meet the higher performance requirements. The effects of the shot peening process parameters on the Rz values were helpful in determining its manufacturability and production costs. In summary, this research work provided a clear linkage of the desired heat transfer performance to surface dimensional control and processing.
Since the shot peening process considered in this study was a single-shot sandblasting, it was intended only to observe the primary influences of the considered factors. The multiple-shot sandblasting process investigating mixed sand diameters at controlled speeds is currently ongoing. The results of this future work should be more applicable to the actual shot peening processes to obtain any desired surface roughness values, particularly on tube profiles. The ultimate impact of this continuous research work would provide more significant benefits to the energy-saving systems.
5. Conclusions
The project investigated the effects of surface roughness on the convective heat transfer coefficients of the 316L stainless steel tubes and the effects of the shot peening parameters on the surface roughness. The CFD simulation was carried out to study the influences of the surface roughness at varying airflow velocities. In the free convection conditions, the pinned fins’ increased surface areas allowed more air to exchange heat. In the forced convection conditions, more airflow could carry heat from the rough surfaces to the measured temperature points. The linear relationships between the peak surface roughness (Rz) and the convective heat transfer coefficients were found.
The influences of the shot peening process parameters (sand diameter, impact angle, and impact velocity) on the tube surfaces were investigated by using the FE simulation. The results showed that the increase in sand diameter and impact velocity increased surface roughness. The increased in convective heat transfer coefficient values (up to 50%) could be obtained by using the sand diameters of 100 μm up to 350 μm, resulting in the shot peened surface having the Ra and Rz values ranging from 1 μm up to 18 μm. The established links among the heat transfer efficiency, surface roughness, and shot peening parameters in this study could be used to enhance the heat transfer efficiency.
Author Contributions
Conceptualization, N.M. and S.S.; Data curation, P.K. and N.M.; Formal analysis, P.K., N.M. and S.S.; Funding acquisition, N.M. and S.M.; Investigation, P.K. and N.M.; Methodology, N.M. and S.S.; Project administration, N.M. and S.M.; Resources, N.M. and S.M.; Software, P.K., N.M. and S.S.; Supervision, N.M., S.M. and K.D.; Validation, P.K., N.M. and S.S.; Visualization, P.K. and N.M.; Writing—original draft, P.K.; Writing—review and editing, N.M. All authors have read and agreed to the published version of the manuscript.
Funding
This research was funded by the NSTDA University-Industry Research Collaboration (NUI-RC), grant number NUI-RC-M33-12-56-002D. The APC was funded by Khon Kaen University.
Acknowledgments
The authors would like to acknowledge the supports of Diamond Brand Co., Ltd.; LPN Metallurgical Research Center, Thailand; National Metal and Materials Technology Center (MTEC); and Department of Mechanical Engineering, Faculty of Engineering, Khon Kaen University.
Conflicts of Interest
The authors declare no conflict of interest.
References
- Lo, K.H.; Shek, C.H.; Lai, J.K.L. Recent developments in stainless steels. Mater. Sci. Eng. R Rep. 2009, 65, 39–104. [Google Scholar] [CrossRef]
- Boillot, P.; Peultier, J. Use of Stainless Steels in the Industry: Recent and Future Developments. Procedia Eng. 2014, 83, 309–321. [Google Scholar] [CrossRef]
- Akbarzadeh, A.; Khonsari, M.M. Effect of Untampered Plasma Coating and Surface Texturing on Friction and Running-in Behavior of Piston Rings. Coatings 2018, 8, 110. [Google Scholar] [CrossRef]
- Li, C.; Yang, X.; Wang, S.; Wang, Y.; Lu, C.; Cao, J. Study on Friction and Lubrication Characteristics of Surface with Unidirectional Convergence Texture. Coatings 2019, 9, 780. [Google Scholar] [CrossRef]
- Wos, S.; Koszela, W.; Dzierwa, A.; Pawlus, P. Friction Reduction in Unidirectional Lubricated Sliding Due to Disc Surface Texturing. Coatings 2020, 10, 221. [Google Scholar] [CrossRef]
- Hilbert, L.R.; Bagge-Ravn, D.; Kold, J.; Gram, L. Influence of surface roughness of stainless steel on microbial adhesion and corrosion resistance. Int. Biodeterior. Biodegrad. 2003, 52, 175–185. [Google Scholar] [CrossRef]
- García, S.; Trueba, A.; Vega, L.M.; Madariaga, E. Impact of the surface roughness of AISI 316L stainless steel on biofilm adhesion in a seawater-cooled tubular heat exchanger-condenser. Biofouling 2016, 32, 1185–1193. [Google Scholar] [CrossRef]
- Baino, F.; Montealegre, M.A.; Minguella-Canela, J.; Vitale-Brovarone, C. Laser Surface Texturing of Alumina/Zirconia Composite Ceramics for Potential Use in Hip Joint Prosthesis. Coatings 2019, 9, 369. [Google Scholar] [CrossRef]
- Petrović, S.; Peruško, D.; Skoulas, E.; Kovač, J.; Mitrić, M.; Potočnik, J.; Rakočević, Z.; Stratakis, E. Laser-Assisted Surface Texturing of Ti/Zr Multilayers for Mesenchymal Stem Cell Response. Coatings 2019, 9, 854. [Google Scholar] [CrossRef]
- Jing, Q.; Zhang, D.; Xie, Y. Numerical investigations of impingement cooling performance on flat and non-flat targets with dimple/protrusion and triangular rib. Int. J. Heat Mass Transf. 2018, 126, 169–190. [Google Scholar] [CrossRef]
- Chen, Y.; Chew, Y.T.; Khoo, B.C. Enhancement of heat transfer in turbulent channel flow over dimpled surface. Int. J. Heat Mass Transf. 2012, 55, 8100–8121. [Google Scholar] [CrossRef]
- Turnow, J.; Kasper, R.; Kornev, N. Flow structures and heat transfer over a single dimple using hybrid URANS-LES methods. Comput. Fluids 2018, 172, 720–727. [Google Scholar] [CrossRef]
- Du, W.; Luo, L.; Wang, S.; Zhang, X. Effect of the dimple location and rotating number on the heat transfer and flow structure in a pin finned channel. Int. J. Heat Mass Transf. 2018, 127, 111–129. [Google Scholar] [CrossRef]
- Zheng, L.; Xie, Y.; Zhang, D. Numerical investigation on heat transfer and flow characteristics in helically coiled mini-tubes equipped with dimples. Int. J. Heat Mass Transf. 2018, 126, 544–570. [Google Scholar] [CrossRef]
- Wang, S.; Du, W.; Luo, L.; Qiu, D.; Zhang, X.; Li, S. Flow structure and heat transfer characteristics of a dimpled wedge channel with a bleed hole in dimple at different orientations and locations. Int. J. Heat Mass Transf. 2018, 117, 1216–1230. [Google Scholar] [CrossRef]
- Xie, S.; Liang, Z.; Zhang, L.; Wang, Y.; Ding, H.; Zhang, J. Numerical investigation on heat transfer performance and flow characteristics in enhanced tube with dimples and protrusions. Int. J. Heat Mass Transf. 2018, 122, 602–613. [Google Scholar] [CrossRef]
- Xie, S.; Liang, Z.; Zhang, L.; Wang, Y. A numerical study on heat transfer enhancement and flow structure in enhanced tube with cross ellipsoidal dimples. Int. J. Heat Mass Transf. 2018, 125, 434–444. [Google Scholar] [CrossRef]
- Xie, S.; Liang, Z.; Zhang, J.; Zhang, L.; Wang, Y.; Ding, H. Numerical investigation on flow and heat transfer in dimpled tube with teardrop dimples. Int. J. Heat Mass Transf. 2019, 131, 713–723. [Google Scholar] [CrossRef]
- Liu, Y.; Rao, Y.; Weigand, B. Heat transfer and pressure loss characteristics in a swirl cooling tube with dimples on the tube inner surface. Int. J. Heat Mass Transf. 2019, 128, 54–65. [Google Scholar] [CrossRef]
- Dagdevir, T.; Keklikcioglu, O.; Ozceyhan, V. Heat transfer performance and flow characteristic in enhanced tube with the trapezoidal dimples. Int. Commun. Heat Mass Transf. 2019, 108, 104299. [Google Scholar] [CrossRef]
- Zhou, Z.-F.; Lin, Y.-K.; Tang, H.-L.; Fang, Y.; Chen, B.; Wang, Y.-C. Heat transfer enhancement due to surface modification in the close-loop R410A flash evaporation spray cooling. Int. J. Heat Mass Transf. 2019, 139, 1047–1055. [Google Scholar] [CrossRef]
- Dierich, F.; Nikrityuk, P.A. A numerical study of the impact of surface roughness on heat and fluid flow past a cylindrical particle. Int. J. Therm. Sci. 2013, 65, 92–103. [Google Scholar] [CrossRef]
- Pike-Wilson, E.A.; Karayiannis, T.G. Flow boiling of R245fa in 1.1 mm diameter stainless steel, brass and copper tubes. Exp. Therm. Fluid Sci. 2014, 59, 166–183. [Google Scholar] [CrossRef]
- Ventola, L.; Robotti, F.; Dialameh, M.; Calignano, F.; Manfredi, D.; Chiavazzo, E.; Asinari, P. Rough surfaces with enhanced heat transfer for electronics cooling by direct metal laser sintering. Int. J. Heat Mass Transf. 2014, 75, 58–74. [Google Scholar] [CrossRef]
- Tikadar, A.; Najeeb, U.; Paul, T.C.; Oudah, S.K.; Salman, A.S.; Abir, A.M.; Carrilho, L.A.; Khan, J.A. Numerical investigation of heat transfer and pressure drop in nuclear fuel rod with three-dimensional surface roughness. Int. J. Heat Mass Transf. 2018, 126, 493–507. [Google Scholar] [CrossRef]
- Zhou, R.; Cao, J.; Wang, Q.J.; Meng, F.; Zimowski, K.; Xia, Z.C. Effect of EDT surface texturing on tribological behavior of aluminum sheet. J. Mater. Process. Technol. 2011, 211, 1643–1649. [Google Scholar] [CrossRef]
- Zhou, R.; Cao, J.; Ehmann, K.; Xu, C. An Investigation on Deformation-Based Micro Surface Texturing. In Proceedings of the ASME 2011 International Manufacturing Science and Engineering Conference, Corvallis, OR, USA, 13–17 June 2011; pp. 613–619. [Google Scholar]
- Guo, P.; Ehmann, K.F. An analysis of the surface generation mechanics of the elliptical vibration texturing process. Int. J. Mach. Tools Manuf. 2013, 64, 85–95. [Google Scholar] [CrossRef]
- Wang, J.; Feng, Z. Manufacturing of surface features from extrusion forging and extrusion rolling of sheet metals. Manuf. Lett. 2018, 15, 42–45. [Google Scholar] [CrossRef]
- Zhou, Z.; Shang, J.; Chen, Y.; Liang, X.; Shen, B.; Zhang, Z. Synchronous Shot Peening Applied on HVOF for Improvement on Wear Resistance of Fe-based Amorphous Coating. Coatings 2020, 10, 187. [Google Scholar] [CrossRef]
- Chen, M.; Jiang, C.; Xu, Z.; Zhan, K.; Ji, V. Experimental study on macro- and microstress state, microstructural evolution of austenitic and ferritic steel processed by shot peening. Surf. Coat. Technol. 2019, 359, 511–519. [Google Scholar] [CrossRef]
- Lee, H.-S.; Kim, D.-S.; Jung, J.-S.; Pyoun, Y.-S.; Shin, K. Influence of peening on the corrosion properties of AISI 304 stainless steel. Corros. Sci. 2009, 51, 2826–2830. [Google Scholar] [CrossRef]
- Azar, V.; Hashemi, B.; Rezaee Yazdi, M. The effect of shot peening on fatigue and corrosion behavior of 316L stainless steel in Ringer’s solution. Surf. Coat. Technol. 2010, 204, 3546–3551. [Google Scholar] [CrossRef]
- Bagherifard, S.; Slawik, S.; Fernández-Pariente, I.; Pauly, C.; Mücklich, F.; Guagliano, M. Nanoscale surface modification of AISI 316L stainless steel by severe shot peening. Mater. Des. 2016, 102, 68–77. [Google Scholar] [CrossRef]
- Jebaraj, A.V.; Kumar, T.S.; Kumar, L.A.; Deepak, C.R. Influence of shot peening on surface quality of austenitic and duplex stainless steel. IOP Conf. Ser. Mater. Sci. Eng. 2017, 263, 062057. [Google Scholar] [CrossRef]
- Menezes, M.R.; Godoy, C.; Buono, V.T.L.; Schvartzman, M.M.M.; Avelar-Batista Wilson, J.C. Effect of shot peening and treatment temperature on wear and corrosion resistance of sequentially plasma treated AISI 316L steel. Surf. Coat. Technol. 2017, 309, 651–662. [Google Scholar] [CrossRef]
- Gopi, R.; Saravanan, I.; Devaraju, A.; Loganathan, G.B. Investigation of shot peening process on stainless steel and its effects for tribological applications. Mater. Today Proc. 2020, 22, 580–584. [Google Scholar] [CrossRef]
- Han, X.; Zhang, Z.; Hou, J.; Barber, G.C.; Qiu, F. Tribological behavior of shot peened/austempered AISI 5160 steel. Tribol. Int. 2020, 145, 106197. [Google Scholar] [CrossRef]
- Miao, H.Y.; Larose, S.; Perron, C.; Lévesque, M. An analytical approach to relate shot peening parameters to Almen intensity. Surf. Coat. Technol. 2010, 205, 2055–2066. [Google Scholar] [CrossRef]
- Mylonas, G.I.; Labeas, G. Numerical modelling of shot peening process and corresponding products: Residual stress, surface roughness and cold work prediction. Surf. Coat. Technol. 2011, 205, 4480–4494. [Google Scholar] [CrossRef]
- Kim, T.; Lee, H.; Kim, M.; Jung, S. A 3D FE model for evaluation of peening residual stress under angled multi-shot impacts. Surf. Coat. Technol. 2012, 206, 3981–3988. [Google Scholar] [CrossRef]
- Gangaraj, S.M.H.; Guagliano, M.; Farrahi, G.H. An approach to relate shot peening finite element simulation to the actual coverage. Surf. Coat. Technol. 2014, 243, 39–45. [Google Scholar] [CrossRef]
- Sanjurjo, P.; Rodríguez, C.; Peñuelas, I.; García, T.E.; Belzunce, F.J. Influence of the target material constitutive model on the numerical simulation of a shot peening process. Surf. Coat. Technol. 2014, 258, 822–831. [Google Scholar] [CrossRef]
- Laura, L.; Castro, A.A. Gustavo Urquiza, Analysis of Heat Transfer in an Experimental Heat Exchanger Using Numerical Simulation. In Numerical Simulation—From Brain Imaging to Turbulent Flows; Lopez-Ruiz, R., Ed.; IntechOpen: London, UK, 2016. [Google Scholar]
- Tu, F.; Delbergue, D.; Miao, H.; Klotz, T.; Brochu, M.; Bocher, P.; Levesque, M. A sequential DEM-FEM coupling method for shot peening simulation. Surf. Coat. Technol. 2017, 319, 200–212. [Google Scholar] [CrossRef]
- Zhang, Y.; Kong, D.; Liu, S. Experimental study of forced convection heat transfer of graded metal honeycomb fabricated by additive manufacturing. Int. Commun. Heat Mass Transf. 2018, 98, 67–73. [Google Scholar] [CrossRef]
- Jing, D.; Song, J. Numerical Studies on the Thermal Performances of Electroosmotic Flow in Y-Shaped Microchannel Heat Sink. Coatings 2020, 10, 380. [Google Scholar] [CrossRef]
© 2020 by the authors. Licensee MDPI, Basel, Switzerland. This article is an open access article distributed under the terms and conditions of the Creative Commons Attribution (CC BY) license (http://creativecommons.org/licenses/by/4.0/).