Influence of Nitrogen Content and Bias Voltage on Residual Stress and the Tribological and Mechanical Properties of CrAlN Films


Abstract
1. Introduction
2. Experimental Details
3. Results and Discussion
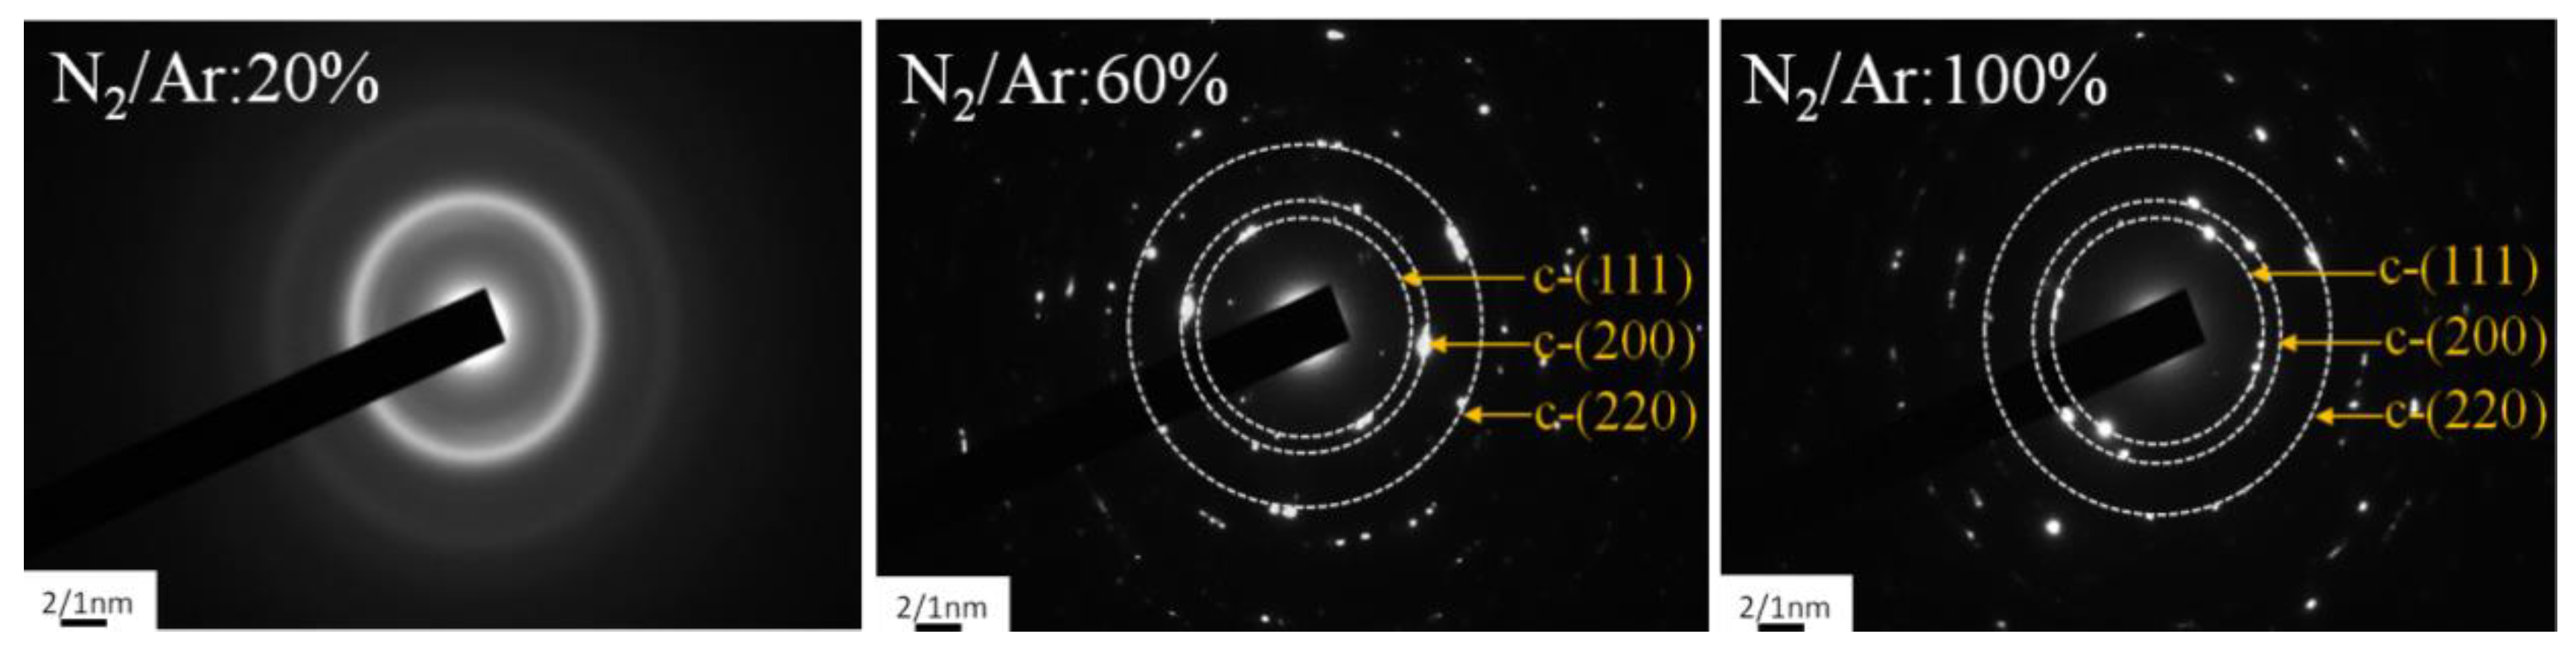
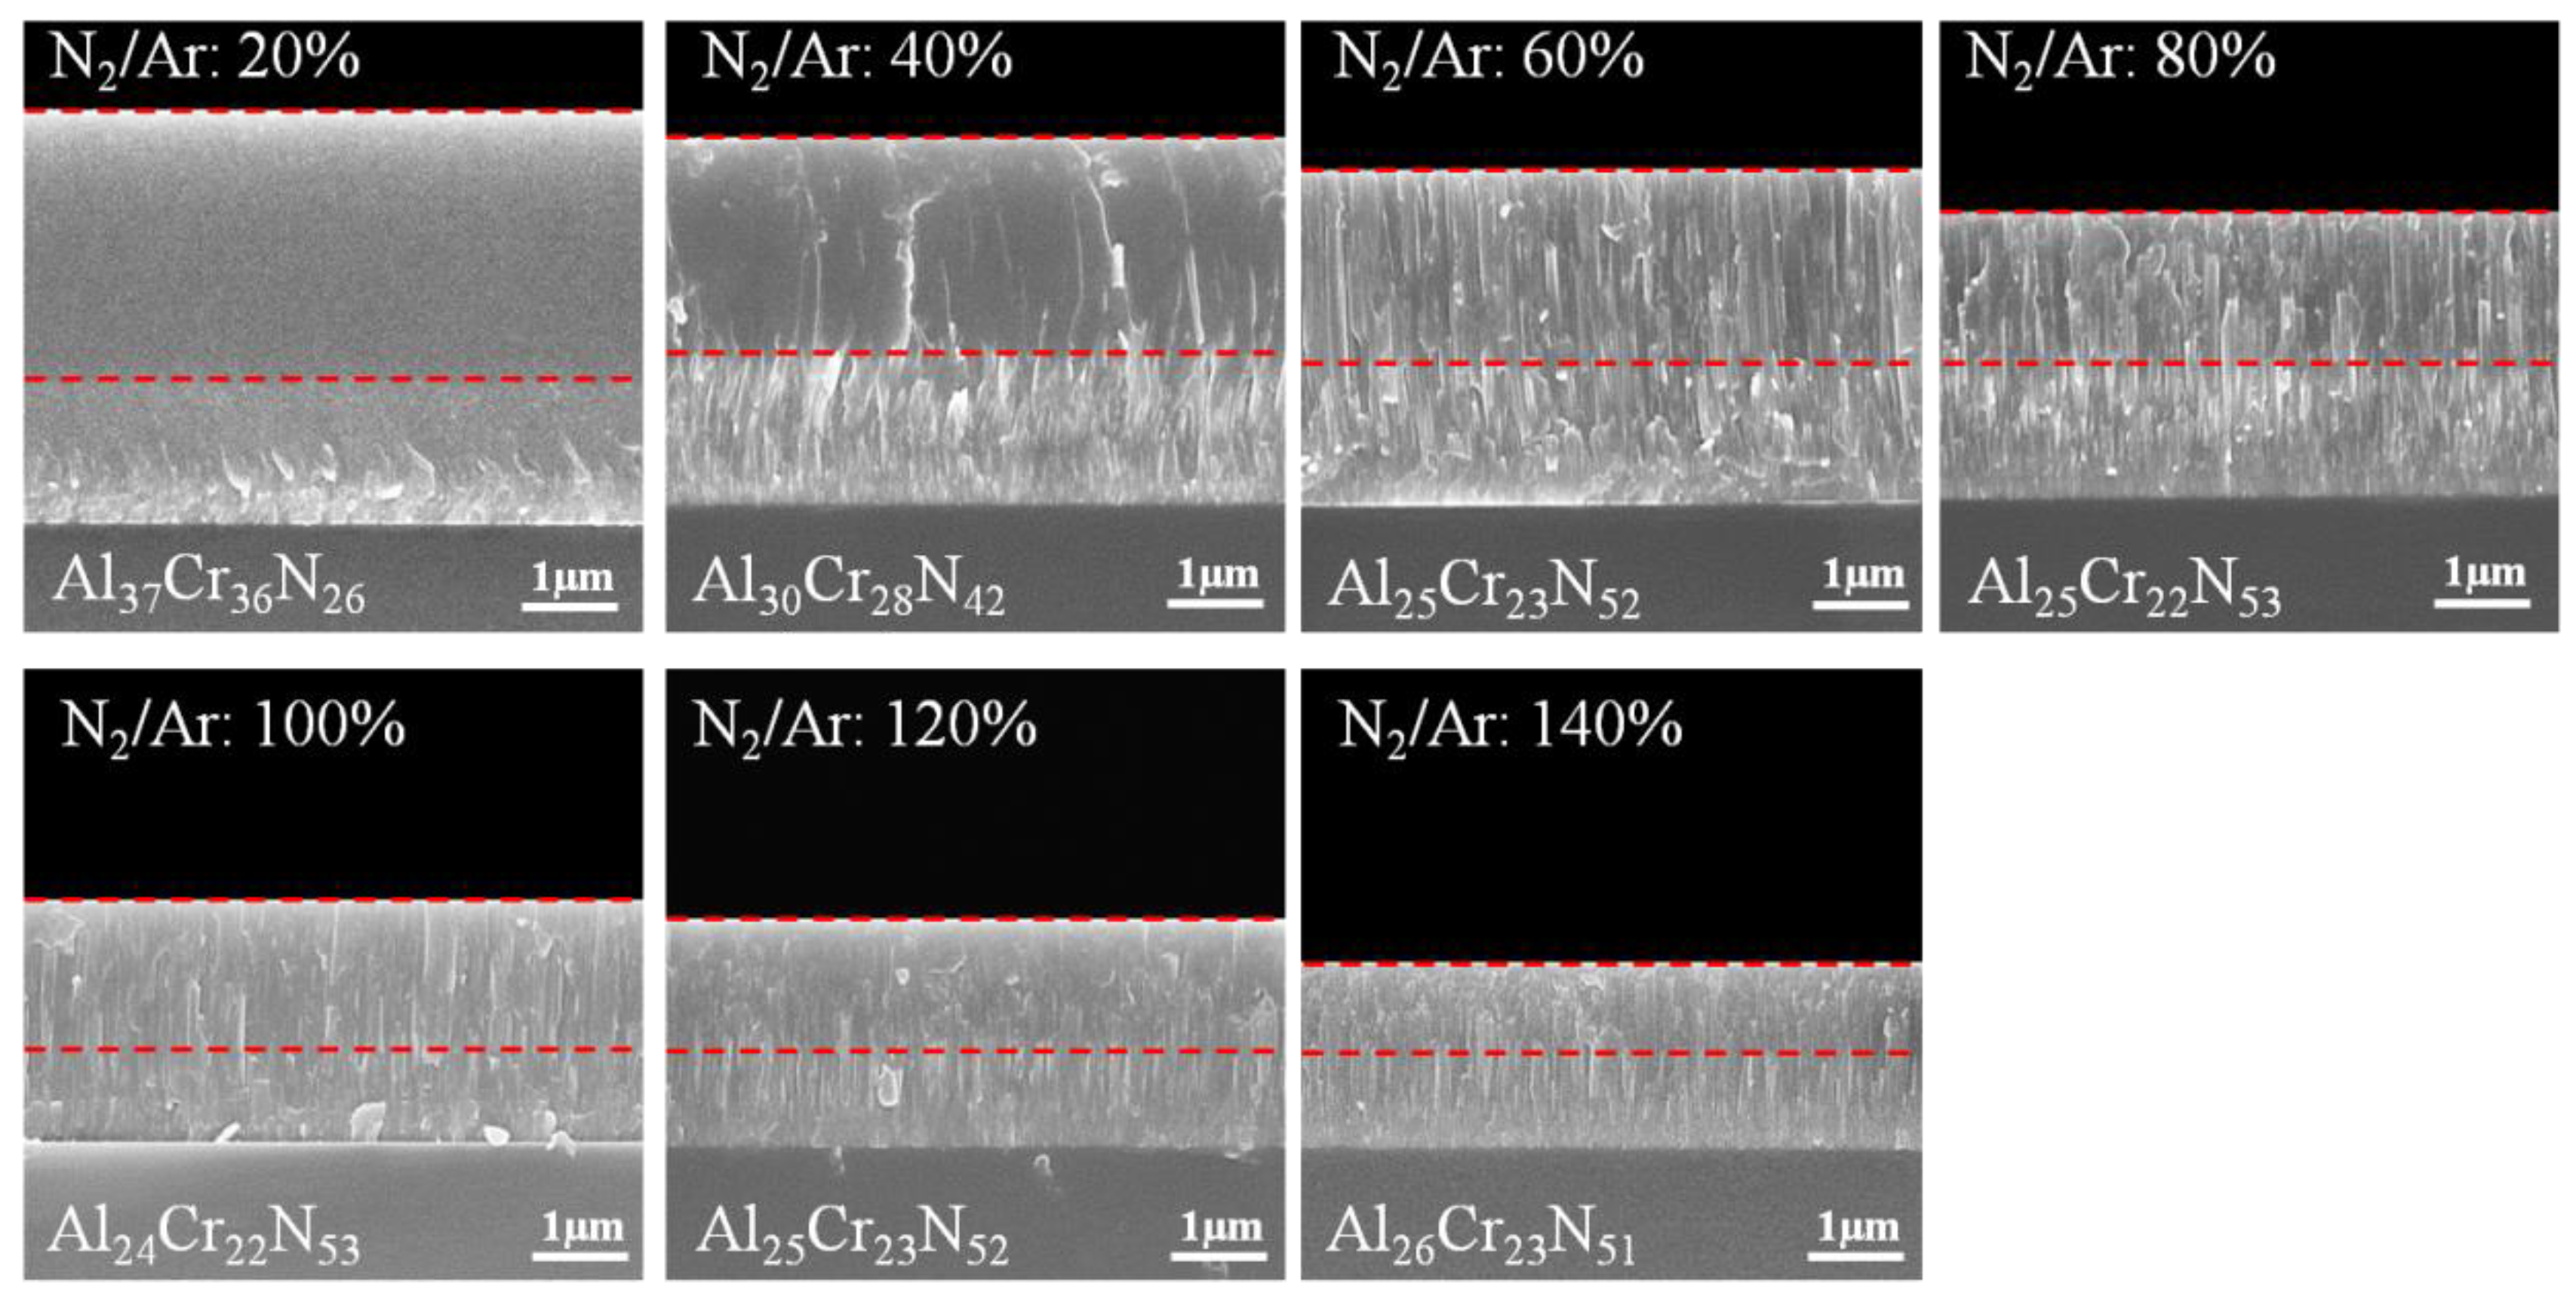
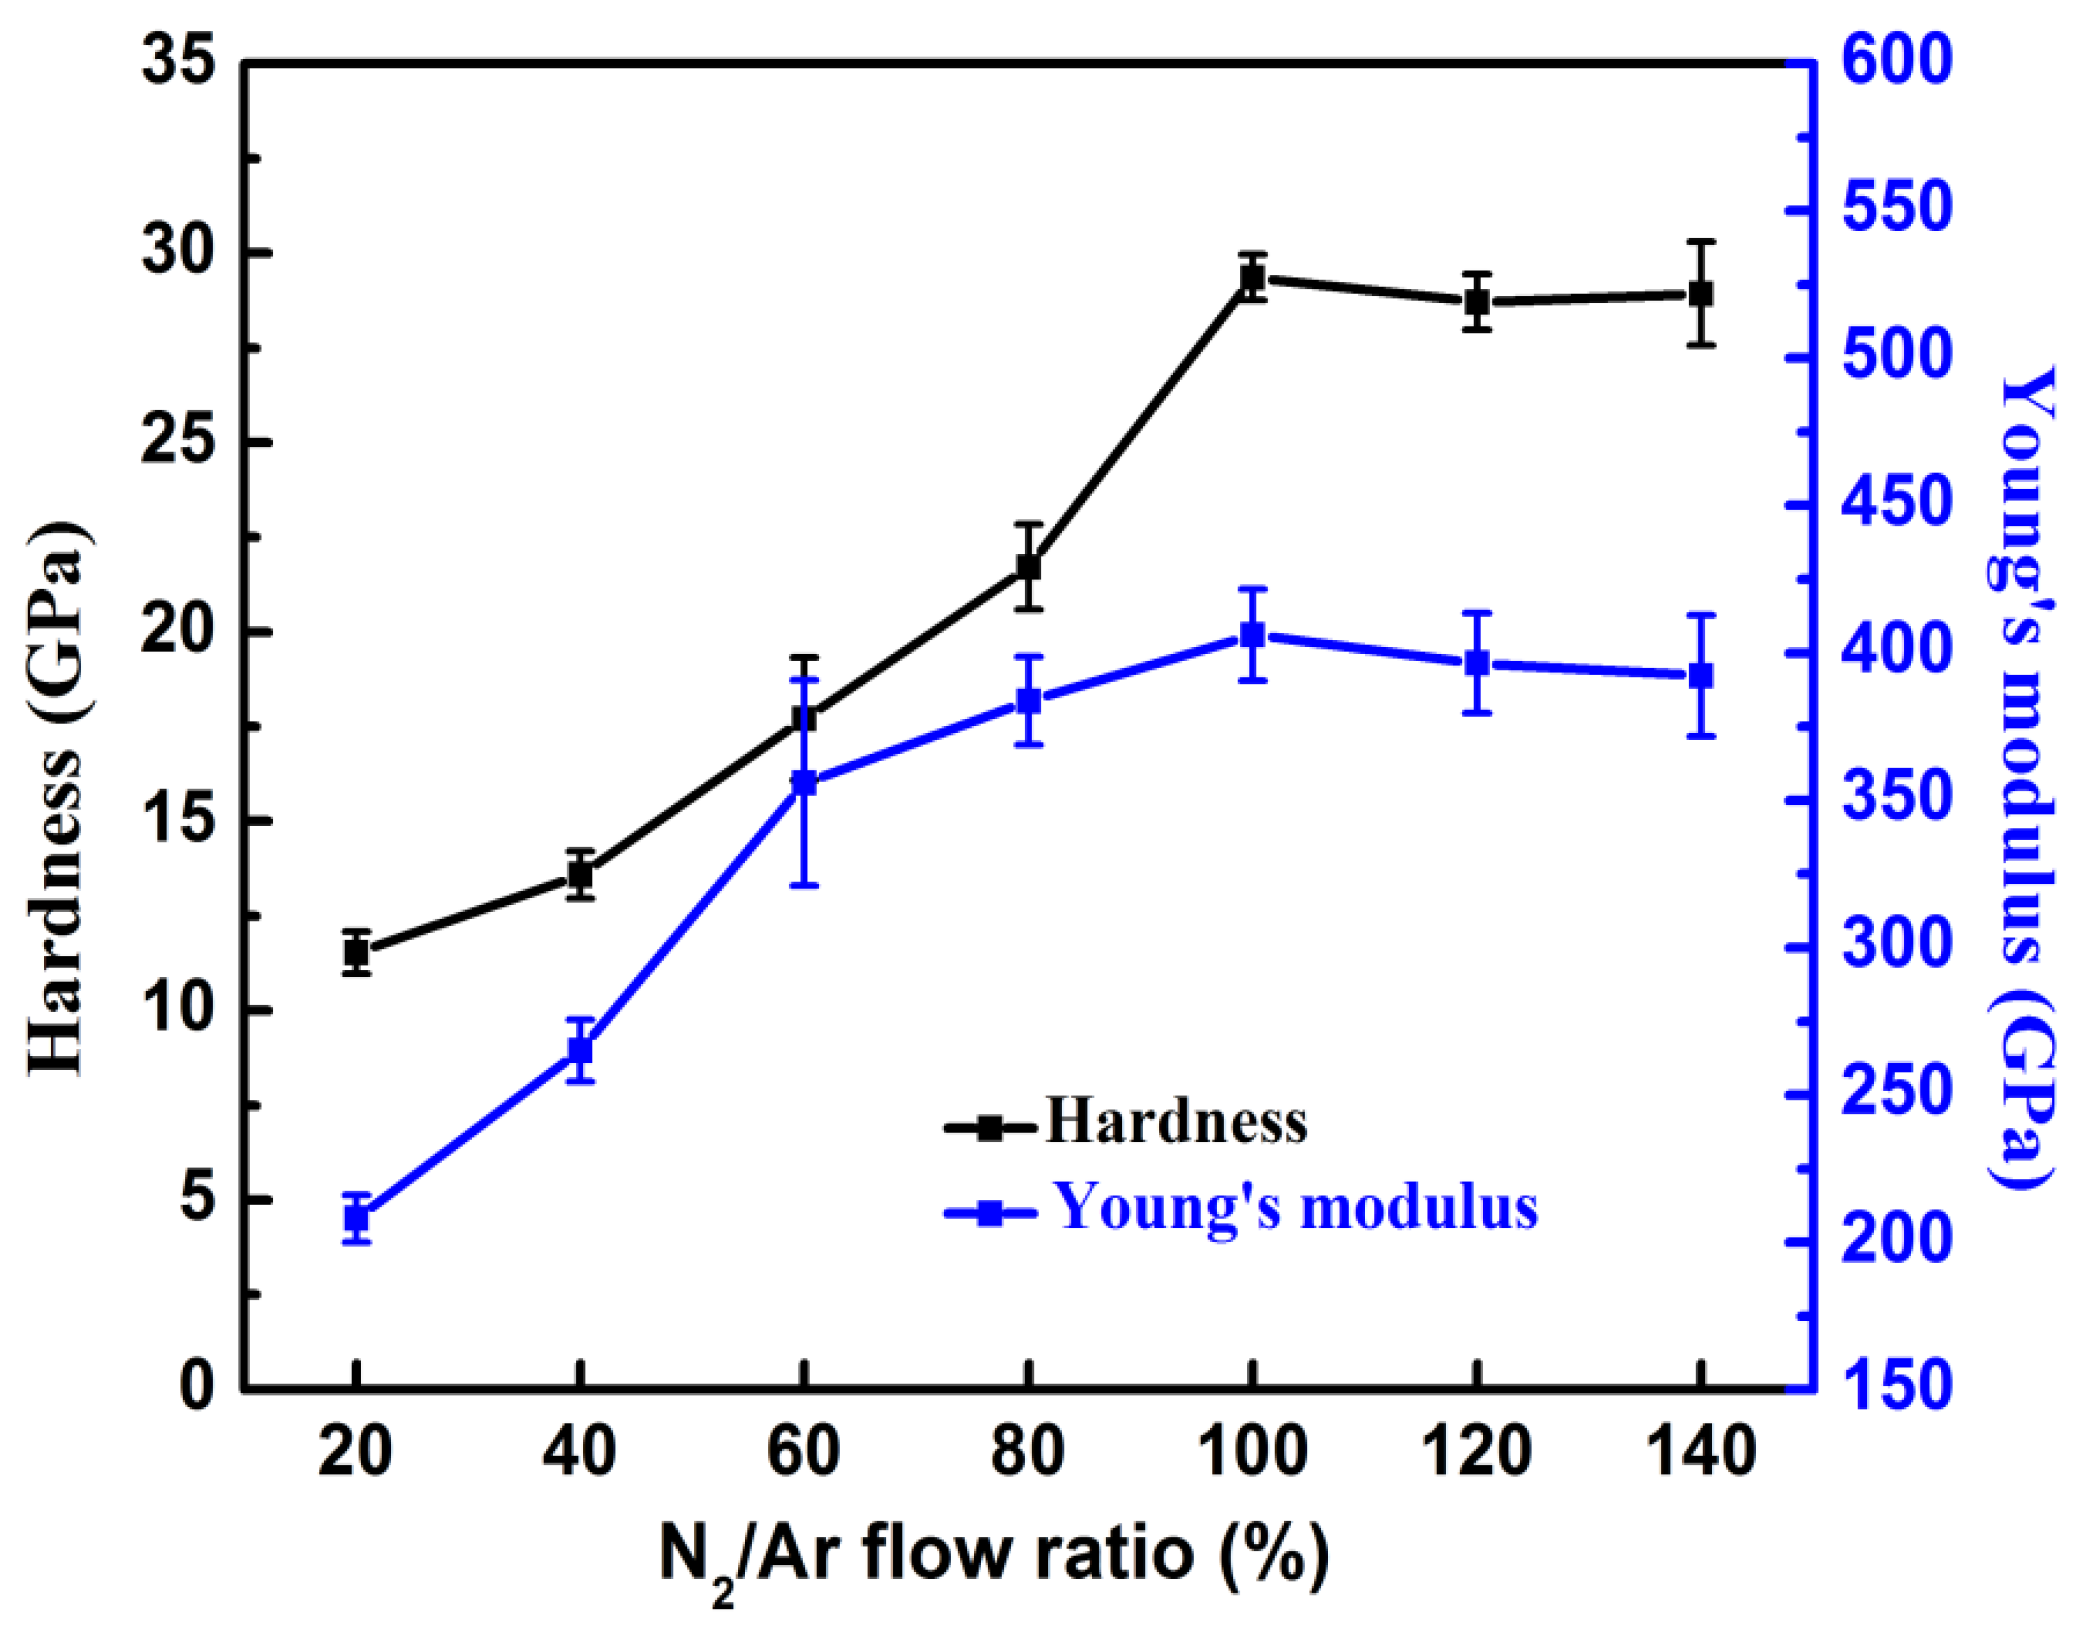
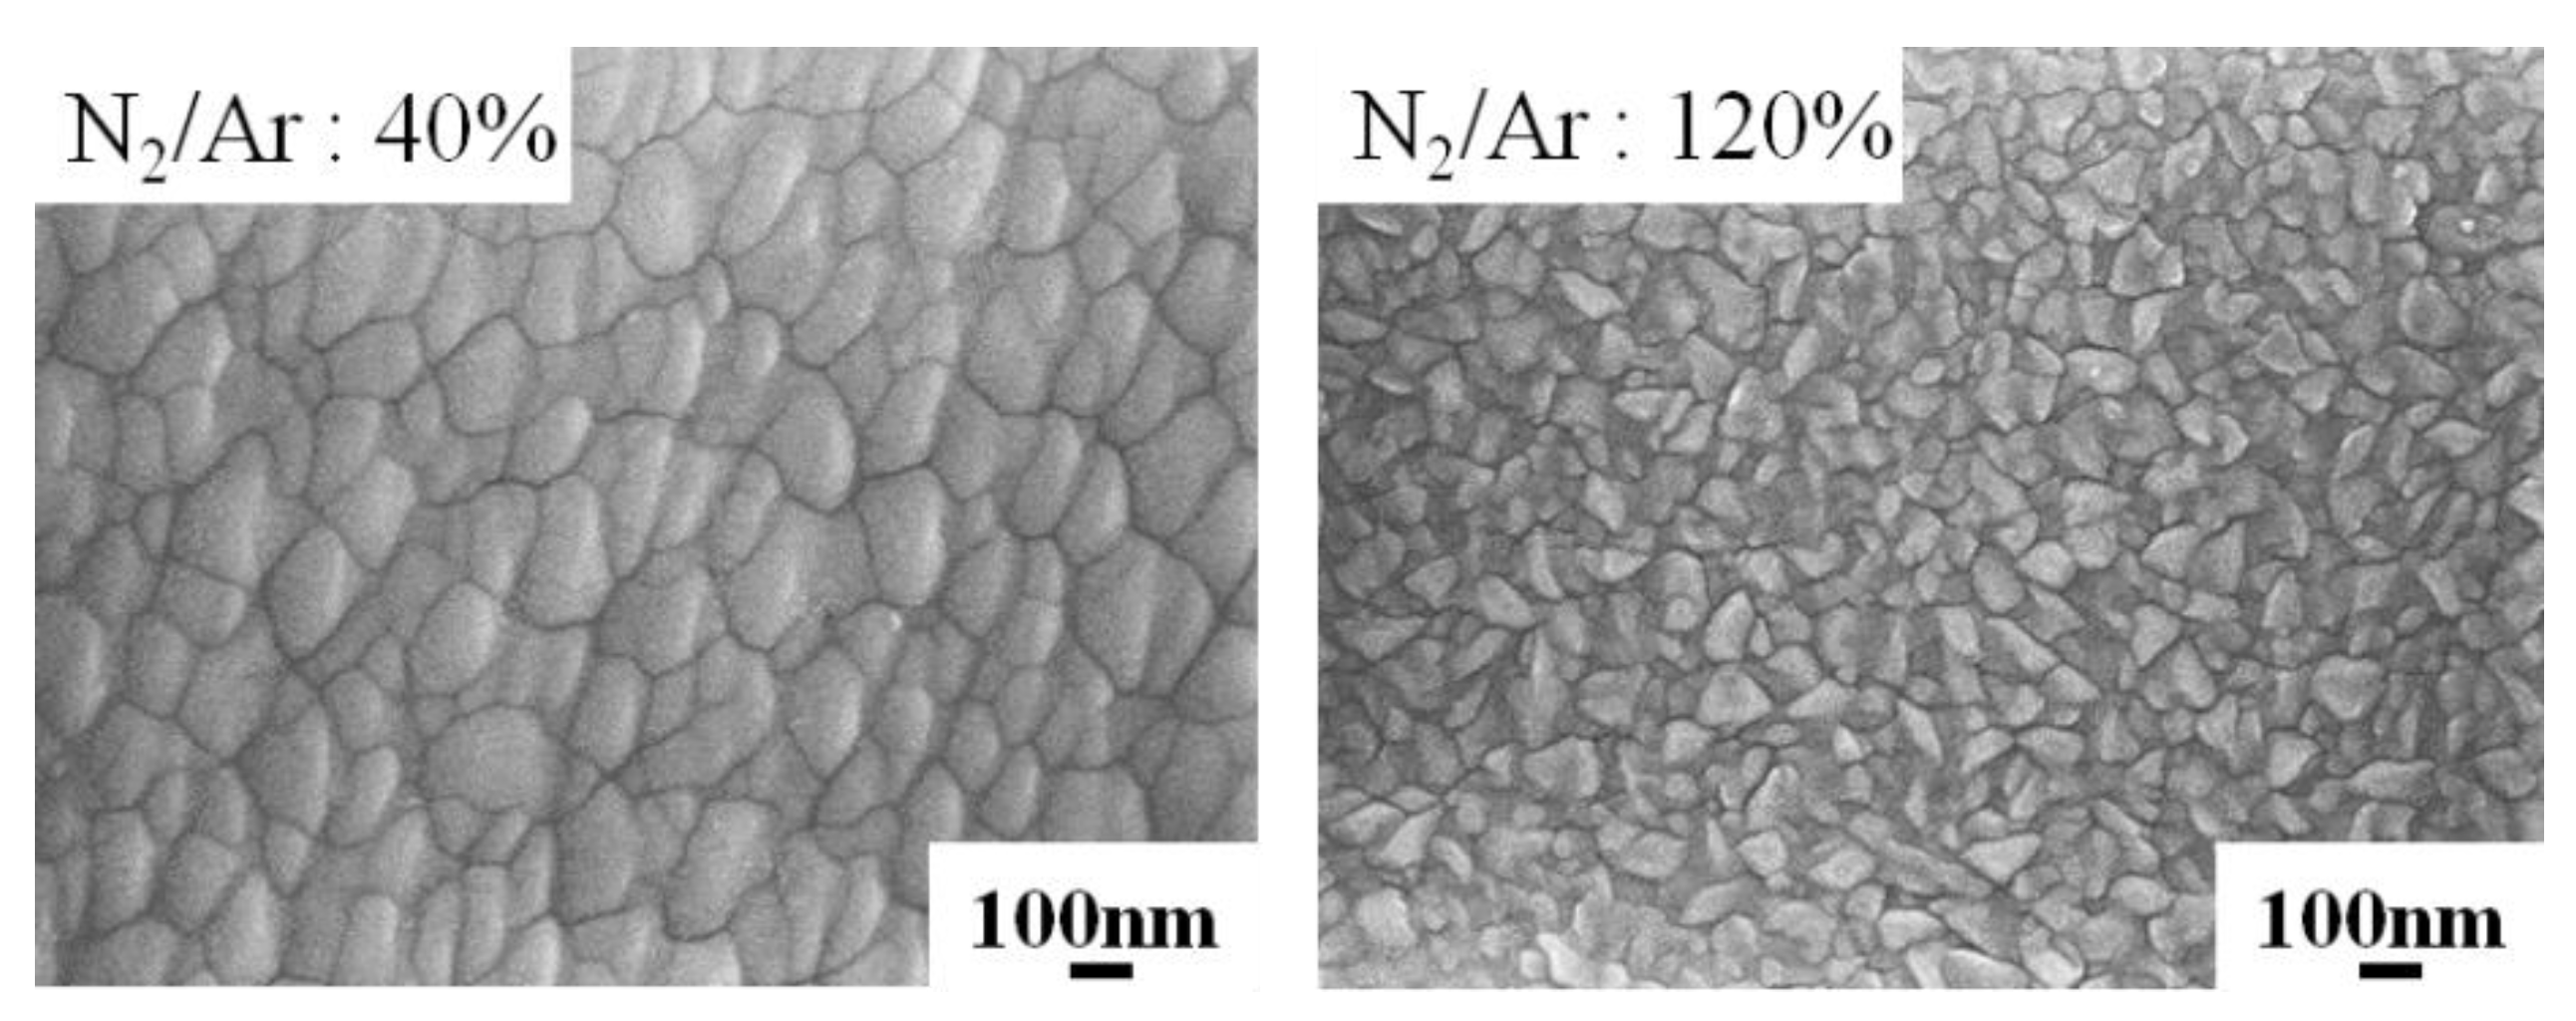
3.1. Effects of N2/Ar Flow Ratio on the CrAlN Layer
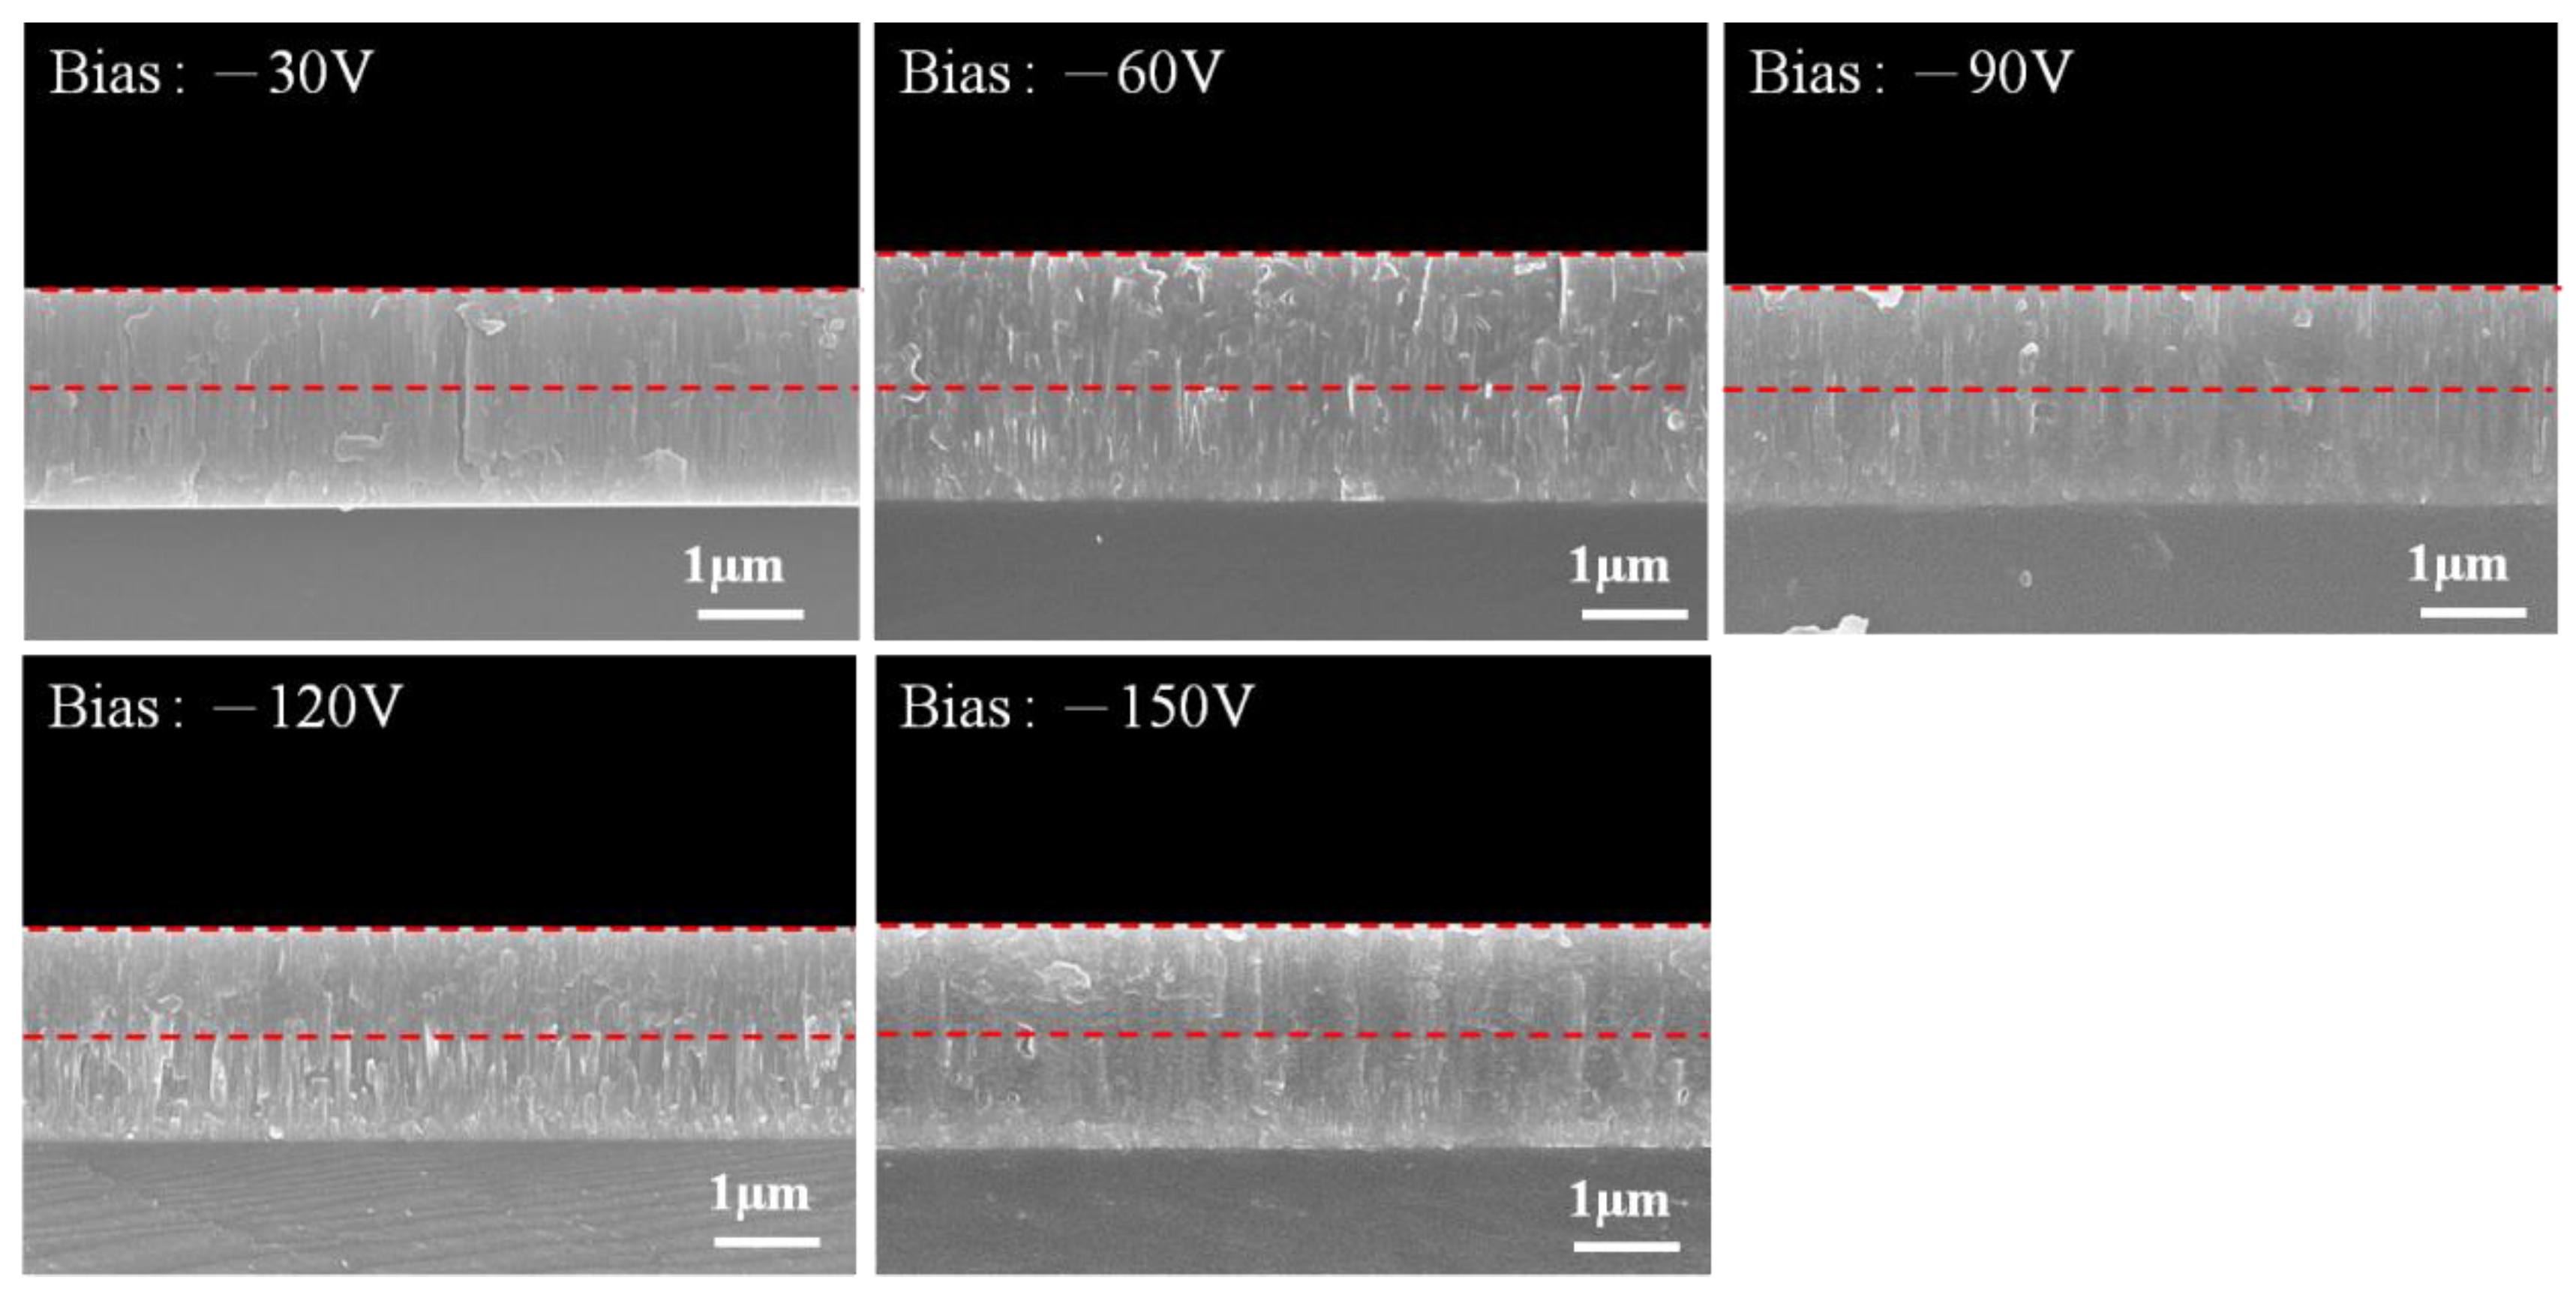
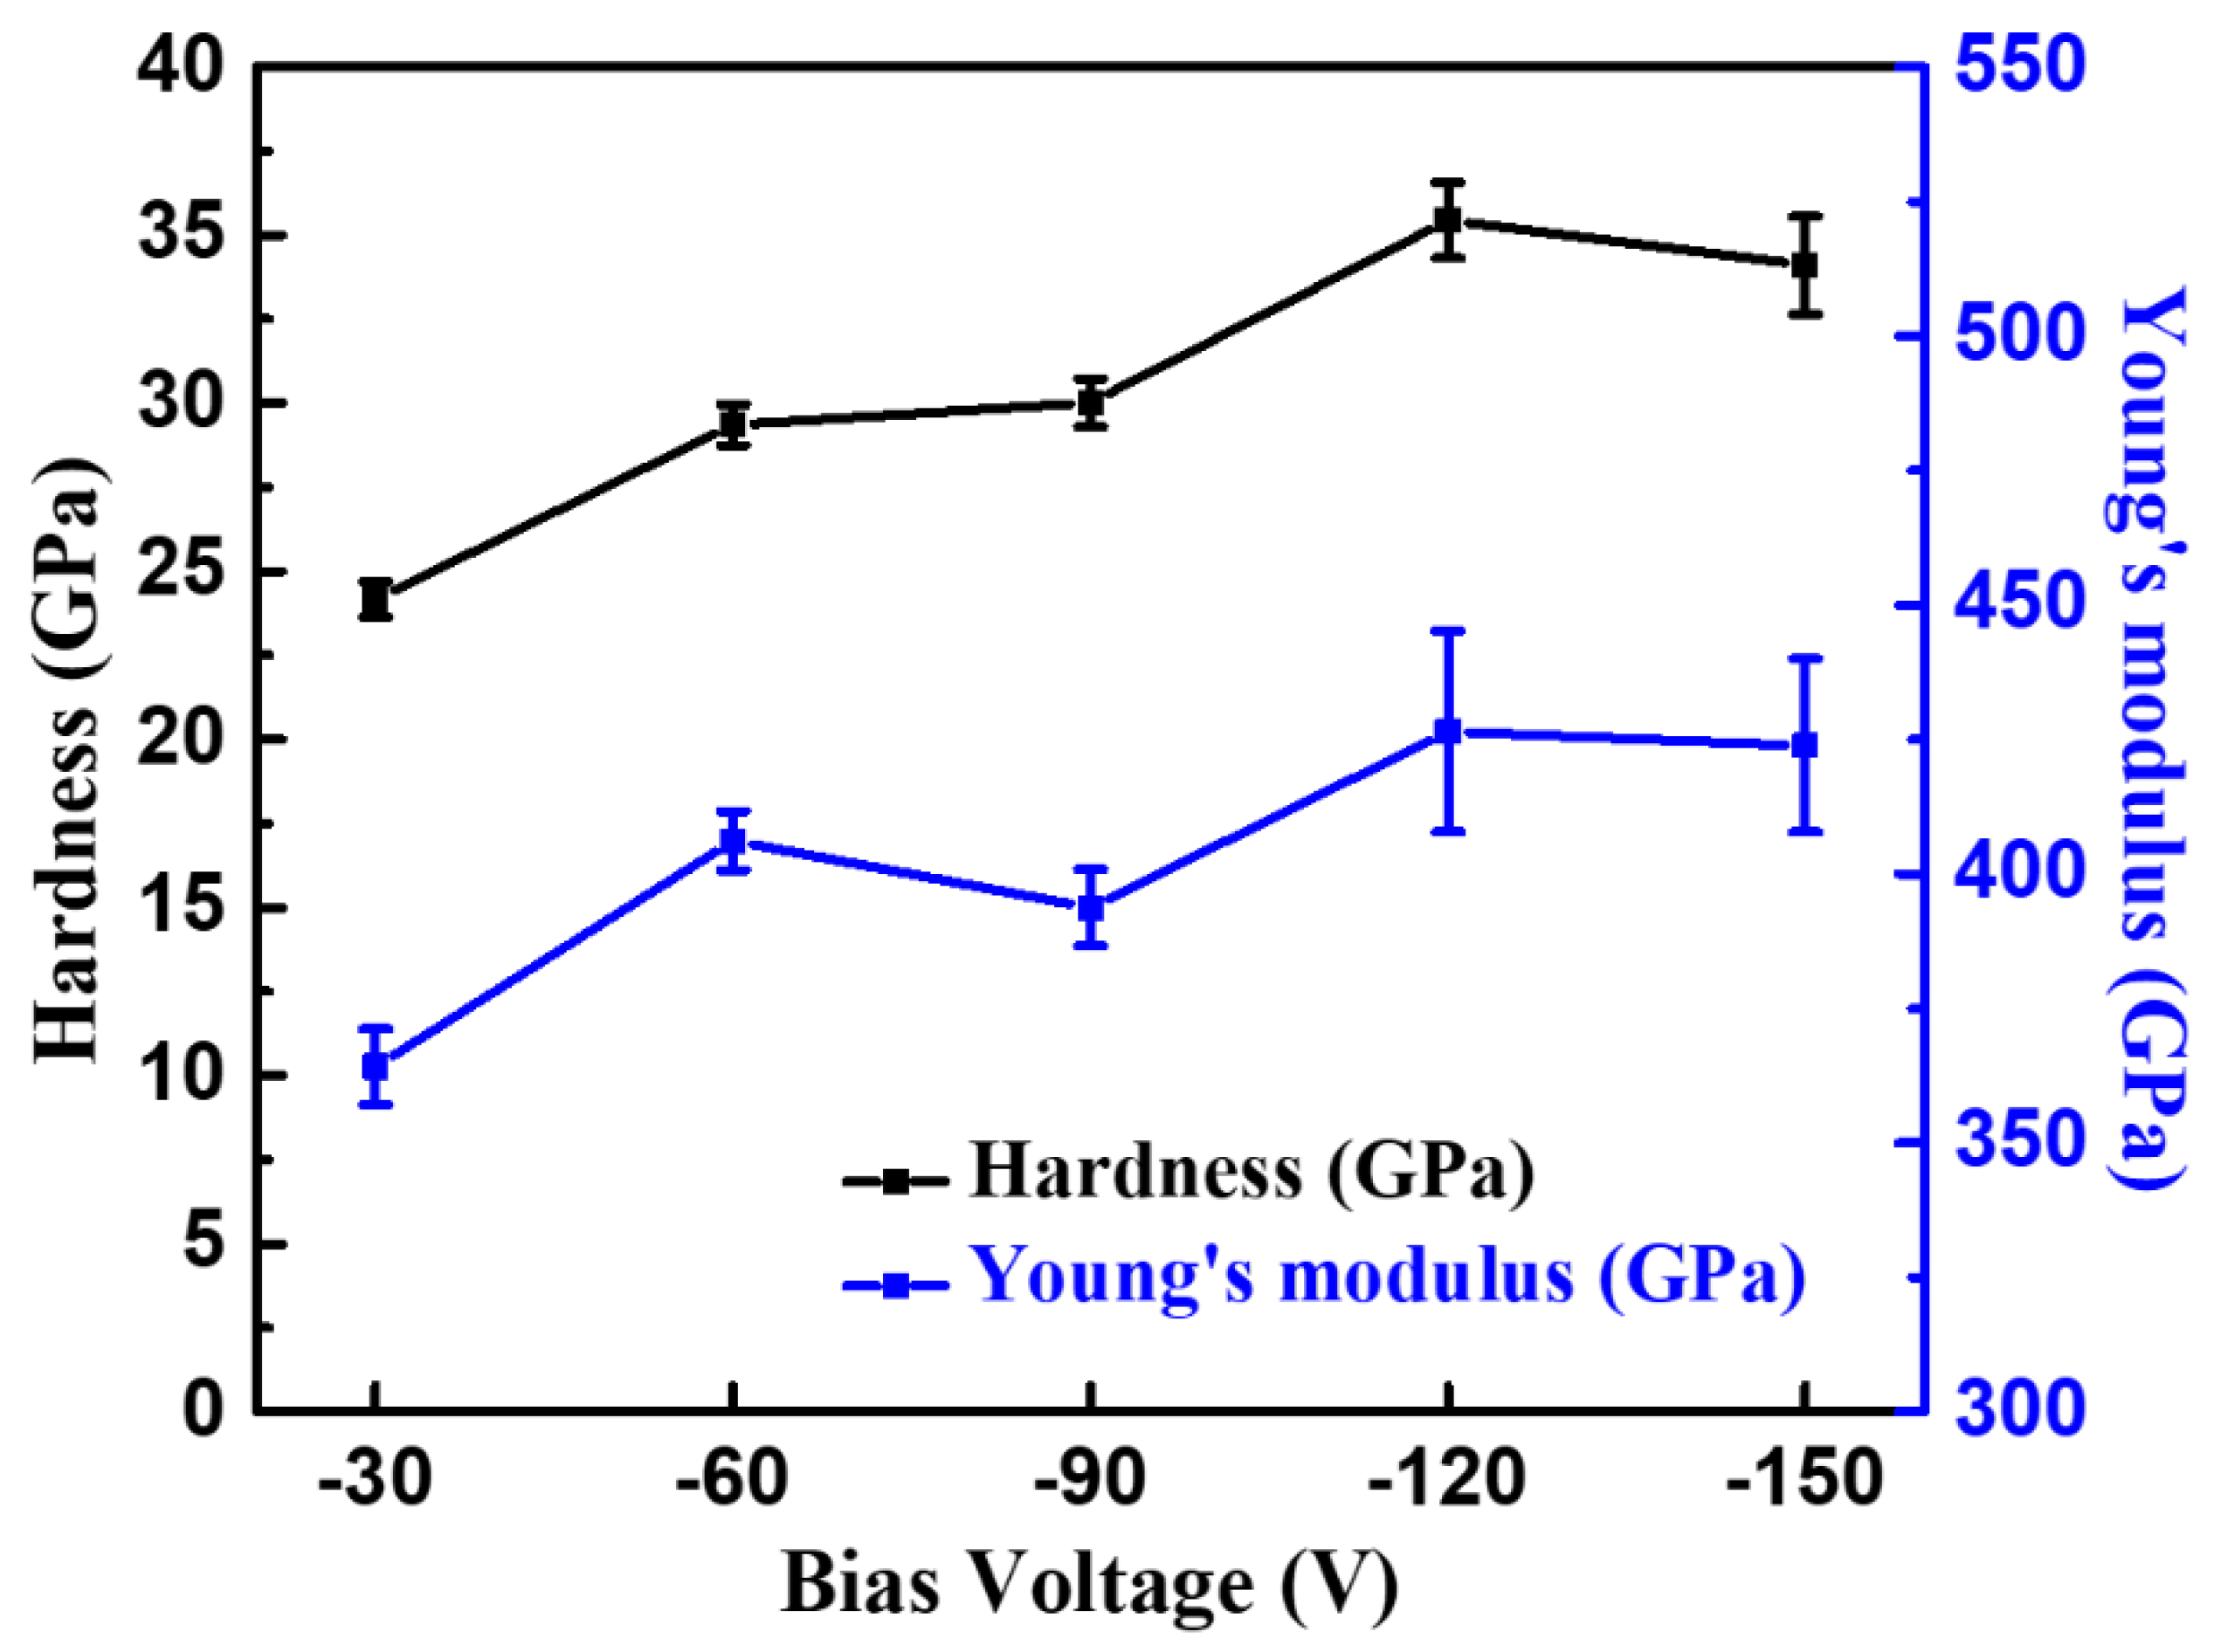
3.2. Effects of Bias Voltage on CrAlN Layers
4. Conclusions
Author Contributions
Funding
Acknowledgments
Conflicts of Interest
References
- Dubey, P.; Arya, V.; Srivastava, S.; Singh, D.; Chandra, R. Effect of nitrogen flow rate on structural and mechanical properties of Zirconium Tungsten Nitride (Zr–W–N) coatings deposited by magnetron sputtering. Surf. Coat. Technol. 2013, 236, 182–187. [Google Scholar] [CrossRef]
- Forsén, R.; Johansson, M.; Odén, M.; Ghafoor, N. Effects of Ti alloying of AlCrN coatings on thermal stability and oxidation resistance. Thin Solid Films 2013, 534, 394–402. [Google Scholar] [CrossRef]
- Tatemizo, N.; Imada, S.; Miura, Y.; Yamane, H.; Tanaka, K. Electronic structure of AlCrN films investigated using various photoelectron spectroscopies and ab initio calculations. J. Phys. Condens. Matter 2017, 29, 085502. [Google Scholar] [CrossRef] [PubMed]
- Shimizu, T.; Komiya, H.; Watanabe, T.; Teranishi, Y.; Nagasaka, H.; Morikawa, K.; Yang, M. HIPIMS deposition of TiAlN films on inner wall of micro-dies and its applicability in micro-sheet metal forming. Surf. Coat. Technol. 2014, 250, 44–51. [Google Scholar] [CrossRef]
- Paulitsch, J.; Schenkel, M.; Zufraß, T.; Mayrhofer, P.H.; Münz, W.-D. Structure and properties of high power impulse magnetron sputtering and DC magnetron sputtering CrN and TiN films deposited in an industrial scale unit. Thin Solid Films 2010, 518, 5558–5564. [Google Scholar] [CrossRef]
- Bobzin, K.; Lugscheider, E.; Nickel, R.; Bagcivan, N.; Krämer, A. Wear behavior of Cr1–xAlxN PVD-coatings in dry running conditions. Wear 2007, 263, 1274–1280. [Google Scholar] [CrossRef]
- Chang, Y.-Y.; Weng, S.-Y.; Chen, C.-H.; Fu, F.-X. High temperature oxidation and cutting performance of AlCrN, TiVN and multilayered AlCrN/TiVN hard coatings. Surf. Coat. Technol. 2017, 332, 494–503. [Google Scholar] [CrossRef]
- Chen, W.; Zheng, J.; Lin, Y.; Kwon, S.; Zhang, S. Comparison of AlCrN and AlCrTiSiN coatings deposited on the surface of plasma nitrocarburized high carbon steels. Appl. Surf. Sci. 2015, 332, 525–532. [Google Scholar] [CrossRef]
- Gilewicz, A.; Jedrzejewski, R.; Myslinski, P.; Warcholinski, B. Structure, Morphology, and Mechanical Properties of AlCrN Coatings Deposited by Cathodic Arc Evaporation. J. Mater. Eng. Perform. 2019, 28, 1522–1531. [Google Scholar] [CrossRef]
- Tillmann, W.; Kokalj, D.; Stangier, D.; Paulus, M.; Sternemann, C.; Tolan, M. Investigation of the influence of the vanadium content on the high temperature tribo-mechanical properties of DC magnetron sputtered AlCrVN thin films. Surf. Coat. Technol. 2017, 328, 172–181. [Google Scholar] [CrossRef]
- Endrino, J.; Fox-Rabinovich, G.; Reiter, A.; Veldhuis, S.; Galindo, R.E.; Albella, J.; Marco, J. Oxidation tuning in AlCrN coatings. Surf. Coat. Technol. 2007, 201, 4505–4511. [Google Scholar] [CrossRef]
- Tang, J.-F.; Lin, C.-Y.; Yang, F.-C.; Tsai, Y.-J.; Chang, C.-L. Effects of nitrogen-argon flow ratio on the microstructural and mechanical properties of AlCrN coatings prepared using high power impulse magnetron sputtering. Surf. Coat. Technol. 2020, 386, 125484. [Google Scholar] [CrossRef]
- Wang, Y.; Lee, J.-W.; Duh, J.-G. Mechanical strengthening in self-lubricating CrAlN/VN multilayer coatings for improved high-temperature tribological characteristics. Surf. Coat. Technol. 2016, 303, 12–17. [Google Scholar] [CrossRef]
- Jiang, X.; Yang, F.-C.; Chen, W.-C.; Lee, J.-W.; Chang, C.-L. Effect of nitrogen-argon flow ratio on the microstructural and mechanical properties of AlSiN thin films prepared by high power impulse magnetron sputtering. Surf. Coat. Technol. 2017, 320, 138–145. [Google Scholar] [CrossRef]
- Mahato, P.; Singh, R.; Pathak, L.; Mishra, S.K. Effect of nitrogen on mechanical, oxidation and structural behaviour of Ti–Si–B–C–N nanocomposite hard coatings deposited by DC sputtering. Surf. Interface Anal. 2016, 48, 1080–1089. [Google Scholar] [CrossRef]
- Chen, Y.-I.; Zheng, Y.-Z.; Chang, L.-C.; Liu, Y.-H. Effect of Bias Voltage on Mechanical Properties of HiPIMS/RFMS Cosputtered Zr–Si–N Films. Materials 2019, 12, 2658. [Google Scholar] [CrossRef]
- Biswas, B.; Purandare, Y.; Khan, I.; Hovsepian, P.E. Effect of substrate bias voltage on defect generation and their influence on corrosion and tribological properties of HIPIMS deposited CrN/NbN coatings. Surf. Coat. Technol. 2018, 344, 383–393. [Google Scholar] [CrossRef]
- Lomello, F.; Sanchette, F.; Schuster, F.; Tabarant, M.; Billard, A. Influence of bias voltage on properties of AlCrN coatings prepared by cathodic arc deposition. Surf. Coat. Technol. 2013, 224, 77–81. [Google Scholar] [CrossRef]
- Kim, U.-J.; Eom, S.H.; Wada, M. Thermal decomposition of native cellulose: Influence on crystallite size. Polym. Degrad. Stab. 2010, 95, 778–781. [Google Scholar] [CrossRef]
- Warcholinski, B.; Gilewicz, A.; Lupicka, O.; Kuprin, A.; Tolmachova, G.; Ovcharenko, V.; Kolodiy, I.; Sawczak, M.; Kochmanska, A.; Kochmanski, P. Structure of CrON coatings formed in vacuum arc plasma fluxes. Surf. Coat. Technol. 2017, 309, 920–930. [Google Scholar] [CrossRef]
- Oliver, W.C.; Pharr, G.M. An improved technique for determining hardness and elastic modulus using load and displacement sensing indentation experiments. J. Mater. Res. 1992, 7, 1564–1583. [Google Scholar] [CrossRef]
- Chen, S.-F.; Kuo, Y.-C.; Wang, C.-J.; Huang, S.-H.; Lee, J.-W.; Chan, Y.-C.; Chen, H.-W.; Duh, J.-G.; Hsieh, T.-E. The effect of Cr/Zr chemical composition ratios on the mechanical properties of CrN/ZrN multilayered coatings deposited by cathodic arc deposition system. Surf. Coat. Technol. 2013, 231, 247–252. [Google Scholar] [CrossRef]
- Hiratsuka, M.; Azuma, A.; Nakamori, H.; Kogo, Y.; Yukimura, K. Extraordinary deposition rate of diamond-like carbon film using HIPIMS technology. Surf. Coat. Technol. 2013, 229, 46–49. [Google Scholar] [CrossRef]
- Liu, H.; Tang, J.-F.; Wang, X.; Li, W.; Chang, C.-L. Effects of nitrogen-argon flow ratio on the microstructural and mechanical properties of TiAlSiN/CrN multilayer coatings prepared using high power impulse magnetron sputtering. J. Vac. Sci. Technol. A 2019, 37, 051501. [Google Scholar] [CrossRef]
- Li, Q.; Cheng, X.; Gong, D.; Ye, W. Effect of N2 flow rate on structural and infrared properties of multi-layer AlCrN/Cr/AlCrN coatings deposited by cathodic arc ion plating for low emissivity applications. Thin Solid Films 2019, 675, 74–85. [Google Scholar] [CrossRef]
- Ferreira, F.; Oliveira, J.; Cavaleiro, A. CrN thin films deposited by HiPIMS in DOMS mode. Surf. Coat. Technol. 2016, 291, 365–375. [Google Scholar] [CrossRef]
- Han, Z.; Tian, J.; Lai, Q.; Yu, X.; Li, G. Effect of N2 partial pressure on the microstructure and mechanical properties of magnetron sputtered CrNx films. Surf. Coat. Technol. 2003, 162, 189–193. [Google Scholar] [CrossRef]
- Forniés, E.; Galindo, R.E.; Sánchez, O.; Albella, J. Growth of CrNx films by DC reactive magnetron sputtering at constant N2/Ar gas flow. Surf. Coat. Technol. 2006, 200, 6047–6053. [Google Scholar] [CrossRef]
- Warcholinski, B.; Gilewicz, A.; Kuprin, A.; Tolmachova, G.; Ovcharenko, V.; Kuznetsova, T.; Zubar, T.; Khudoley, A.; Chizhik, S. Mechanical properties of Cr-ON coatings deposited by cathodic arc evaporation. Vacuum 2018, 156, 97–107. [Google Scholar] [CrossRef]
- Wasekar, N.P.; Haridoss, P.; Seshadri, S.; Sundararajan, G. Sliding wear behavior of nanocrystalline nickel coatings: Influence of grain size. Wear 2012, 296, 536–546. [Google Scholar] [CrossRef]
- Li, B.-S.; Wang, T.-G.; Ding, J.; Cai, Y.; Shi, J.; Zhang, X. Influence of N2/Ar flow ratio on microstructure and properties of the AlCrSiN coatings deposited by high-power impulse magnetron sputtering. Coatings 2018, 8, 3. [Google Scholar] [CrossRef]
- Warcholinski, B.; Gilewicz, A.; Kuznetsova, T.; Zubar, T.; Chizhik, S.; Abetkovskaia, S.; Lapitskaya, V. Mechanical properties of Mo (C) N coatings deposited using cathodic arc evaporation. Surf. Coat. Technol. 2017, 319, 117–128. [Google Scholar] [CrossRef]
- Greczynski, G.; Jensen, J.; Hultman, L. Films Prepared by DC Magnetron Sputtering and High-Power Pulsed Magnetron Sputtering: A Comparative Study. IEEE Trans. Plasma Sci. 2010, 38, 3046–3056. [Google Scholar] [CrossRef]
- Hurkmans, T.; Lewis, D.; Brooks, J.; Münz, W.-D. Chromium nitride coatings grown by unbalanced magnetron (UBM) and combined arc/unbalanced magnetron (ABS™) deposition techniques. Surf. Coat. Technol. 1996, 86, 192–199. [Google Scholar] [CrossRef]
- Sabitzer, C.; Paulitsch, J.; Kolozsvári, S.; Rachbauer, R.; Mayrhofer, P. Influence of bias potential and layer arrangement on structure and mechanical properties of arc evaporated Al–Cr–N coatings. Vacuum 2014, 106, 49–52. [Google Scholar] [CrossRef]
- Lv, Y.; Ji, L.; Liu, X.; Li, H.; Zhou, H.; Chen, J. Influence of substrate bias voltage on structure and properties of the CrAlN films deposited by unbalanced magnetron sputtering. Appl. Surf. Sci. 2012, 258, 3864–3870. [Google Scholar] [CrossRef]
- Nouveau, C.; Djouadi, M.; Banakh, O.; Sanjinés, R.; Lévy, F. Stress and structure profiles for chromium nitride coatings deposited by rf magnetron sputtering. Thin Solid Films 2001, 398, 490–495. [Google Scholar] [CrossRef]
- Pelleg, J.; Zevin, L.; Lungo, S.; Croitoru, N. Reactive-sputter-deposited TiN films on glass substrates. Thin Solid Films 1991, 197, 117–128. [Google Scholar] [CrossRef]
- Warcholinski, B.; Kuznetsova, T.; Gilewicz, A.; Zubar, T.; Lapitskaya, V.; Chizhik, S.; Komarov, A.; Komarova, V.; Kuprin, A.; Ovcharenko, V.; et al. Structural and mechanical properties of Zr-Si-N coatings deposited by arc evaporation at different substrate bias voltages. J. Mater. Eng. Perform. 2018, 27, 3940–3950. [Google Scholar] [CrossRef]
- Rong, S.; He, J.; Wang, H.; Tian, C.; Guo, L.; Fu, D. Effects of bias voltage on the structure and mechanical properties of thick CrN coatings deposited by mid-frequency magnetron sputtering. Plasma Sci. Technol. 2009, 11, 38. [Google Scholar] [CrossRef]
- Lee, J.-W.; Tien, S.-K.; Kuo, Y.-C. The effects of pulse frequency and substrate bias to the mechanical properties of CrN coatings deposited by pulsed DC magnetron sputtering. Thin Solid Films 2006, 494, 161–167. [Google Scholar] [CrossRef]
- Kong, Q.; Ji, L.; Li, H.; Liu, X.; Wang, Y.; Chen, J.; Zhou, H. Influence of substrate bias voltage on the microstructure and residual stress of CrN films deposited by medium frequency magnetron sputtering. Mater. Sci. Eng. B 2011, 176, 850–854. [Google Scholar] [CrossRef]
- Chen, X.; Xi, Y.; Meng, J.; Pang, X.; Yang, H. Effects of substrate bias voltage on mechanical properties and tribological behaviors of RF sputtered multilayer TiN/CrAlN films. J. Alloys Compd. 2016, 665, 210–217. [Google Scholar] [CrossRef]
- Iram, S.; Cai, F.; Wang, J.; Zhang, J.; Liang, J.; Ahmad, F.; Zhang, S. Effect of Addition of Mo or V on the Structure and Cutting Performance of AlCrN-Based Coatings. Coatings 2020, 10, 298. [Google Scholar] [CrossRef]


| N2/Ar (%) | Peak Power Density (kW/cm2) | Atomic Ratio (at.%) | Al/Cr Ratio | Al/(Al+Cr) Ratio x | N/(Al+Cr) Ratio | |||
|---|---|---|---|---|---|---|---|---|
| Al | Cr | N | O | |||||
| 20 | 1.16 | 37.9 | 36.1 | 25.6 | 0.40 | 1.05 | 0.51 | 0.34 |
| 40 | 1.20 | 29.7 | 28.3 | 41.6 | 0.37 | 1.05 | 0.51 | 0.71 |
| 60 | 1.26 | 24.7 | 22.7 | 52.3 | 0.28 | 1.08 | 0.52 | 1.11 |
| 80 | 1.46 | 24.6 | 22.3 | 52.9 | 0.23 | 1.09 | 0.52 | 1.12 |
| 100 | 1.52 | 24.2 | 22.2 | 53.1 | 0.48 | 1.08 | 0.52 | 1.14 |
| 120 | 1.54 | 24.6 | 23.0 | 52.0 | 0.35 | 1.06 | 0.51 | 1.09 |
| 140 | 1.60 | 25.7 | 22.8 | 51.0 | 0.46 | 1.12 | 0.52 | 1.05 |
| N2/Ar (%) | Lattice Parameter (nm) | Microstrain ε | Texture Coefficient Tc | ||
|---|---|---|---|---|---|
| (111) | (200) | (220) | |||
| 60 | 0.4128 | 3.57 × 10⁻³ | 1.39 | 0.37 | 1.23 |
| 80 | 0.4143 | 4.07 × 10⁻³ | 1.26 | 0.52 | 1.22 |
| 100 | 0.4156 | 5.01 × 10⁻³ | 1.01 | 0.96 | 1.03 |
| 120 | 0.4170 | 5.33 × 10⁻³ | 0.87 | 1.03 | 1.09 |
| 140 | 0.4187 | 4.80 × 10⁻³ | 0.98 | 1.12 | 0.89 |
| N2/Ar (%) | Hardness (GPa) | Elastic Modulus (GPa) | H/E | H3/E2 | Lc1 (N) | COF | Wear Rate (mm3·N−1·m−1) | Residual Stress (GPa) |
|---|---|---|---|---|---|---|---|---|
| 20 | 11.5 ± 0.5 | 208 ± 7 | 0.055 | 0.035 | 54.6 | 0.79 | 9.40 × 10⁻⁶ | −0.5 |
| 40 | 13.5 ± 0.6 | 265 ± 10 | 0.050 | 0.035 | 51.2 | 0.73 | 8.07 × 10⁻⁶ | −0.5 |
| 60 | 17.7 ± 1.6 | 356 ± 34 | 0.049 | 0.043 | 50.7 | 0.78 | 3.53 × 10⁻⁶ | −1.5 |
| 80 | 21.7 ± 1.3 | 383 ± 14 | 0.056 | 0.069 | 48.1 | 0.88 | 3.11 × 10⁻⁶ | −1.7 |
| 100 | 29.3 ± 0.6 | 406 ± 15 | 0.072 | 0.152 | 46.6 | 0.71 | 2.71 × 10⁻⁶ | −2.3 |
| 120 | 28.7 ± 0.7 | 397 ± 16 | 0.072 | 0.149 | 45.4 | 0.86 | 2.24 × 10⁻⁶ | −2.4 |
| 140 | 28.9 ± 1.3 | 392 ± 20 | 0.073 | 0.157 | 41.8 | 0.73 | 2.45 × 10⁻⁶ | −2.8 |
| Bias Voltage (V) | Atomic Ratio (at.%) | Al/Cr Ratio | Al/(Al+Cr) Ratio, x | N/(Al+Cr) Ratio | |||
|---|---|---|---|---|---|---|---|
| Al | Cr | N | O | ||||
| −30 | 23.8 | 21.7 | 54.1 | 0.37 | 1.09 | 0.52 | 1.19 |
| −60 | 24.2 | 22.2 | 53.1 | 0.48 | 1.08 | 0.52 | 1.14 |
| −90 | 25.8 | 21.0 | 52.9 | 0.27 | 1.22 | 0.55 | 1.12 |
| −120 | 25.6 | 21.7 | 52.4 | 0.34 | 1.18 | 0.54 | 1.10 |
| −150 | 25.6 | 21.1 | 52.7 | 0.30 | 1.22 | 0.55 | 1.12 |
| Bias Voltage (V) | Lattice Parameter (nm) | Microstrain ε | Texture Coefficient Tc | ||
|---|---|---|---|---|---|
| (111) | (200) | (220) | |||
| −30 | 0.4143 | 5.06 × 10⁻³ | 0.51 | 1.51 | 0.97 |
| −60 | 0.4156 | 5.01 × 10⁻³ | 1.01 | 0.96 | 1.03 |
| −90 | 0.4162 | 6.57 × 10⁻³ | 0.92 | 1.29 | 0.78 |
| −120 | 0.4186 | 7.10 × 10⁻³ | 1.07 | 1.01 | 0.92 |
| −150 | 0.4195 | 6.78 × 10⁻³ | 1.04 | 1.06 | 0.88 |
| Bias Voltage (V) | Hardness (GPa) | Elastic Modulus (GPa) | H/E | H3/E2 | Crystallite Size (nm) | Lc1 (N) | COF | Wear Rate (mm3·N−1·m−1) | Residual Stress (GPa) | |
|---|---|---|---|---|---|---|---|---|---|---|
| (111) | (200) | |||||||||
| −30 | 24.1 ± 0.5 | 364 ± 6 | 0.066 | 0.105 | 16.8 | 13.9 | 39.3 | 0.74 | 3.02 × 10⁻⁶ | −1.3 |
| −60 | 29.3 ± 0.6 | 406 ± 5 | 0.072 | 0.152 | 14.1 | 11.0 | 46.6 | 0.71 | 2.71 × 10⁻⁶ | −2.3 |
| −90 | 30.1 ± 0.7 | 400 ± 7 | 0.076 | 0.170 | 12.1 | 10.9 | 44.1 | 0.80 | 2.12 × 10⁻⁶ | −2.5 |
| −120 | 35.4 ± 1.1 | 426 ± 18 | 0.083 | 0.244 | 12.0 | 8.0 | 43.6 | 0.72 | 2.11 × 10⁻⁶ | −2.9 |
| −150 | 34.1 ± 1.4 | 423 ± 15 | 0.081 | 0.221 | 10.6 | 7.4 | 42.8 | 0.73 | 2.89 × 10⁻⁶ | −3.1 |
© 2020 by the authors. Licensee MDPI, Basel, Switzerland. This article is an open access article distributed under the terms and conditions of the Creative Commons Attribution (CC BY) license (http://creativecommons.org/licenses/by/4.0/).
Share and Cite
Tang, J.-F.; Lin, C.-Y.; Yang, F.-C.; Chang, C.-L. Influence of Nitrogen Content and Bias Voltage on Residual Stress and the Tribological and Mechanical Properties of CrAlN Films. Coatings 2020, 10, 546. https://doi.org/10.3390/coatings10060546
Tang J-F, Lin C-Y, Yang F-C, Chang C-L. Influence of Nitrogen Content and Bias Voltage on Residual Stress and the Tribological and Mechanical Properties of CrAlN Films. Coatings. 2020; 10(6):546. https://doi.org/10.3390/coatings10060546
Chicago/Turabian StyleTang, Jian-Fu, Ching-Yen Lin, Fu-Chi Yang, and Chi-Lung Chang. 2020. "Influence of Nitrogen Content and Bias Voltage on Residual Stress and the Tribological and Mechanical Properties of CrAlN Films" Coatings 10, no. 6: 546. https://doi.org/10.3390/coatings10060546
APA StyleTang, J.-F., Lin, C.-Y., Yang, F.-C., & Chang, C.-L. (2020). Influence of Nitrogen Content and Bias Voltage on Residual Stress and the Tribological and Mechanical Properties of CrAlN Films. Coatings, 10(6), 546. https://doi.org/10.3390/coatings10060546