Article

Structure of DPPC Monolayers at the Air/Buffer Interface: A Neutron Reflectometry and Ellipsometry Study

by
Javier Carrascosa-Tejedor
1,2,†,
Andreas Santamaria
1,3,†,
Daniel Pereira
1 and
Armando Maestro
1,*
1
Large Scale Structures Group, Institut Laue-Langevin, 71 Avenue des Martyrs, CEDEX 9, 38042 Grenoble, France
2
Division of Pharmacy and Optometry, University of Manchester, Manchester M13 9PT, UK
3
Departamento de Química - Física I, Facultad de Ciencias Químicas, Universidad Complutense de Madrid, Ciudad Universitaria s/n, 28040 Madrid, Spain
*
Author to whom correspondence should be addressed.
These authors contributed equally to this work.
Coatings 2020, 10(6), 507; https://doi.org/10.3390/coatings10060507
Submission received: 1 April 2020 / Revised: 18 May 2020 / Accepted: 21 May 2020 / Published: 26 May 2020
(This article belongs to the Special Issue Fluid Interfaces)

Abstract

:
Langmuir monolayers of 1,2-dipalmitoyl-sn-glycerol-3-phosphocholine, known as DPPC, at the air/water interface are extensively used as model systems of biomembranes and pulmonary surfactant. The properties of these monolayers have been mainly investigated by surface pressure–area isotherms coupled with different complementary techniques such as Brewster angle microscopy, for example. Several attempts using neutron reflectometry (NR) or ellipsometry have also appeared in the literature. Here, we report structural information obtained by using NR and ellipsometry on DPPC monolayers in the liquid condensed phase. On one side, NR can resolve the thickness of the aliphatic tails and the degree of hydration of the polar headgroups. On the other side, ellipsometry gives information on the refractive index and, therefore, on the physical state of the monolayer. The thickness and surface excess obtained by multiple-angle-of-incidence ellipsometry (MAIE) is compared with the results from NR measurements yielding a good agreement. Besides, a novel approach is reported to calculate the optical anisotropy of the DPPC monolayer that depends on the orientation of the aliphatic chains. The results from both NR and ellipsometry are also discussed in the context of the existing results for DPPC monolayers at the air/water interface. The differences observed are rationalized by the presence of buffer molecules interacting with phospholipids.

1. Introduction

Synthetic in vitro lipid mono- and bilayers, as well as uni- and multi-lamellar vesicles, can be considered as simple biomembrane models. For more than 20 years, 1,2-dipalmitoyl-sn-glycerol-3-phosphocholine (DPPC) has been widely exploited to mimic plasma membranes or lung surfactant, mostly in the form of monolayers at the air/water interface. Indeed, phospholipids with 16- and 18-carbon fatty acids chains are the most abundant in plasma membranes [1,2]. DPPC is, therefore, a well-studied lipid. Besides, DPPC has being used alone or in combination with other lipids, to study the interaction of biomembrane with proteins [3,4], anticancer [5,6,7,8] and antifungal [9] compounds, and small molecules of biological relevance, such as cholesterol [10], hormones [11], and antibiotics [12]. Its handling simplicity, relatively low price, and stability at room temperature as well as when exposed to air, make DPPC a versatile model system for biomedical research.
In general, phospholipid monolayers at the air/water interface can be characterized by different techniques such as microscopy (e.g., atomic force microscopy, AFM, and Brewster angle microscopy, BAM), scattering (e.g., neutron reflectometry, NR, and X-ray reflectometry, XRR), and ellipsometric and spectroscopic (e.g., polarization modulation infrared reflection–absorption spectroscopy) techniques, together with surface pressure-area (Π-A) isotherms. Currently, there are many outstanding examples of the usefulness of this combinatorial approach, exploited to study DPPC monolayers structure and properties [13,14] as well as their interaction with different cations [15], nanoparticles [16], graphite-based compounds [17], and molecules of biological relevance, such as proteins [4,18], small peptides [19], and antibiotics [12].
Different techniques have been used to study the structure and optical properties of lipid monolayers. Indeed, the refractive index of the film (nF) in combination with the reflectivity allows obtaining the thickness (dF) of the monolayers. Kienle et al. successfully used multiple beam interferometry to determine simultaneously nF and dF of DPPC and DPPE (1,2-dipalmitoyl-sn-glycero-3-phosphoethanolamine) supported monolayers at high surface pressures [20]. The results obtained by this technique were in good agreement with those obtained by XRR and AFM. Another approach to determine nF of monolayers at the air/water interface is looking at the minimum of the reflectivity as a function of the refractive index of the subphase. Pusterla et al. used this approach varying the concentration of glycerol or sucrose in the subphase, with known refractive indices [21]; the refractive index of the monolayer is equal to the one of the subphase when the reflectivity is minimum. Besides, knowing the refractive index and the reflectivity they calculated dF. The determination of the increment of the refractive index with concentration (dn/dc) constitutes another alternative to obtain nF. The subsequent application of the lipid density to the dn/dc provides nF [22]. However, nF can slightly vary with the surface pressure, especially from one phase to another, so it is necessary to take into account the physical state of the monolayer to know its nF [23]. NR has also been widely exploited to perform studies at the air/water interface to investigate the structure and properties of lipid monolayers [24,25,26]. This technique enables complete structural characterization of the monolayers, giving information about the chemical composition along the axis normal to the interface, the thickness of both polar headgroups layer and hydrophobic tails layer when a two-layer model is used to interpret the data. Through NR it is also possible to determine the hydration degree of the lipids, as well as the surface excess and the area per molecule at a certain value of surface pressure [27]. Hence, NR is a very powerful tool to study lipid monolayers at the air/water interface.
Traditionally, ellipsometry has been one of the most exploited techniques to study surfactant and lipid monolayers at the air/water interface [28,29]. It gives access to the determination of the thickness and the refractive index of films, and it is useful to investigate the interaction of monolayers with different molecules such as proteins [30,31] or nanoparticles [32,33] through time/spatial resolved experiments. Nevertheless, the simultaneous determination of the nF and the dF for Langmuir films at the air/water interface with dF << λ by the measurement of the phase shift at a fixed angle of incidence, can give inaccurate results due to the strong coupling of the parameters [29,34]. The combination of ellipsometry with other techniques that give access to the determination of one of the parameters allows the accurate determination of the other one by ellipsometry [35,36]. Benjamins et al. developed a method for the study of films at liquid interfaces by ellipsometry without assumptions of the thickness or the refractive index [37]. They demonstrated that the combination of measurements performed for the same system using D2O and H2O as the subphase, i.e., different refractive indices of the subphase, give enough additional information to determine the amount of material adsorbed.
In this work, we use the combination of two reflection techniques, NR and ellipsometry, and surface pressure measurements to determine the interfacial structure and the optical properties, including the refractive index anisotropy, of a condensed DPPC monolayer at the air/buffer interface (see Figure 1). Besides, we show how HKM buffer molecules (see composition below), widely exploited in biological assays, are responsible for the differences observed in the structure and density of DPPC monolayers.
This work reports complementary measurements from two different methods. On one hand, NR, which has been demonstrated to be a suitable technique for the investigation of the structure at the sub-nm scale of thin films, allowed us to determine the thickness of the aliphatic chains and the level of hydration of the polar headgroups of the DPPC monolayer. On the other hand, we propose a novel ellipsometric method to determine both the surface excess and the optical anisotropy shown by the DPPC monolayer in the condensed phase that depends on the orientation of the aliphatic chains.

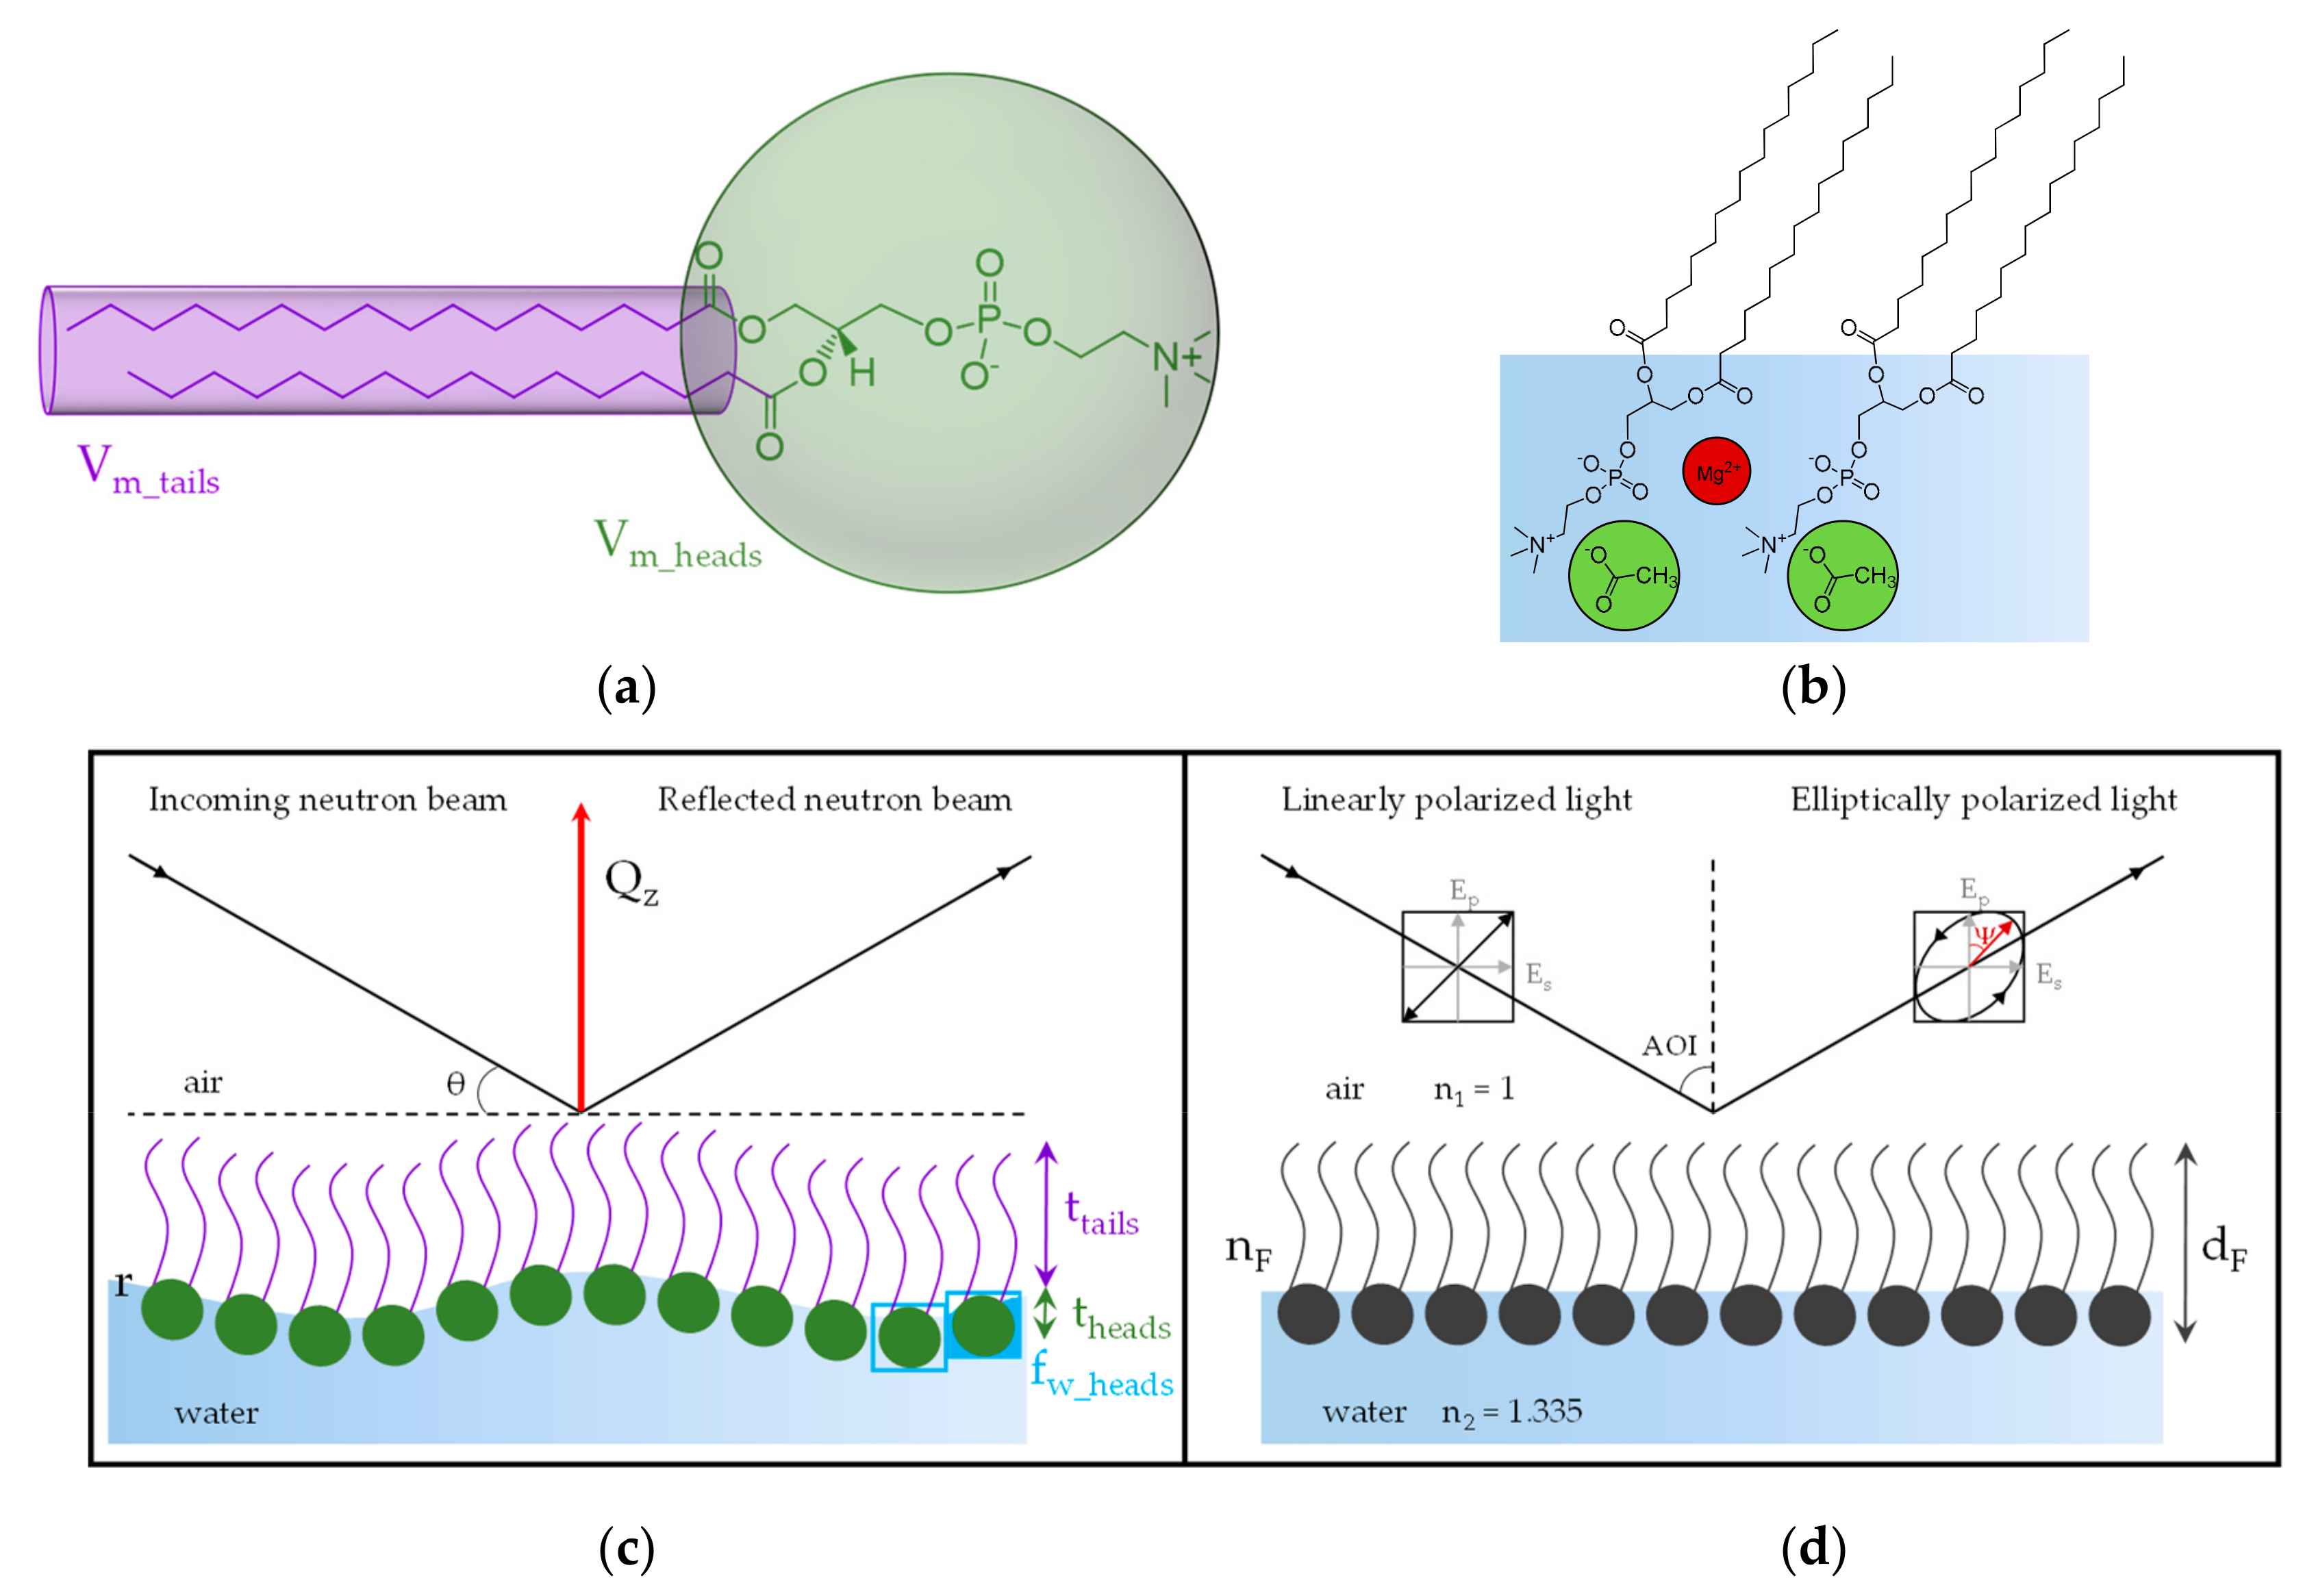
2. Materials and Methods

2.1. Materials

Hydrogenous DPPC (h-DPPC) and chain-deuterated DPPC (d62-DPPC) were purchased as powder from Avanti Polar Lipids (>99%, Alabaster, AL, USA). Solutions of 1 mg·mL−1 of h-DPPC, d62-DPPC, and h-DPPC/d62-DPPC (95:5 mol %) mixture, from now on contrast matched DPPC (cm-DPPC), were prepared in chloroform stabilized with ethanol (99.8%; Sigma Aldrich, St. Louis, MO, USA). Ultra-pure water was generated by passing deionized water through a Milli-Q unit (total organic content = 4 ppb; resistivity = 18 mΩ·cm, Millipore, Burlington, MA, USA). D2O (99.9%) was purchased from Sigma Aldrich and used as received.
The experiments were performed in HKM buffer pH = 7.2, whose composition is the following: 25 mM HEPES (4-(2-hydroxyethyl)piperazine-1-ethanesulfonic acid and N-(2-hydroxyethyl)piperazine-N’-(2-ethanesulfonic acid)), 125 mM potassium acetate, 5 mM magnesium acetate, and 1 mM DTT (threo-1,4-dimercapto-2,3-butanediol, DL-dithiothreitol, Cleland’s reagent, and DTT). HEPES (in solution, 1 M in H2O, and powder 99.5%), potassium acetate (≥99.0%), magnesium acetate (≥99.0%), and DTT (≥99.0%) were purchased from Sigma Aldrich.

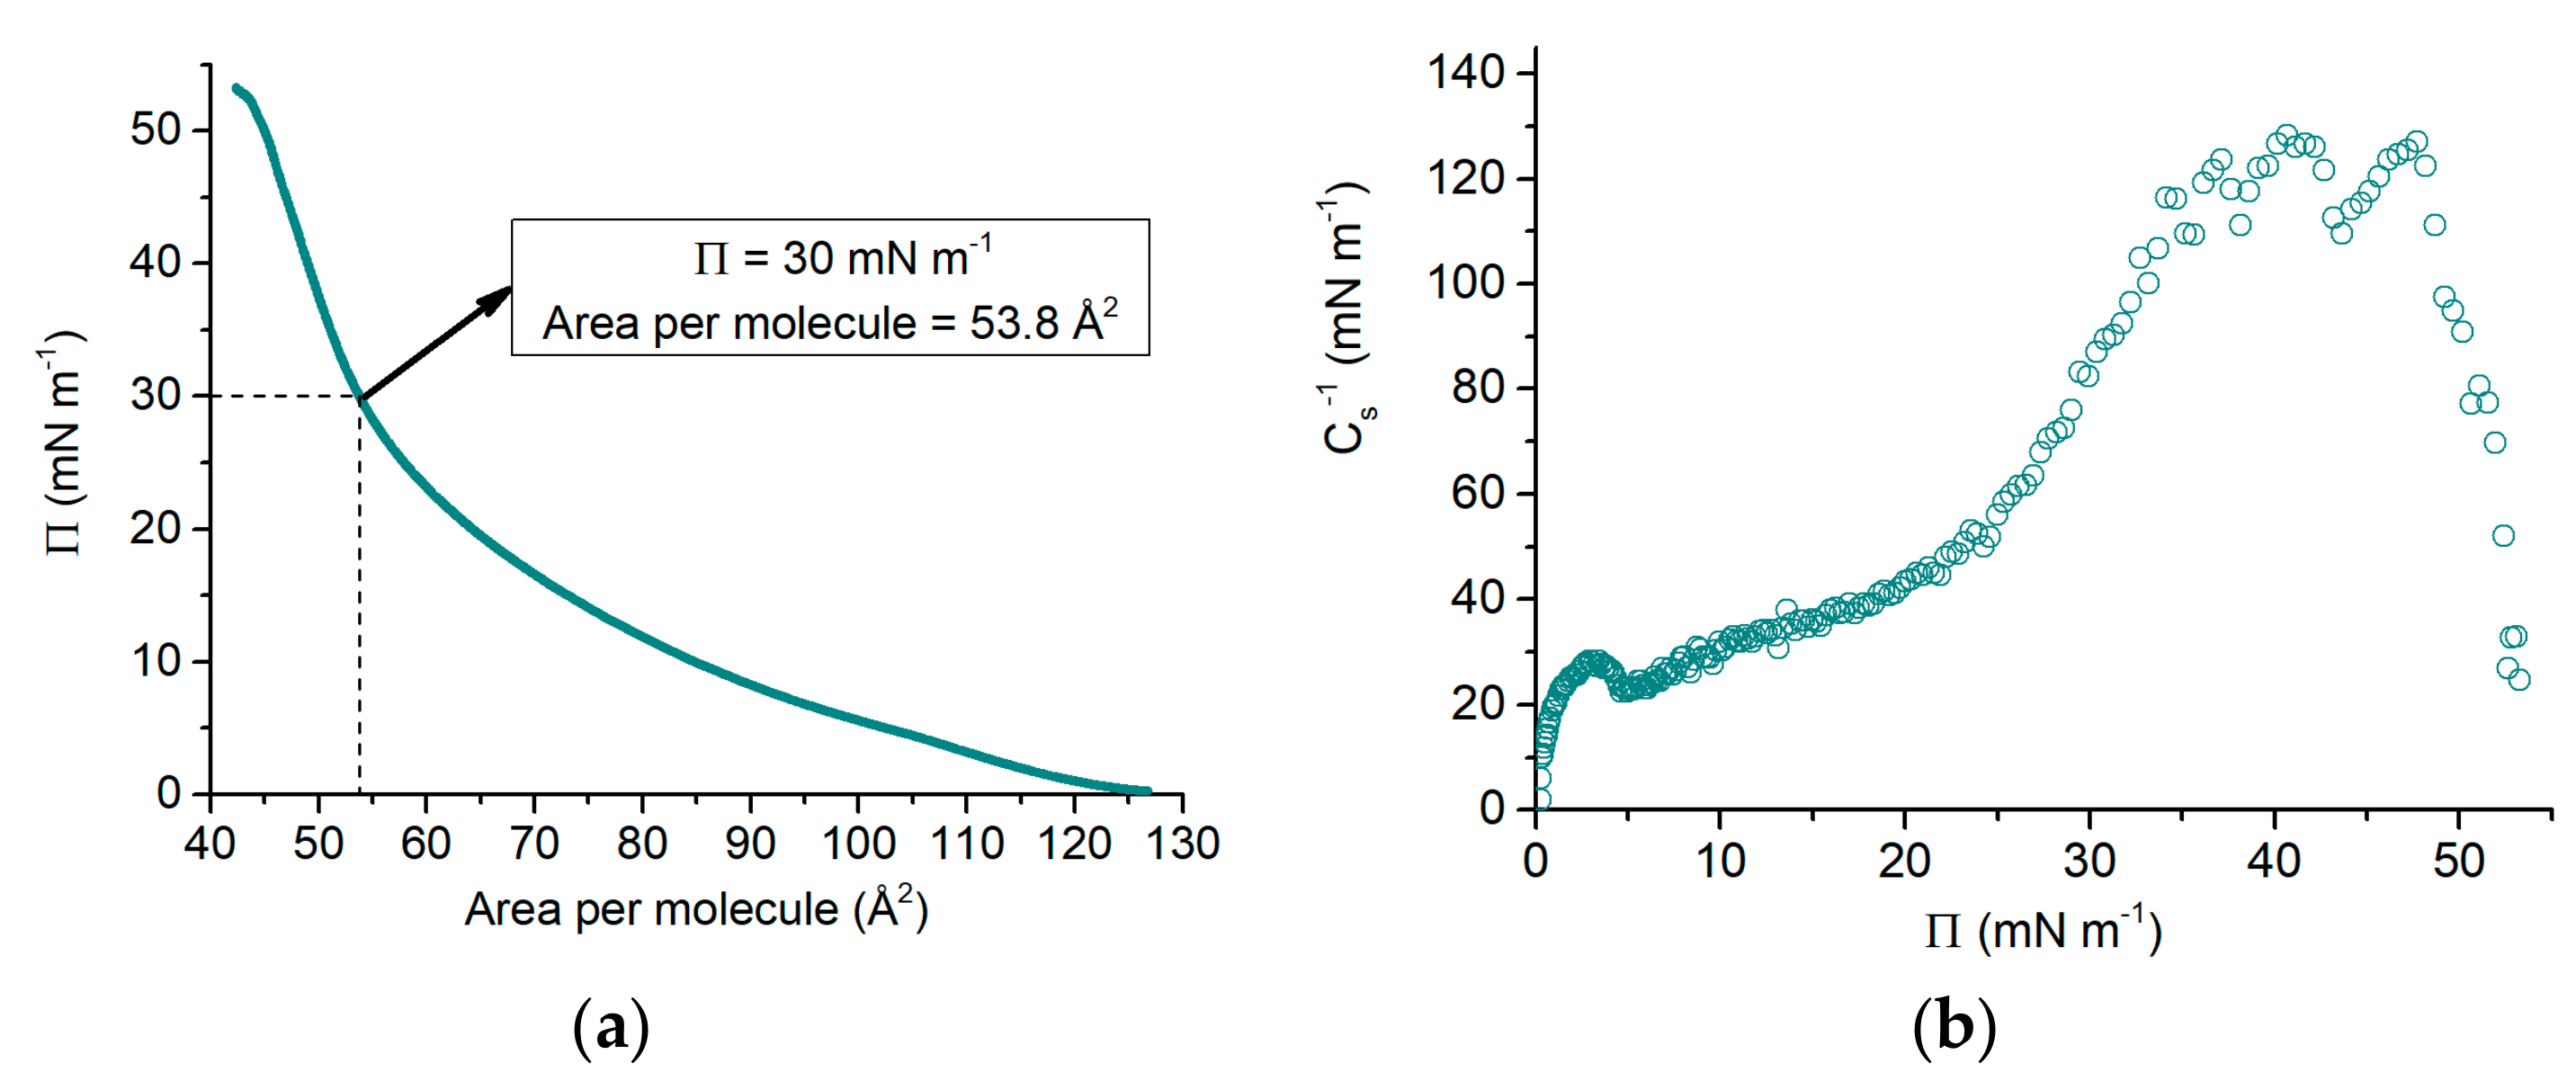
2.2. Surface Pressure-Area Isotherm

The surface pressure (Π)-Area (A) isotherm of h-DPPC was measured using a Langmuir trough (Kibron, Finland) with a maximum area of 166.4 cm2. The trough was carefully cleaned with ethanol and Milli-Q water before filling it with 120 mL of HKM buffer. Subsequently, the solution of h-DPPC with a concentration of 0.1 mg·mL−1 was spread over the subphase using a Hamilton microsyringe (Hamilton Co., Reno, NV, USA) with a precision of 1 μL. After the chloroform was evaporated for about 20 min, the variation of surface pressure during three different compression/expansion cycles was recorded using a Wilhelmy plate made of filter paper and applying a barrier speed of 5 cm2·min−1. The same cleaning and experiment preparation methods were followed for the NR and ellipsometry measurements. In all the experiments performed in this work, the temperature of the subphase was maintained at 21.0 ± 0.5 °C. Finally, it should be noted here that parameters such as the compression rate, the spreading solvent, the geometry and the dimensions of the trough, the temperature, or the composition of the subphase can affect the resulting isotherm [38]. In view of this, we compare our data with other isotherms performed in a similar way, including a similar compression ratio and spreading solvent.

2.3. Neutron Reflectometry Data Acquisition

Neutron reflectometry (NR) experiments were performed on FIGARO, a time-of-flight reflectometer [27,39,40] at the Institut Laue-Langevin, Grenoble (France). Two different angles of incidence (θ1 = 0.6° and θ2 = 3.7°) and a wavelength resolution of 7% dλ/λ were used, yielding a momentum transfer of 7 × 10⁻³ Å−1 < QZ < 0.25 Å−1, normal to the interface, and defined as follows:
Q z = 4 π λ sin ϑ
where λ is the wavelength of the neutron beam. Usually, reflectivity (R) is defined as the ratio of the intensity of the neutrons scattered from the air/water interface over the incident intensity of the neutron beam. The measured R(QZ) profile is linked to an in plane-averaged scattering length density (SLD) profile perpendicular to the interface, which is a measure of the coherent scattering cross-section of the molecular species that constitutes each interfacial layer. The data were reduced using COSMOS [41]. Data of the samples were normalized to a measurement of pure D2O.
NR experiments were performed using HKM buffer prepared with a mixture 8:92 V/V % of D2O:H2O as a solvent, generally known as air contrast matched water (ACMW) since its scattering length density is equal to the one of air, i.e., equals to zero. h-DPPC, cm-DPPC (with an SLD of the aliphatic tails equals to zero), and d62-DPPC monolayers were prepared using a Langmuir trough (NIMA, Coventry, UK) with a total area of 354 cm2. The volume of HKM buffer used to fill the trough was 200 mL. We compressed the monolayer with a barrier speed of 10 cm2·min−1 until Π = 30 mN·m−1 and we used the pressure control to keep the pressure constant along the reflectivity measurements.

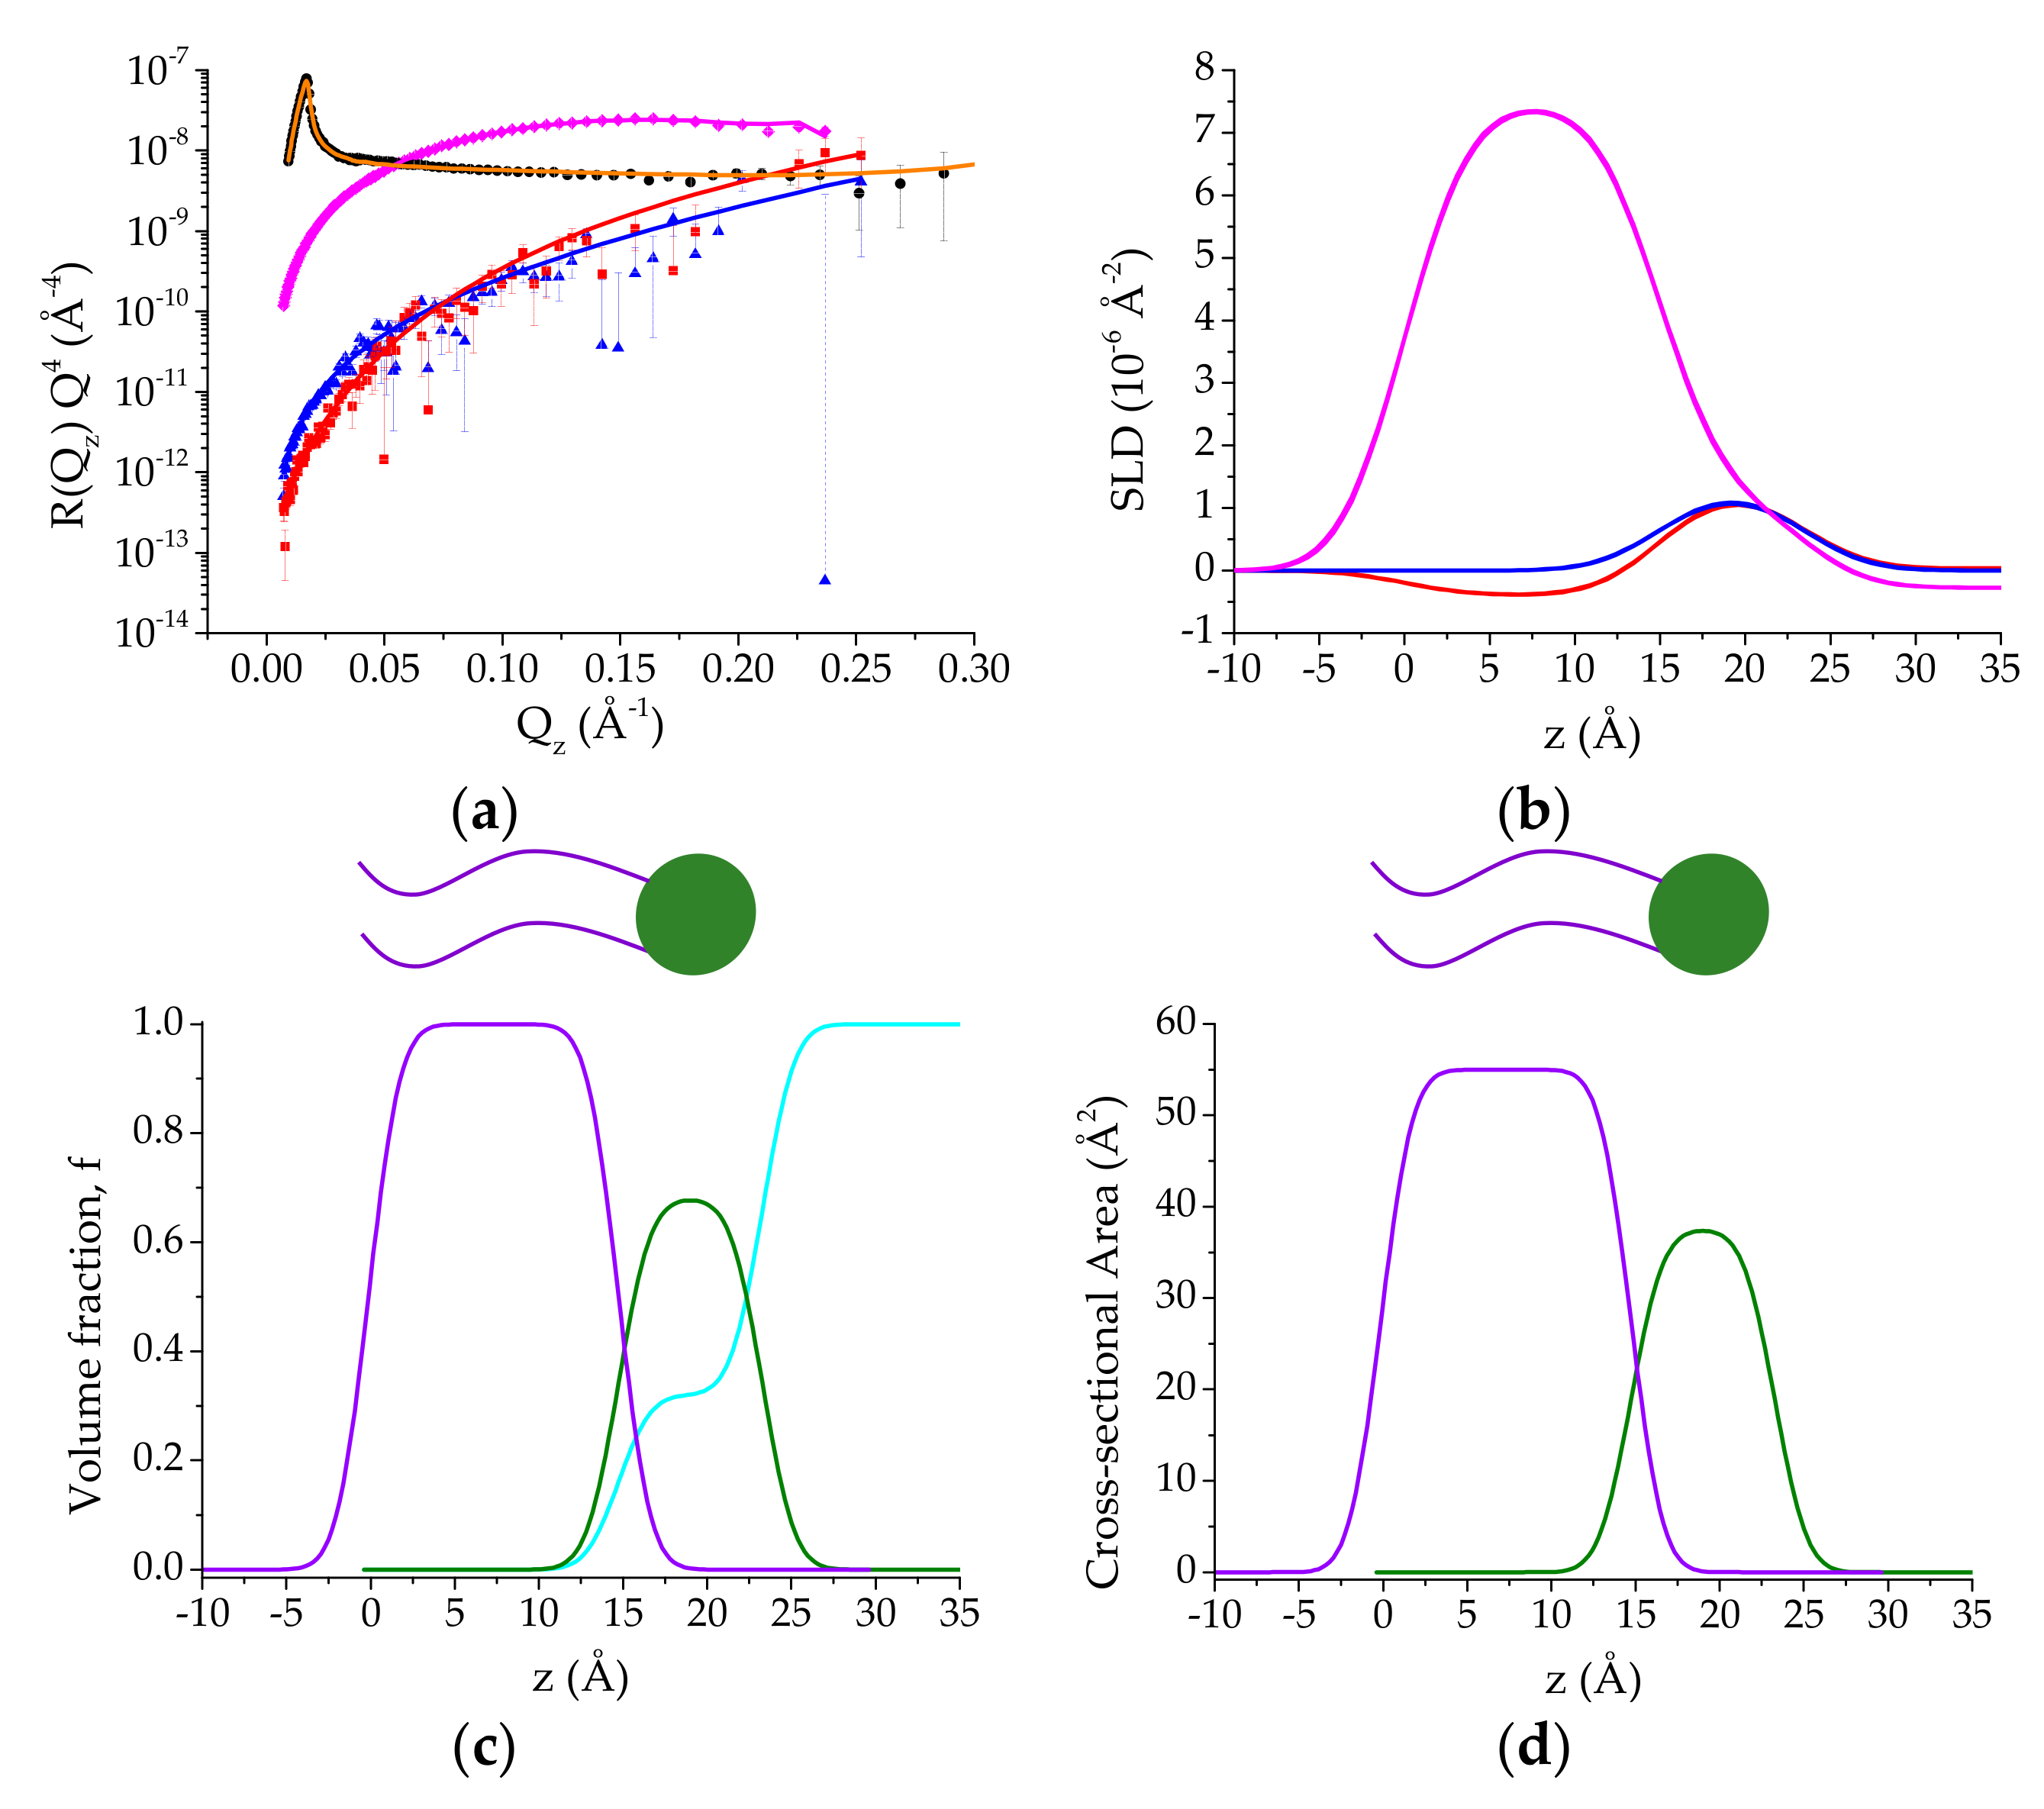
2.4. NR Data Modeling
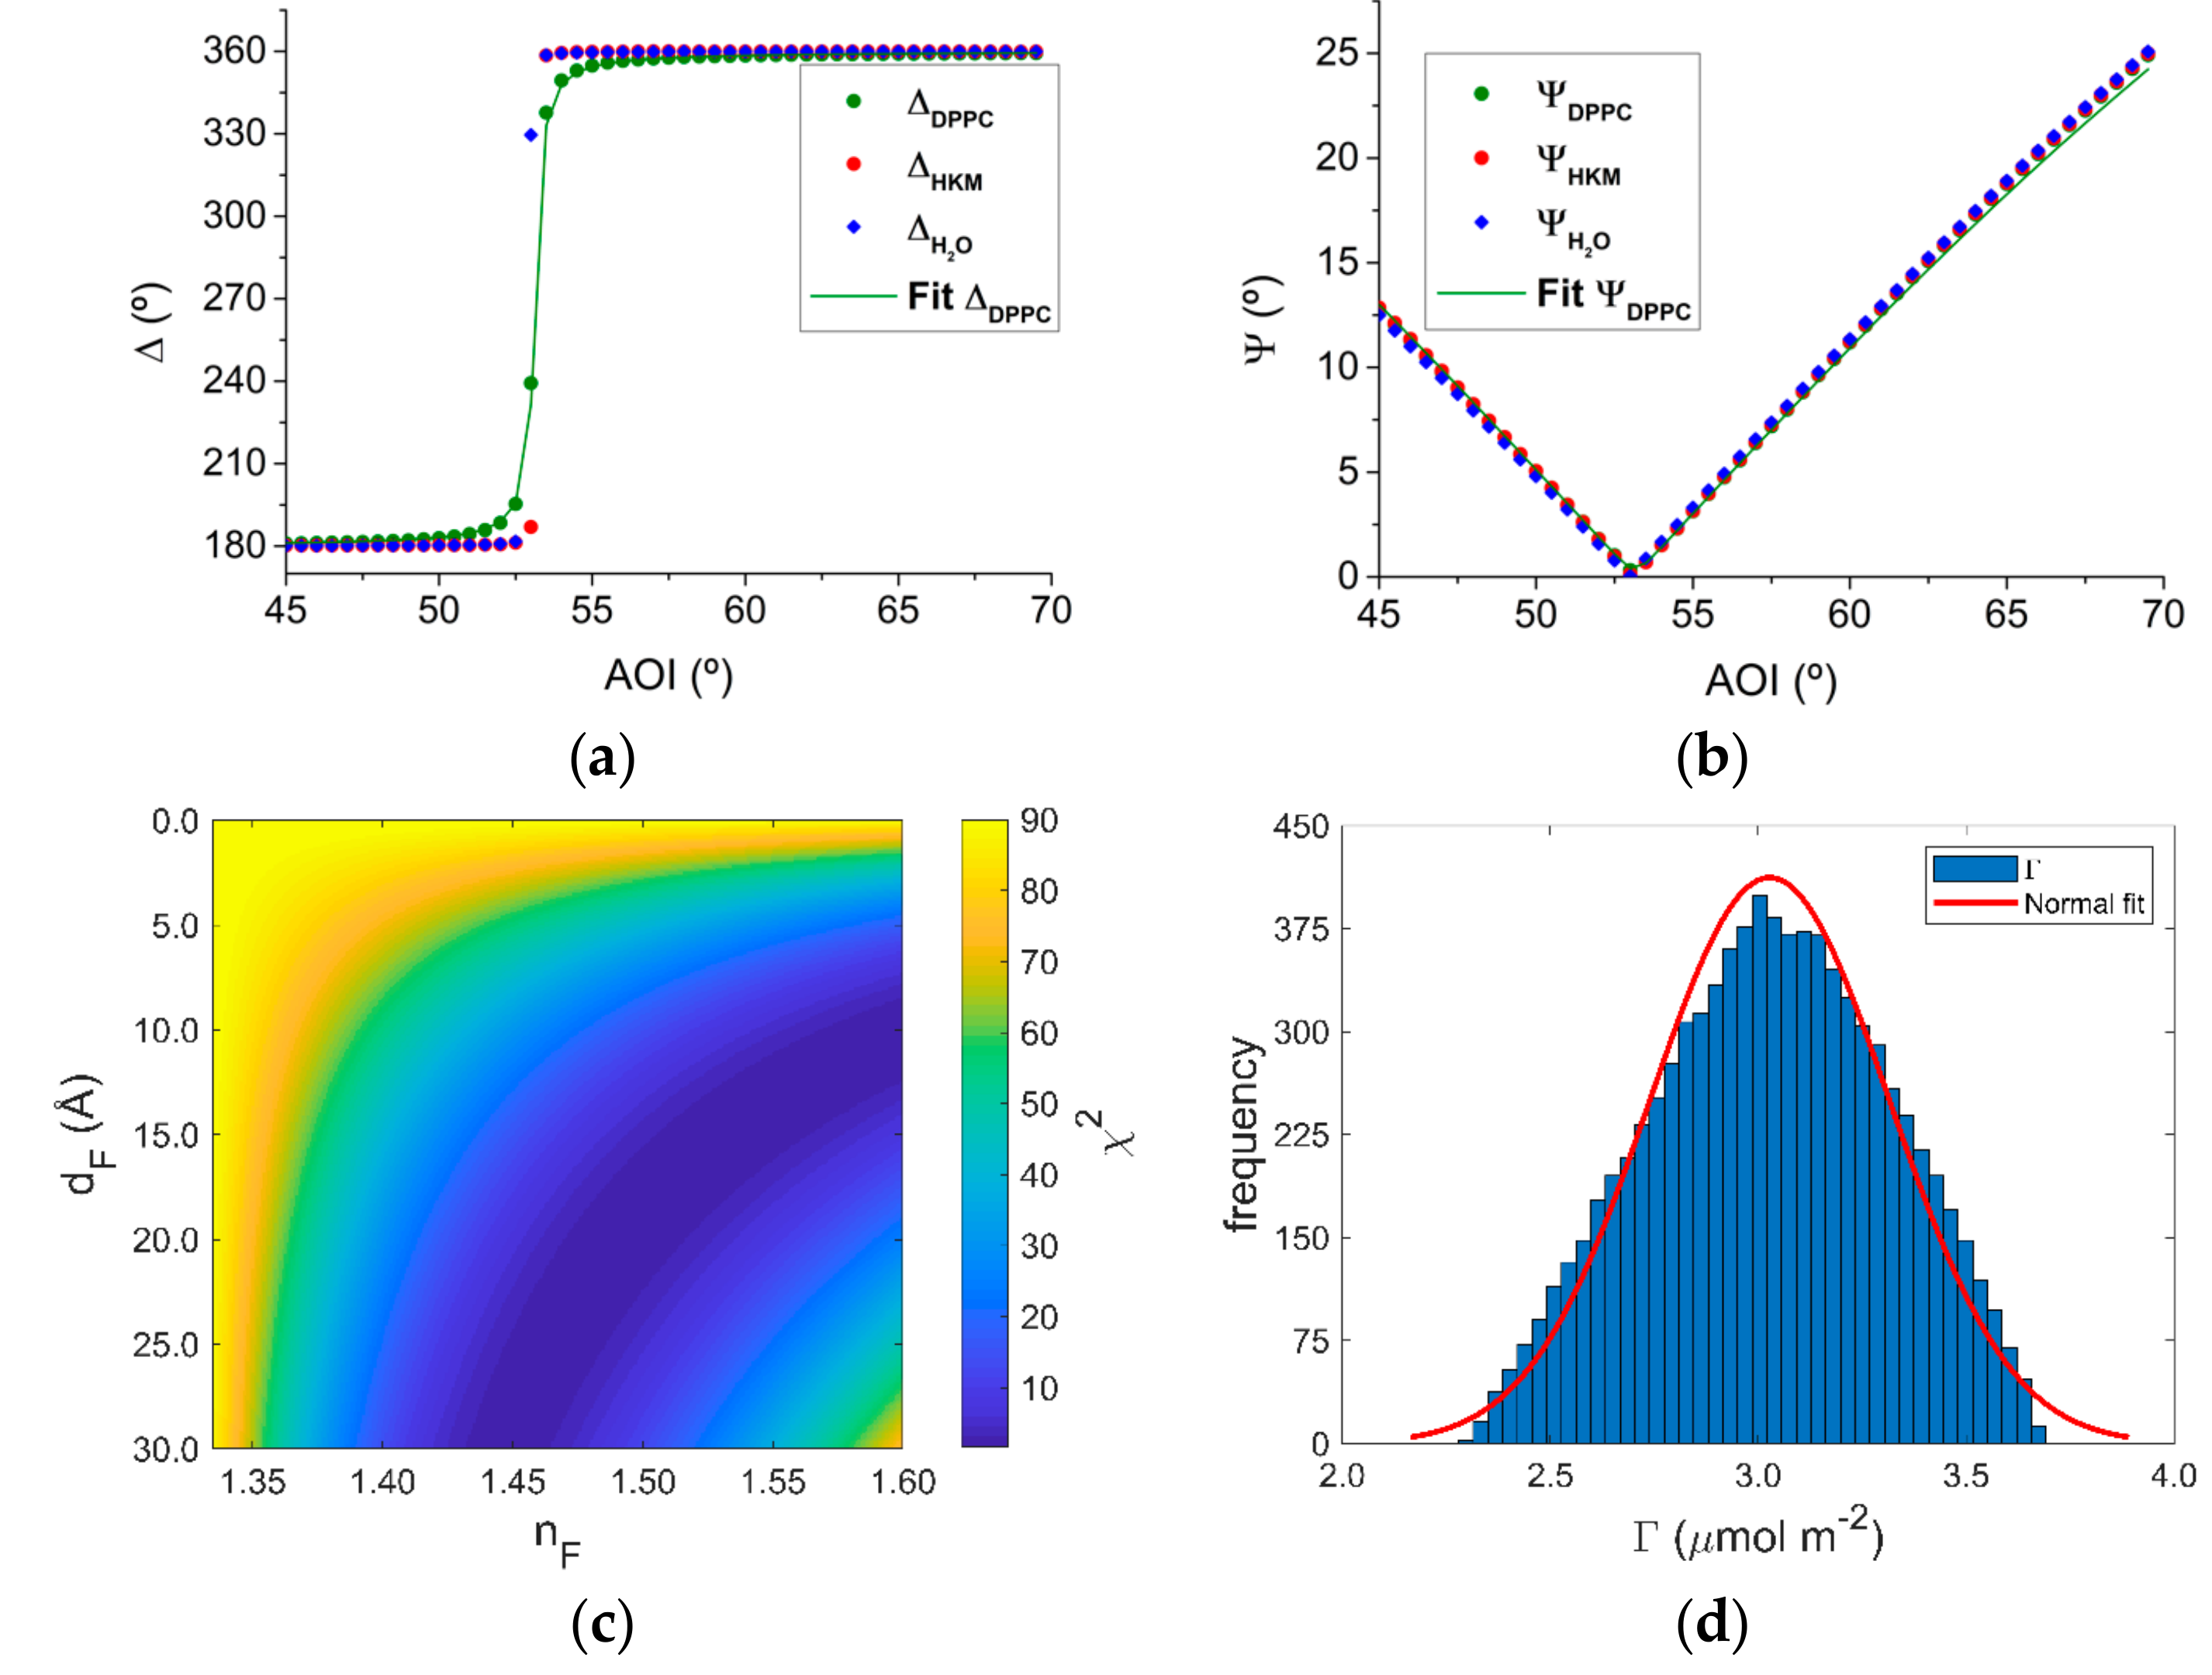
The data analysis was performed using AuroreNR software (v5.0) [42]. A two-layer model was used to fit the data, dividing surface-active molecules between polar heads and aliphatic tails (Figure 1). It has been recently demonstrated that using this model results in a better fit of the experimental curves [27]. The fixed parameters used in the fitting procedure (Table 1) are molecular volumes of DPPC heads (Vm_heads) and tails (Vm_tails) [43,44] and the total scattering length of DPPC heads (Σbheads) and tails (Σbtails). Heads-layer thickness (theads) was calculated from the Vm_heads, and finally, the roughness (r) of the three interfaces (i.e., air/tails-layer, tails-layer/heads-layer, and heads-layer/subphase) was assumed identical following the approach reported by Campbell et al. [27]. Besides, its value was consistent with the presence of capillary waves [45]. A real interface is characterized by a finite roughness, whose minimum value depends on the capillary waves of the subphase [45,46]. Therefore, the change in SLD along the z-axis of a real interface is described here by the SLD profile of the ideal interface modulated by an error function, ERF [47]:
ERF z z 0 σ / 2 = 2 π 0 z z 0 σ / 2 e t 2 d t
where z0 and σ indicate the position and the roughness (respectively) of the interface between the layers.
Experimental data of h-DPPC, cm-DPPC and d62-DPPC were fitted together. Thus, the ambiguity in the interpretation of the sample structure, which may arise from the different sensitivity that the curves exhibit with respect to the different sample components, is significantly reduced. Using this approach, the variables determined through the fitting procedure were solely the surface roughness (r), the thickness of the tails-layer (ttails), and the heads volume fraction (fheads), whose value was constrained to ensure the same surface excess (Γ) of tails Γtails and heads Γhead, calculated as follows:
Γ i = SLD i t i f i Σ b i N A
where Σbi and fi are the total scattering length and the volume fraction of the i-th component (tails or heads), respectively, and NA is the Avogadro’s number. While the tails volume fraction ftails was fixed to unity (i.e., 100%), for the determination of fheads the solvation of the polar headgroups was taken into account. This yields the following equation:
f heads = t tails V m _ heads t heads V m _ tails

2.5. Ellipsometry

Ellipsometry experiments were performed on a Picometer Light ellipsometer (Beaglehole Instruments, Kelburn, New Zealand) using a He-Ne laser with λ = 632 nm. The Langmuir trough used to record the isotherm was coupled with the ellipsometer to measure and control the surface pressure of the lipid monolayer during the measurements of the ellipsometric angles. We studied a DPPC monolayer at the air/buffer interface by measuring the ellipsometric angles as a function of the angle of incidence, AOI, at Π = 30 mN·m−1. The range of AOI was 45°–70° with a step of 0.5°.
Ellipsometry is a non-destructive optical technique widely used for the study of surfaces and thin films [28,48]. It is based on the determination of the polarization changes that light undergoes when it is reflected at an interface. The reflection coefficients parallel and perpendicular to the plane of incidence, rp and rs respectively, are related to the ellipsometric angles Δ, and Ψ. This relationship is known as ellipticity, ρ, and is defined by the following equation:
ρ = r p r s = tan Ψ e i Δ
where ρ is the ellipticity that depends on the AOI, the wavelength of the light and both the thickness and the dielectrical properties of the material on which the reflection of the light beam occurs.
Although the ellipsometric angles are experimentally easily accessible, they do not provide direct access to the refractive index and the thickness of the lipid monolayer. Thus, it is necessary to model the experimental sets of Δ and Ψ vs. AOI to determine dF and nF. For the data analysis, we constructed a slab model considering the profile of refractive indices perpendicular to the surface. In contrast to NR, ellipsometry cannot distinguish between heads and tails of lipid molecules, and the different layers are considered as one homogenous layer with negligible roughness (see Figure 1). Therefore, the model used in this work consisted of one slab formed by the lipid monolayer characterized by nF and dF.
Once constructed the model, we fitted the data of Δ and Ψ vs. AOI using a numeric nonlinear minimization procedure, specifically, a trust-region reflective algorithm [49]. This method is based on the determination of the ellipsometric angles of the model that minimizes the differences with those experimentally obtained (a more detailed explanation can be found in references [49,50,51]). For the calculation of Δ and Ψ of the model, we used a power series expansion to the first order of the relative film thickness (2πdF/λ) that allows us to relate ρ, i.e., Δ and Ψ, with nF and dF as follows:
ρ ρ 0 + i ρ 2 π d F λ
where ρ0 is the ellipsometric ratio of the ambient/substrate interface and ρ’ (Equation (7)) is a linear coefficient defined by the refractive indices of the air and the subphase, n1 and n2, respectively, and the incident and transmission angles, αinc and αtra, respectively.
ρ = 2 n 1 n 2 2 n 1 2 sin 2 α inc cos α inc cos 2 ( α inc α tra ) n F 2 n 1 2 n F 2 n 2 2 n F 2
Drude reported this approximation for the first time based on the fact that the terms of a higher order than the first are negligible when the thickness of the film is very small [34,52]. Therefore, the Equations (5)–(7) provide the values of Δ and Ψ for given values of nF and dF. Finally, the variation of nF and dF allows one to obtain the real parameters of the film as those that minimizes the differences between the calculated ellipsometric angles and those experimentally obtained. The function minimized and used to determine the quality of a given solution is the squared deviation (χ2) between measured and calculated ellipsometric angles and it is defined by:
χ 2 = 1 N M   i = 1 N Δ i exp Δ i model δ i Δ 2 + Ψ i exp Ψ i model δ i Ψ 2
where N is the number of points, M is the number of parameters determined (i.e., two parameters, dF and nF), Δexp and Δmodel correspond to the ellipsometric angle Δ experimentally obtained and the calculated for the model, respectively, and δΔ the uncertainty of the i-th experimental Δ or Ψ value.

3. Results

3.1. Π-A Isotherm

Figure 2a shows the Π-A isotherm for DPPC in the HKM buffer. DPPC shows a liquid expanded (LE) phase at a very low surface pressure, followed by a minor liquid expanded–liquid condensed (LE–LC) coexistence region at Π ≈ 5 mN·m−1. Further compression yields a LC phase, characterized by a long range molecular order, until it reaches the collapse at Π ≈ 54 mN·m−1. The Π-A isotherm does not show a well-defined LE–LC coexistence region as DPPC on water, characterized by a well-defined plateau of coexistence [27,38]. In Figure 2b, we report the corresponding compressional elastic modulus Cs−1, calculated from the surface pressure isotherm following
C s 1 = A Π A
where Π represents the surface pressure and A the surface area. The Π-A isotherm shown in Figure 2a is quite similar to those previously reported in the literature for DPPC in water, consequently, we interpret them in a similar way [27]. At increasing Π, DPPC molecules are pushed closer and the compressional elastic modulus increases until it reaches a maximum. The low Π region is commonly assigned to a 2D liquid expanded state (LE). A minimum in the compression modulus at Π ≈ 5 mN·m−1, is commonly attributed to the existence of a LE–LC phase transition, which can be more clearly observed than the slight pseudo plateau in the isotherm (Figure 2a). The global maximum value of Cs−1 is 130 mN·m−1, which corresponds to the LC phase. The values of Cs−1 in this LC phase are smaller than the ones observed for DPPC at the air/water interface, which present a maximum at Cs−1 ≈ 230 mN·m−1 [27], indicating a less condensed monolayer. Importantly, Figure 2 shows that a DPPC monolayer in the presence of buffer containing divalent salts exhibits more lateral compressibility due to a less acyl chain compaction, and, therefore, is more permeable [53].

3.2. NR Results

Neutron reflectometry measurements were performed to study the structure of DPPC monolayers in the LC phase. In particular, we selected a sample with a surface pressure value of 30 mN·m−1 corresponding to an area per molecule of 53.8 Å2, well above the LE–LC coexistence phase. This guarantees a laterally homogeneous interface on the length scale of the in-plane neutron coherence length, on the order of several microns, and implies that the measured NR can be correlated with the SLD depth profile averaged across the interfacial area delimited by this coherence length. The reflectivity profiles were recorded over the whole Q-range accessible in three isotopic contrasts: h-DPPC, cm-DPPC, and d62-DPPC in ACMW as shown in Figure 3a. As a reference, the measurement of the bare air/D2O interface is shown also in Figure 3a, including a fit to the data that corresponds to a roughness, r0, of 2.8 ± 0.1 Å in agreement with the theoretical value expected for thermally excited capillary waves ( ~ k B T / γ 0 ), with γ0 being the interfacial tension of the bare D2O interface [45,46].
The neutron reflectivity profiles were fitted according to a two-layer model, based on the model recently reported by Campbell et al. [27]. In detail, the model consists of a first layer containing the lipid aliphatic tails in contact with air and, a second one, containing the polar headgroups submerged in the aqueous subphase (see Figure 1a). All parameters used to describe both layers (such as the values of Σb and molecular volumes) are included in Table 1. The best fit of the reflectivity profiles measured is also included in Figure 3a as solid lines. The resulting SLD profiles across the interface are plotted in Figure 3b.
The structural parameters obtained from the fits are summarized in Table 2. The roughness of the three interfaces (air/tails-layer, tails-layer/heads-layer, and heads-layer/subphase) was constrained to be equal. The value obtained from the fitting is 3.0 ± 0.5 Å, which is perfectly consistent with the presence of capillary waves due to thermal fluctuations (usually estimated through the relation: r   r 0 γ 0 / γ 0 Π [54,55]). The value of the thickness of DPPC monolayer is 23.5 Å, with 15.0 Å corresponding to the aliphatic tails in contact with air. Using the parameters from Table 1 and Table 2, the variation of the volume fraction, fDPPC(z), with the distance to the interface, was calculated using the difference of two error functions as follows
f DPPC z = 1 2 f tails ERF z r 2 ERF z t tails r 2 ,   0 z t tails 1 2 f heads ERF z r 2 ERF z t heads r 2 ,   t tails z t tails + t heads
The structural information elucidated by NR on DPPC monolayers can be better interpreted, therefore, by the volume fraction profiles and the corresponding cross-sectional area profiles as a function of the distance from the interface, which are shown in Figure 3c,d, respectively. Such as the volume fraction, the cross-sectional area profile is modulated by the same error function and it is calculated as follows:
A DPPC z = V m _ tails 2   t tails f tails ERF z r 2 ERF z t tails r 2 ,   0 z t tails V m _ heads 2   t heads f heads ERF z r 2 ERF z t heads r 2 ,   t tails z t tails + t heads
The values used to calculate the cross-sectional area from Equation (11) are collected from Table 1 and Table 2.

3.3. Ellipsometry

We performed ellipsometry measurements by exploring the variation of the ellipsometric angles Δ and Ψ as a function of the AOI. In Figure 4a,b, we show the variation of Δ and Ψ for the air/water interface, as a reference measurement, the air/buffer interface, and the h-DPPC monolayer (Π = 30 mN·m−1) spread on the HKM buffer. Firstly, both interfaces air/water and air/buffer yield similar results, which allows us to consider that the refractive index of the buffer does not change to that of water. Nevertheless, the DPPC monolayer at the air/buffer interface shows different values of Δ with respect to the ones obtained for the HKM buffer and water, particularly at values of the angle of incidence close to the Brewster angle. This is the consequence of the change in the state of polarization of the light beam when it interacts with the lipid molecules instead of the bare air/buffer interface. To explain the experimental data, we consider a one-layer optically anisotropic model for the DPPC monolayer (as described in the methods section) with an average refractive index n F = 1 3 n z + 2 3 n x . Considering the DPPC monolayer in LC as an optically uniaxial system (uniaxially birefringent), the anisotropy can be defined as Δn = nznx, being nx and nz the refractive indexes of the layer parallel and perpendicular to the interface, respectively [35]. In our first approach, we simultaneously get the values of nF and dF that better fit the experimental data thus yielding the lowest χ2 value. In detail, we simultaneously fit the variation of Δ and Ψ with AOI shown in Figure 4a,b with different nFdF initial values covering a wide range of nF (from 1.33, corresponding to the bulk phase, to 1.60) and dF (from 0 to 30 Å). Concretely, the combination of 300 values of both parameters resulted in 9 × 10⁵ nFdF pairs of solutions with a given χ2. This approach allowed us to build a matrix shown as a color-map in Figure 4c. This map presents a clear dark blue area in the region defined by nF 1.44 ,   1.60 and dF [ 10 Å ,   30 Å] that correspond to values of χ2 ≈ 1. A priori, it is difficult to select a single pair of values in this area with the minimum χ2. In the following, we show how we can extract the surface excess and the optical anisotropy of the DPPC monolayer from further analysis of the results shown in Figure 4c and compare with the ones obtained by neutron reflectometry.
Approach 1: Calculation of the surface excess of DPPC monolayer using de Feitjer’s equation. We first used the sets of values (nF, dF) that yields χ2 ≈ 1 in Figure 4c to calculate the surface excess of DPPC monolayers (Γ) by using de Feitjer’s equation [56]:
Γ = d F n F n bulk d n / d c
Here dn/dc is the refractive index increment. In detail, we used a value of 0.138 mL·g−1 obtained from reference [22]. nbulk is the refractive index of the bulk phase, here we used a value of 1.335 that corresponds to water taking into account that the presence of buffer does not change the ellipsometry angles as shown in Figure 4a,b. Figure 4d reports the distribution of Γ calculated for the different pairs of (nF, dF) values yielding the lowest χ2. Concretely, we have used all the values that satisfies χ2 ≤ 1.5χ2min, where χ2min accounts for the best value. The tendency shown by Γ can be modelled by a normal distribution (red line in Figure 4d) obtaining Γ = 3.0 ± 0.2 μmol·m−2. This result is in further agreement with the values of Γtails, and Γheads obtained by NR.
Approach 2: A new method to calculate the anisotropy of the refractive index nF. We present here for the first time a novel approach to calculate the anisotropy parameter Δn as well as nx and nz, which are the refractive indices corresponding to the aliphatic tails parallel and normal to the surface, respectively. Let us first consider here that the hydrophilic heads-layer has a refractive index close to that of the bulk due to the high level of head group hydration, 32% according to the NR data (see Table 2) and previously demonstrated in references [23,35]. We, therefore, assumed that only the hydrophobic aliphatic chains can be precisely detected by ellipsometry. In this context, using the values of nF = 1.547 ± 0.005 and dF = 13.7 ± 0.3 Å that yields the best χ2 (=1.71, according to data plotted in Figure 4c) together with a value of dΔ = Δ − Δbulk for a single angle of incidence close to the Brewster conditions, we could calculate the values of nx and nz using
d Δ AOI = 4 π d F λ n air sin AOI tan AOI 1 n air 2 n water 2 tan 2 AOI 1 n air 2 n water 2 n x 2 n air 2 n water 2 + n air 2 n water 2 n z 2
which comes from the separation of the real and imaginary parts in Equation (5) according to the Drude approximation [52], and the definition of the average refractive index
n F = 1 3 2 n x + n z
In particular, we used a value of dΔ = 0.1375 rad that comes from the difference between the value of Δ of the lipid monolayer (188.48°) and the one correspondent to the buffer (180.60°) at an angle of incidence of 52°, for which we had the highest sensitivity as it was close to the Brewster angle (see Figure 4a). Using the values of nF, dF and dΔ in Equations (13) and (14), we obtained nx = 1.537 and nz = 1.566 yielding an anisotropy value, Δn, of 0.029.

4. Discussion

4.1. Effect of HKM Buffer on the DPPC Monolayer Π-A Isotherm

In this work, we studied the optical and structural properties of a DPPC monolayer in the fluid condensed phase (Π = 30 mN·m−1). Looking at the Π-A isotherm and the corresponding Cs−1 as a function of the surface pressure (Figure 2), we obtained information about the different phases of the lipid monolayer and its molecular packaging. The behavior of DPPC at the air/buffer interface is different from the one observed using pure water. Although this is an aspect that merits future work, there are different studies in the literature on the influence of mono and divalent cations on the behavior of DPPC at the air/water interface that agree with our findings: the formation of a liquid-condensed phase with higher lateral compressibility and shifted towards larger molecular areas than the same monolayer at the air/water interface. Complexation effects of mono-, but especially, divalent ions to amphiphilic molecules, such as phospholipids, are known to modify their orientation, morphology and packing. These aspects have been recently evaluated by Adams et al. by studying the influence of highly concentrated salt solutions on the behavior of DPPC monolayers at the air/water interface [15]. The Π-A isotherms reported, together with the Brewster angle microscopy images, showed that the presence of K+, Na+, or Mg2+ causes an expansion of the isotherm towards higher values of area per molecule and a decrease in the compressibility modulus, especially in the latter case. This is in full agreement with what we observed here. These authors also demonstrated that the presence of high salt concentration disrupts lipid packing, resulting in an extension of the liquid-expanded phase. Since we observed a slight LE–LC coexistence phase, we thought that we were not in this situation. It is important to mention that the salt concentrations used in that study are higher than the ones that we used. However, the general trend of the expansion of the isotherm and the decrease of the compressibility modulus are indicators that the behavior of DPPC at the air/water interface is affected by the constituents of the HKM buffer. Besides, in this work, there were up to five different species that could affect the organization of DPPC at the interface. Indeed, Bringenzu et al. studied the interaction of a protein with DPPC monolayers using a very similar buffer and they also observed an expansion of the isotherm [57].

4.2. Influence of HKM Buffer on the Structural Parameters of DPPC Monolayers at the LC Phase

By means of NR, we reported a total thickness of the DPPC monolayer of 23.5 Å, in agreement with literature values of DPPC in the condensed phase [20,58]. The thickness of the aliphatic chains was found to be 15 Å by NR. This was close enough to the thickness obtained from ellipsometry (ca. 14 Å) corresponding to the best fit. Assuming a length of 19 Å of an aliphatic chain of 16-CH2 groups in trans configuration [59], we obtained a tilting angle of 37°, a value that is higher than the value expected for DPPC at the LC phase (27° at Π ≈ 30 mN·m−1). This agrees with a decrease in the packing density of DPPC monolayers in the presence of divalent salts from the HKM buffer (see Figure 1b). The average refractive index nF = 1.547, found here agrees with previous values reported by Ducharme et al. [23] and Thoma et al. [35] on the DPPC monolayer at the air/water interface. Ducharme et al. rationalized this increase of the refractive index of lipid monolayers to the existence of condensed phases. In addition, the value reported here for the anisotropy was slightly smaller to the one reported by Thoma et al. (Δn = 0.05). It is well known that an increase in anisotropy is observed for DPPC monolayers going from LE to LC. It is rationalized by the increase of all-trans configurations for the alkyl chains. In our case, the reduced anisotropy found can also be explained by the effect of the buffer on the packing density of the alkyl chains.
The values obtained from the fitting of both NR (Table 2) and ellipsometry yields a surface excess, Γ, or molecular area ( A = 1 / N A × Γ ) [60], which is consistent with the one extrapolated from the isotherm (see Figure 2a) at Π = 30 mN·m−1. The value found of 55.2 Å2 is slightly larger in comparison with the value for DPPC in water at a similar surface pressure [27]. This has been previously attributed to the effect of the buffer molecules on the monolayer. The calculation of both volume fraction and cross-sectional area profiles with the distance to the interface, (Figure 3c,d, respectively) allows us to rationalize the structure of the DPPC monolayer in real-space, even unraveling the contribution from the aliphatic chains facing the air and the solvated polar headgroups in contact with the buffer. We observed that the solvation of the polar heads by water molecules was about 30% of the volume fraction of the layer (see, cyan curve in Figure 3c) in agreement with previous studies on DPPC/water interfaces [27].

4.3. Combining Neutron Reflectometry and Ellipsometry Experiments

Here, we considered that performing NR and ellipsometry experiments to study lipid monolayers at the air/water interface is convenient due to their complementarity. On one side, the thickness of aliphatic chains as well as the degree of hydration of the polar headgroups can be obtained by NR whilst ellipsometry is more sensitive to the orientation of the aliphatic chains and, therefore, to the physical state of the monolayer. Despite ellipsometry being a very versatile technique, overcoming its limitations in obtaining the refractive index and thickness of monolayers at the air/water interface has required to date complex mathematical calculations (see, for example [34,61]), and/or the parallel use of another technique such as NR. However, we show here an alternative approach to overcome those limitations and the possibility to study optically anisotropic interfacial systems such as phospholipid monolayers in the LC phase (e.g., DPPC). Besides, we report a method to derive the surface excess of the monolayer by the simultaneous modeling of Δ and Ψ as a function of the angle of incidence (Figure 4) that yields a similar value than the one obtained by NR.

5. Conclusions

We firstly reported the Π-A isotherm of DPPC at the air/buffer interface. The Π-A isotherm presented in this work shows an expansion towards higher molecular areas and a less pronounced phase transition than that using pure water as the subphase. We attributed these differences to the presence of cations (especially Mg2+) and HEPES in the subphase, interacting with the lipid molecules at the interface. We have also shown how, combining NR and ellipsometry, we could get a complete characterization of DPPC monolayers. All of the results obtained in this work are consistent with each other, and can be rationalized due to the presence of the HKM buffer when comparing with the literature data on DPPC thickness, molecular area, and refractive index. Therefore, the use of NR in combination with ellipsometry is proposed as an effective and accurate method for studying the optical properties including the anisotropy in the refractive index and the structure of lipid monolayers in the liquid condensed phase at the air/water interface.

Author Contributions

Conceptualization, methodology, data curation and writing the manuscript by all the authors: J.C.-T., A.S., D.P., and A.M. All authors have read and agreed to the published version of the manuscript.

Funding

This research received no external funding.

Acknowledgments

We thank the ILL for the provision of neutron beam time on FIGARO instrument (10.5291/ILL-DATA.TEST-3104), and the Partnership for Soft and Condensed Matter, PSCM, for the use of the ellipsometer and the Langmuir trough. AS and JC acknowledge a PhD contract from the ILL. The authors are grateful to Richard Campbell for a critical review of this manuscript.

Conflicts of Interest

The authors declare no conflict of interest.

References

  1. Lodish, H.; Berk, A.; Zipursky, S.L.; Matsudaira, P.; Baltimore, D.; Darnell, J. Biomembranes: Structural organization and basic functions. In Molecular Cell Biology; Freeman, W.H.: New York, NY, USA, 2000; ISBN 978-0-7167-3136-8. [Google Scholar]
  2. Cooper, G.M. Structure of the Plasma Membrane. In The Cell: A Molecular Approach; Sunderland, Mass. Sinauer Associates: Washington, DC, USA, 2000. [Google Scholar]
  3. Vacklin, H.P.; Tiberg, F.; Fragneto, G.; Thomas, R.K.; Park, I.S.; Lund, S. Phospholipase A2 hydrolysis of supported phospholipid bilayers: A neutron reflectivity and ellipsometry study. Biochemistry 2005, 44, 2811–2821. [Google Scholar] [CrossRef]
  4. Bartkowiak, A.; Rojewska, M.; Prochaska, K. Study of mucin interaction with model phospholipid membrane at the air–water interface. Colloids Surfaces A Physicochem. Eng. Asp. 2019, 578, 123587. [Google Scholar] [CrossRef]
  5. Puglisi, G.; Fresta, M.; Pignatello, R. Synthesis of methotrexate α,γ-bis(amides) and correlation of thermotropic and DPPC biomembrane interaction parameters with their anticancer activity. Drug Dev. Res. 1998, 44, 62–69. [Google Scholar] [CrossRef]
  6. Caseli, L.; Sakai, A.; de Sousa Mesquita, A.P.; Nader, H.B.; Lopes, C.C.; Nakanishi, W.; Ariga, K. Thermodynamic and morphological properties of trastuzumab regulated by the lipid composition of cell membrane models at the air-water interface. Biophys. J. 2020, 118, 77a. [Google Scholar] [CrossRef]
  7. Zhao, L.; Feng, S.S.; Go, M.L. Investigation of Molecular interactions between paclitaxel and DPPC by langmuir film balance and differential scanning calorimetry. J. Pharm. Sci. 2004, 93, 86–98. [Google Scholar] [CrossRef]
  8. Sakai, A.; de Sousa Mesquista, A.P.; Nader, H.B.; Lopes, C.C.; Nakanishi, W.; Ariga, K.; Caseli, L. The lipid composition affects Trastuzumab adsorption at monolayers at the air-water interface. Chem. Phys. Lipids 2020, 227, 104875. [Google Scholar] [CrossRef]
  9. Deleu, M.; Paquot, M.; Nylander, T. Fengycin interaction with lipid monolayers at the air–aqueous interface—Implications for the effect of fengycin on biological membranes. J. Colloid Interface Sci. 2005, 283, 358–365. [Google Scholar] [CrossRef]
  10. Simons, K.; Vaz, W.L.C. Model systems, lipid rafts, and cell membranes. Annu. Rev. Biophys. Biomol. Struct. 2004, 33, 269–295. [Google Scholar] [CrossRef]
  11. Aleskndrany, A.; Sahin, I. The effects of Levothyroxine on the structure and dynamics of DPPC liposome: FTIR and DSC studies. Biochim. Biophys. Acta Biomembr. 2020, 183254. [Google Scholar] [CrossRef]
  12. Ortiz-Collazos, S.; Picciani, P.H.S.; Oliveira, O.N.; Pimentel, A.S.; Edler, K.J. Influence of levofloxacin and clarithromycin on the structure of DPPC monolayers. Biochim. Biophys. Acta Biomembr. 2019, 1861, 182994. [Google Scholar] [CrossRef]
  13. Vaknin, D.; Kjaer, K.; Als-Nielsen, J.; Lösche, M. Structural properties of phosphatidylcholine in a monolayer at the air/water interface: Neutron reflection study and reexamination of x-ray reflection measurements. Biophys. J. 1991, 59, 1325–1332. [Google Scholar] [CrossRef]
  14. Didcot, C.; Ox, O. Hydration of DPPC monolayers at the air/water interface and its modulation by the nonionic surfactant C12E4: A neutron reflection study. Langmuir 1996, 11, 3948–3952. [Google Scholar]
  15. Adams, E.M.; Casper, C.B.; Allen, H.C. Effect of cation enrichment on dipalmitoylphosphatidylcholine (DPPC) monolayers at the air-water interface. J. Colloid Interface Sci. 2016, 478, 353–364. [Google Scholar] [CrossRef] [PubMed] [Green Version]
  16. Guzmán, E.; Liggieri, L.; Santini, E.; Ferrari, M.; Ravera, F. Mixed DPPC-cholesterol Langmuir monolayers in presence of hydrophilic silica nanoparticles. Colloids Surfaces B Biointerfaces 2013, 105, 284–293. [Google Scholar] [CrossRef] [PubMed]
  17. Muñoz-López, R.; Guzmán, E.; Velázquez, M.M.; Fernández-Peña, L.; Merchán, M.D.; Maestro, A.; Ortega, F.; Rubio, R.G. Influence of carbon nanosheets on the behavior of 1,2-Dipalmitoyl-sn-glycerol-3-phosphocholine Langmuir monolayers. Processes 2020, 8, 94. [Google Scholar] [CrossRef] [Green Version]
  18. Kent, M.S.; Murton, J.K.; Sasaki, D.Y.; Satija, S.; Akgun, B.; Nanda, H.; Curtis, J.E.; Majewski, J.; Morgan, C.R.; Engen, J.R. Neutron reflectometry study of the conformation of HIV Nef bound to lipid membranes. Biophys. J. 2010, 99, 1940–1948. [Google Scholar] [CrossRef] [Green Version]
  19. Ege, C.; Lee, K.Y.C. Insertion of Alzheimer’s Aβ40 peptide into lipid monolayers. Biophys. J. 2004, 87, 1732–1740. [Google Scholar] [CrossRef] [Green Version]
  20. Kienle, D.F.; De Souza, J.V.; Watkins, E.B.; Kuhl, T.L. Thickness and refractive index of DPPC and DPPE monolayers by multiple-beam interferometry. Anal. Bioanal. Chem. 2014, 406, 4725–4733. [Google Scholar] [CrossRef]
  21. Pusterla, J.M.; Malfatti-Gasperini, A.A.; Puentes-Martinez, X.E.; Cavalcanti, L.P.; Oliveira, R.G. Refractive index and thickness determination in Langmuir monolayers of myelin lipids. Biochim. Biophys. Acta Biomembr. 2017, 1859, 924–930. [Google Scholar] [CrossRef]
  22. Erbe, A.; Sigel, R. Tilt angle of lipid acyl chains in unilamellar vesicles determined by ellipsometric light scattering. Eur. Phys. J. E 2007, 22, 303–309. [Google Scholar] [CrossRef]
  23. Ducharme, D.; Max, J.J.; Salesse, C.; Leblanc, R.M. Ellipsometric study of the physical states of phosphatidylcholines at the air-water interface. J. Phys. Chem. 1990, 94, 1925–1932. [Google Scholar] [CrossRef]
  24. Ehlers, J. X-ray and Neuron Reflectivity: Principles and Applications; Springer: Berlin/Heidelberg, Germany, 1999; ISBN 3540661956. [Google Scholar]
  25. Zhou, X.L.; Chen, S.H. Theoretical foundation of X-ray and neutron reflectometry. Phys. Rep. 1995, 257, 223–348. [Google Scholar] [CrossRef]
  26. Cousin, F.; Chennevière, A. Neutron reflectivity for soft matter. EPJ Web Conf. 2018, 188, 04001. [Google Scholar] [CrossRef]
  27. Campbell, R.A.; Saaka, Y.; Shao, Y.; Gerelli, Y.; Cubitt, R.; Nazaruk, E.; Matyszewska, D.; Lawrence, M.J. Structure of surfactant and phospholipid monolayers at the air/water interface modeled from neutron reflectivity data. J. Colloid Interface Sci. 2018, 531, 98–108. [Google Scholar] [CrossRef] [PubMed] [Green Version]
  28. Azzam, R.M.A.; Bashara, N.M. Ellipsometry and Polarized Light; North-Holland Publishing Company: New York, NY, USA, 1977; ISBN 0720406943. [Google Scholar]
  29. Motschmann, H.; Teppner, R. Ellipsometry in interface science. Stud. Interface Sci. 2001, 11, 1–42. [Google Scholar]
  30. Reiter, R.; Motschmann, H.; Knoll, W. Ellipsometric Characterization of Streptavidin Binding to Biotin-Functionalized Lipid Monolayers at the Water/Air Interface. Langmuir 1993, 9, 2430–2435. [Google Scholar] [CrossRef]
  31. Campbell, R.A.; Tummino, A.; Varga, I.; Milyaeva, O.Y.; Krycki, M.M.; Lin, S.Y.; Laux, V.; Haertlein, M.; Forsyth, V.T.; Noskov, B.A. Adsorption of denaturated lysozyme at the air-water interface: Structure and morphology. Langmuir 2018, 34, 5020–5029. [Google Scholar] [CrossRef] [Green Version]
  32. Tatur, S.; Badia, A. Influence of hydrophobic alkylated gold nanoparticles on the phase behavior of monolayers of DPPC and clinical lung surfactant. Langmuir 2012, 28, 628–639. [Google Scholar] [CrossRef]
  33. Maestro, A.; Deshmukh, O.S.; Mugele, F.; Langevin, D. Interfacial assembly of surfactant-decorated nanoparticles: On the rheological description of a colloidal 2D glass. Langmuir 2015, 31, 6289–6297. [Google Scholar] [CrossRef]
  34. Nestler, P.; Helm, C.A. Determination of refractive index and layer thickness of nm-thin films via ellipsometry. Opt. Express 2017, 25, 321–327. [Google Scholar] [CrossRef]
  35. Thoma, M.; Schwendler, M.; Baltes, H.; Helm, C.A.; Pfohl, T.; Riegler, H.; Mo, H. Ellipsometry and X-ray reflectivity studies on monolayers of phosphatidylethanolamine and phosphatidylcholine in contact with n-dodecane, n-hexadecane, and bicyclohexyl. Langmuir 1996, 12, 1722–1728. [Google Scholar] [CrossRef]
  36. Richter, R.P.; Brisson, A.R. Following the formation of supported lipid bilayers on Mica: A study combining AFM, QCM-D, and ellipsometry. Biophys. J. 2005, 88, 3422–3433. [Google Scholar] [CrossRef] [Green Version]
  37. Benjamins, J.; Thuresson, K.; Nylander, T. Ellipsometry studies of nonionic surfactant adsorption at the oil-water interface. Langmuir 2005, 21, 149–159. [Google Scholar] [CrossRef]
  38. Duncan, S.L.; Larson, R.G. Comparing experimental and simulated pressure-area isotherms for DPPC. Biophys. J. 2008, 94, 2965–2986. [Google Scholar] [CrossRef] [PubMed] [Green Version]
  39. Campbell, R.A.; Wacklin, H.P.; Sutton, I.; Cubitt, R.; Fragneto, G. FIGARO: The new horizontal neutron reflectometer at the ILL. Eur. Phys. J. Plus 2011, 126, 1–22. [Google Scholar] [CrossRef]
  40. Braun, L.; Uhlig, M.; von Klitzing, R.; Campbell, R.A. Polymers and surfactants at fluid interfaces studied with specular neutron reflectometry. Adv. Colloid Interface Sci. 2017, 247, 130–148. [Google Scholar] [CrossRef]
  41. Gutfreund, P.; Saerbeck, T.; Gonzalez, M.A.; Pellegrini, E.; Laver, M.; Dewhurst, C.; Cubitt, R. Towards generalized data reduction on a chopperbased time-of-flight neutron reflectometer. J. Appl. Crystallogr. 2018. [Google Scholar] [CrossRef] [Green Version]
  42. Gerelli, Y. Aurore: New software for neutron reflectivity data analysis. J. Appl. Crystallogr. 2016, 49, 330–339. [Google Scholar] [CrossRef]
  43. Sun, W.J.; Suter, R.M.; Knewtson, M.A.; Worthington, C.R.; Tristram-Nagle, S.; Zhang, R.; Nagle, J.F. Order and disorder in fully hydrated unoriented bilayers of gel-phase dipalmitoylphosphatidylcholine. Phys. Rev. E 1994, 49, 4665–4676. [Google Scholar] [CrossRef]
  44. Nagle, J.F.; Tristram-Nagle, S. Structure of lipid bilayers. Biochim. Biophys. Acta Rev. Biomembr. 2000, 1469, 159–195. [Google Scholar] [CrossRef] [Green Version]
  45. Braslau, A.; Deutsch, M.; Pershan, P.S.; Weiss, A.H.; Als-Nielsen, J.; Bohr, J. Surface roughness of water measured by x-ray reflectivity. Phys. Rev. Lett. 1985, 54, 114–117. [Google Scholar] [CrossRef] [Green Version]
  46. Sinha, S.K.; Sirota, E.B.; Garoff, S.; Stanley, H.B. X-ray and neutron scattering from rough surfaces. Phys. Rev. B 1988, 38, 2297–2311. [Google Scholar] [CrossRef]
  47. Maranville, B.B.; Green, A.; Kienzle, P.A. Distributed error-function roughness in refl1d reflectometry fitting program. arXiv 2018, arXiv:1801.04975. [Google Scholar]
  48. Szczepanowicz, K.; Bazylińska, U.; Pietkiewicz, J.; Szyk-Warszyńska, L.; Wilk, K.A.; Warszyński, P. Biocompatible long-sustained release oil-core polyelectrolyte nanocarriers: From controlling physical state and stability to biological impact. Adv. Colloid Interface Sci. 2015, 222, 678–691. [Google Scholar] [CrossRef] [PubMed]
  49. Conn, A.R.; Scheinberg, K.; Vicente, L.N. Introduction to Derivative-Free Optimization; Society for Industrial and Applied Mathematics: Philadelphia, PA, USA, 2009; ISBN 0898716683. [Google Scholar]
  50. Dutta, S. Trust-Region Methods. In Optimization in Chemical Engineering; Cambridge University Press: Cambridge, UK, 2016; pp. 74–85. [Google Scholar]
  51. Yuan, Y.X. Recent advances in trust region algorithms. Math. Program. 2015, 151, 249–281. [Google Scholar] [CrossRef]
  52. Drude, P. The Theory of Optics; Longmans, Green, and Co.: New York, NY, USA, 1902; ISBN 0548647755. [Google Scholar]
  53. Nagle, J.F.; Scott, H.L. Lateral compressibility of lipid mono- and bilayers. Theory of membrane permeability. BBA Biomembr. 1978, 513, 236–243. [Google Scholar] [CrossRef]
  54. Daillant, J.; Bosio, L.; Benattar, J.J.; Meunier, J. Capillary waves and bending elasticity of monolayers on water studied by X-ray reflectivity as a function of surface pressure. Europhys. Lett. 1989, 8, 458. [Google Scholar] [CrossRef]
  55. Brumm, T.; Naumann, C.; Sackmann, E.; Rennie, A.R.; Thomas, R.K.; Kanellas, D.; Penfold, J.; Bayerl, T.M. Conformational changes of the lecithin headgroup in monolayers at the air/water interface. Eur. Biophys. J. 1994, 23, 289–295. [Google Scholar] [CrossRef]
  56. De Feijter, J.A.; Benjamins, J.; Veer, F.A. Ellipsometry as a Tool to Study the adsorption behavior of synthetic and biopolymers at the air- water interface. Biopolymers 1978, 17, 1759–1772. [Google Scholar] [CrossRef]
  57. Bringezu, F.; Majerowicz, M.; Wen, S.; Reuther, G.; Tan, K.T.; Kuhlmann, J.; Waldmann, H.; Huster, D. Membrane binding of a lipidated N-Ras protein studied in lipid monolayers. Eur. Biophys. J. 2007, 36, 491–498. [Google Scholar] [CrossRef]
  58. Thoma, M.; Möhwald, H. Monolayers of dipalmitoylphosphatidylcholine at the oil-water interface. Colloids Surfaces A Physicochem. Eng. Asp. 1995, 95, 193–200. [Google Scholar] [CrossRef]
  59. Israelachvili, J.N. Intermolecular and Surface Forces, 3rd ed.; Elsevier/Academic Press: Cambridge, MA, USA, 2011; ISBN 9780123751829. [Google Scholar]
  60. Lu, J.R.; Thomas, R.K.; Penfold, J. Surfactant layers at the air/water interface: Structure and composition. Adv. Colloid Interface Sci. 2000, 84, 143–304. [Google Scholar] [CrossRef]
  61. Barradas, N.P.; Keddie, J.L.; Sackin, R. Bayesian inference analysis of ellipsometry data. Phys. Rev. E Stat. Physics Plasmas Fluids Relat. Interdiscip. Top. 1999, 59, 6138–6151. [Google Scholar] [CrossRef] [PubMed] [Green Version]
Figure 1. (a) Structure formula of DPPC. The polar headgroup is depicted in green and the hydrophobic tails in violet following a two-layer model proposed in the main text. A green sphere and a violet cylinder are drawn to better show Vm_heads and Vm_tails, respectively. (b) The scheme representing the main electrostatic interactions between the phospholipids molecules with the ions composing the buffer: the magnesium cation is depicted as a red sphere, while the acetate anion is depicted as a green sphere. We deduce that these interactions have an influence on DPPC monolayer structure. Bottom panel compares neutron reflectometry (c) and ellipsometry (d) principles of measurement. In the case of NR, a two-layer model can be exploited in order to get both the thickness of the headgroups (theads) and the one of the tails (ttails); indeed, the two-layer model is shown, depicting the heads in green and the tails in violet. Moreover, NR also gives information about the fraction of water per polar headgroup (fw_heads) and the roughness of the interfaces (r), whose value depends on the water capillary waves. The angle of incidence of the neutron beam (θ) and the scattering vector, or momentum transfer, (QZ) are shown. On the other hand, ellipsometry does not disentangle the contribution of the headgroup and the aliphatic chains to the thickness as NR. In addition, the roughness is considered to be equal to zero (as an ideal interface). The incoming and the reflected light beams, whose electric field is divided in parallel (Ep) and perpendicular (Es) components, are shown. Besides, the angle of incidence (AOI) and the ellipsometric angle Ψ are shown.
Coatings 10 00507 g001
Figure 2. (a) Π-A isotherm of a DPPC monolayer at the air/buffer interface and (b) corresponding Cs−1 as a function of Π.
Coatings 10 00507 g002
Figure 3. (a) Neutron reflectivity data of pure D2O interface (black circle), h-DPPC (red squares), cm-DPPC (blue triangles), and d62-DPPC (magenta diamonds) monolayers at Π = 30 mN·m−1 in HKM-ACMW. The fitting curves of the bare D2O interface (orange curve), h-DPPC (red), cm-DPPC (blue), and d62-DPPC (magenta) monolayers are shown. The χ2 value is 2. The figure is displayed on an R(Qz)Qz4 scale to highlight the quality of the fits at high Qz values. (b) SLD profiles normal to the interface of monolayers of h-DPPC (red), cm-DPPC (blue), and d62-DPPC (magenta) monolayers at Π = 30 mN·m−1. (c) Volume fraction profiles normal to the interface of monolayers to highlight the distribution of tails (violet) and heads (green). (d) Cross-sectional area profiles normal to the interface of monolayers to highlight the distribution of tails (violet) and heads (green). Note that the area of the head-groups here does not consider the hydration.
Coatings 10 00507 g003
Figure 4. (a) Δ and (b) Ψ vs. AOI of H2O (blue diamonds), HKM buffer (red circles), and DPPC (green circles). The green line corresponds to the ellipsometric angles values obtained from the fit that minimizes the χ2. (c) Colormap of the squared deviation χ2 between measured and calculated Δ and Ψ of a DPPC monolayer at the air/buffer interface at Π = 30 mN·m−1. Each pixel of the figure represents a value of χ2 obtained from the fit of Δ and Ψ vs. AOI using the correspondent values of dF and nF. (d) Normal distribution of Γ values correspondent to the region of lowest χ2.
Coatings 10 00507 g004
Table 1. Fixed parameters used for data modeling. The molecular volumes of h-DPPC, cm-DPPC, and d62-DPPC are equal; the only difference between the sample parameters is the value of the total scattering length of the tails Σbtail. One can calculate the scattering length density (SLD) values shown considering b and Vm (SLD = Σb/Vm).
Fixed Parametersh-DPPCcm-DPPCd62-DPPC
Vm_heads3)319319319
Σbhead (10−5 Å)60.0660.0660.06
SLDhead (10−6 Å−2)1.881.881.88
Vm_tails3)825825825
Σbtail (10−5 Å)−32.500612.98
SLDtails (10−6 Å−2)−0.3907.43
ftails (%)100100100
Table 2. Parameters resulting from the data modeling. * The hydration degree of the headgroups are considered here.
Fitting Parametersh-DPPC, cm-DPPC, Π = 30 mN·m−1
theads (Å)8.5
ttails (Å)15.0 ± 0.5
fheads (%)68 ± 1
Atails2)55.2 ± 0.3
Aheads*2)55.2 ± 0.3
Γtails (µmol·m−2)3.0 ± 0.1
Γheads (µmol·m−2)3.0 ± 0.1
r (Å)3.0 ± 0.5

