Article

Study on the Chloride Threshold and Risk Assessment of Rebar Corrosion in Simulated Concrete Pore Solutions under Applied Potential

1
Corrosion and Protection Laboratory, Key Laboratory of Superlight Materials and Surface Technology, Harbin Engineering University, Ministry of Education, Harbin 150001, China
2
Southern Marine Science and Engineering Guangdong Laboratory, Sun Yat-sen University, Zhuhai 519082, China
3
Key Laboratory for Anisotropy and Texture of Materials (MoE), School of Materials Science and Engineering, Northeastern University, Shenyang 110819, China
*
Authors to whom correspondence should be addressed.
Coatings 2020, 10(5), 505; https://doi.org/10.3390/coatings10050505
Submission received: 20 April 2020 / Revised: 18 May 2020 / Accepted: 21 May 2020 / Published: 24 May 2020
(This article belongs to the Special Issue Modern Trends in Corrosion Protection of Steels)

Abstract

:
The pitting corrosion behavior of HRB400 steel in various simulated concrete environments was investigated by the combination of polarization curves and statistical method. The results indicated that the chloride concentration threshold ([Cl]th) for pitting of the steel was greatly affected by pH when the applied potential exists, which is always caused by random stray current. The interaction of applied potential and chloride concentration on the pitting behavior was discussed. Finally, pitting-risk-evaluation diagrams were built up, which could be easily used to assess the pitting risk of reinforcing bars under the chloride-containing environment with stray current.

Graphical Abstract

1. Introduction

As one of the most basic building materials in widespread use during the past decades, reinforced concrete has endured many extreme conditions and shown long term durability [1]. It will remain one of the most important architectural forms for human society in the foreseeable future. However, the serviceability life loss of reinforced concrete structures caused by accidental damage or lack of durability is still a serious problem in the world. The most common cause of these deteriorations is the corrosion of the embedded reinforcement [2,3]. Generally, the embedded steel bar is protected from corrosion by a passive film resulting from the chemically inhibitive influence of hydroxyl ions in concrete [4]. However, this passive film is prone to breakdown by the ingress of acidic gas (such as CO2) and aggressive ions (such as Cl) [5]. Moreover, chloride ion is considered to be the primary cause of rebar corrosion in concrete, and it exceeds the carbonation of concrete [6,7,8]. It is believed that rebar corrosion can be ignored, or the service life of the reinforced concrete can be satisfied when the chloride concentration in the concrete is bellow some critical value. This certain critical value is then one of the most decisive input parameters in the current building life evaluation model [9]. Therefore, the issue of the chloride-induced rebar corrosion is a hot spot [10,11,12,13].
According to the competitive adsorption theory [14,15], chloride induced corrosion and pH value are closely related. Numerous researchers [16,17,18,19,20] have confirmed that the corrosion initiation can be triggered when the ratio of [Cl]/[OH] outnumbers a certain critical value in the reinforced concrete structures. In other words, there is a critical concentration of chloride ions for pitting corrosion at a specific pH value. Unfortunately, the critical values reported in the documents [17,20,21,22] cannot reach a consensus. The certain critical values results are discrete, and some results are even contradictory [9]. Moreover, the results are surprisingly different under the same test conditions in laboratories when performed by different researchers [15,23,24]. Such a large divergence may be partially due to the random nature of the pitting itself, and the small number of data employed by some researchers. Thus, the method of statistics and probability analysis are introduced to the study on the critical chloride concentration and the corresponding corrosion phenomenon [25,26]. Meanwhile, there is other uncertainty in determining the critical chloride concentration by the sudden change of the pitting potential. Once corrosion pits initiate, they usually propagate rapidly, indicated by the sharp rise of current density at electrode potentials just beyond the critical pitting potential, which is a characteristic fingerprint of a given metal depending on the chloride concentration [5,11,27,28]. It is worth mentioning that random stray current may exist for reinforced concrete structures that are near a direct current supply (such as a subway line) [29]. This would affect the potential of the reinforcing steel in a manner which may be beyond the pitting potential under certain chloride concentrations. Therefore, it is still necessary to enhance the basic research on the corrosion of reinforcing steel in concrete under applied potential circumstances caused by random stray current through statistical methods.
In this work, statistical methods based on the potentiodynamic polarization technique were employed to assess the corrosion risk of reinforcing steel in concrete simulation solution at the different pH values under various applied potentials. Meanwhile, for certain pH values, the relation between applied potentials and the corresponding critical value of chloride concentration is established to assess the corrosion risk of reinforcing steel when it is affected by stray current.

2. Experimental

2.1. Electrodes and Solutions

The electrode materials employed in this work were hot-rolled rebar steel (HRB400), which is widely used in construction. The specimens were processed into cylindrical shapes (diameter 9 mm, length 10 mm), then all faces were ground with #1000-mesh SiC abrasive paper. A copper wire lead was soldered to one end of the samples. Both ends of the samples were covered with an epoxy resin, leaving a free surface of about 0.60 cm2 exposed. The reinforced specimen’s working face was finished step by step to #2000, with diamond polishing. Then the specimen was etched with 4% nitric acid alcohol solution. The micrograph was observed by metallographic microscopy.
Before the measurements, the specimens were degreased ultrasonically with acetone, and then rinsed with alcohol and dried in cold air. The unexposed edges were coated with a masking paint to prevent crevice corrosion between the epoxy mount and the electrode prior to be tested. All solutions were made from analytical grade reagents and distilled water. The base solution of saturated Ca(OH)2 was used to simulate a high alkaline concrete environment. Sodium chloride was added to the base solution to yield various chlorine concentrations. Saturated NaHCO3 and NaOH solutions were used to adjust the pH of the base solution to 12.5, 12.0, and 11.5. All tests were carried out at 25 ± 1 °C with a water bath.

2.2. Electrochemical Measurements

Electrochemical measurements were performed in a conventional three-electrode electrochemical cell on a IM6ex electrochemical workstation (ZAHNER, Kansas City, MO, USA). The prepared electrode acted as working electrode. A platinum sheet was used as counter electrode and an Ag/AgCl as reference. All electrochemical measurements were conducted after the working electrodes were immersed in the test solutions for 3.5–4.0 h to reach a stable open circuit potential (OCP). Potentiodynamic polarization curves were measured from −10 mV versus OCP to the potential at which the anodic current density increased abruptly with a scan rate 20 mV/min. The breakdown potential value is determined when the anodic current density reaches 10−4 A/cm2 [30]. All potentials reported here were transformed to the ones referred to standard hydrogen electrode (SHE).

2.3. Corrosion Morphology Measurements

The samples were immersed in a corrosion-product-removing solution, which is made up of hexamethylenetetramine, concentrated hydrochloric acid and deionized water [31]. The corrosion morphology was observed by metallographic microscopy after electrochemical experiments.

2.4. Statistical Analysis

Due to the statistical nature of the pitting process, the pitting potential should be determined by statistical methods which are similar to the methods used for stainless steel [32]. In the present work, an anodic potentiodynamic polarization curve is used, and pitting potential is selected as an evaluation indicator. The critical chloride concentration was analyzed by using the statistical method of cumulative probability. The pitting potential cumulative probability P (which unit is 1) is defined as an index to evaluate the corrosion tendency of the reinforcement. Firstly, all pitting potential data were arranged in order from the smallest to the largest value. Then the value P is defined as follows:
P = i/(N + 1)
where i is the rank in the ordered pitting potential value (i =1, 2, 3, …, n) and N the total number of pitting potential data. The pitting potential is determined at P value of 50%.

2.5. Establishment of the Relationship between Applied Potential and Chloride Concentration

The corrosion risk of rebar under the polarization condition was analyzed by statistical method. In this way, statistical pitting potentials under various chloride concentrations were determined for the rebar in the simulated concrete environment at a certain pH. Their relationship was indicated by the curves between statistical pitting potentials and chloride concentrations.

3. Results and Discussion

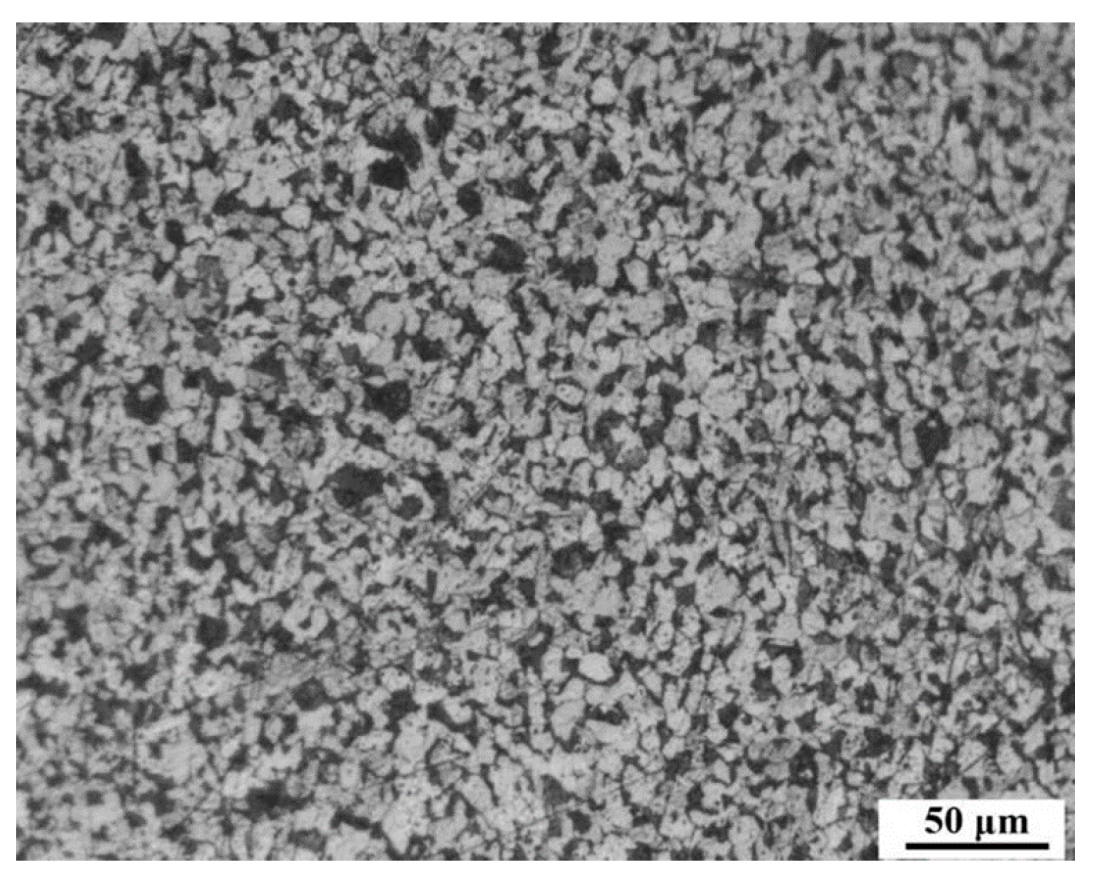
3.1. Microstructure of the Sample

The chemical composition of HRB400 steel is C 0.25 wt %, Si 0.80 wt %, Mn 1.6 wt %, P 0.04 wt %, S 0.04 wt % and Fe balanced. The metallographic observation image of this steel was shown in Figure 1.
The Figure 1 indicated that the grains were equiaxed and homogeneous in the size of about 10 μm. The structure contains two microconstituents: proeutectoid ferrite (white) and pearlite. No obvious metallurgical defects were observed.

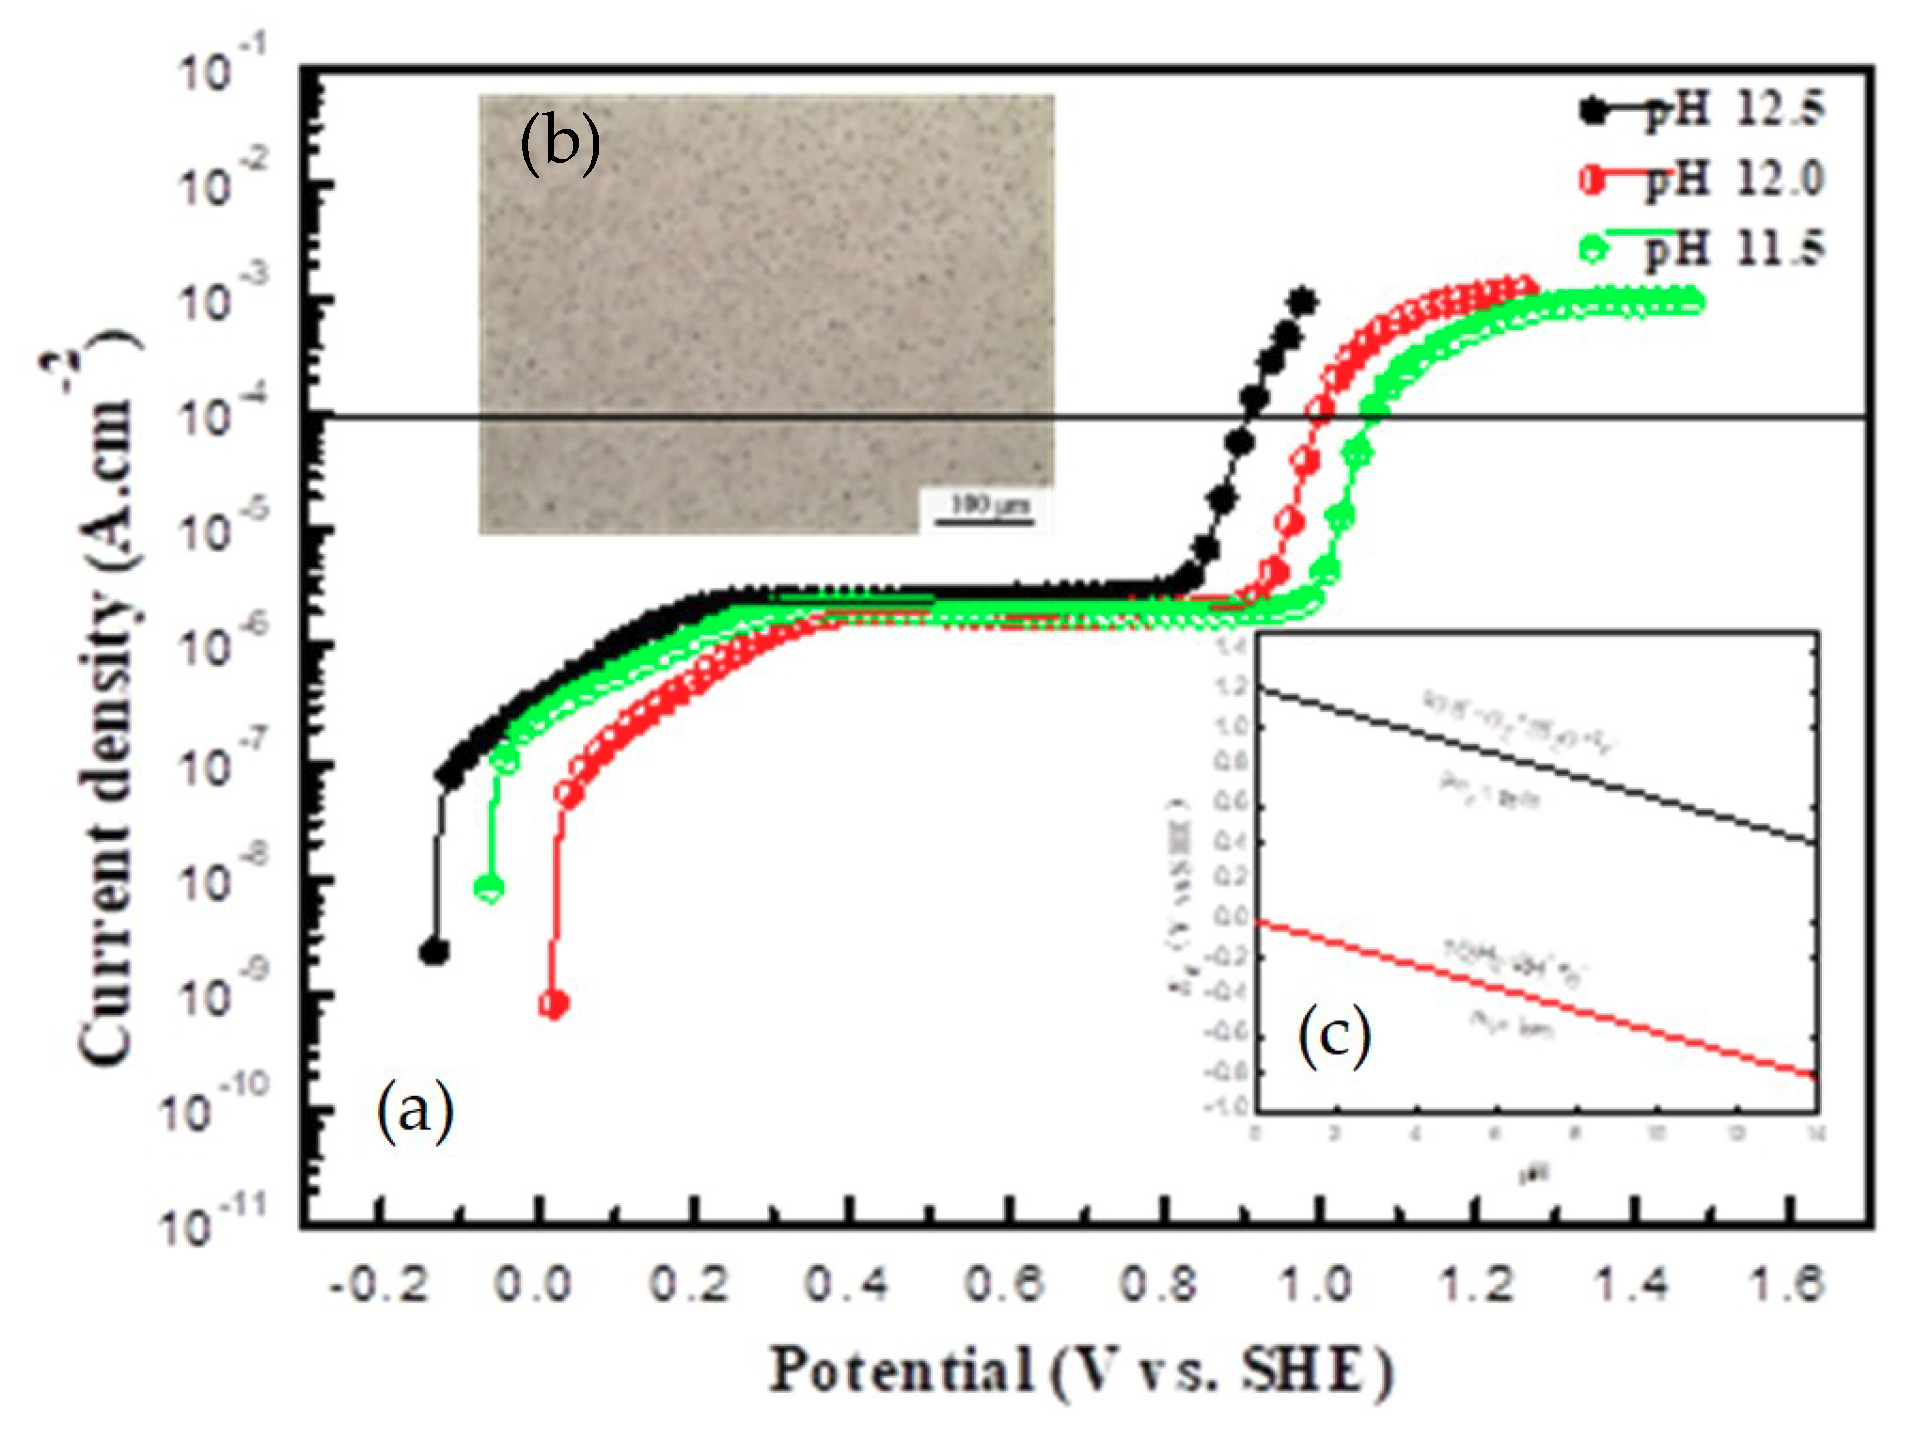
3.2. Effect of pH on the Passivation Behavior of Reinforcing Steel

For the reliability of the data, repeated experiments were performed. Since the experiment was reproducible in a chlorine-free environment, each set of data was repeated five times. Figure 2 depicts the effect of pH on the anodic polarization curves for the samples in saturated Ca(OH)2 solution without chloride ions. It showed that in the anodic polarization region, passivation zones appeared, whose current densities remained stable in the order of 10−6 A/cm2, and the breakdown potentials decreased with the increase of pH. But it seemed to contradict the conventional understanding. Traditionally, the higher the pH value, the more positive the breakdown potential is, which is indicated that the corrosion resistance of steel is enhanced. Numerous investigations [33,34,35,36] have demonstrated the fact that the carbonation of concrete (where pH decreases) always renders corrosion of reinforcing steel. Due to the presence of an oxygen evolution reaction, there is an upper limit value of the steel pitting potential, which is the oxygen evolution potential of the system.
At the sufficiently high electrode potentials, water molecules dissociated to liberate oxygen by the following anodic reaction:
2H2O → O2 + 4H+ + 4e
H+ + OH → H2O
H2 + 2OH → 2H2O + 2e
According to the Pourbaix diagram for water (Figure 2c) at 25 °C [37], with the increase of the pH of the solution, the equilibrium potential of the oxygen evolution linearly decreased. That is, the higher the pH value, the easier the oxygen evolution is, which is indicated by the following specific relationship (5):
Ee = 1.229 + 0.0148 × lgPO2 – 0.0591 × pH
where Ee is the equilibrium potential of the oxygen electrode, PO2 is the partial pressure of oxygen. Therefore, the diminished breakdown potential of HRB400 steel is not an indicator of corrosion enhancement under higher pH environment without chloride ions. The current mutation at the breakdown potential is just due to the vast evolution of oxygen. This can be demonstrated by the corrosion morphology (Figure 2b) after the polarization tests. However, with the continuous evolution of oxygen, the long-term consumption of OH significantly declined the local pH of rebar surface, thereby rupturing the instability of the passive film on the steel surface [38].

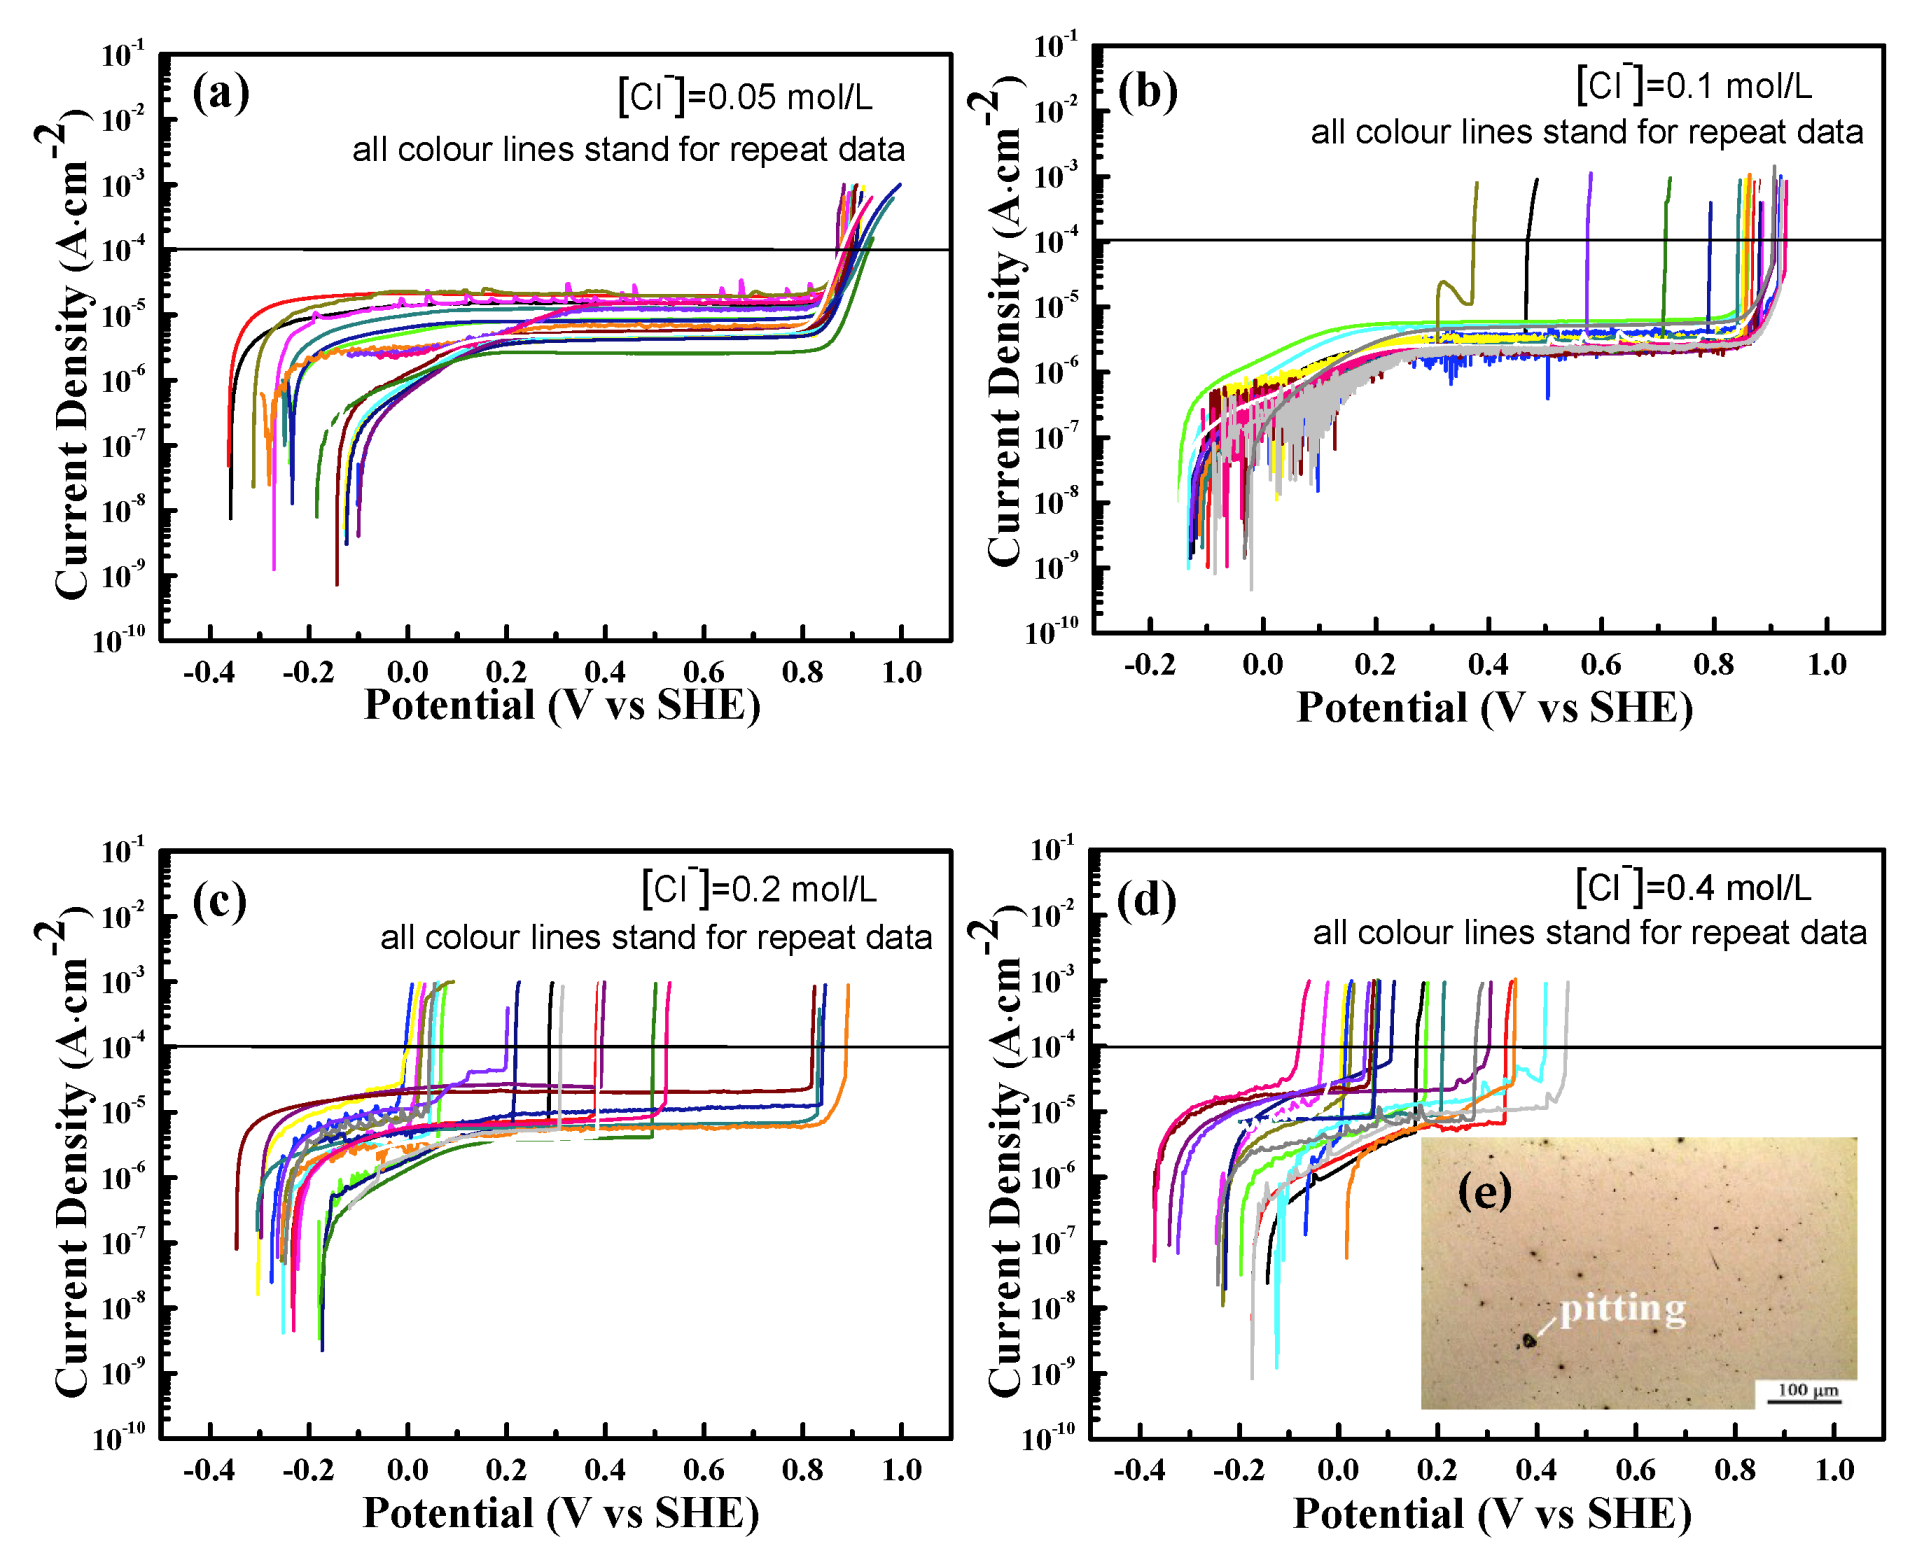
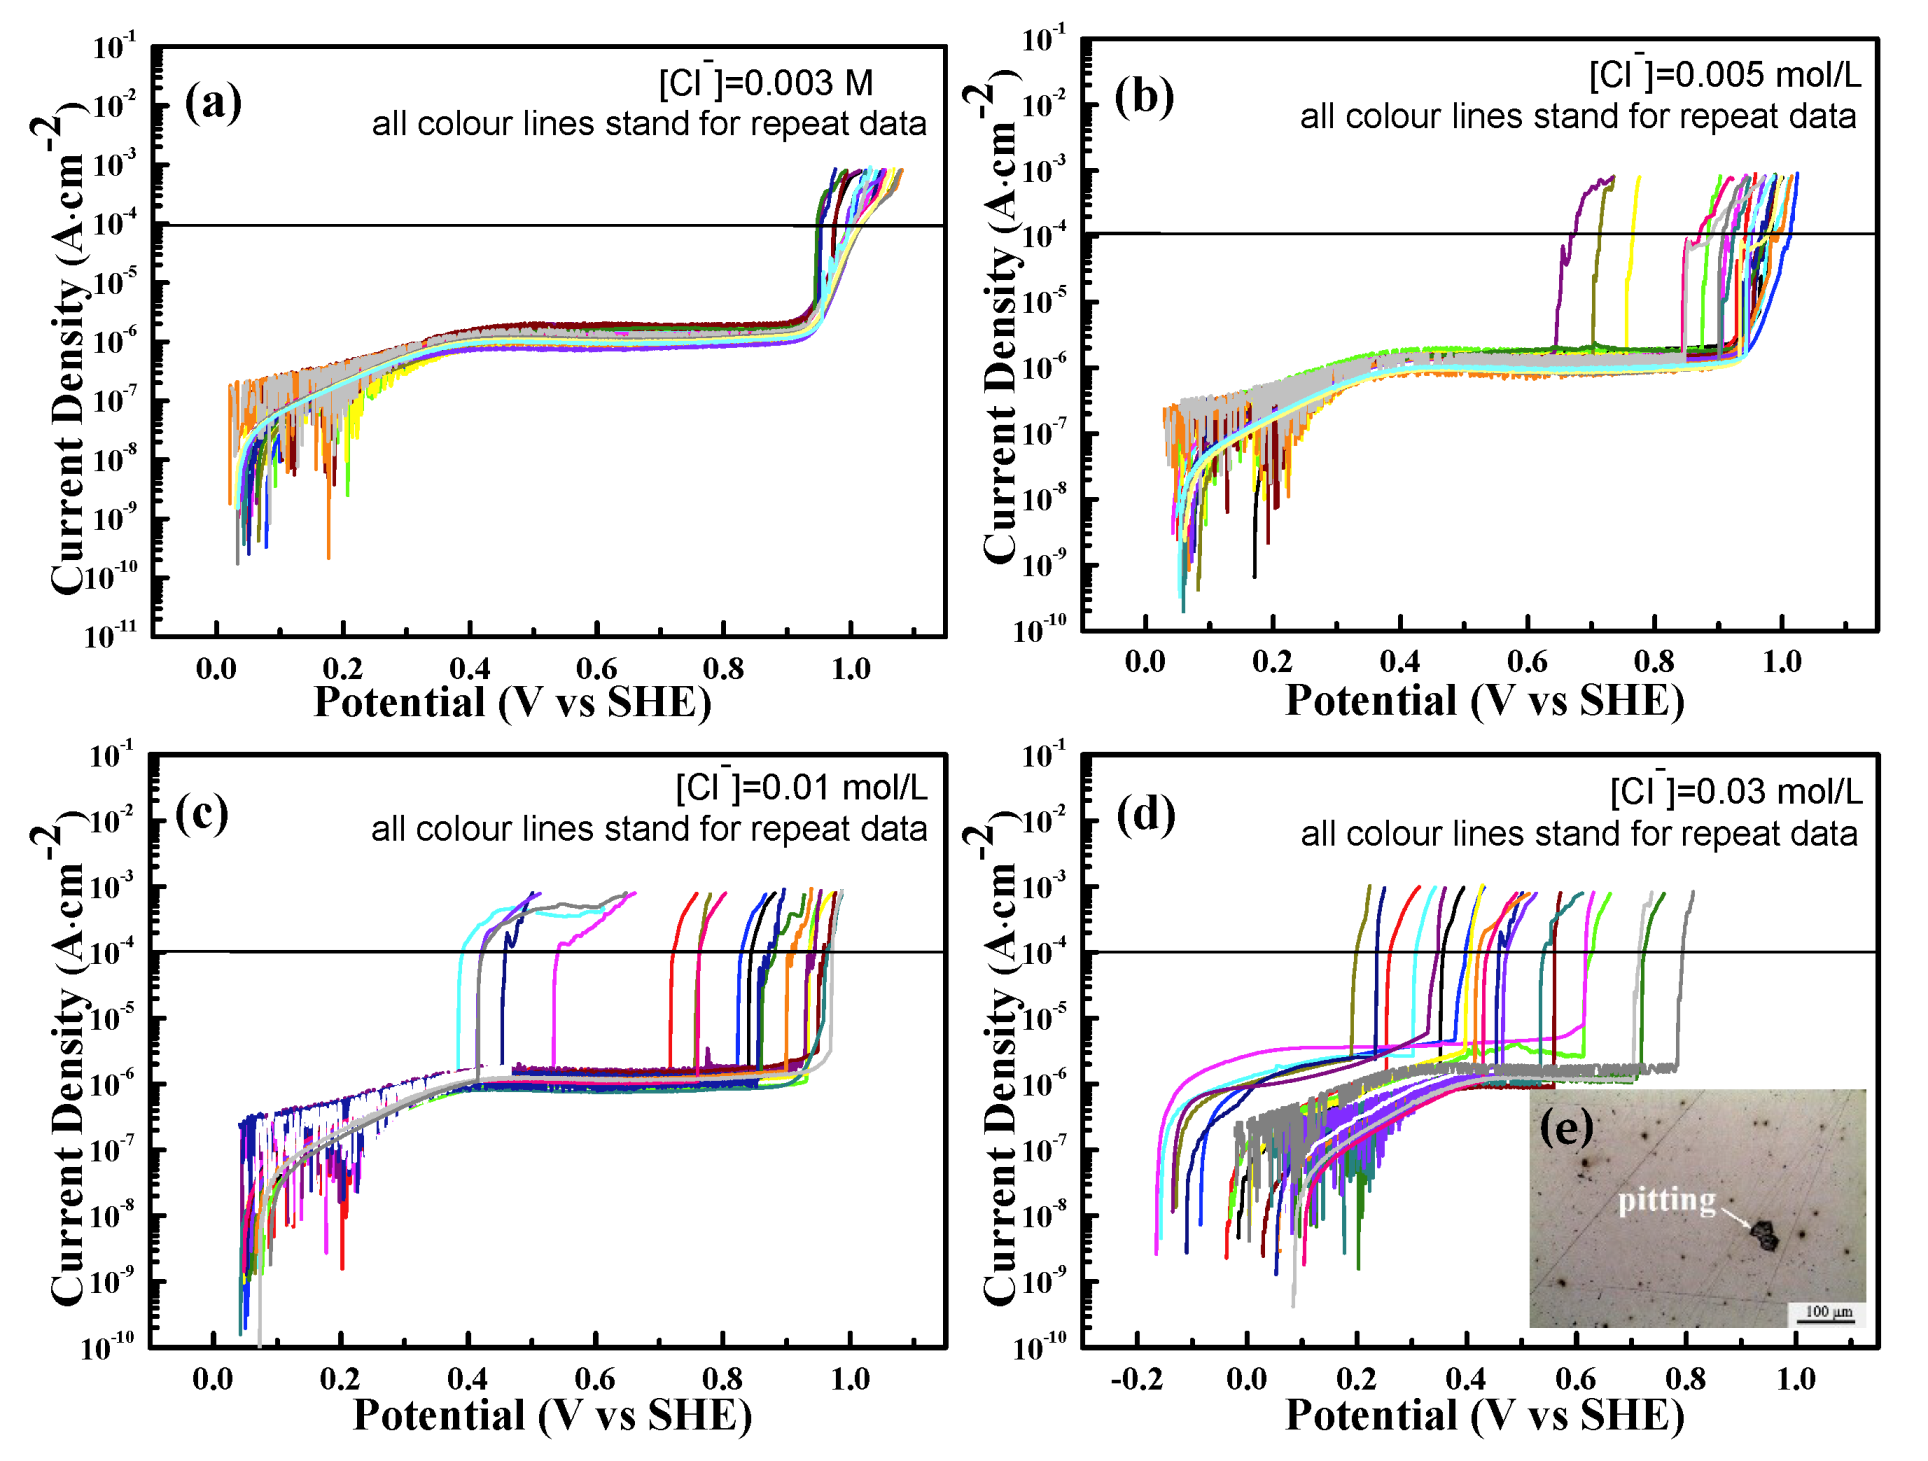
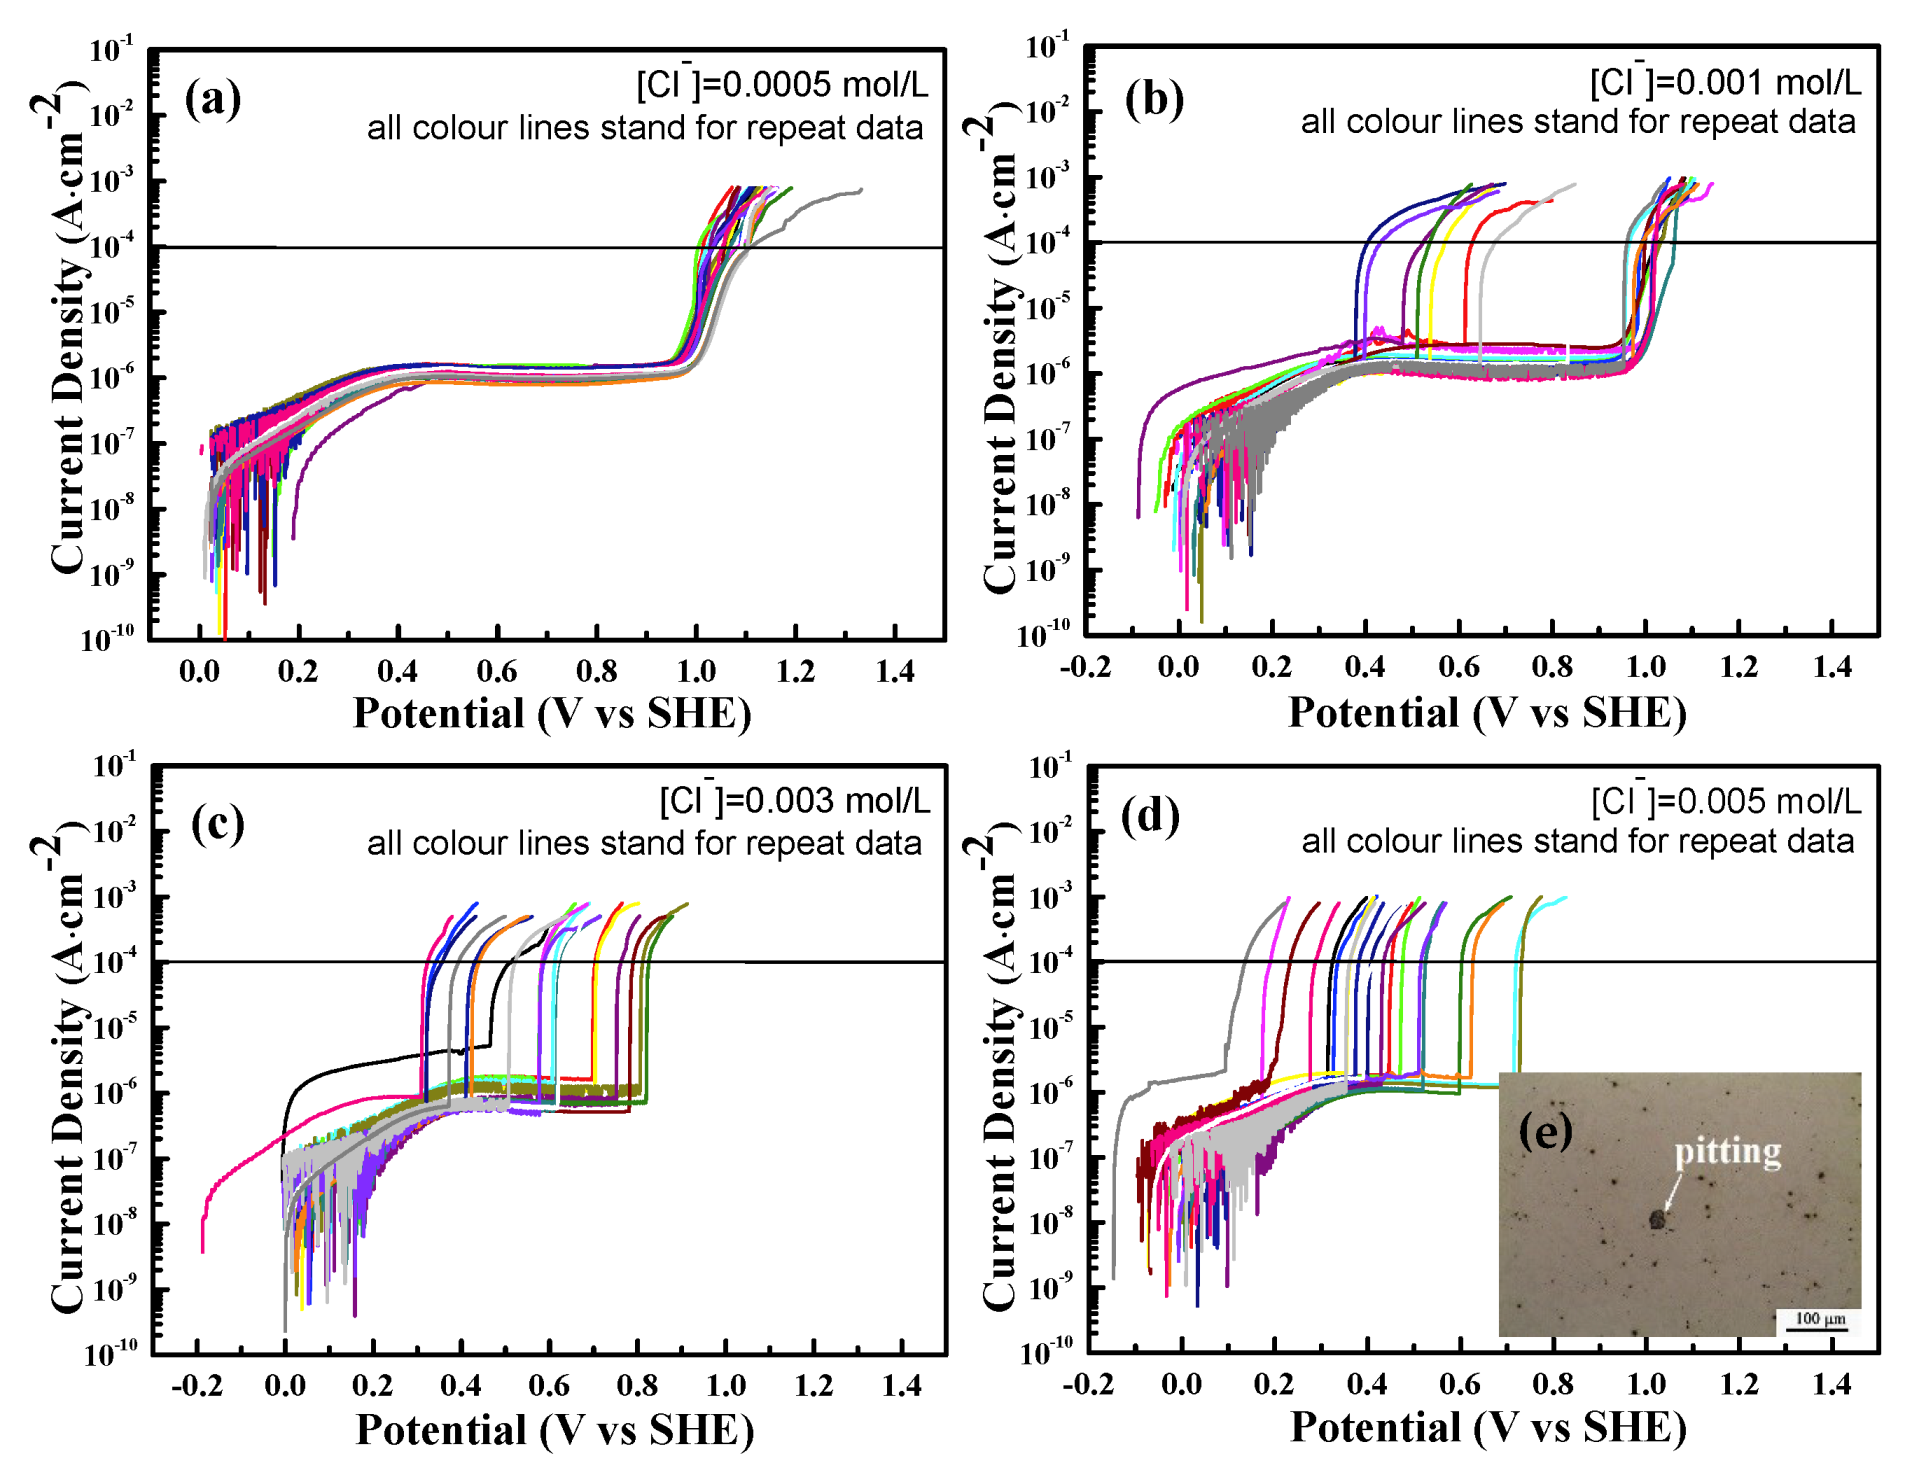
3.3. Effect of the Chloride Threshold on the Passivation Behavior of Reinforcing Steel under Certain pH Circumstance

To investigate the chloride threshold level ([Cl]th) of steel in concrete, the saturated Ca(OH)2 solutions with pH 12.5, 12.0 and 11.5 were used to simulated the concrete environment. Figure 3a–d depicts the anodic polarization curves of HRB400 specimens in simulated concrete pore solutions at various concentration of chloride ion (0.05, 0.1, 0.2 and 0.4 mol/L) at the pH 12.5.
The Figure 3a–d showed that the steel can be passivated in all these test solutions. Compared with the previous conditions (without chloride ions), pitting corrosion occurred after the current mutation at the “breakdown potential” (Figure 3e). When the concentration of chloride ion was low (0.05 mol/L), the pitting potentials centered around 0.9 V for the twenty replicate test data. With the increase of the chloride ions concentration, the breakdown potentials gradually shifted toward the negative direction (from 0.9 to 0.4 V), and the discreteness of replicate data was strikingly enhanced. This indicates that the pitting corrosion of the steel under these circumstances is a random process with great uncertainty. Therefore, an investigation result from a small amount of electrochemical test data may render a misunderstanding of the rebar corrosion. It may also be one of the reasons that the [Cl]th reported in the documents [17,20,21,22,23] cannot reach a consensus.
In order to accurately determine the [Cl]th on the passivation behavior of reinforcing steel, the statistical method was employed based on a set of 20 replicate polarization tests. Figure 4 illustrated the cumulative distribution of pitting potentials for the samples at the pH 12.5 circumstance with various chloride concentrations. The pitting potential distributions exhibited linear behavior, indicating that the distribution of the pitting potentials followed a normal probability distribution [39].
It can be seen in the Figure 4 that with the increase of chloride concentration, the pitting potentials decrease toward the negative direction, and the distribution of pitting potentials under each chloride-containing solution becomes more and more scattered. For the 0.05 mol/L chloride concentration, the pitting potential is almost around 0.9 V, which is similar to the condition without chloride ions (0.89 V). When the chloride concentration reaches 0.1 mol/L, the cumulative probability distribution of the pitting potential shows two-segment characteristic, indicating that the pitting potential is affected by two factors, that is, the random characteristics of pitting itself and the upper limit of the oxygen evolution potential. When chloride concentration reaches 0.4 mol/L, the effect of the oxygen evolution is minor, and the cumulative probability showed the random distribution characteristics similar to the “F” shape, indicating that the scattered pitting potential distribution is mainly caused by chloride ions [40]. Therefore, [Cl]th is about 0.1–0.2 mol/L at the pH 12.5. Similarly, Figure 5 shows the polarization curves of HRB400 specimens in simulated concrete pore solutions containing various chloride concentration at the pH 12.0.
When the chloride concentration is as low as 0.003 mol/L, the pitting potential is almost around 0.96 V, which is similar to the condition (0.99 V) without chloride ions in Figure 5. This value of the current density decreases one order when compared with that under the condition of pH 12.5. With the increase of chloride concentration, sever pitting can be observed (Figure 5e) and the pitting potentials greatly decrease. Simultaneously, the pitting potentials distribute more and more randomly. The change of cumulative probability can be seen in the Figure 6.
It is a regular pattern, similar to the result at the pH 12.5. For the 0.003 mol/L chloride concentration, the oxygen evolution dominates before the passive film breakdown, leading to little pitting occurring. With the increase of chloride concentration, the pitting potential begins to be below the oxygen evolution potential. According to the experimental results, there are about 40% of the samples in which the pitting potential of the steel bar under the condition of the 0.005 mol/L chloride concentration was lower than the oxygen evolution potential. It increases to 70% when the chloride concentration is increased to 0.01 mol/L. This illustrated that the chloride threshold level at the pH value of 12.0 was about 0.005–0.01 mol/L. The result indicates that the pitting corrosion of the steel bar is greatly sensitive to the change of pH.
Figure 7 presents the polarization curves of HRB400 specimens in simulated concrete pore solutions containing various chloride concentrations at the pH 11.5. The pitting potential of the sample was in agreement with the value of the oxygen evolution potential (1.06 V) under the condition of 0.0005 mol/L chloride concentration. When the chloride concentration was beyond 0.003 mol/L, the pitting potential of the sample markedly diverged from the oxygen evolution potential. Figure 8 depicted the corresponding cumulative probability of pitting potential under various conditions, which showed the similar behavior as above. In the same way, it can be seen that [Cl]th of the specimen at the condition of pH 11.5 is 0.001 mol/L.
The average values of the pitting potential (Epit) for each of the twenty repeated data with various chloride concentrations at three pH conditions were shown in Figure 9. The relationship between them is well corresponded to the Equation (6), which has been demonstrated by many investigations [32,41],
E p i t = E 0 b log [ C l ]
where E0 and b are constant parameters. It can be seen that the slope of the plot apparently decreased with the decrease of pH value, indicating that the decrease of pH value would greatly enhance the pitting sensibility of steel bar to chloride concentration. This is due to the autocatalytic nature of pitting [42].
When a pit initiated, the inner environment became enriched in ferrous cations and anionic species, such as chloride, which electromigrated into the pit to maintain charge neutrality by balancing the charge. The enriched ferrous cations would hydrolyze to decrease the inner pH. The high chloride concentration and low pH accelerated the pitting growth. While [OH] in the solution increased, the competitive electromigration between Cl and OH would markedly diminish the enrichment of Cl and the hydrolysis by the formation of insoluble hydroxide in the inner of a pit, leading to the death of pitting.

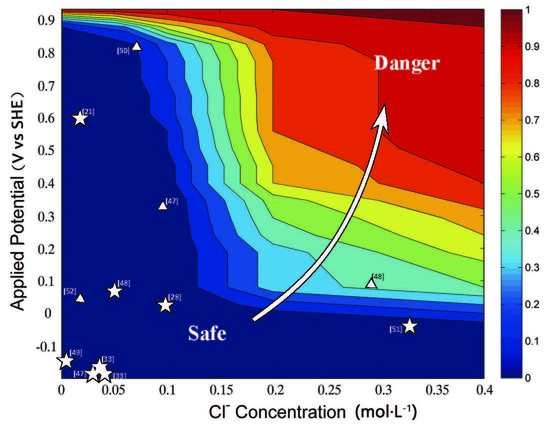
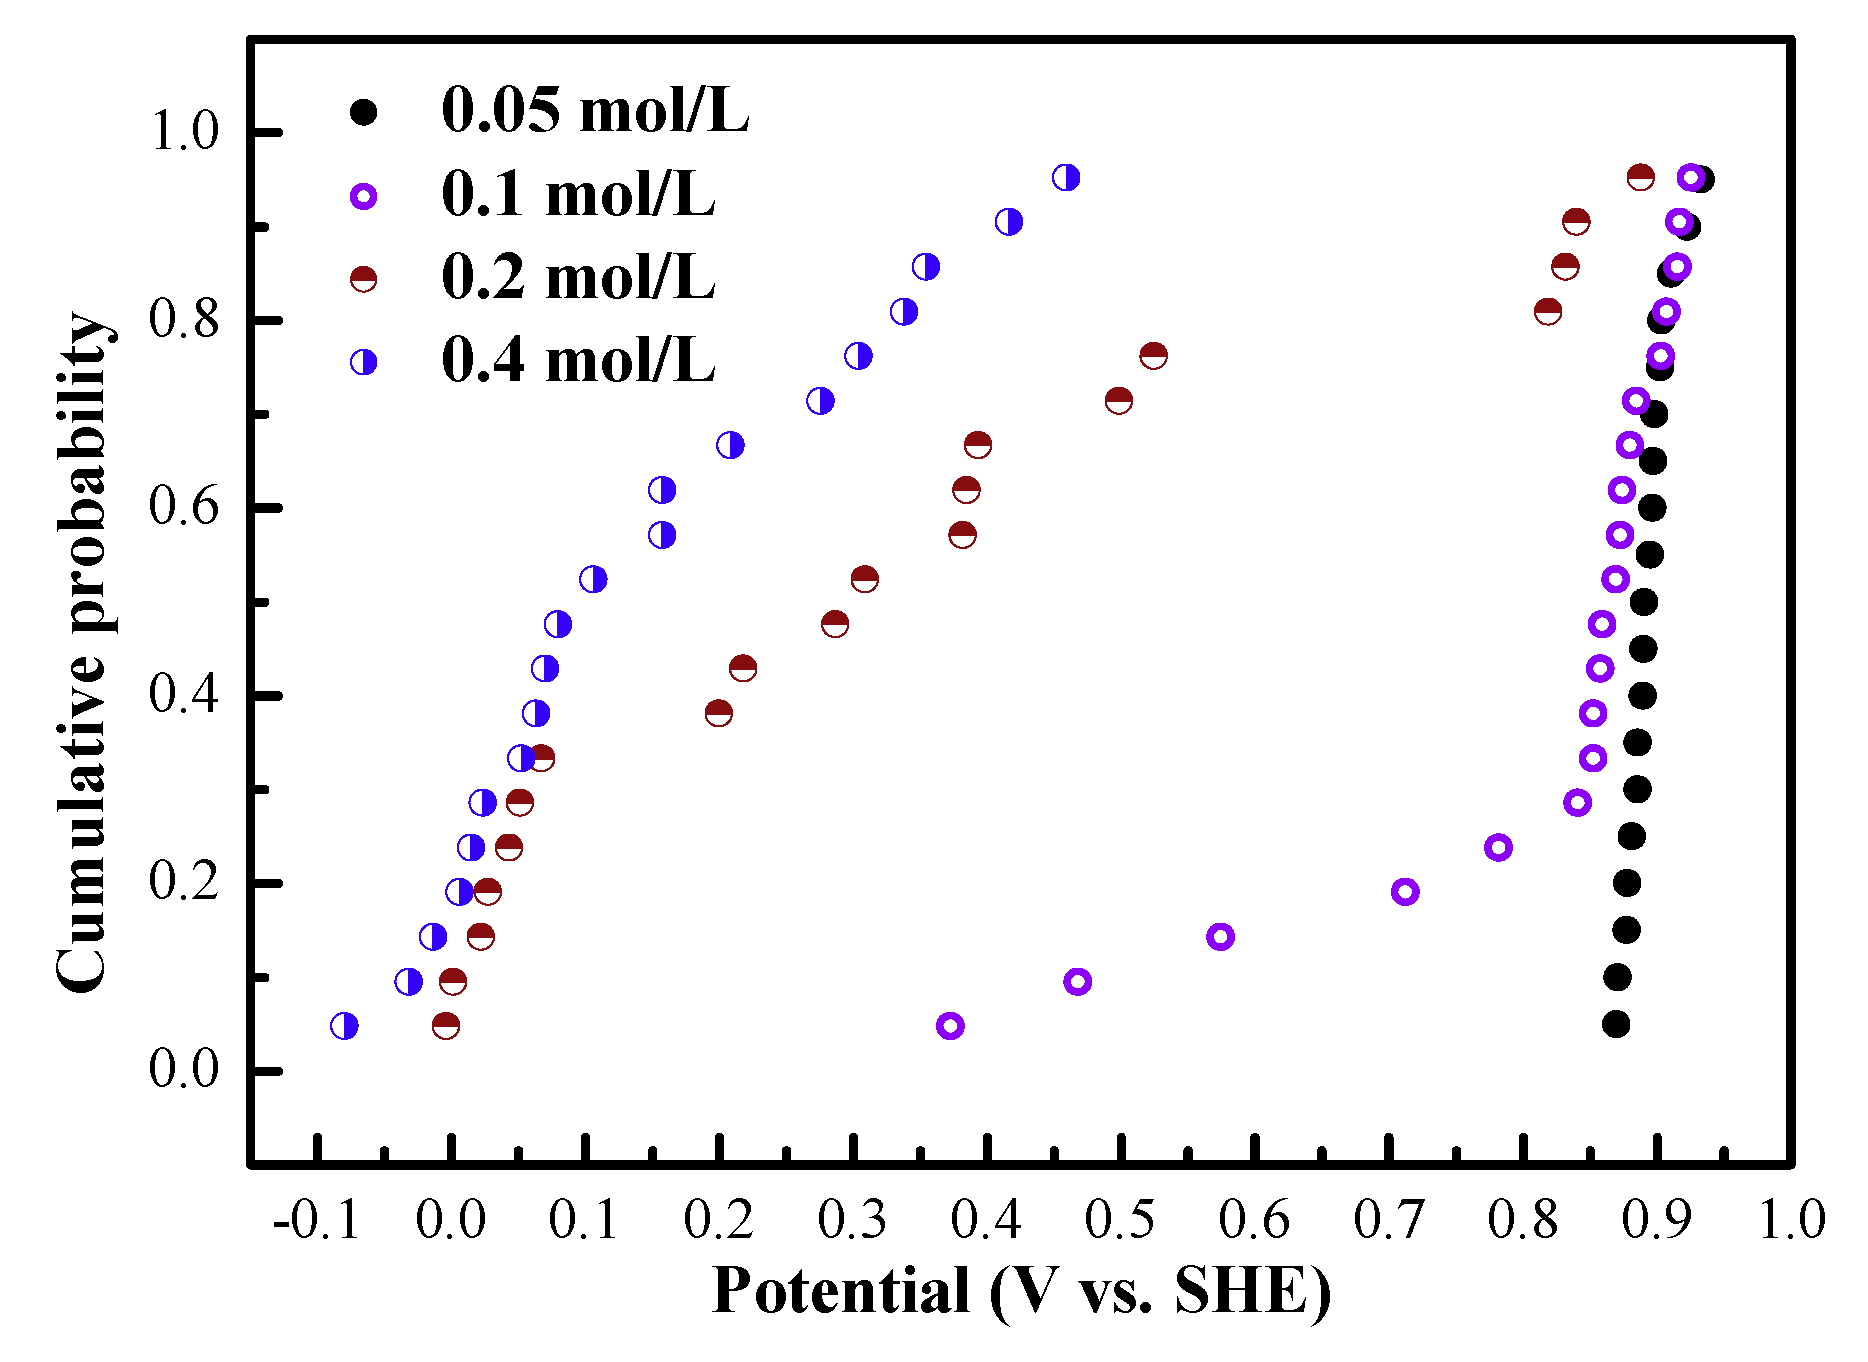
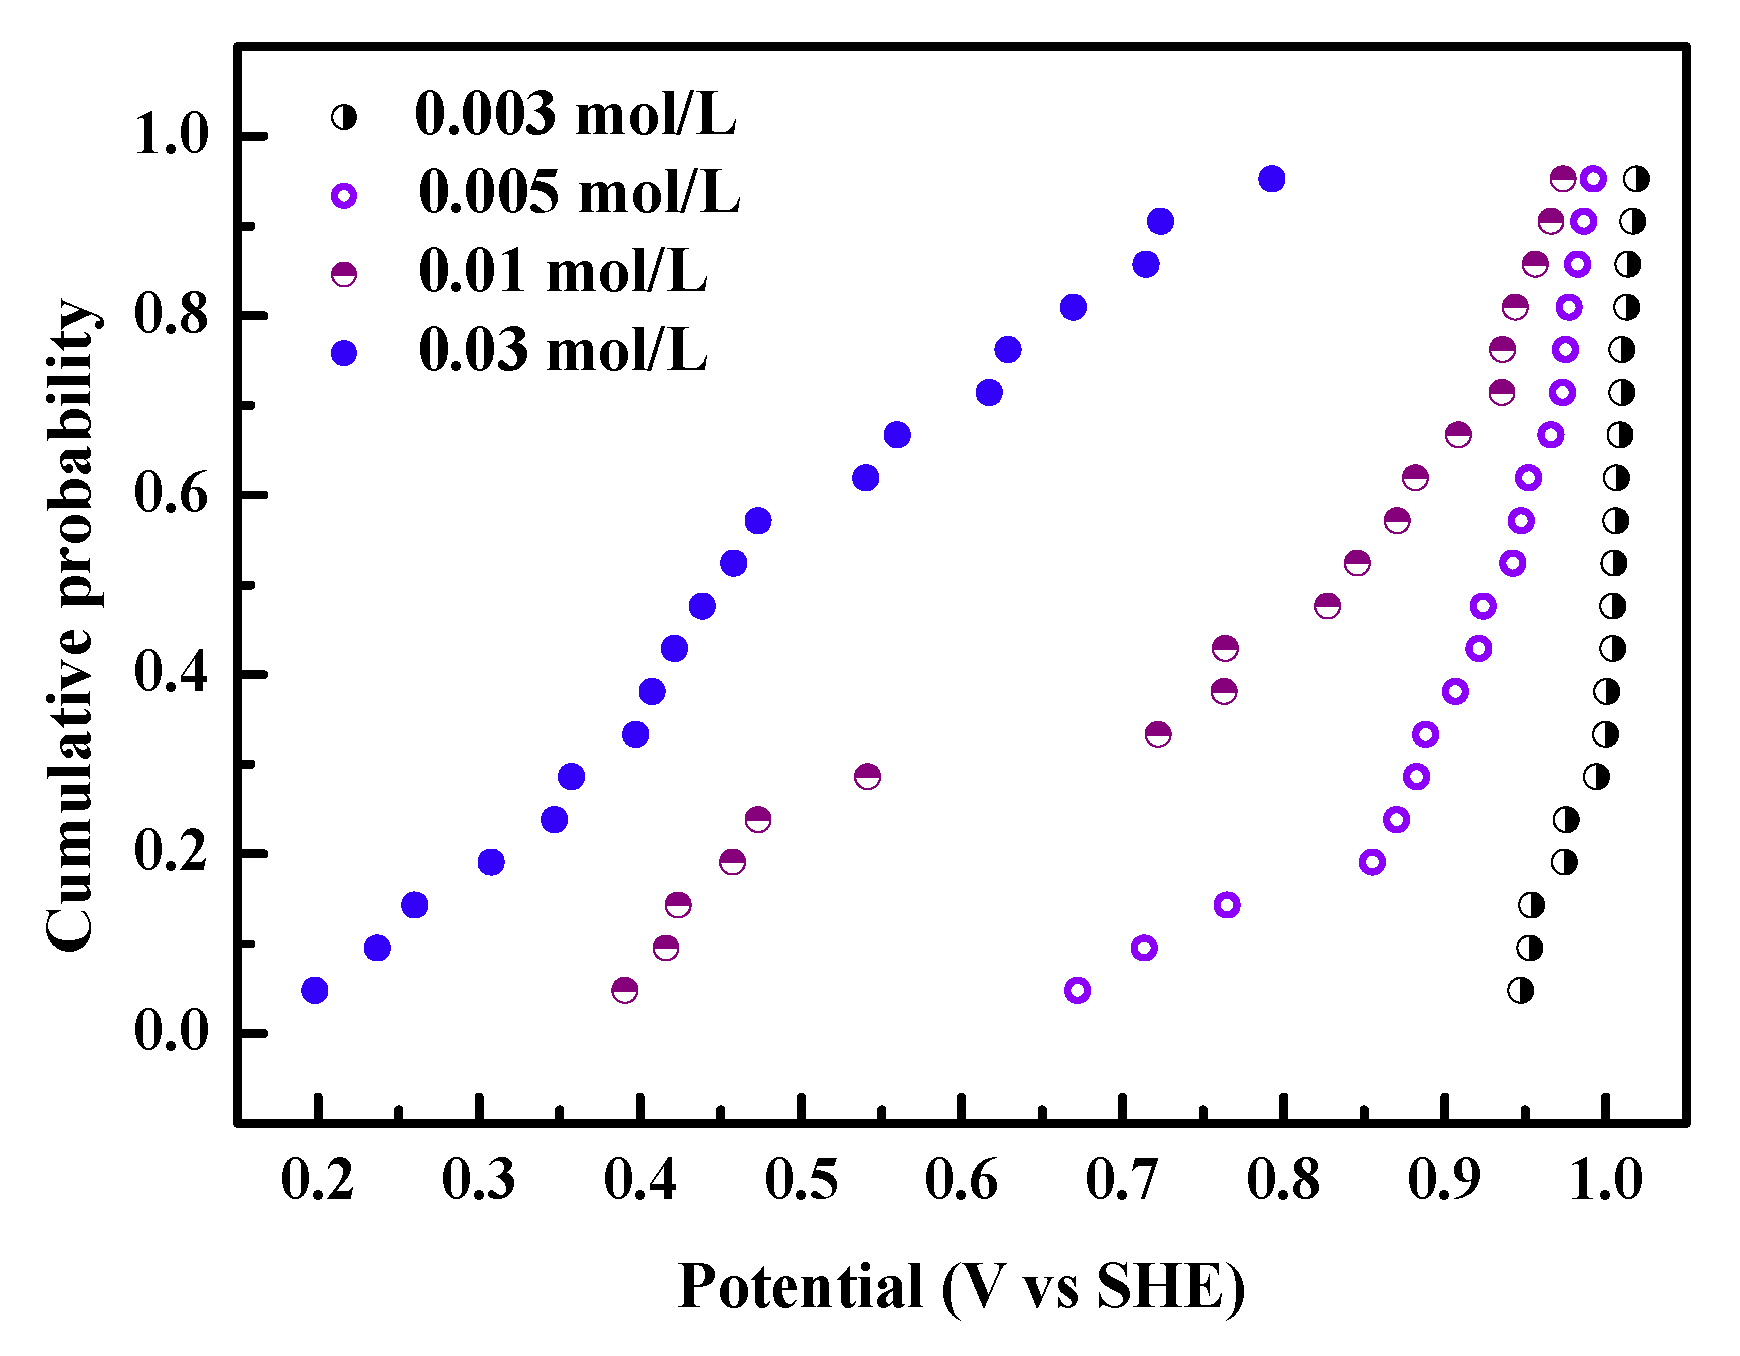
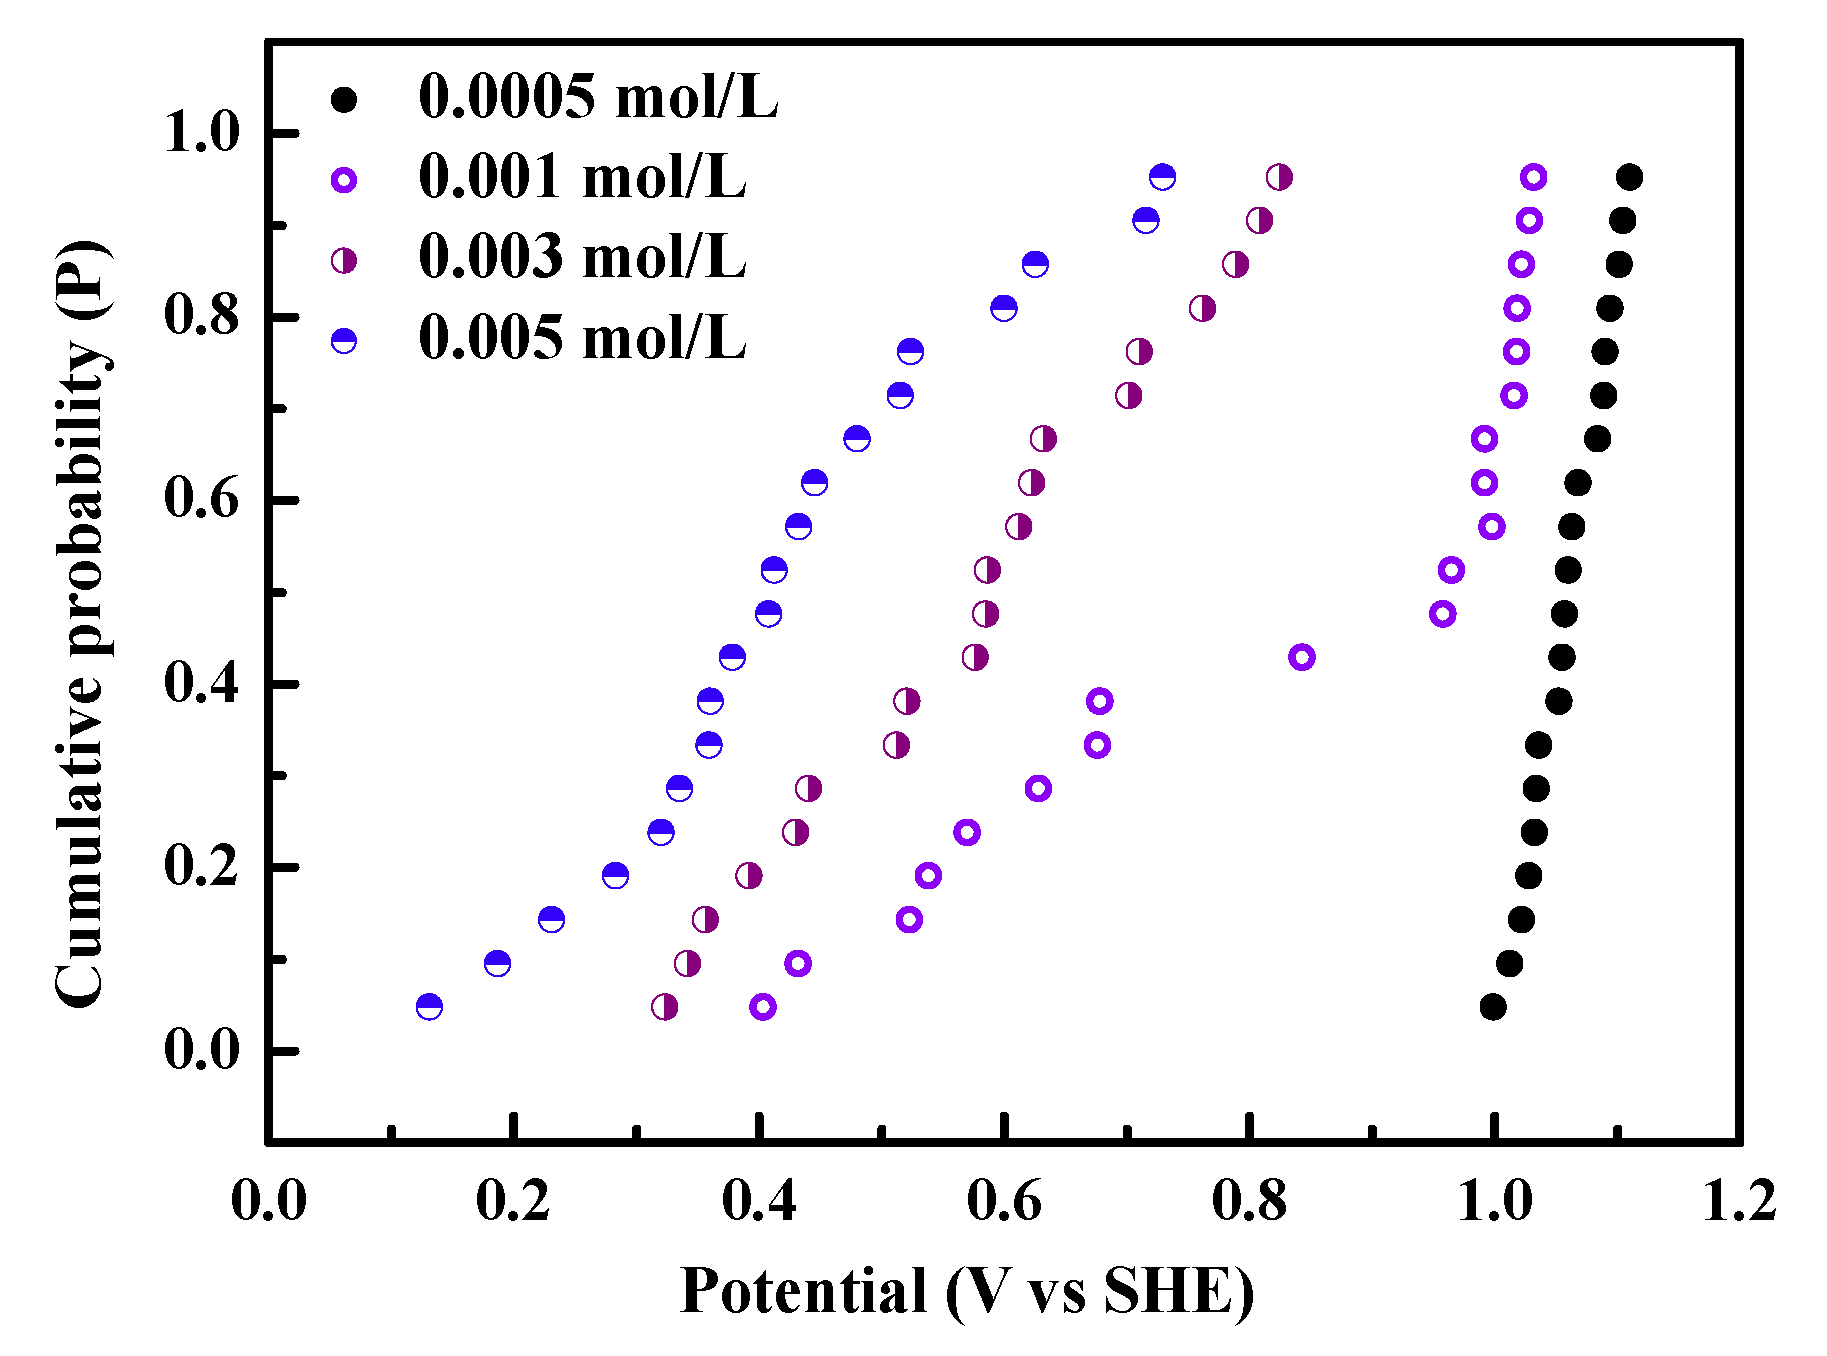
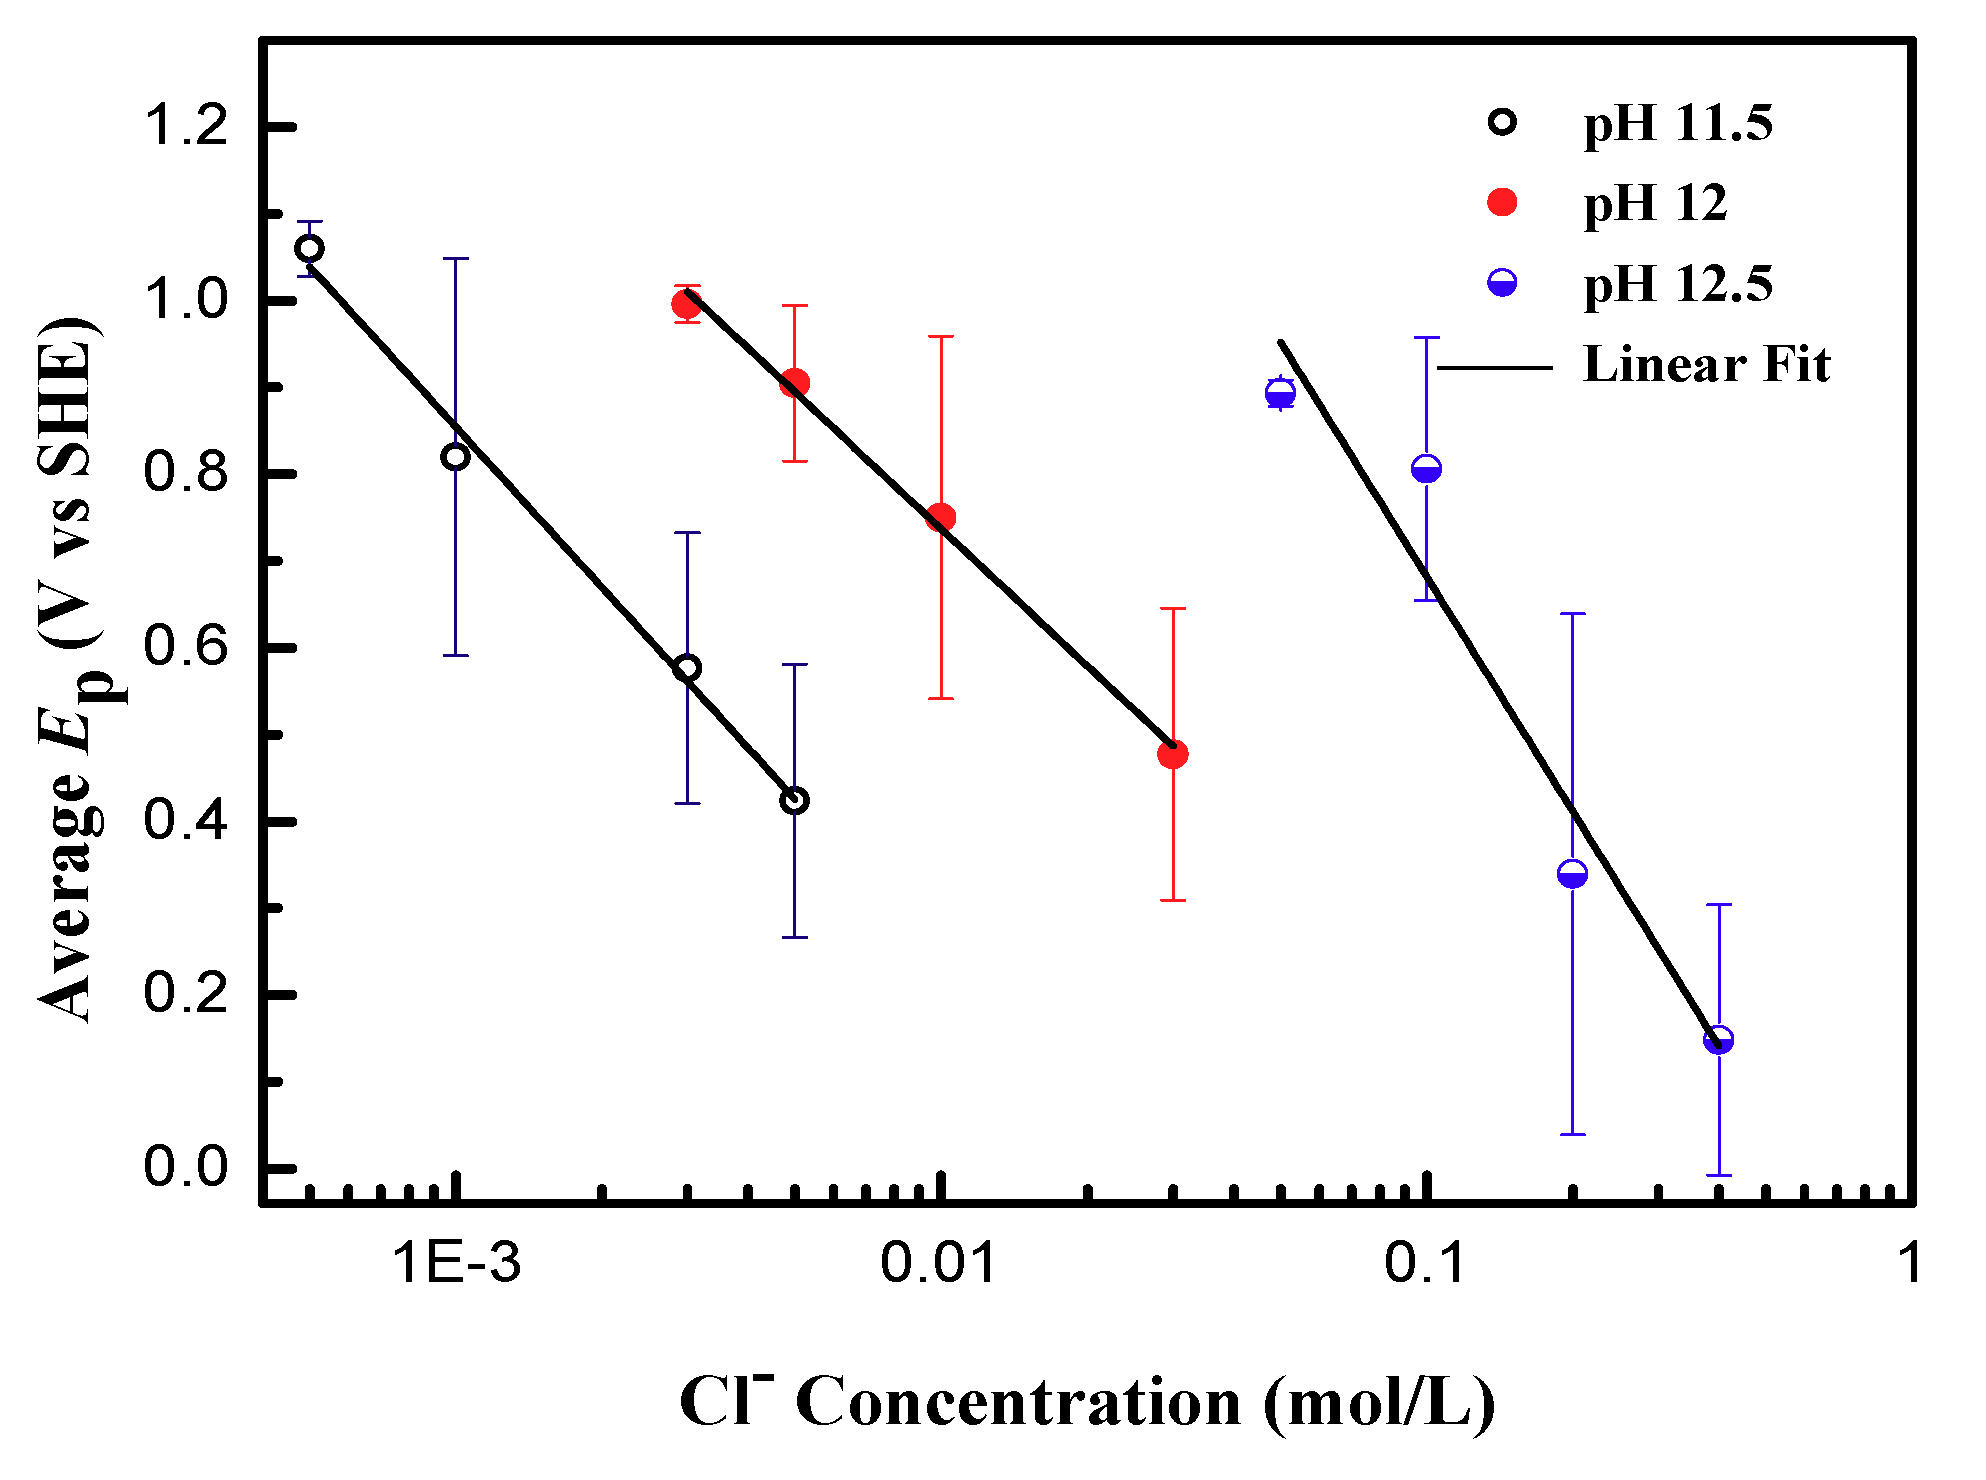
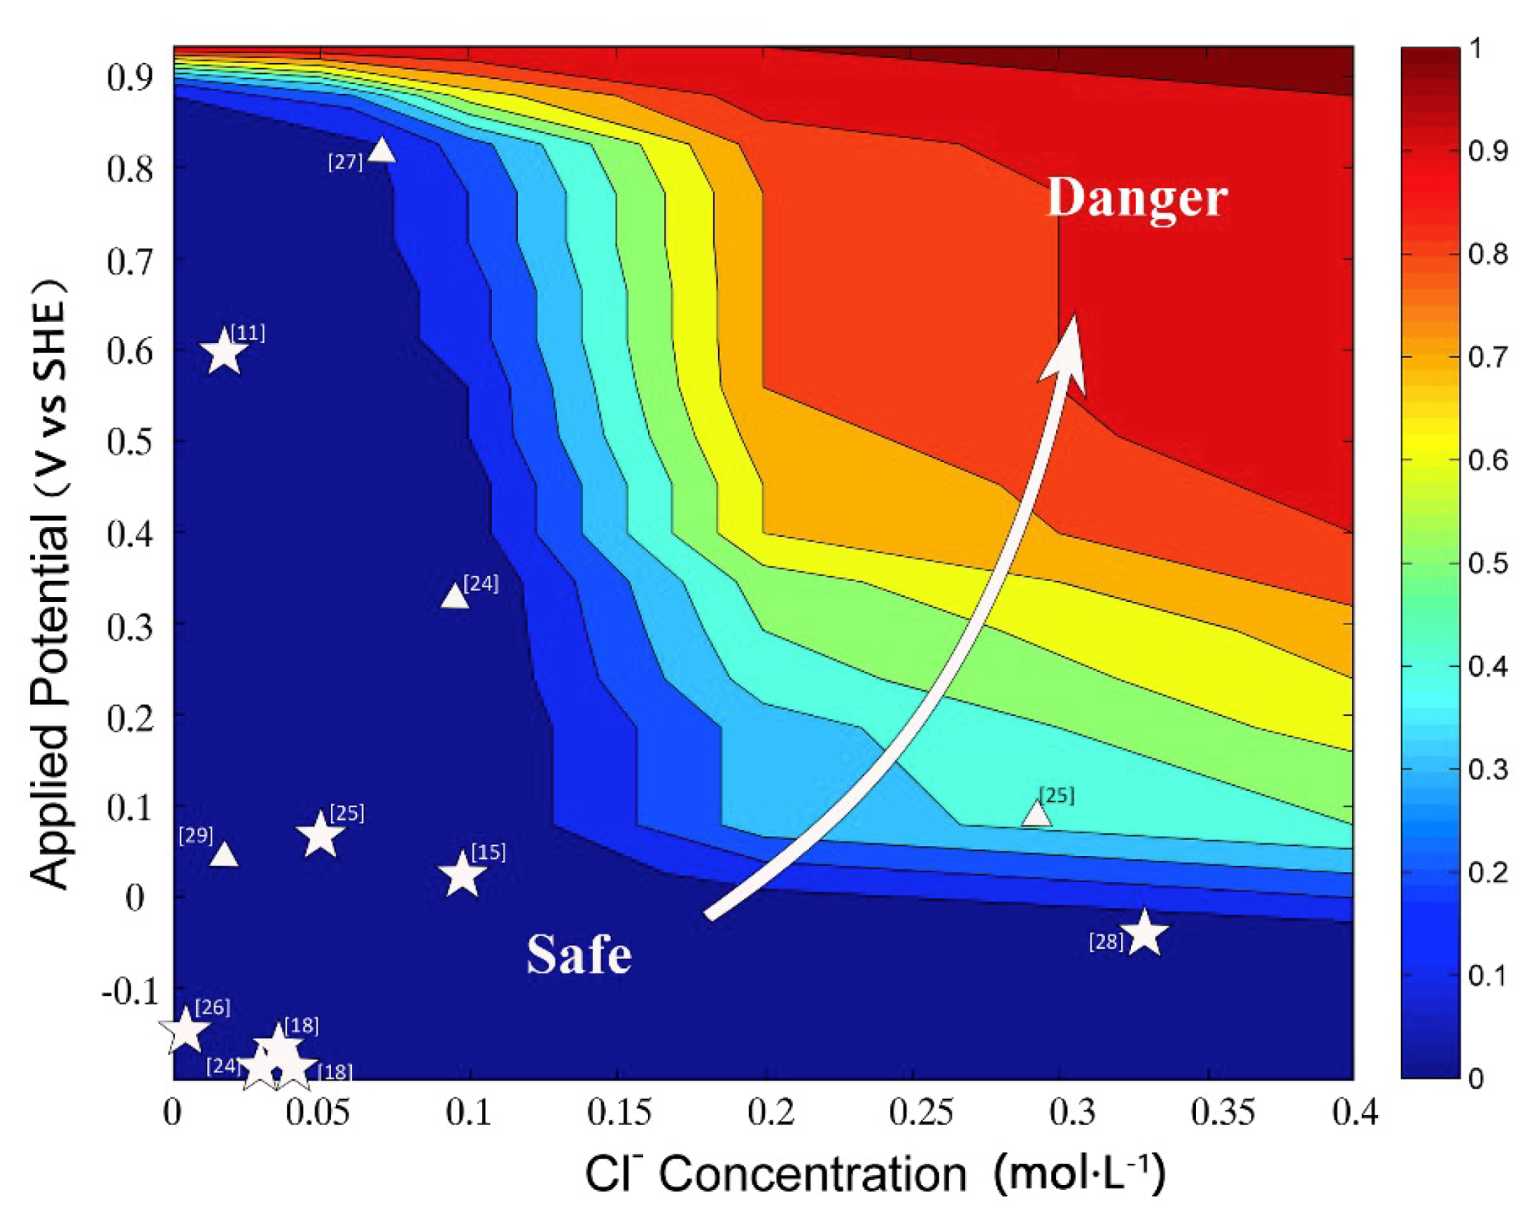
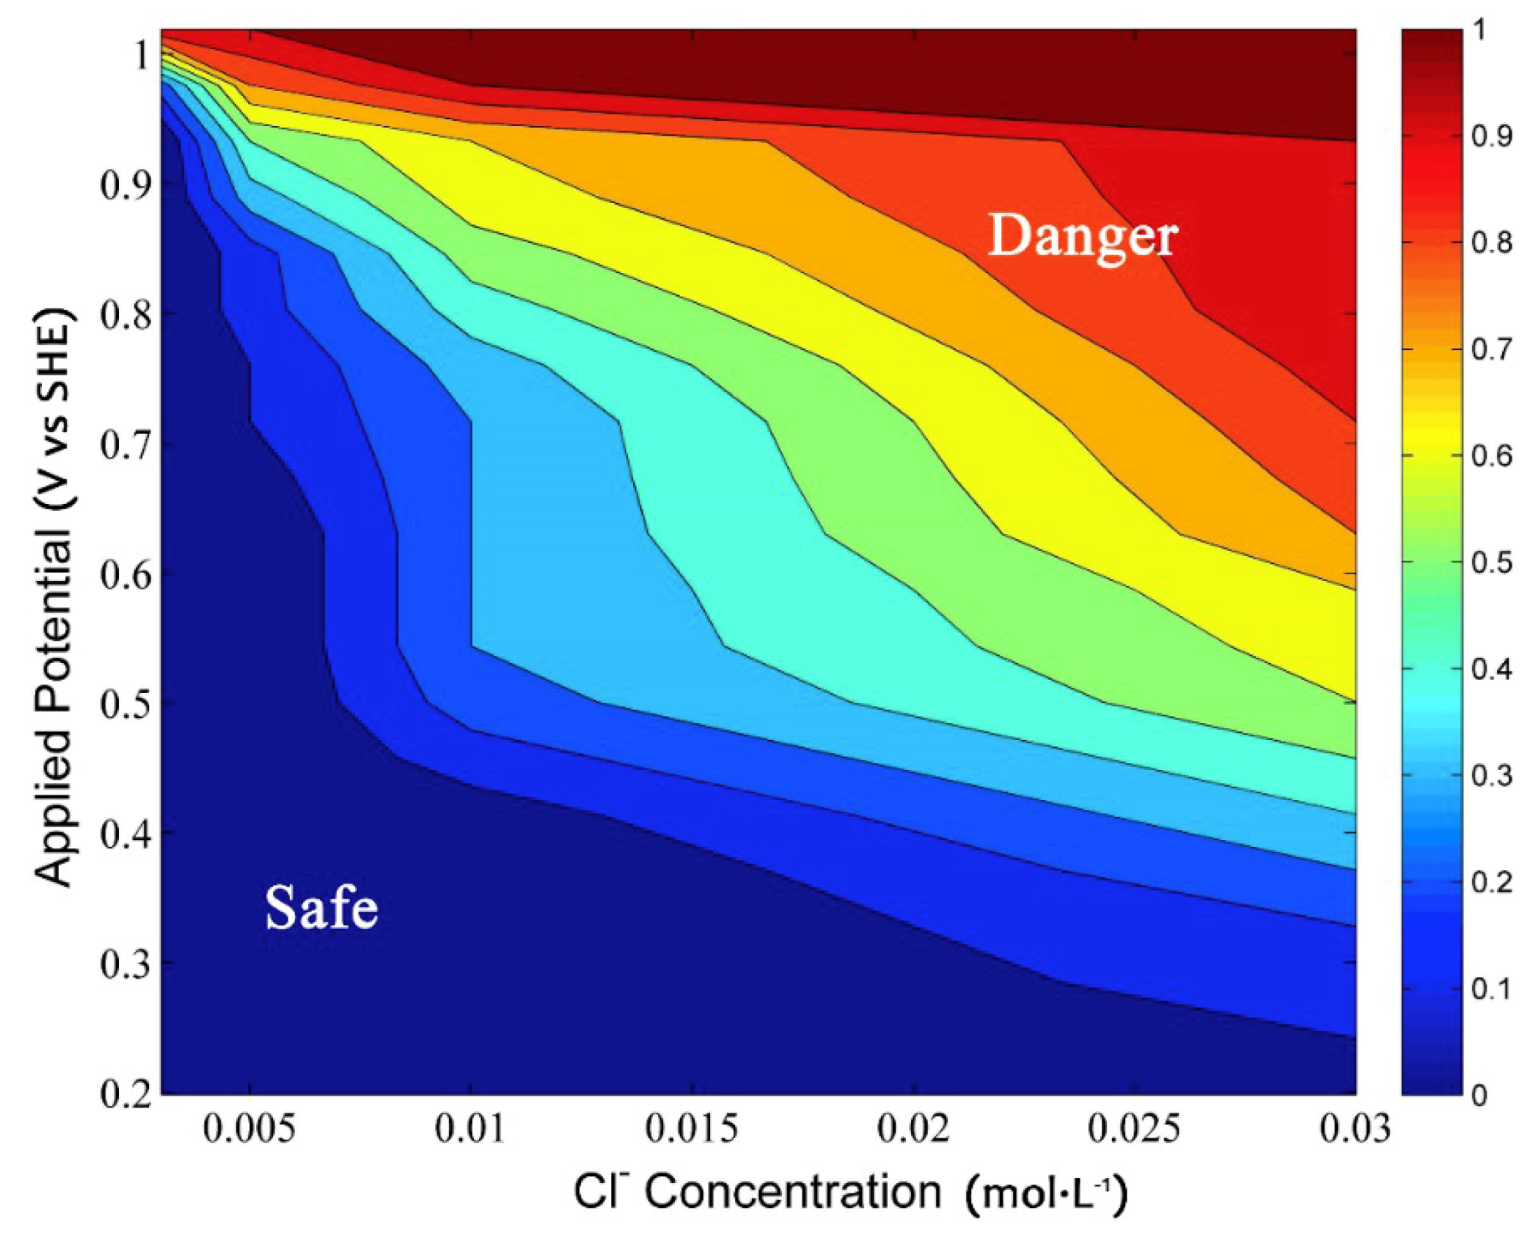
3.4. Probability Estimation of the Chloride Threshold on the Pitting Corrosion of Reinforcing Steel with Different Potential

It is ascertained, as above-mentioned, that both the chloride ions and pH would greatly affect the pitting corrosion of steel bars in concrete environment. The cumulative probability distribution of steel pitting potential can be used well to determine the critical concentration of chloride ion, and it can roughly predict corrosion trends. However, it is difficult to assess the pitting probability of the steel bar in specific changing conditions (such as the potential offset of the steel bar which is caused by a stray current [38,43] in the environment with different chloride concentration). In order to easily assess the pitting probability of reinforcement in different applied potential range and different chloride concentrations, multifactor statistical probability diagrams at pH 12.5 were established as shown in Figure 10. The top view direction is on the axis of pitting probability, and the color scale indicates the value of the pitting cumulative probability. The horizontal axis denotes the chloride concentration, and the vertical axis is the applied potential Eapp This applied potential is in comparison with the pitting potential, which is determined by the polarization curve. According to Equation (6), the product of Epit and [Cl] is as follows:
E p i t × [ C l ] = ( E 0 b log [ C l ] ) × [ C l ]
Suppose Y = Epit × [Cl], then
d Y d [ C l ] = b log e + E 0 b log [ C l ] = E 0 b log ( e [ C l ] ) > 0
This indicates that with the increase of chloride concentration, Y increases. Y can be considered as the area constituted by Eapp and chloride concentration in Figure 10. In the combined Equations (6) and (8), the low applied potential environment has a markedly higher [Cl]th. That is, it is safe for a steel bar in a higher chloride concentration environment at lower applied potential. This is very consistent with some investigations on the cathodic protection of steel bars under chloride-containing environments [44,45]. Figure 10 shows that, even if the applied potential is no more than 0.5 V, the probability of the pitting corrosion of the reinforcement is 50% when the chloride concentration is 0.15–0.2 mol/L. When the chloride concentration is high (0.4 mol/L), the probability of the pitting corrosion occurs more than 80%. To ensure that the probability of the pitting corrosion of the steel structure is less than 10% [46], a safe zone was marked in blue and a danger zone was marked in red in Figure 10. Although the diagram does not provide the information of the actual corrosion rate, it can be easily used to assess pitting tendency in a chloride ion environment at pH 12.5.
Moreover, it could make the radically different [Cl]th reported in the documents reach a consensus. Some [Cl]th reported in [21,28,33,47,48,49,50,51,52] were marked in Figure 10. It can be seen that most of these [Cl]th are in the safe zone, indicating that the diagram can be employed to assess the pitting corrosion of steel bar in chloride-containing environment. Especially when the steel bar was affected by a stray current, the pitting tendency can be effectively predicted in certain chloride concentration environments. The pitting cumulative probability-applied potential-[Cl] diagrams at the condition of pH 12 and 11.5 are also built up in the same way (Figure 11 and Figure 12). When the pH decreases to 12 (Figure 11), the probability of pitting corrosion reaches 50% in the chloride concentration of 0.03 mol/L under the applied potential value of 0.5 V.
In order to ensure that the corrosion probability is less than 10%, the safe range of chloride ion concentration is greatly reduced to 0.007 mol/L (pH = 12). When the pH value is further reduced to 11.5 (Figure 12), the safe range of chloride ion concentration is even reduced to 0.001 mol/L. In fact, it is difficult for reinforced concrete to avoid the neutralization during the long-time service. The pitting corrosion risk of steel bars, therefore, would apparently increase with the elapse of time, especially under the condition of stray current.
Generally, the pitting-risk-evaluation diagrams (Figure 10) were built up by the combination of potentiodynamic technique and statistical probability. These diagrams not only conform to the various [Cl]th reported in the documents [17,20,21,22], but make it easy to assess the pitting risk of steel bars under the chloride-containing environment with stray current. Furthermore, we try to set up the pitting risk evaluation method under the condition without the effect of applied potential (that is, without the effect of a stray current) by electrochemical noise technique. This work is going on in our lab.

4. Conclusions

In this work, the pitting corrosion behavior of HRB400 steel in various simulated concrete environments was investigated by the combination of polarization curves and statistical method. At the applied potential, the [Cl]th of the steel was greatly affected by pH. At the pH value of 12.5, 12.0, 11.5, the steel corrosion critical chloride ion concentration of the value is about 0.1–0.2, 0.005–0.01 and 0.001 mol/L, respectively. The pitting-risk-evaluation diagrams are built up, which can not only satisfy the various [Cl]th reported in the documents, but make it easy to assess the pitting risk of steel bars under the chloride-containing environment with stray current.

Author Contributions

Conceptualization, G.M. and H.A.; methodology, H.A.; software, G.M.; validation, H.A., G.M. and B.L.; formal analysis, H.A. and G.M.; investigation, H.A., G.M. and Y.W.; resources, H.A., G.M., Y.W., J.W., B.L. and F.W.; data curation, Y.W., J.W. and B.L.; writing—original draft preparation, H.A.; writing—review and editing, H.A., G.M. and Y.W.; visualization, H.A., J.W. and B.L.; supervision, G.M., Y.W., B.L. and J.W.; project administration, H.A., G.M., Y.W. and F.W.; funding acquisition, G.M., Y.W., J.W., B.L. and F.W. All authors have read and agreed to the published version of the manuscript.

Funding

This research was funded by National Basic Research Program of China (No. 2014CB643301), National Natural Science Foundation of China (Nos. 51771061 and 51571067), National Natural Science Foundation of Heilongjiang Province, China (No. E2016022), the Fundamental Research Founds for the Central Universities (No. HEUCFM171008), the financial support from the Ministry of Science and Technology of China (No. 2012FY113000) and Key Laboratory of Superlight Materials and Surface Technology (Harbin Engineering University), Ministry of Education (No. HEUCF20151011).

Conflicts of Interest

The authors declare no conflict of interest.

References

  1. Pradhan, B.; Bhattacharjee, B. Rebar corrosion in chloride environment. Constr. Build. Mater. 2011, 25, 2565–2575. [Google Scholar] [CrossRef]
  2. Almusallam, A.A. Effect of degree of corrosion on the properties of reinforcing steel bars. Constr. Build. Mater. 2001, 15, 361–368. [Google Scholar] [CrossRef]
  3. Thompson, N.G.; Yunovich, M.; Dunmire, D. Cost of corrosion and corrosion maintenance strategies. Corros. Rev. 2007, 25, 247–261. [Google Scholar] [CrossRef]
  4. Neville, A. Chloride attack of reinforced concrete: An overview. Mater. Struct. 1995, 28, 63–70. [Google Scholar] [CrossRef]
  5. Abd El Haleem, S.M.; Abd El Wanees, S.; Abd El Aal, E.E.; Diab, A. Environmental factors affecting the corrosion behavior of reinforcing steel II. Role of some anions in the initiation and inhibition of pitting corrosion of steel in Ca(OH)2 solutions. Corros. Sci. 2010, 52, 292–302. [Google Scholar] [CrossRef]
  6. Montemor, M.F.; Simões, A.M.P.; Ferreira, M.G.S. Chloride-induced corrosion on reinforcing steel: From the fundamentals to the monitoring techniques. Cem. Concr. Compos. 2003, 25, 491–502. [Google Scholar] [CrossRef] [Green Version]
  7. Raupach, M.; SchießI, P. Macrocell sensor systems for monitoring of the corrosion risk of the reinforcement in concrete structures. NDT & E Int. 2001, 34, 435–442. [Google Scholar]
  8. Ying, C.; Yang, Z.M.; Wamg, H.M. Comprehensive properties of 400 mpa grade corrosion-resistant rebar. J. Iron Steel Res. Int. 2012, 19, 48–52. [Google Scholar]
  9. Angst, U.; Elsener, B.; Larsen, C.K.; Vennesland, Ø. Critical chloride content in reinforced concrete—A review. Cem. Concr. Res. 2009, 39, 1122–1138. [Google Scholar] [CrossRef]
  10. Ahmad, S. Reinforcement corrosion in concrete structures, its monitoring and service life prediction––A review. Cem. Concr. Compos. 2003, 25, 459–471. [Google Scholar] [CrossRef]
  11. Andrade, C.; d’Andrea, R.; Rebolledo, N. Chloride ion penetration in concrete: The reaction factor in the electrical resistivity model. Cem. Concr. Compos. 2014, 47, 41–46. [Google Scholar] [CrossRef]
  12. Andrade, C.; Keddam, M.; Nóvoa, X.R.; Pérez, M.C.; Rangel, C.M.; Takenouti, H. Electrochemical behaviour of steel rebars in concrete: Influence of environmental factors and cement chemistry. Electrochim. Acta 2001, 46, 3905–3912. [Google Scholar] [CrossRef]
  13. Leckie, H.P.; Uhlig, H.H. Environmental factors affecting the critical potential for pitting in 18–8 stainless steel. J. Electrochem. Soc. 1966, 113, 1262–1267. [Google Scholar] [CrossRef]
  14. Assouli, B.; Simescu, F.; Debicki, G.; Idrissi, H. Detection and identification of concrete cracking during corrosion of reinforced concrete by acoustic emission coupled to the electrochemical techniques. NDT & E Int. 2005, 38, 682–689. [Google Scholar]
  15. Gouda, V.K. Corrosion and corrosion inhibition of reinforcing steel: I. immersed in alkaline solutions. Br. Corros. J. 1970, 5, 198–203. [Google Scholar] [CrossRef]
  16. Horvath, A.; Hendrickson, C. Steel versus steel-reinforced concrete bridges: Environmental assessment. J. Infrastruct. Syst. 1998, 4, 111–117. [Google Scholar] [CrossRef] [Green Version]
  17. Glass, G.K.; Buenfeld, N.R. The presentation of the chloride threshold level for corrosion of steel in concrete. Corros. Sci. 1997, 39, 1001–1013. [Google Scholar] [CrossRef]
  18. Ann, K.Y.; Song, H.-W. Chloride threshold level for corrosion of steel in concrete. Corros. Sci. 2007, 49, 4113–4133. [Google Scholar] [CrossRef]
  19. Oh, B.H.; Jang, S.Y.; Shin, Y.S. Experimental investigation of the threshold chloride concentration for corrosion initiation in reinforced concrete structures. Mag. Concr. Res. 2003, 55, 117–124. [Google Scholar] [CrossRef]
  20. Saremi, M.; Mahallati, E. A study on chloride-induced depassivation of mild steel in simulated concrete pore solution. Cem. Concr. Res. 2002, 32, 1915–1921. [Google Scholar] [CrossRef]
  21. Moreno, M.; Morris, W.; Alvarez, M.G.; Duffó, G.S. Corrosion of reinforcing steel in simulated concrete pore solutions. Corros. Sci. 2004, 46, 2681–2699. [Google Scholar] [CrossRef]
  22. Bautista, A.; Blanco, G.; Velasco, F. Corrosion behaviour of low-nickel austenitic stainless steels reinforcements: A comparative study in simulated pore solutions. Cem. Concr. Res. 2006, 36, 1922–1930. [Google Scholar] [CrossRef]
  23. Lambert, P.; Page, C.L.; Vassie, P.R.W. Investigations of reinforcement corrosion. 2. Electrochemical monitoring of steel in chloride-contaminated concrete. Mater. Struct. 1991, 24, 351–358. [Google Scholar] [CrossRef]
  24. Rasheeduzzafar; Ehtesham Hussain, S.; Al-Saadoun, S.S. Effect of cement composition on chloride binding and corrosion of reinforcing steel in concrete. Cem. Concr. Res. 1991, 21, 777–794. [Google Scholar] [CrossRef]
  25. Izquierdo, D.; Alonso, C.; Andrade, C.; Castellote, M. Potentiostatic determination of chloride threshold values for rebar depassivation. Electrochim. Acta 2004, 49, 2731–2739. [Google Scholar] [CrossRef]
  26. Angst, U.; Rønnquist, A.; Elsener, B.; Larsen, C.K.; Vennesland, Ø. Probabilistic considerations on the effect of specimen size on the critical chloride content in reinforced concrete. Corrosion Science 2011, 53, 177–187. [Google Scholar] [CrossRef]
  27. Poursaee, A.; Hansson, C. Reinforcing steel passivation in mortar and pore solution. Cem. Concr. Res. 2007, 37, 1127–1133. [Google Scholar] [CrossRef]
  28. Yu, H.; Chiang, K.-T.K.; Yang, L. Threshold chloride level and characteristics of reinforcement corrosion initiation in simulated concrete pore solutions. Constr. Build. Mater. 2012, 26, 723–729. [Google Scholar] [CrossRef]
  29. Alamuti, M.M.; Nouri, H.; Jamali, S. Effects of earthing systems on stray current for corrosion and safety behaviour in practical metro systems. IET Electr. Syst. Transp. 2011, 1, 69–79. [Google Scholar] [CrossRef] [Green Version]
  30. Liu, J.; Zhang, T.; Meng, G.; Shao, Y.; Wang, F. Effect of pitting nucleation on critical pitting temperature of 316L stainless steel by nitric acid passivation. Corros. Sci. 2015, 91, 232–244. [Google Scholar] [CrossRef]
  31. ISO 8407:2009. Corrosion of Metals and Alloys. Removal of Corrosion Products from Corrosion Test Specimens; Switzerland, Geneva: ISO, 2009; p. 5. [Google Scholar]
  32. Meng, G.; Li, Y.; Shao, Y.; Zhang, T.; Wang, Y.; Wang, F. Effect of Cl on the properties of the passive films formed on 316L stainless steel in acidic solution. J. Mater. Sci. Technol. 2014, 30, 253–258. [Google Scholar] [CrossRef]
  33. Liu, R.; Jiang, L.; Xu, J.; Xiong, C.; Song, Z. Influence of carbonation on chloride-induced reinforcement corrosion in simulated concrete pore solutions. Constr. Build. Mater. 2014, 56, 16–20. [Google Scholar] [CrossRef]
  34. Zhu, X.; Zi, G.; Lee, W.; Kim, S.; Kong, J. Probabilistic analysis of reinforcement corrosion due to the combined action of carbonation and chloride ingress in concrete. Constr. Build. Mater. 2016, 124, 667–680. [Google Scholar] [CrossRef]
  35. Müllauer, W.; Beddoe, R.E.; Heinz, D. Effect of carbonation, chloride and external sulphates on the leaching behaviour of major and trace elements from concrete. Cem. Concr. Compos. 2012, 34, 618–626. [Google Scholar] [CrossRef]
  36. Ramezanianpour, A.A.; Ghahari, S.A.; Esmaeili, M. Effect of combined carbonation and chloride ion ingress by an accelerated test method on microscopic and mechanical properties of concrete. Constr. Build. Mater. 2014, 58, 138–146. [Google Scholar] [CrossRef]
  37. Pourbaix, M. Atlas of Electrochemical Equilibria in Aqueous Solutions; National Association of Corrosion Engineers: Houston, TX, USA, 1974; p. 90. [Google Scholar]
  38. Bertolini, L.; Carsana, M.; Pedeferri, P. Corrosion behaviour of steel in concrete in the presence of stray current. Corros. Sci. 2007, 49, 1056–1068. [Google Scholar] [CrossRef]
  39. Shibata, T.; Takeyama, T. Stochastic theory of pitting corrosion. Corrosion 1977, 33, 243–251. [Google Scholar] [CrossRef]
  40. Sharifi-Asl, S.; Mao, F.; Lu, P.; Kursten, B.; Macdonald, D.D. Exploration of the effect of chloride ion concentration and temperature on pitting corrosion of carbon steel in saturated Ca(OH)2 solution. Corros. Sci. 2015, 98, 708–715. [Google Scholar] [CrossRef]
  41. Yang, S.; Macdonald, D.D. Theoretical and experimental studies of the pitting of type 316L stainless steel in borate buffer solution containing nitrate ion. Electrochim. Acta 2007, 52, 1871–1879. [Google Scholar] [CrossRef]
  42. Butler, G.; Stretton, P.; Beynon, J.G. Initiation and Growth of Pits on High-Purity Iron and its Alloys with Chromium and Copper in Neutral Chloride Solutions. Br. Corros. J. 1972, 7, 168–173. [Google Scholar] [CrossRef]
  43. Surbrook, T.C.; Reese, N.D.; Kehrle, A.M. Stray Voltage: Sources and Solutions. IEEE Trans. Ind. Appl. 1986, 2, 210–215. [Google Scholar] [CrossRef]
  44. Carmona Calero, J.; Climent Llorca, M.A.; Garcés Terradillos, P. Influence of different ways of chloride contamination on the efficiency of cathodic protection applied on structural reinforced concrete elements. J. Electroanal. Chem. 2017, 793, 8–17. [Google Scholar] [CrossRef] [Green Version]
  45. Sagüés, A.A.; Powers, R.G. Sprayed-zinc sacrificial anodes for reinforced concrete in marine service. Corrosion 1996, 52, 508–522. [Google Scholar] [CrossRef]
  46. US-ASTM. Standard Test Method for Corrosion Potentials of Uncoated Reinforcing Steel in Concrete; ASTM: West Conshohocken, PA, USA, 2015; p. 8. [Google Scholar]
  47. Tan, Y.T.; Wijesinghe, S.L.; Blackwood, D.J. The inhibitive effect of bicarbonate and carbonate ions on carbon steel in simulated concrete pore solution. Corros. Sci. 2014, 88, 152–160. [Google Scholar] [CrossRef]
  48. Ghods, P.; Isgor, O.B.; McRae, G.A.; Gu, G.P. Electrochemical investigation of chloride-induced depassivation of black steel rebar under simulated service conditions. Corros. Sci. 2010, 52, 1649–1659. [Google Scholar] [CrossRef]
  49. Abd El Haleem, S.M.; Abd El Wanees, S.; Bahgat, A. Environmental factors affecting the corrosion behaviour of reinforcing steel. V. Role of chloride and sulphate ions in the corrosion of reinforcing steel in saturated Ca(OH)2 solutions. Corros. Sci. 2013, 75, 1–15. [Google Scholar] [CrossRef]
  50. Tang, Y.M.; Miao, Y.F.; Zuo, Y.; Zhang, G.D.; Wang, C.L. Corrosion behavior of steel in simulated concrete pore solutions treated with calcium silicate hydrates. Constr. Build. Mater. 2012, 30, 252–256. [Google Scholar] [CrossRef]
  51. Liu, M.; Cheng, X.; Li, X.; Jin, Z.; Liu, H. Corrosion behavior of Cr modified HRB400 steel rebar in simulated concrete pore solution. Constr. Build. Mater. 2015, 93, 884–890. [Google Scholar] [CrossRef]
  52. Abd El Haleem, S.M.; Abd El Wanees, S.; Bahgat, A. Environmental factors affecting the corrosion behaviour of reinforcing steel. VI. Benzotriazole and its derivatives as corrosion inhibitors of steel. Corros. Sci. 2014, 87, 321–333. [Google Scholar] [CrossRef]
Figure 1. Metallographic micrograph of HRB400 steel.
Coatings 10 00505 g001
Figure 2. Anodic polarization curves for reinforcing bars’ in simulated concrete pore solutions with various pH values (a). The corrosion morphology after the polarization test (b), and the water Pourbaix diagram (c).
Coatings 10 00505 g002
Figure 3. Anodic polarization curves for reinforcing bars in simulated concrete pore solutions with various concentration of chloride ions at pH 12.5; (a) 0.05 mol/L, (b) 0.1 mol/L, (c) 0.2 mol/L, and (d) 0.4 mol/L. (e) shows the pitting corrosion after the anodic polarization test.
Coatings 10 00505 g003
Figure 4. Cumulative probability distribution of pitting potential of reinforcing bars under different chloride concentration at pH 12.5.
Coatings 10 00505 g004
Figure 5. Anodic polarization curves for reinforcing bars in simulated concrete pore solutions with various concentrations of chloride ions at pH 12.0; (a) 0.003 mol/L, (b) 0.005 mol/L, (c) 0.01 mol/L, and (d) 0.03 mol/L. (e) shows the pitting corrosion after the anodic polarization test.
Coatings 10 00505 g005
Figure 6. Cumulative probability distribution of pitting potential of steel bar under different chloride concentration at pH 12.0.
Coatings 10 00505 g006
Figure 7. Anodic polarization curves for reinforcing bars in simulated concrete pore solutions with various concentrations of chloride ions at pH 11.5; (a) 0.0005 mol/L, (b) 0.001 mol/L, (c) 0.003 mol/L, and (d) 0.005mol/L. (e) shows the pitting corrosion after the anodic polarization test.
Coatings 10 00505 g007
Figure 8. Cumulative probability distribution of the pitting potential of steel bar under different chloride concentration at pH 11.5.
Coatings 10 00505 g008
Figure 9. Variation of the average value of pitting corrosion potential with chloride ion concentration at various pH values.
Coatings 10 00505 g009
Figure 10. The top viewport of variation of the pitting probability with the potential and Cl concentration at pH 12.5 (the data from other literatures: ☆: the chloride in the security zone on the reinforcing steel at pH 12.5. △: the chloride in the pitting corrosion of reinforcing steel at pH 12.5. [11,15,18,24,25,26,27,28,29]: the corresponding document with the data.). The top view direction is on the axis of pitting probability, and the color scale indicates the value of the pitting probability.
Coatings 10 00505 g010
Figure 11. The top viewport of variation of the pitting probability with the potential and Cl concentration at pH 12.0. The top view direction is on the axis of pitting probability, and the color scale indicates the value of the pitting probability.
Coatings 10 00505 g011
Figure 12. The top viewport of variation of the pitting probability with the potential and Cl concentration at pH 11.5. The top view direction is on the axis of pitting probability, and the color scale indicates the value of the pitting probability.
Coatings 10 00505 g012

