Statistical/Numerical Model of the Powder-Gas Jet for Extreme High-Speed Laser Material Deposition

Abstract
1. Introduction
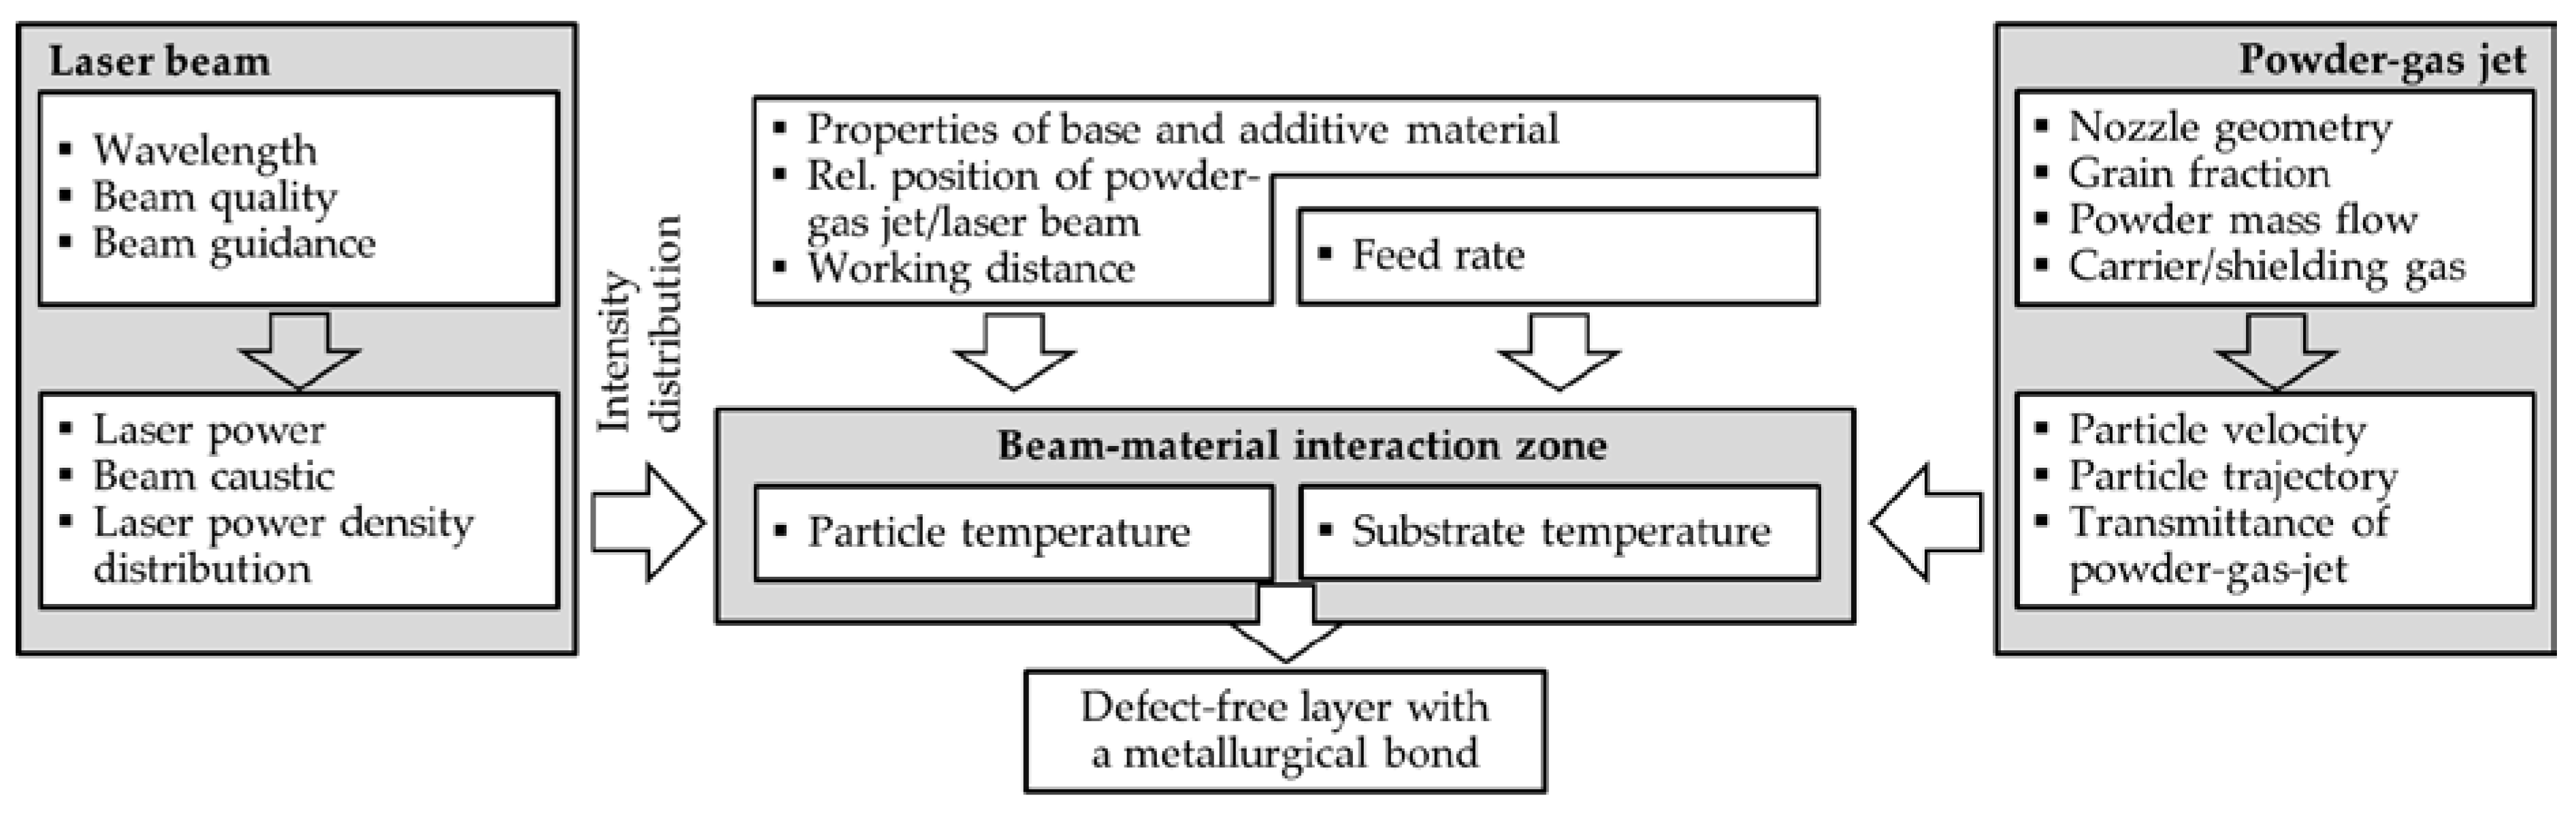
1.1. Process Ccontrol in Laser Material Deposition
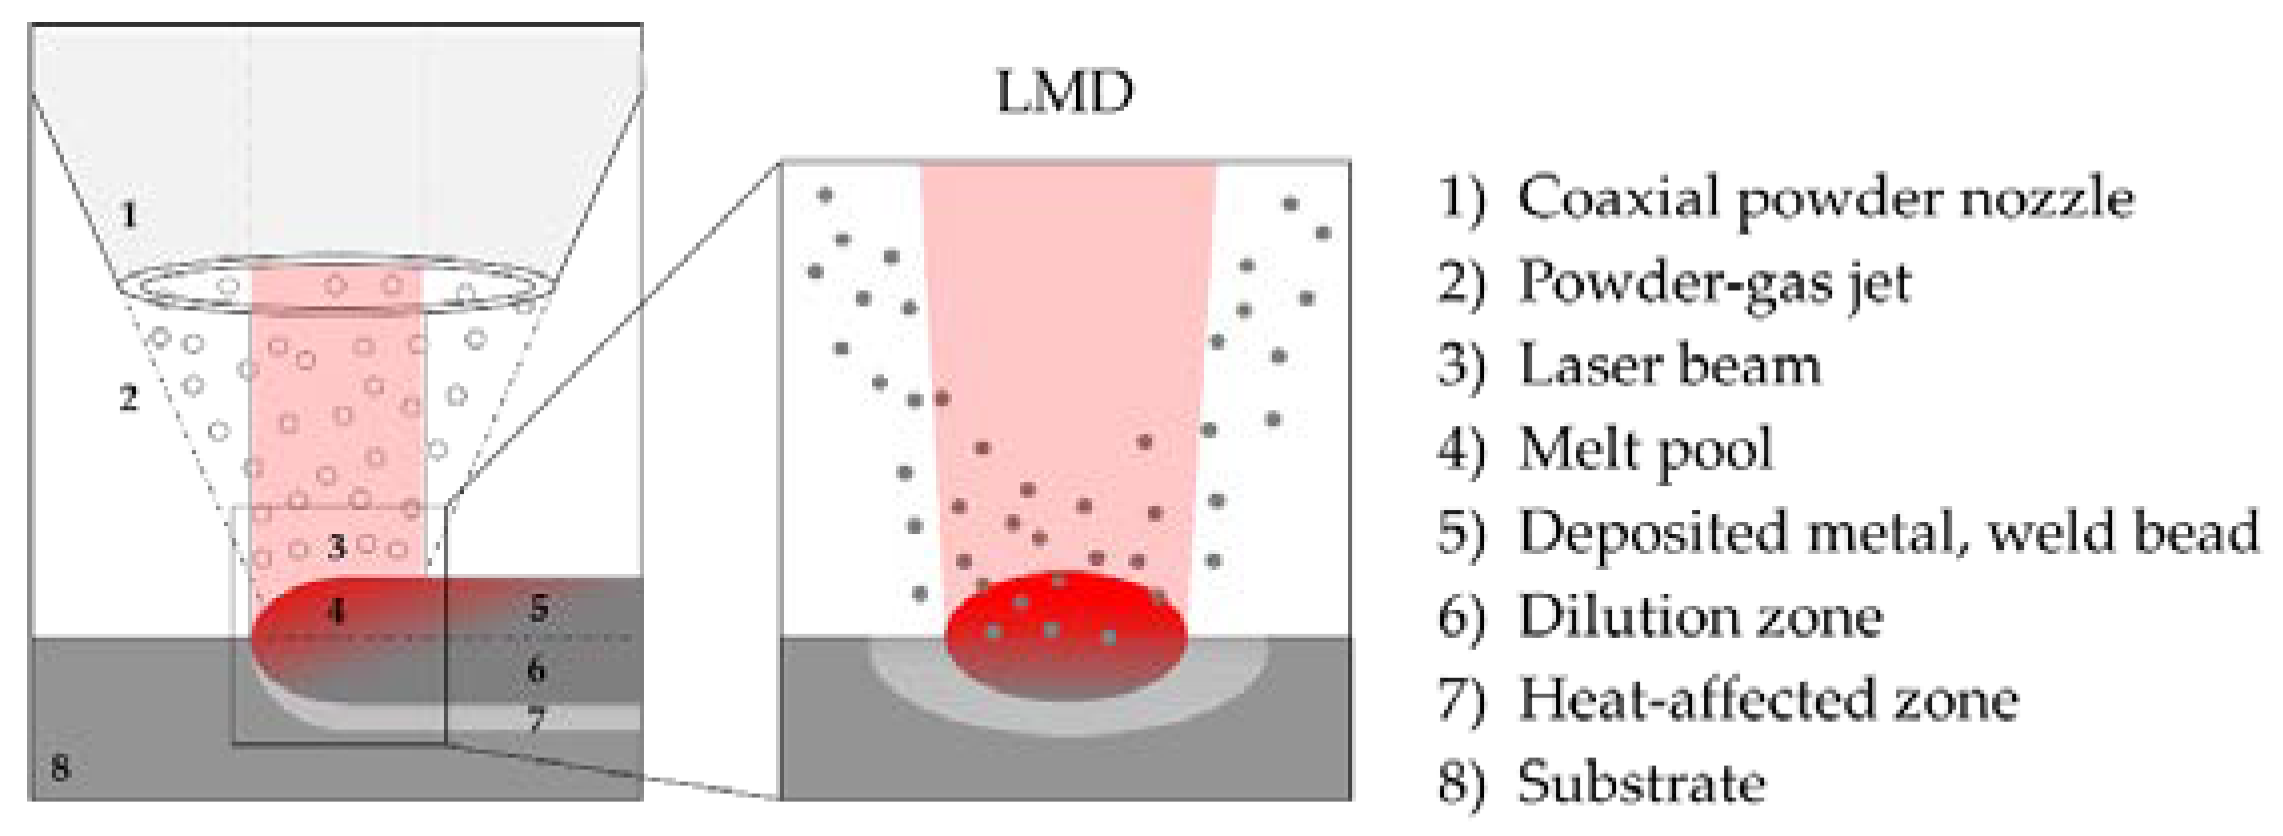
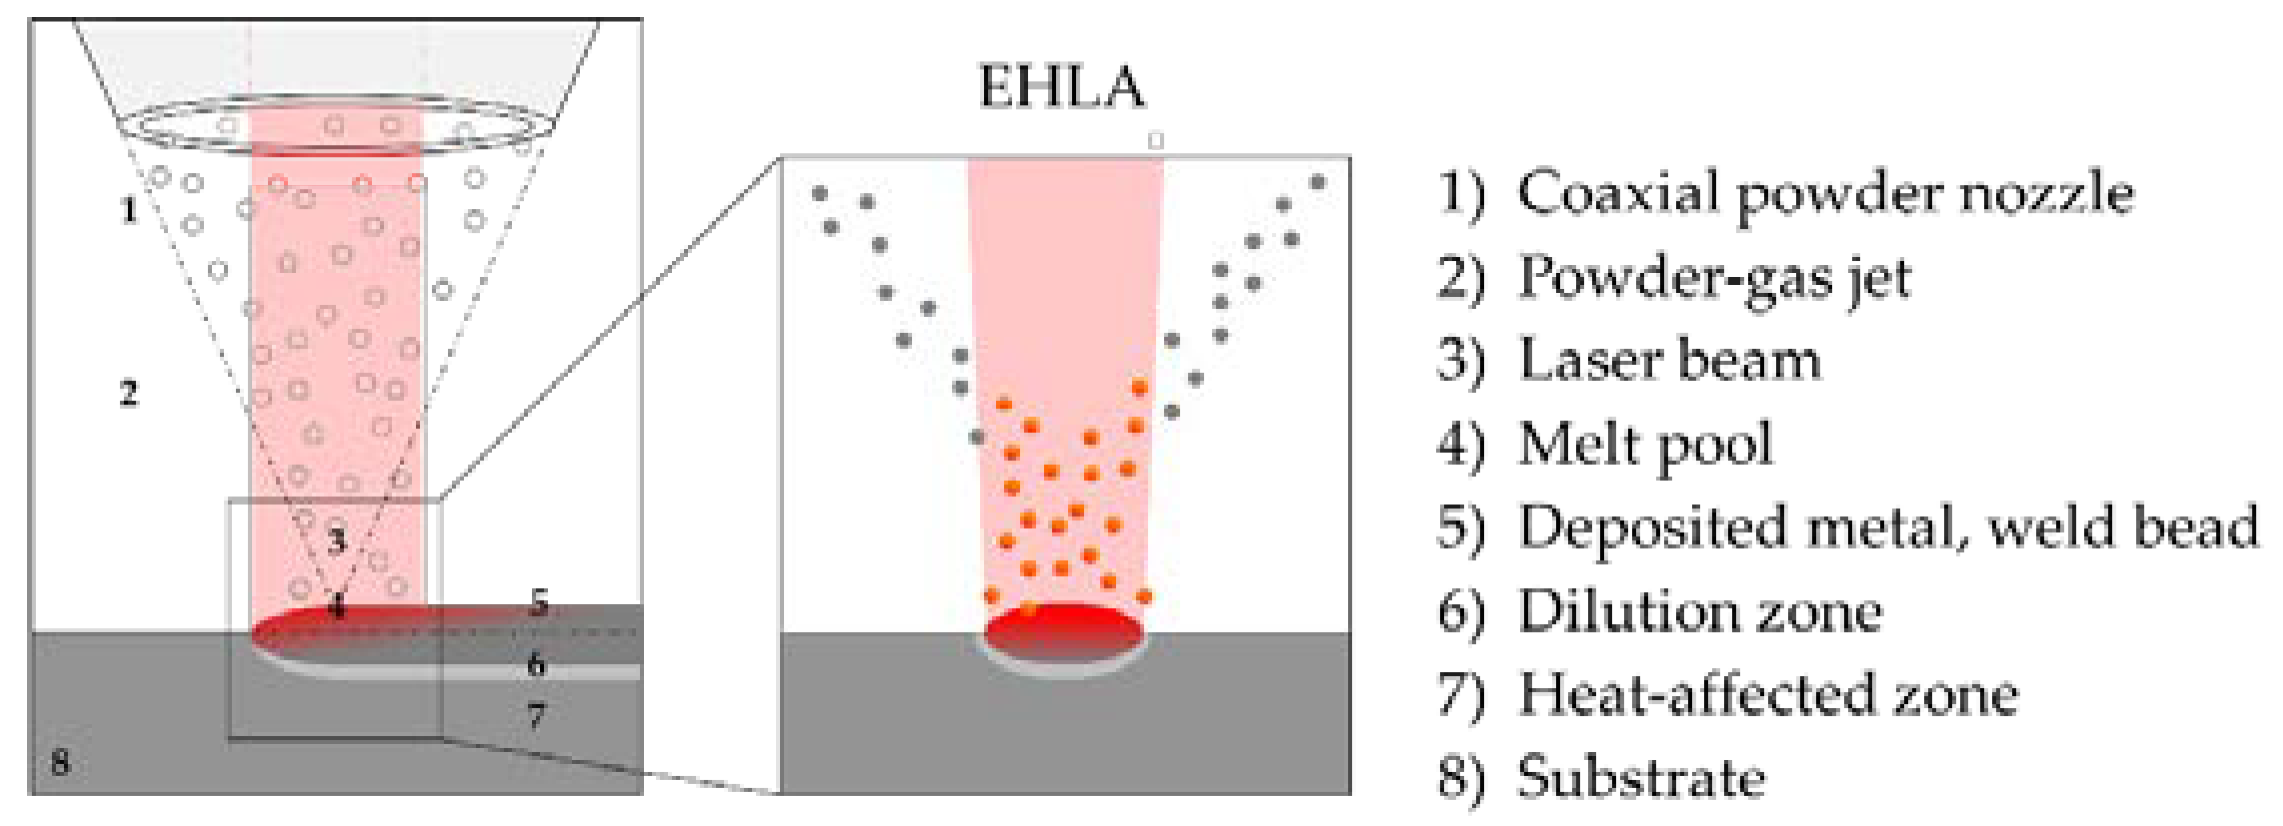
1.2. Process Control in Extreme High-Speed Laser Material Deposition
1.3. Modelling of the Powder-Gas Jet or Powder Particle Density Distribution
2. Materials and Methods
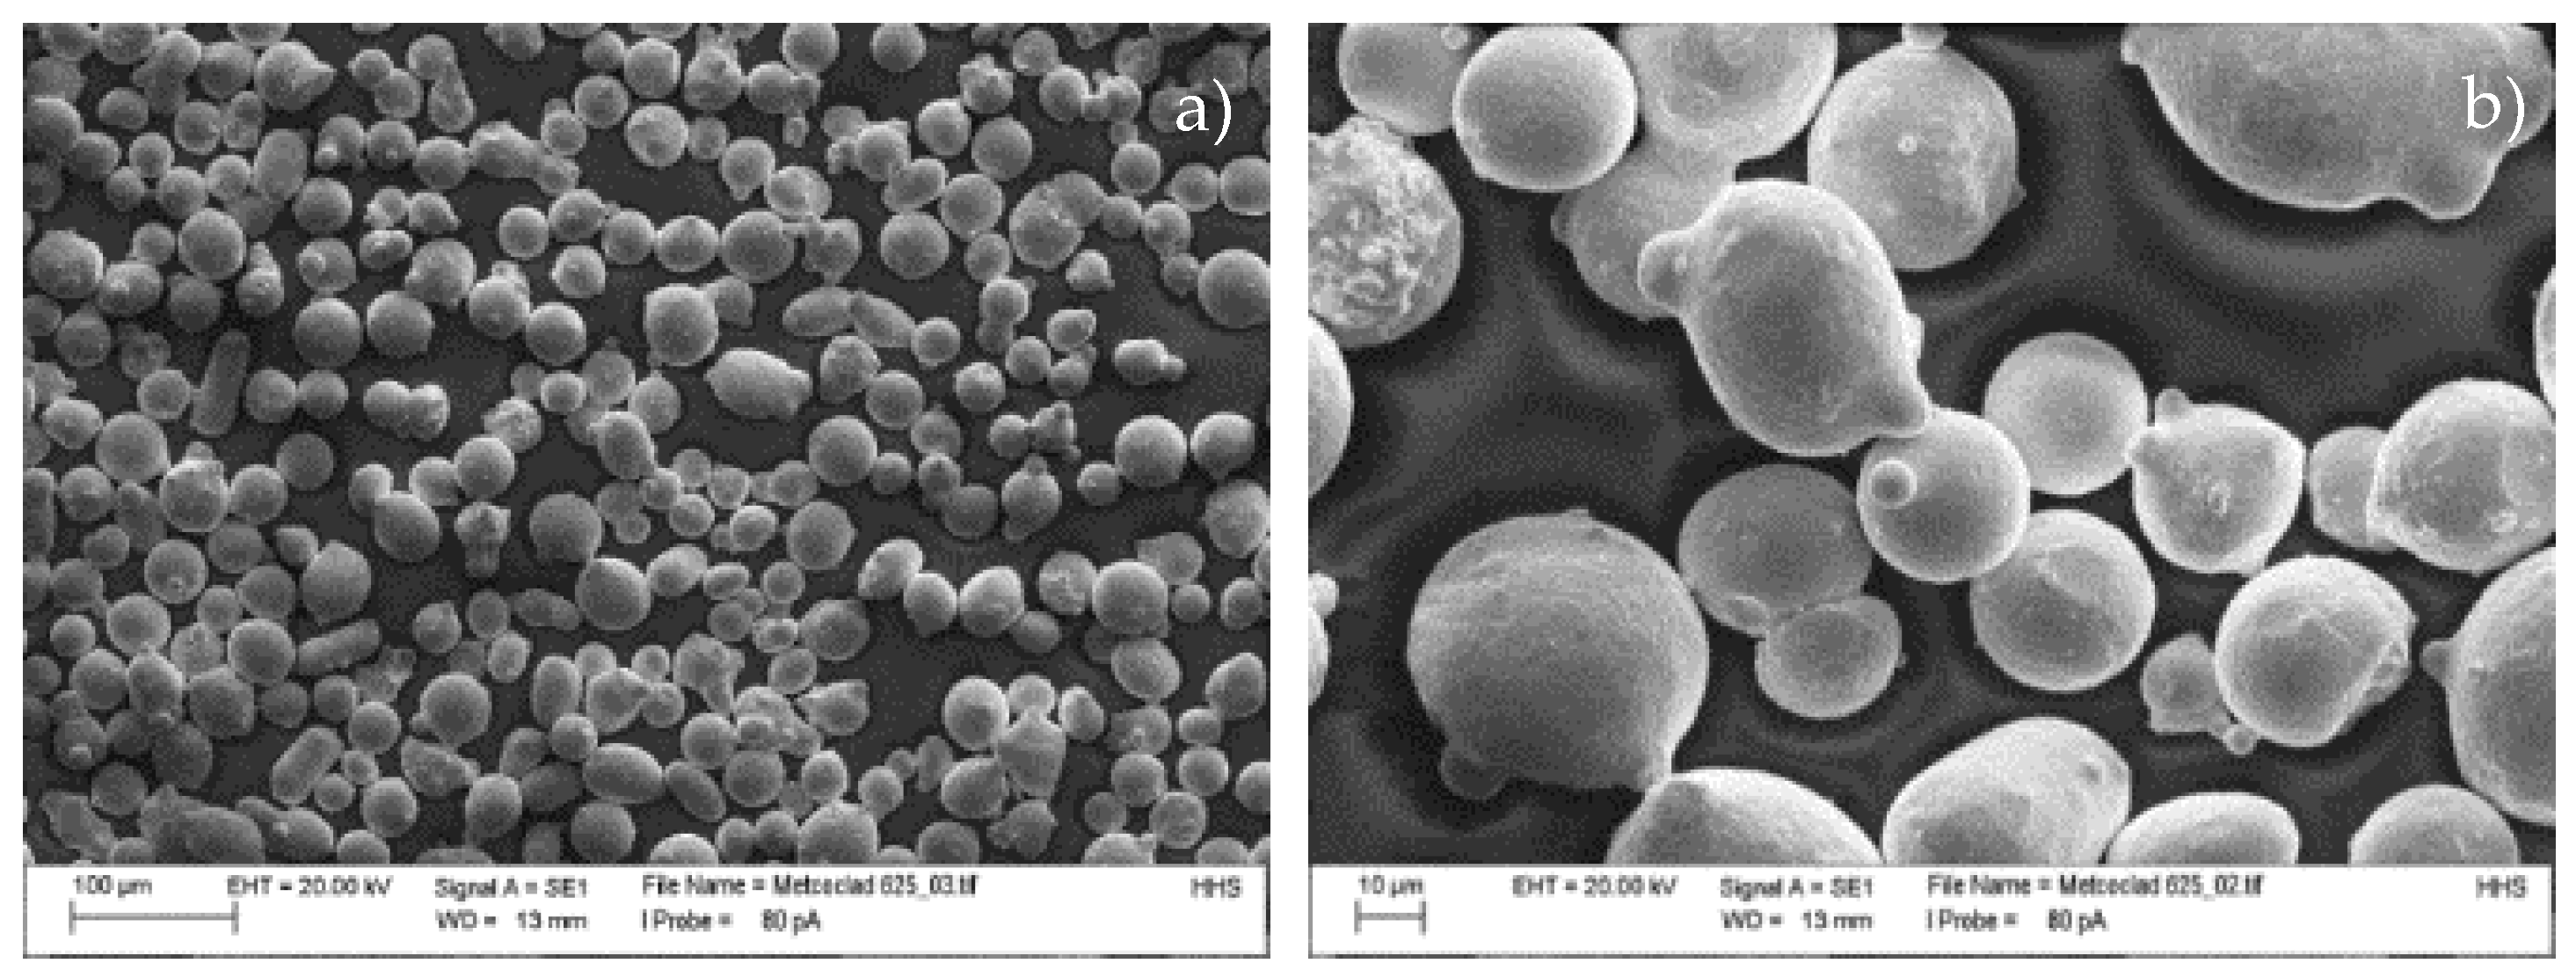
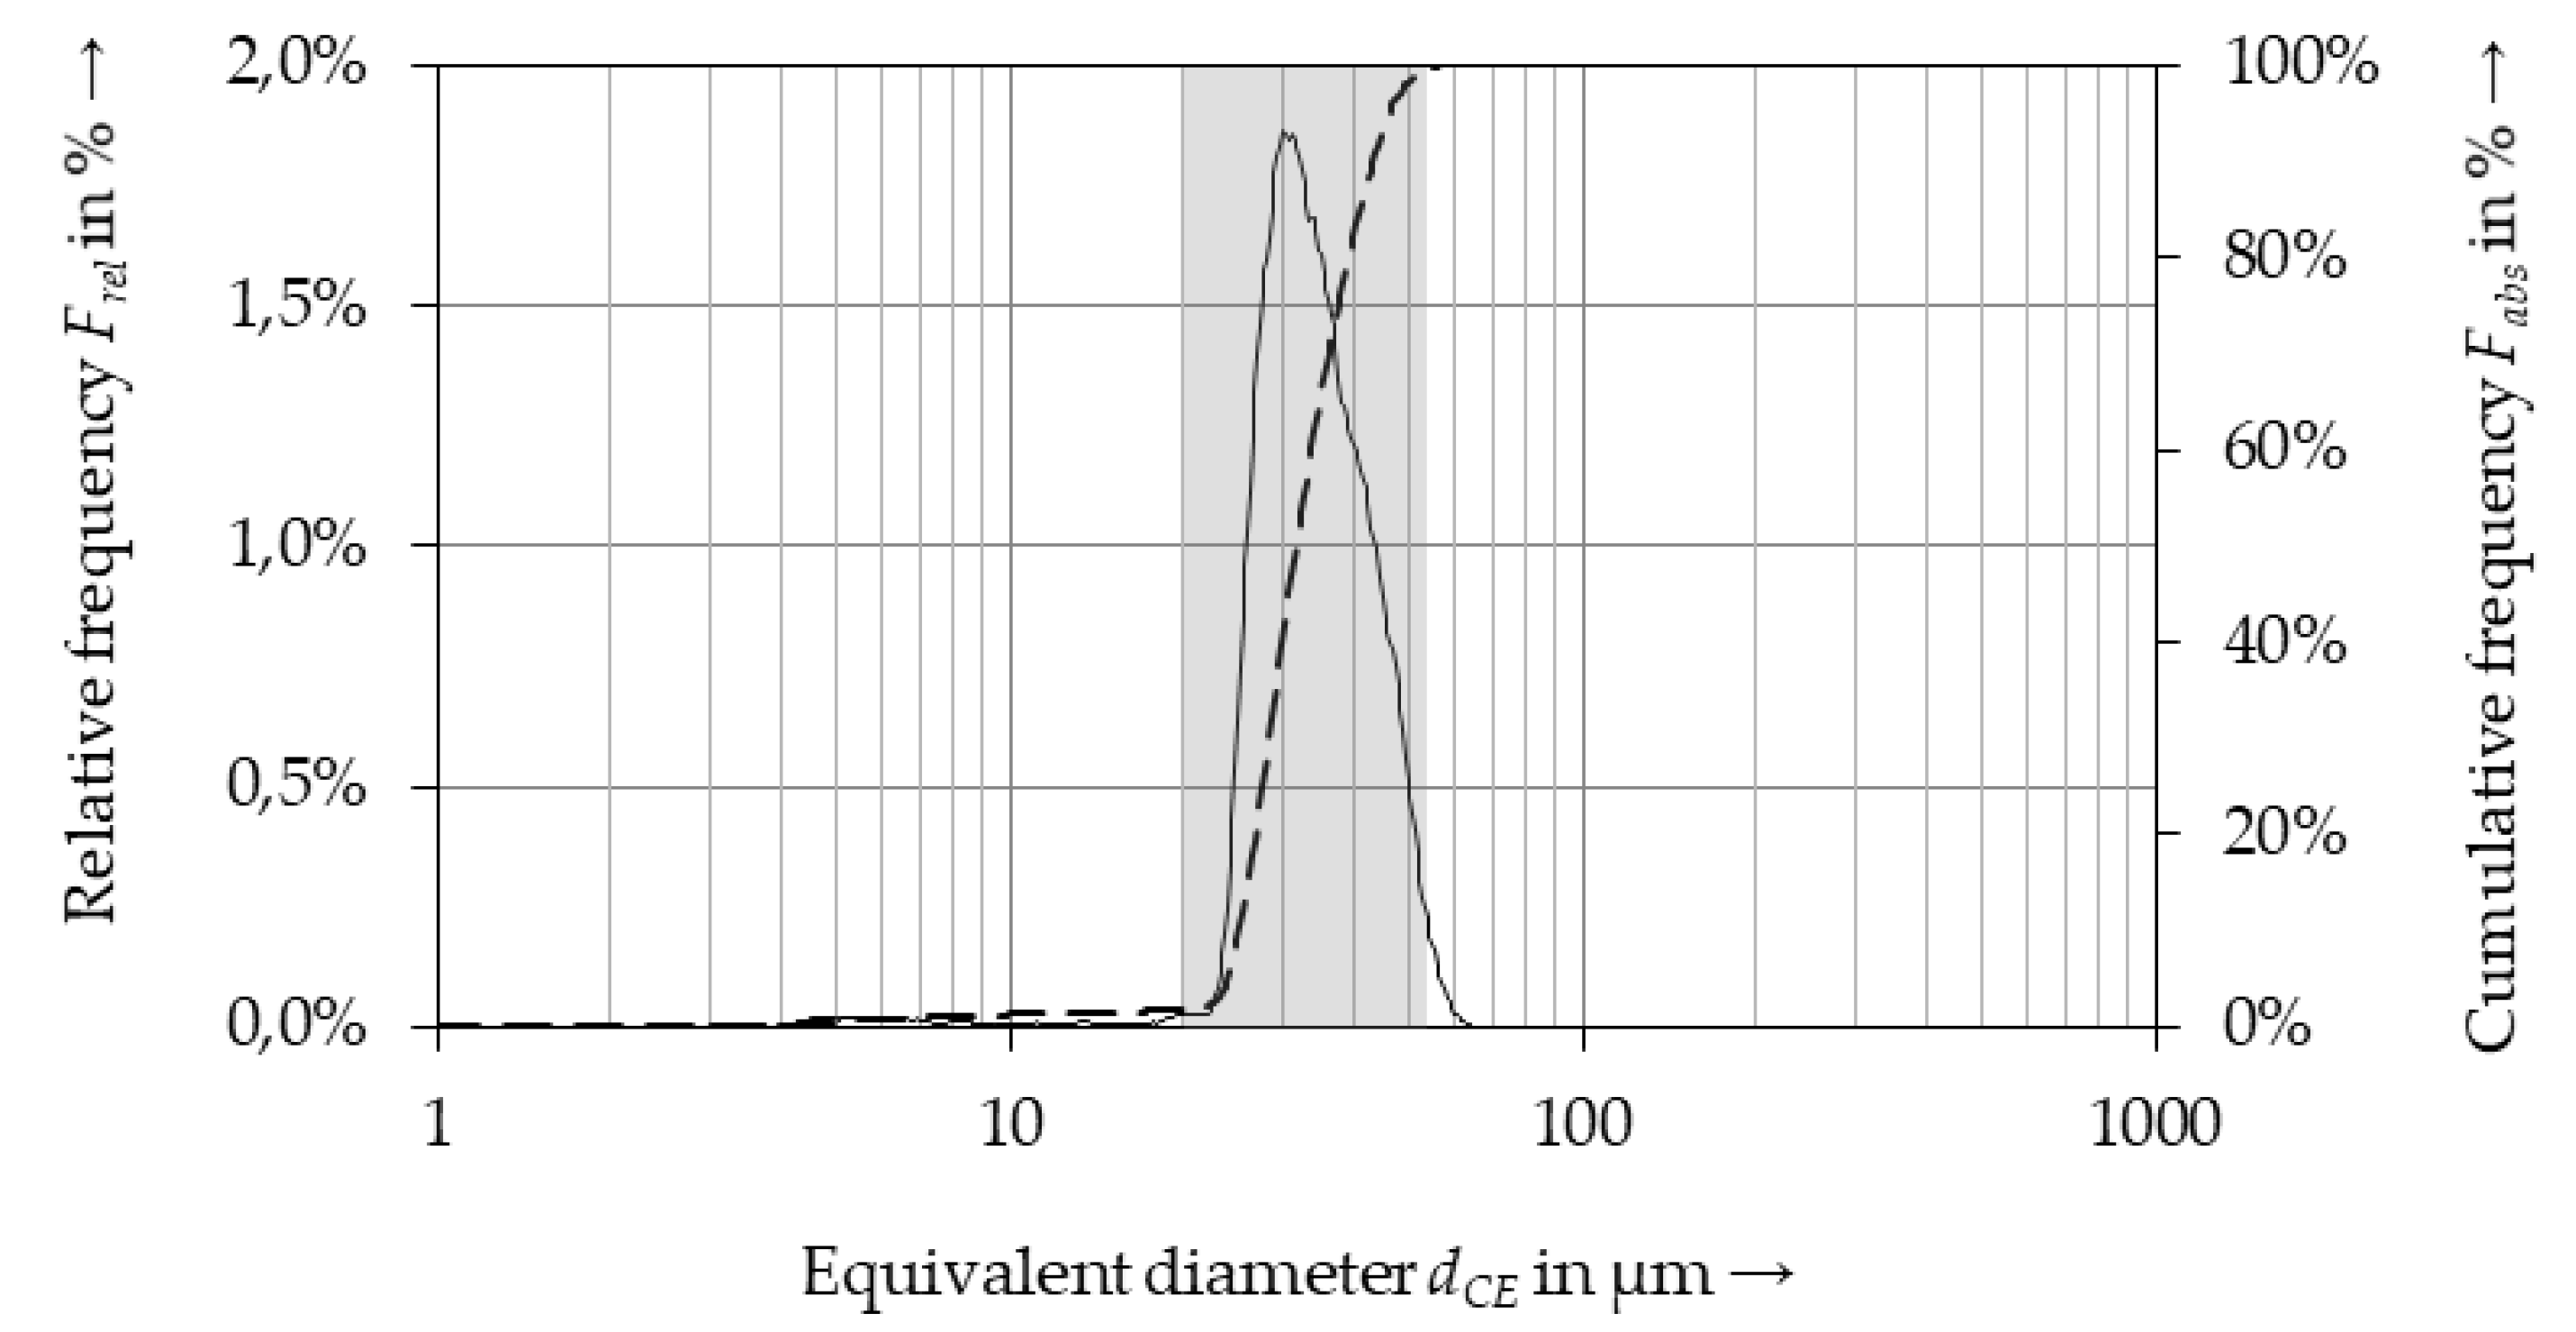
2.1. Powdered Additive
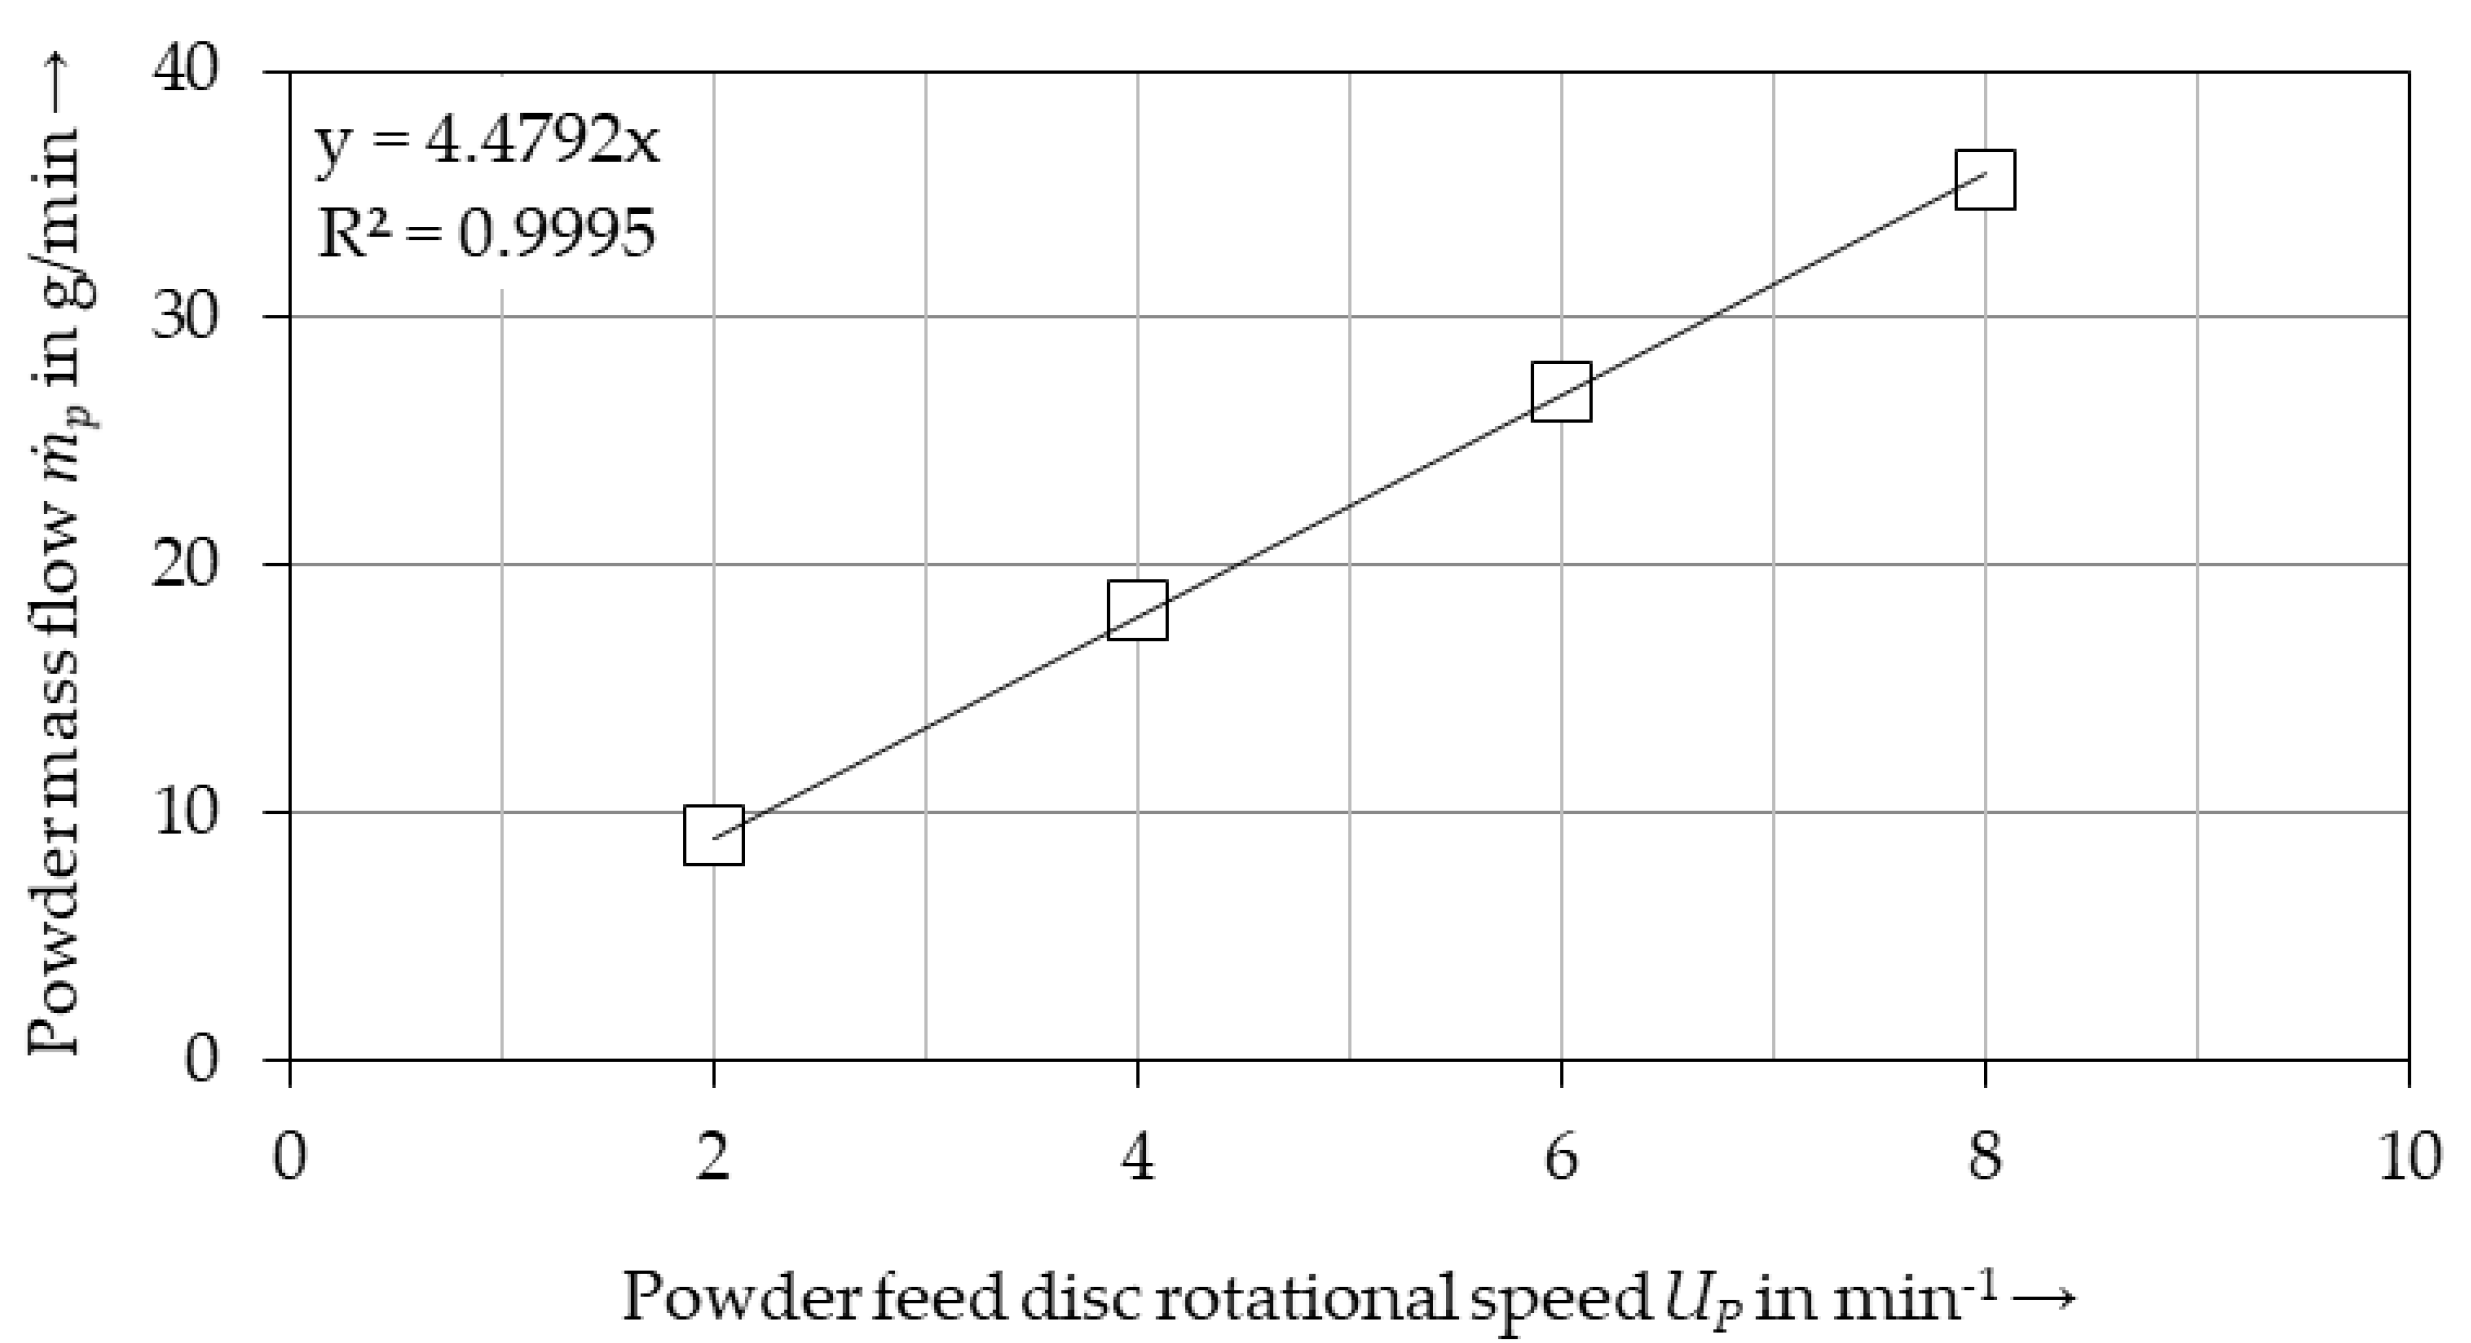
2.2. Powder Feed
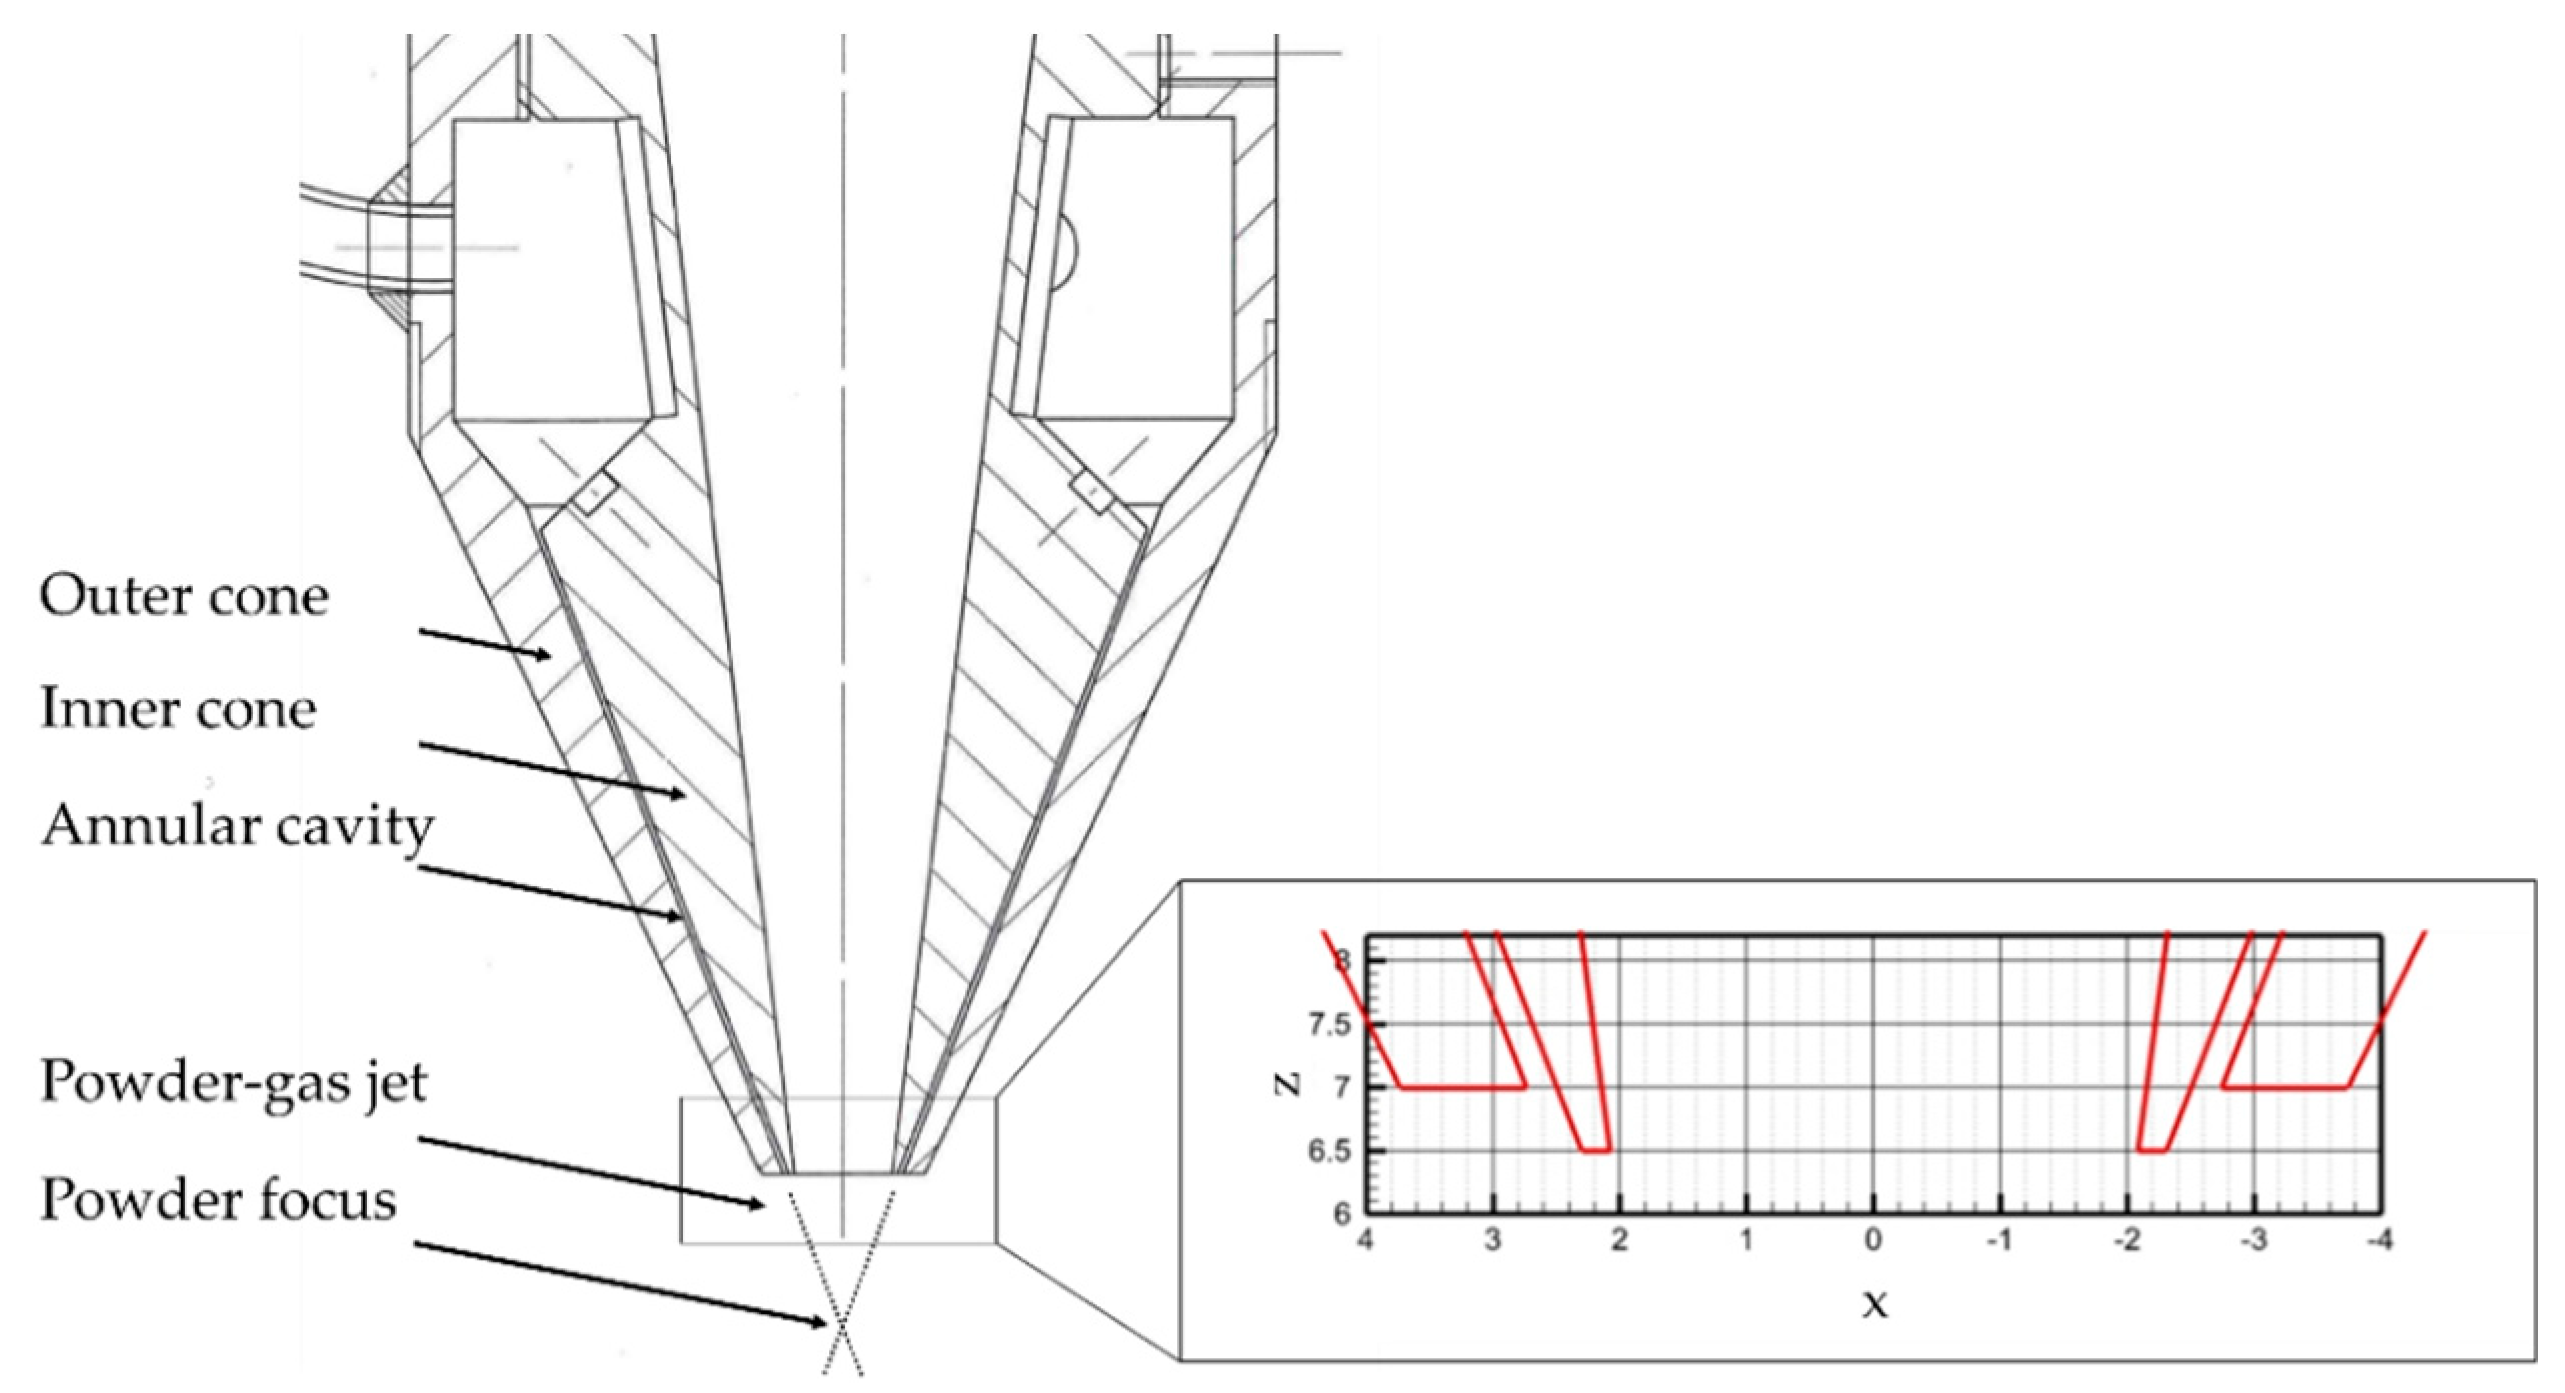
2.3. Powder Nozzle
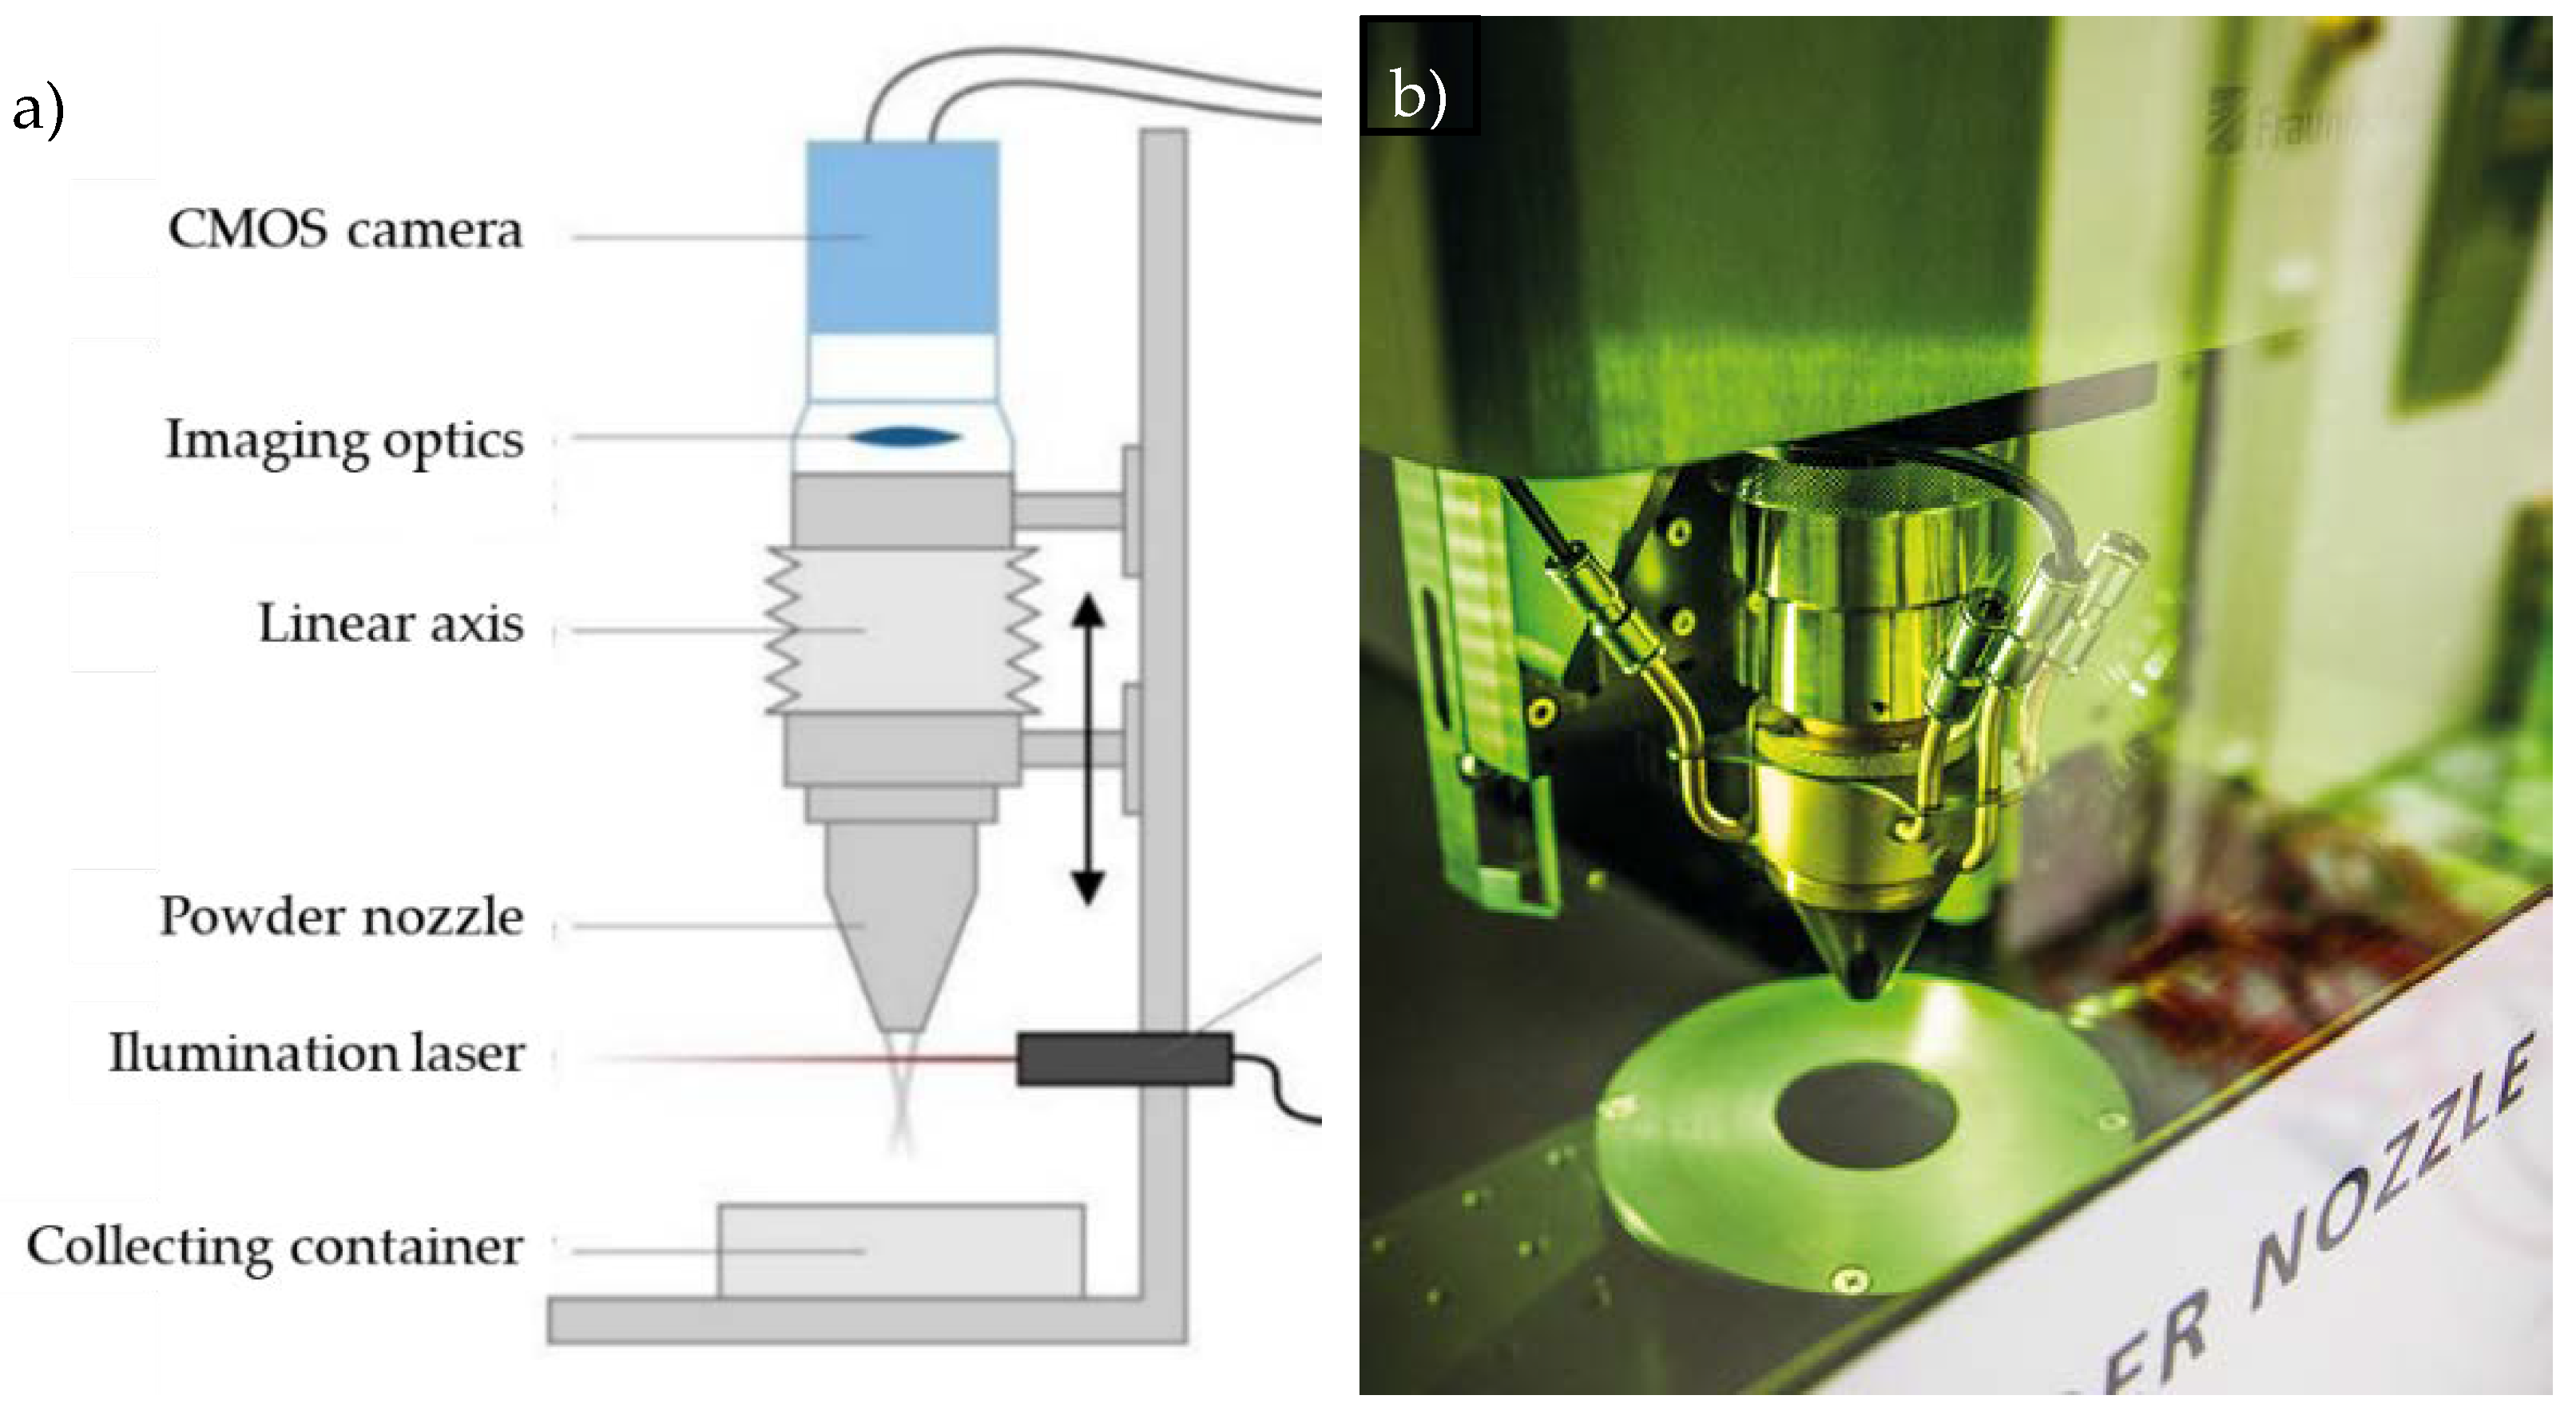
2.4. Powder-Gas Jet Ccharacterization
3. Result
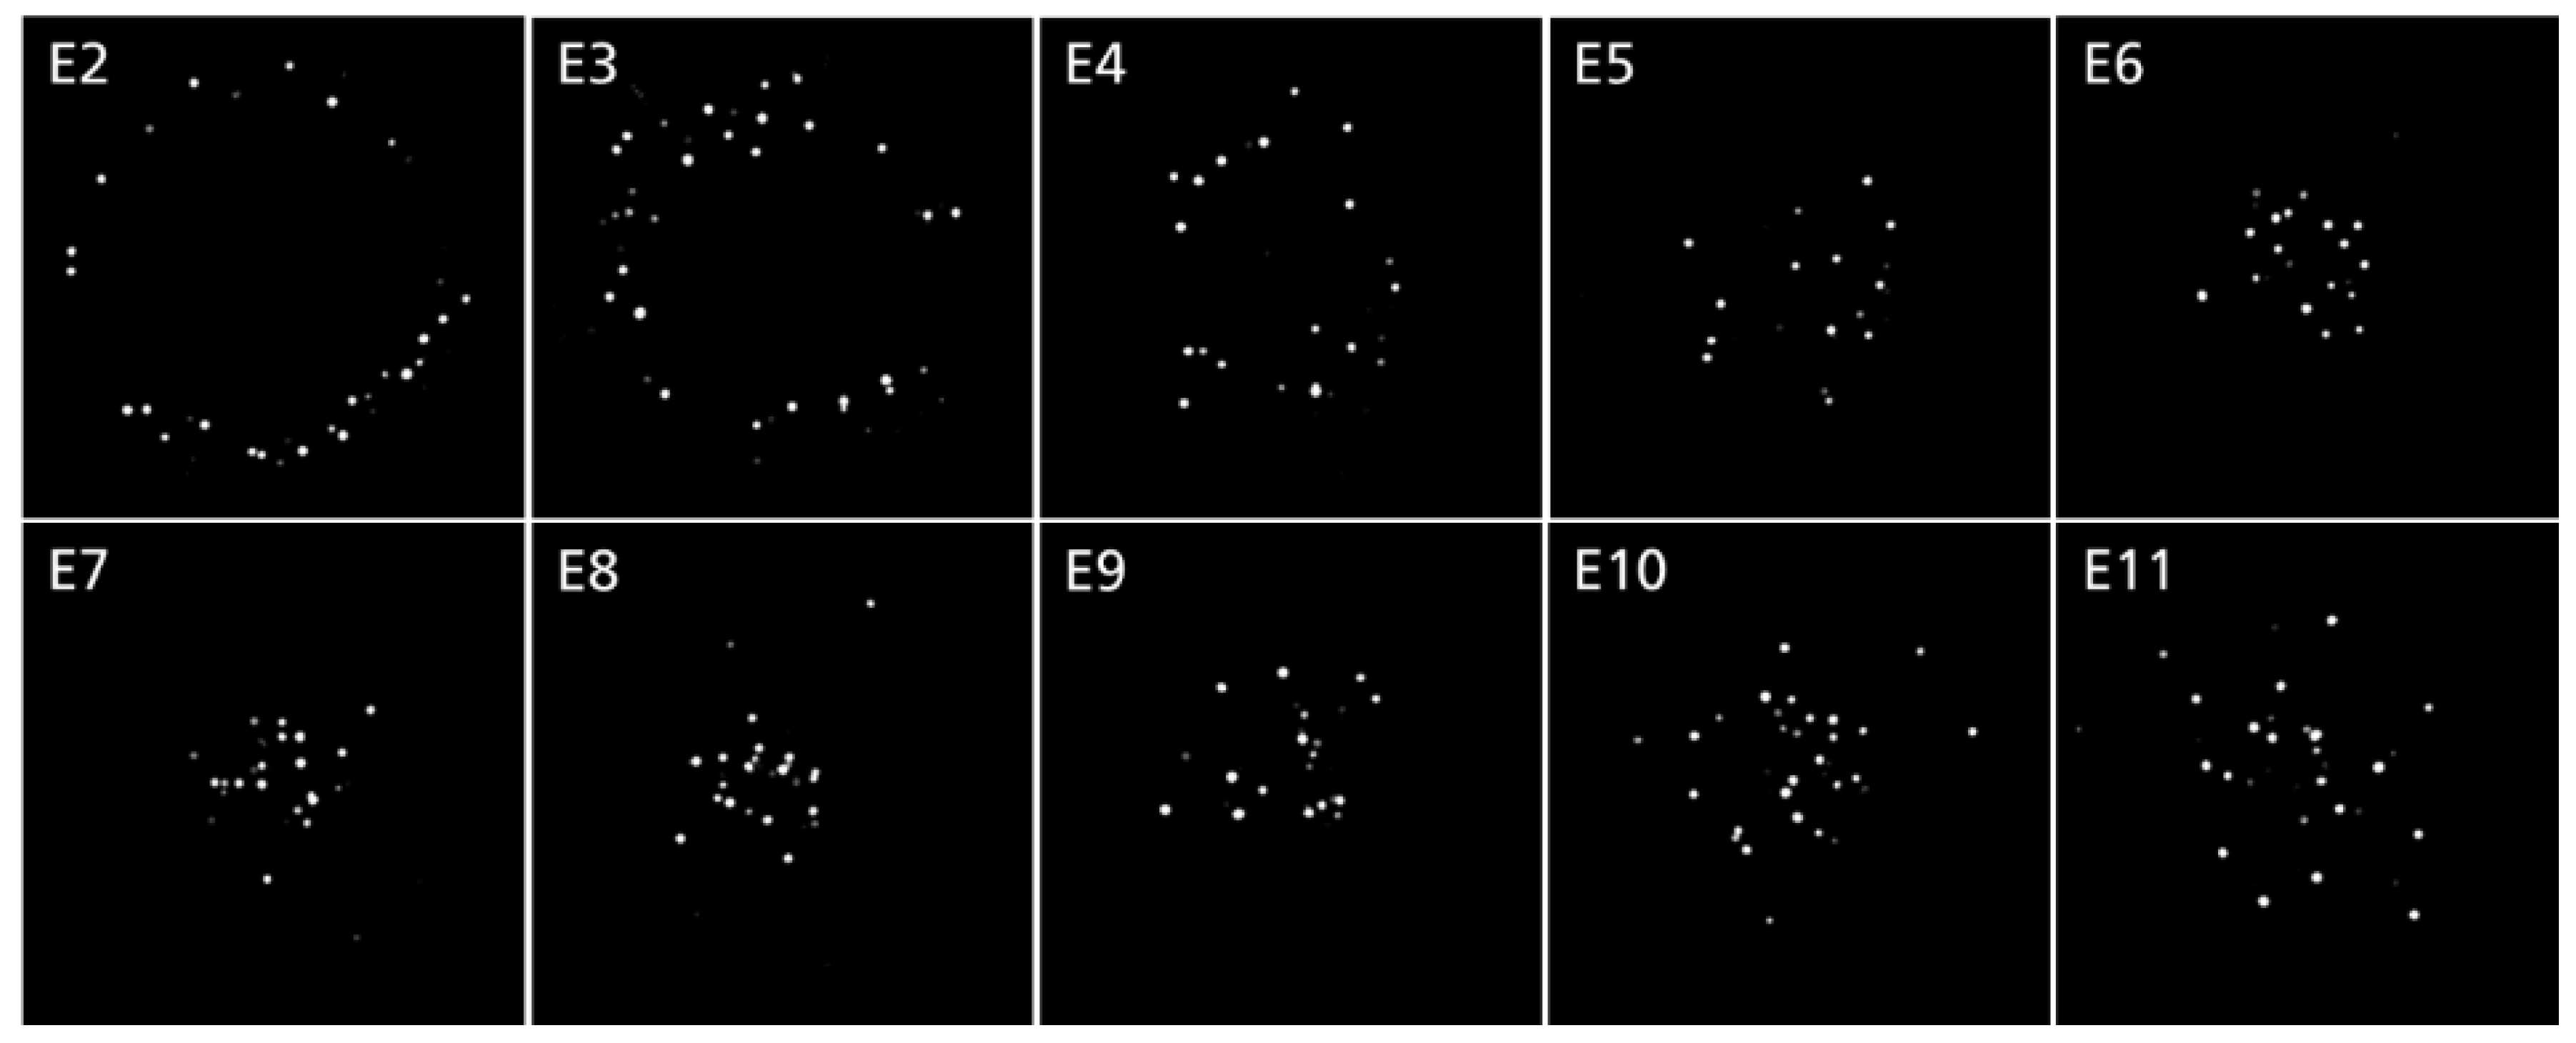
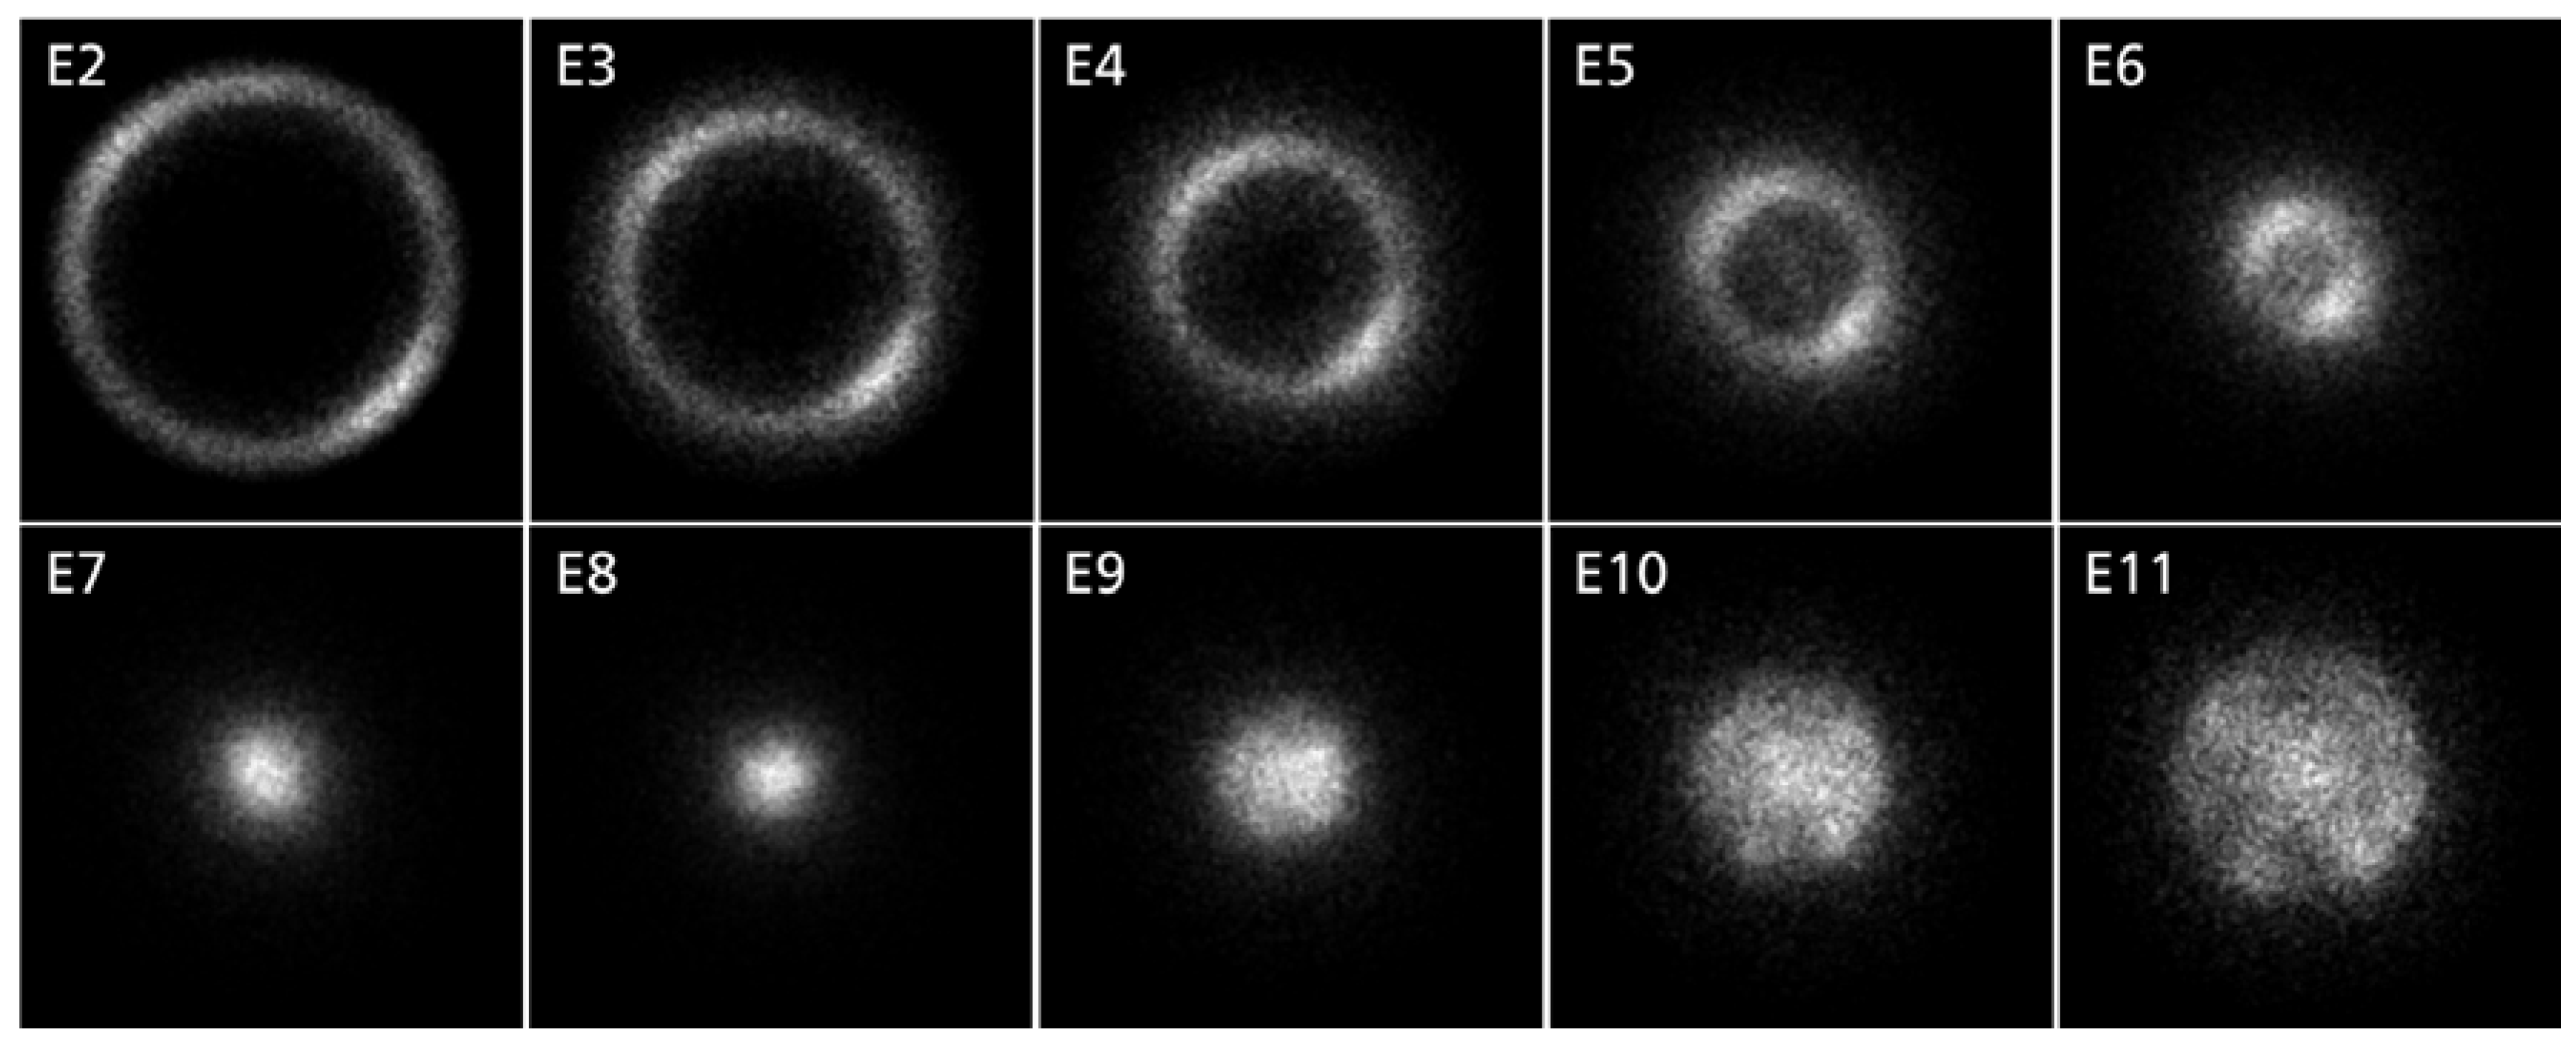
3.1. Powder Particle Count
- ▪
- The height of the illumination line or the measured level (here: 0.26 mm): The greater the height of the illumination line in the direction of z, the greater the number of simultaneously illuminated particles and, as a result, the higher the particle count within the measured level.
- ▪
- Exposure time: The longer the exposure time (here: 0.008 ms), the greater the motion blur caused by light trails, which means that fewer particles can be identified.
- ▪
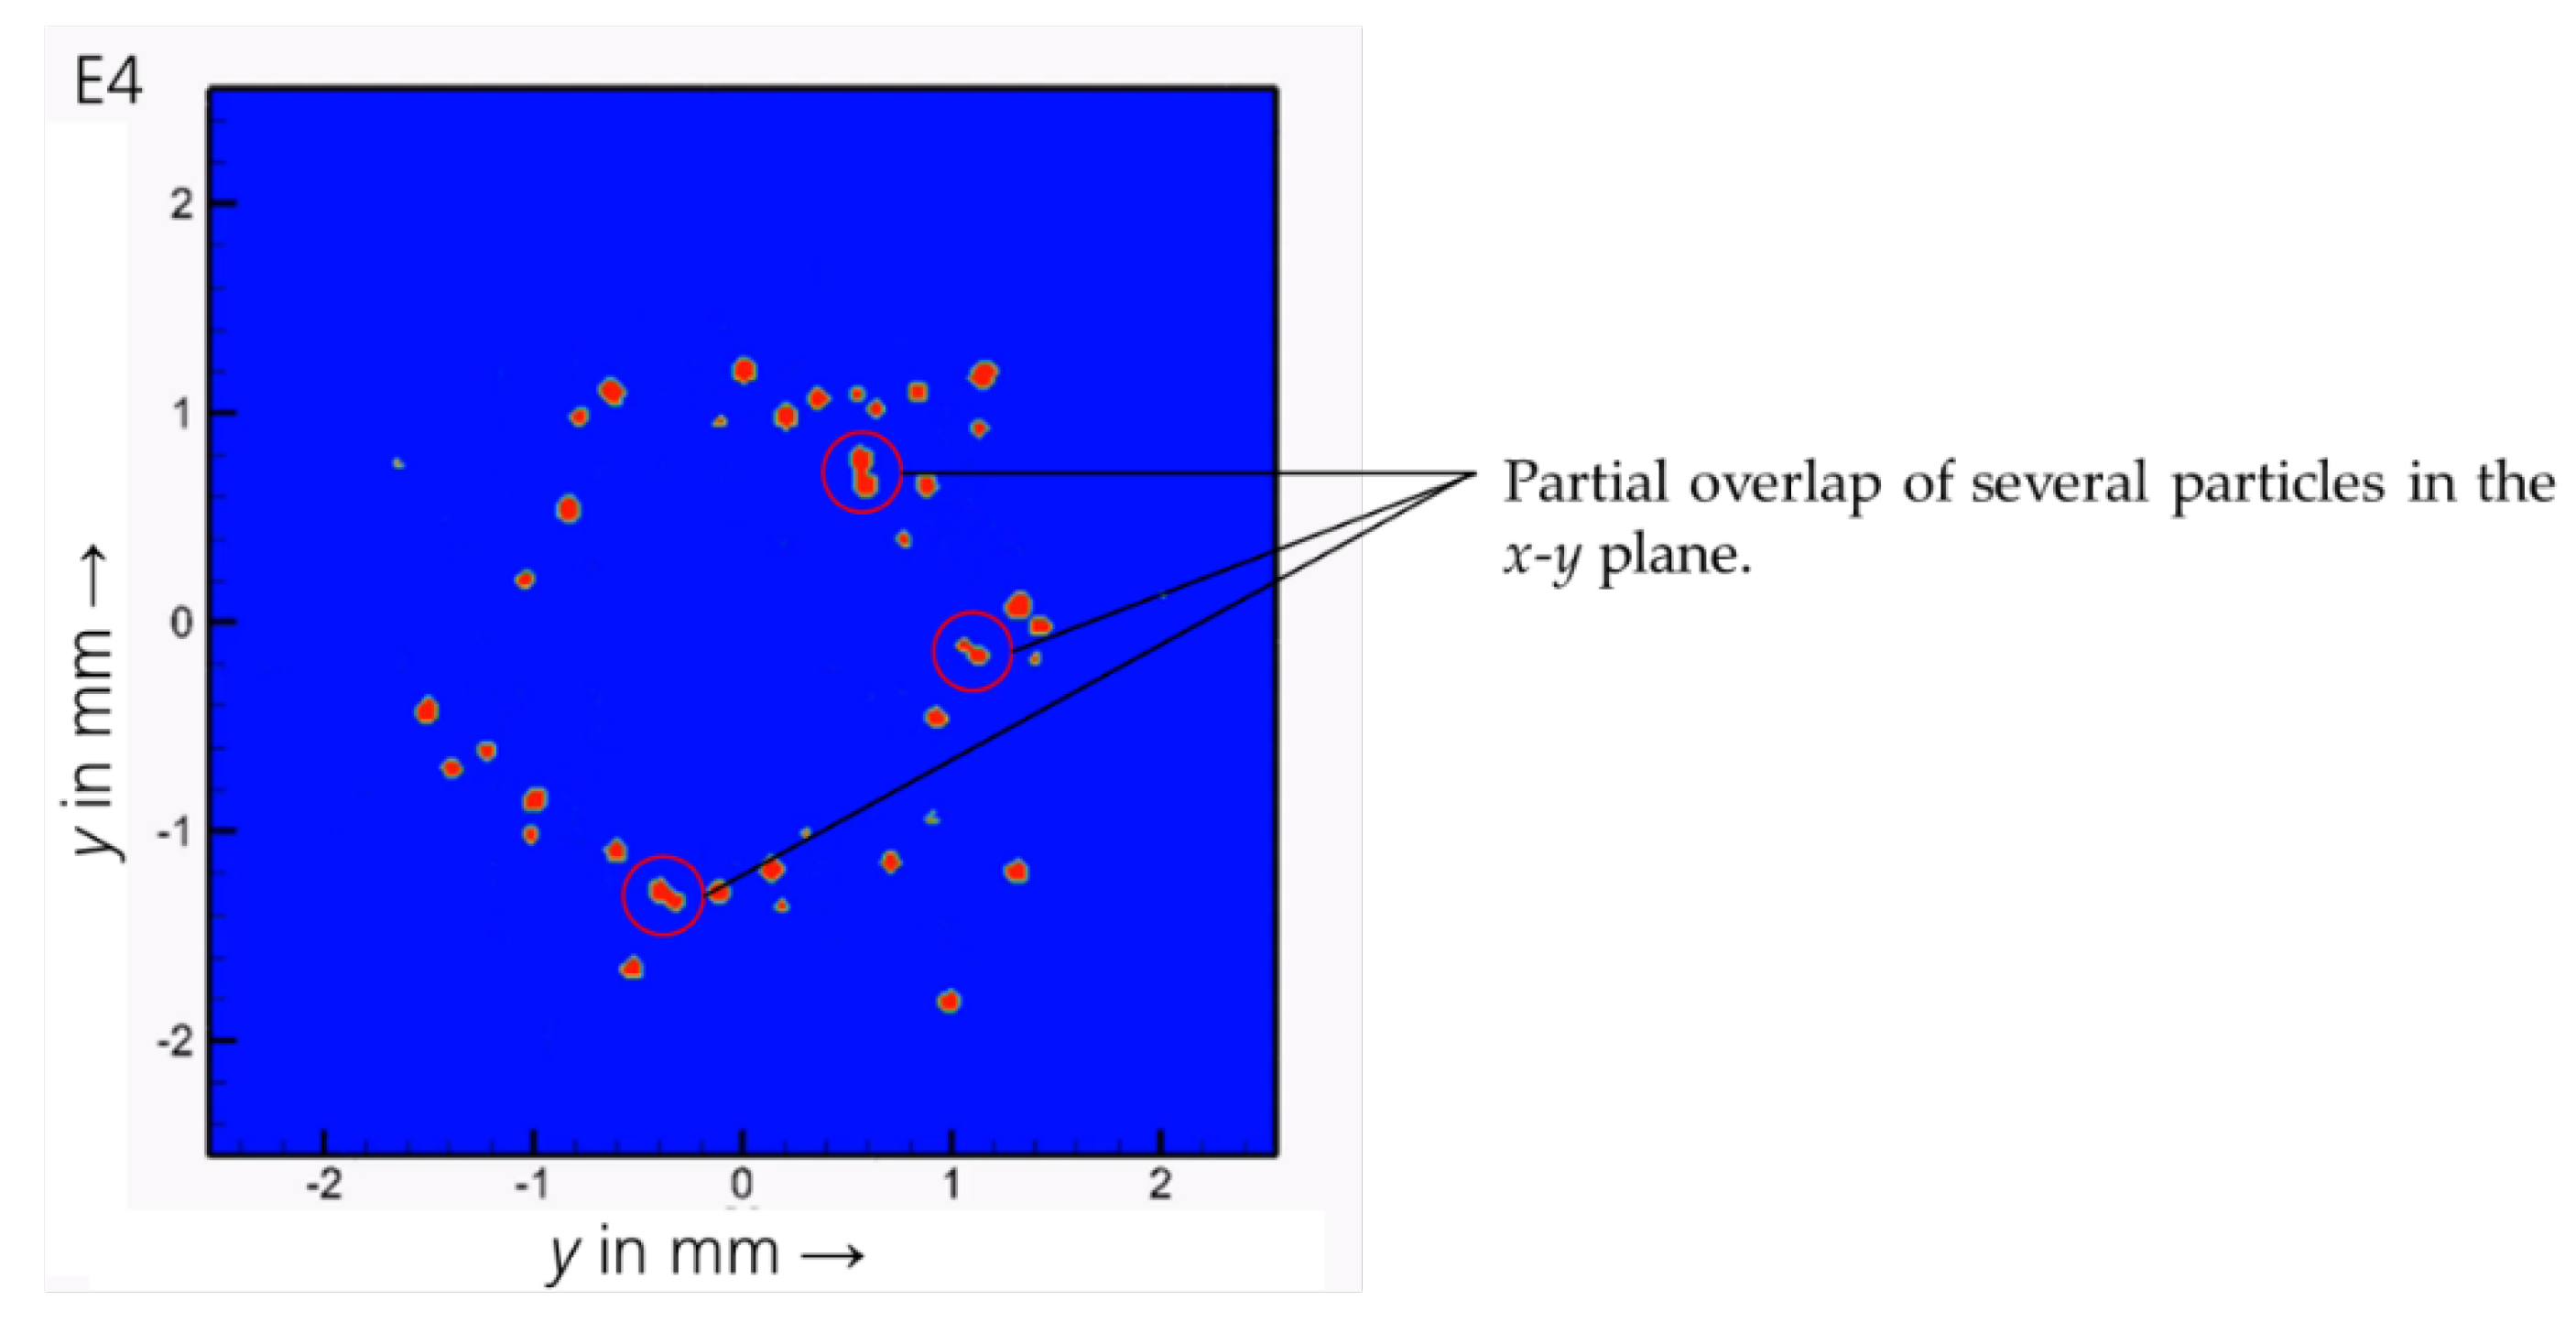
- Resolution of the camera chip: The higher the resolution of the camera chip (here: 19.83 µm/pixel), the more likely it is that non-contiguous areas can be identified as individual particles.
- ▪
- Distance of the measured level from the powder focus level: The shorter the distance between the measured level and the powder focus level, the greater the particle densities. The reason for this is that the particle count within the measured level decreases as the area of the powder-gas jet cross-section decreases.
- ▪
- Grain fraction: The smaller the grain fraction, the higher the particle count at the same powder mass flow rate due to the proportionality to 1/rp3, and the fewer the particles that can be identified individually.
- ▪
- Particle velocity: The lower the particle velocity, the greater the number of simultaneously illuminated particles and the higher the particle count.
- ▪
- Powder mass flow: The greater the powder mass flow, the higher the particle count in the measuring level at the same powder grain fraction.
3.2. Approximation of the Particle Velocity
3.3. Particle Propagation Model
3.4. Powder Particle Density Distribution
4. Conclusions and Outlook
- ▪
- The number and position of powder particles in the powder-gas flow can be determined quantitatively, level by level, with a measuring device based on the laser-light sectioning method.
- ▪
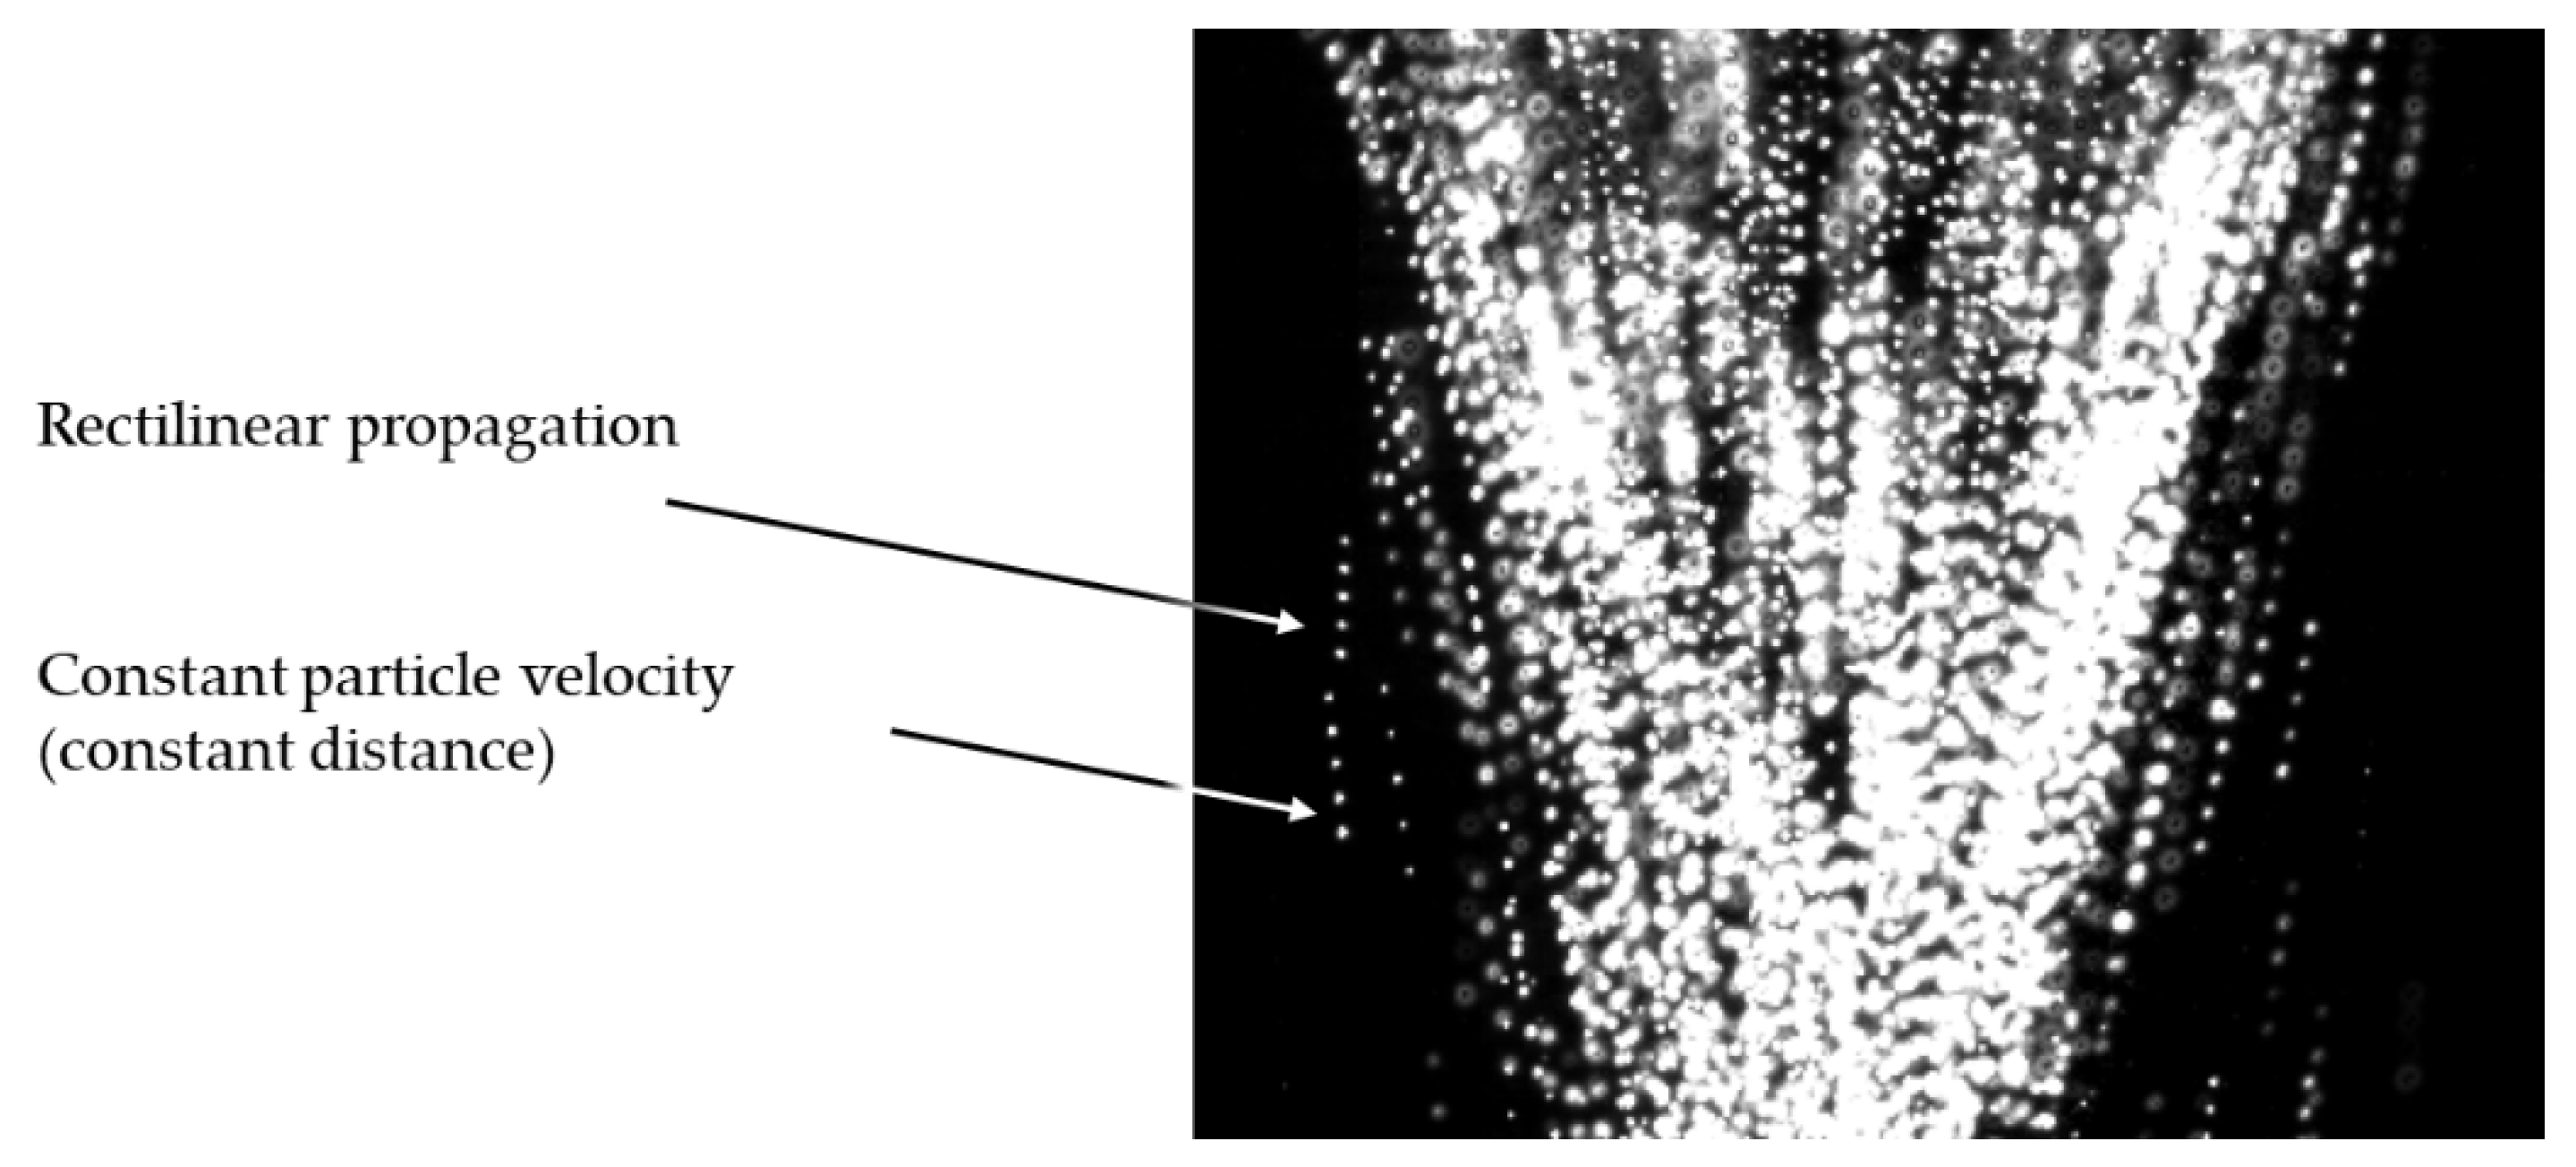
- Pictures of the powder-gas jet taken with a high-speed camera serve to show that the trajectories of the particles after they exit the nozzle outlet are rectilinear and travel at a constant velocity until they contact the substrate. This allows for an explicit representation of the particle trajectories and velocities in a statistical model.
- ▪
- The model theory-based description of the PDD presented in this paper is a key component of a comprehensive EHLA process model, as published in [1]. This serves to map the PDD of the powder-gas flow—and particularly the particle trajectories for different grain fractions—as well as the powder mass flows and carrier and inert gas settings to a theoretical model.
- ▪
- In a further step the laser radiation will be characterized experimentally and mapped to the mathematical model.
- ▪
- Based on this breakdown the interaction between the laser beam and the powder particles can be described. This enhances the understanding of the process-relevant influencing factors such as laser beam transmittance via the powder-gas jet, particle heating in the beam path, substrate heating and track formation.
- ▪
- The transmitted laser intensity distribution and mean particle temperature are used as boundary conditions for the governing equations of the mathematical model for the track formation.
- ▪
- This model will provide the means to assess the EHLA process’s technological limits, for example, in terms of the achievable feed rate and track formation, and to push beyond these boundaries to effectively extend this process’s range of potential manufacturing applications, particularly in surface engineering, but also in repair and additive manufacturing.
Author Contributions
Funding
Acknowledgments
Conflicts of Interest
References
- Schopphoven, T. Experimentelle und Modelltheoretische Untersuchungen zum Extremen Hochgeschwindigkeits-Laserauftragschweißen. Ph.D. Thesis, RWTH Aachen University, Aachen, Germany, 2020. [Google Scholar]
- Pirch, N.; Linnenbrink, S.; Gasser, A.; Wissenbach, K.; Poprawe, R. Analysis of track formation during laser metal deposition. J. Laser Appl. 2017, 29, 022506. [Google Scholar] [CrossRef]
- Pirch, N.; Niessen, M.; Linnenbrink, S.; Schopphoven, T.; Gasser, A.; Poprawe, R.; Schulz, W. Temperature field and residual stress distribution for laser metal deposition. J. Laser Appl. 2018, 30, 032503. [Google Scholar] [CrossRef]
- Poprawe, R.; Hinke, C.; Meiners, W.; Eibl, F.; Zarei, O.; Voshage, M.; Willenborg, E.; Ziegler, S.; Schleifenbaum, J.H.; Gasser, A.; et al. Digital photonic production along the lines of industry 4.0. In Laser Applications in Microelectronic and Optoelectronic Manufacturing (LAMOM) XXIII; International Society for Optics and Photonics: San Francisco, CA, USA, February 2018; Volume 10519, p. 1051907. [Google Scholar]
- Schopphoven, T.; Gasser, A.; Backes, G. EHLA: Extreme High-Speed Laser Material Deposition: Economical and effective protection against corrosion and wear. Laser Technik J. 2017, 14, 26–29. [Google Scholar] [CrossRef]
- Schopphoven, T.; Gasser, A.; Wissenbach, K.; Poprawe, R. Investigations on ultra-high-speed laser material deposition as alternative for hard chrome plating and thermal spraying. J. Laser Appl. 2016, 28, 022501. [Google Scholar] [CrossRef]
- Fraunhofer Gesellschaft zur Forderung der Angewandten Forschung. Extremes Hochgeschwindigkeitslaserauftragschweißverfahren. DE Patent DE 10 2011 100 456 B4, 4 May 2011.
- Lin, J. Temperature analysis of the powder streams in coaxial laser cladding. Opt. Laser Technol. 1999, 31, 565–570. [Google Scholar] [CrossRef]
- Liu, C.Y.; Lin, J. Thermal processes of a powder particle in coaxial laser cladding. Opt. Laser Technol. 2003, 35, 81–86. [Google Scholar] [CrossRef]
- Ibarra-Medina, J.; Pinkerton, A.J. A CFD model of the laser, coaxial powder stream and substrate interaction in laser cladding. Phys. Procedia 2010, 5, 337–346. [Google Scholar] [CrossRef]
- Ibarra-Medina, J.; Pinkerton, A.J. Numerical investigation of powder heating in coaxial laser metal deposition. Surf. Eng. 2011, 27, 754–761. [Google Scholar] [CrossRef]
- Zhang, K.; Zhang, X.M.; Liu, W.J. Influences of Processing Parameters on Dilution Ratio of Laser Cladding Layer during Laser Metal Deposition Shaping. Adv. Mater. Res. 2012, 549, 785–789. [Google Scholar] [CrossRef]
- Gasser, A.; Meiners, W.; Weisheit, A.; Willenborg, E.; Stollenwerk, J.; Wissenbach, K. Tailor-made surfaces and components—The use of laser radiation in surface technology and rapid manufacturing—Part 1. Laser-Tech. J. 2010, 7, 47–53. [Google Scholar] [CrossRef]
- Beyer, E.; Wissenbach, K. Oberflächenbehandlung mit Laserstrahlung; Springer-Verlag: Berlin, Germany, 1998; Volume 7, pp. 243–251. [Google Scholar] [CrossRef]
- Partes, K.; Seefeld, T.; Sepold, G.; Vollertsen, F. Increased efficiency in laser cladding by optimization of beam intensity and travel speed. In Workshop on Laser Applications in Europe; International Society for Optics and Photonics: Dresden, Germany, December 2005; Volume 6157, p. 615700. [Google Scholar]
- Partes, K. High-Speed Coating with the Laser Beam. Ph.D. Thesis, Bremer Institut für Angewandte Strahltechnik, Bremen, Germany, 2008. [Google Scholar]
- Peyre, P.; Aubry, P.; Fabbro, R.; Neveu, R.; Longuet, A. Analytical and numerical modelling of the direct metal deposition laser process. J. Phys. D Appl. Phys. 2008, 41, 025403. [Google Scholar] [CrossRef]
- Liu, H.; He, X.; Yu, G.; Wang, Z.; Li, S.; Zheng, C.; Ning, W. Numerical simulation of powder transport behavior in laser cladding with coaxial powder feeding. Sci. China Phys. Mech. Astron. 2015, 58, 104701. [Google Scholar] [CrossRef]
- Kussin, J. Experimental Studies on Particle Movement and Turbulence Modification in a Horizontal Channel with Different Wall Roughness. Ph.D. Thesis, Martin-Luther-Universität Halle-Wittenberg, Halle, Germany, 2004. [Google Scholar]
- Kovalev, O.B.; Zaitsev, A.V.; Novichenko, D.; Smurov, I. Theoretical and experimental investigation of gas flows, powder transport and heating in coaxial laser direct metal deposition (DMD) process. J. Therm. Spray Technol. 2011, 20, 465–478. [Google Scholar] [CrossRef]
- Pan, H.; Liou, F. Numerical simulation of metallic powder flow in a coaxial nozzle for the laser aided deposition process. J. Mater. Process. Technol. 2005, 168, 230–244. [Google Scholar] [CrossRef]
- Pan, H.; Sparks, T.; Thakar, Y.D.; Liou, F. The investigation of gravity-driven metal powder flow in coaxial nozzle for laser-aided direct metal deposition process. J. Manuf. Sci. Eng. 2006, 128, 541–553. [Google Scholar] [CrossRef]
- Elghobashi, S. On predicting particle-laden turbulent flows. Appl. Sci. Res. 1994, 52, 309–329. [Google Scholar] [CrossRef]
- Wibel, W. Studies on Laminar, Transitional and Turbulent Flow in Rectangular Microchannels. Ph.D. Thesis, Technische Universität Dortmund, Dortmund, Germany, 2009. [Google Scholar]
- Kravtsov, M.V. Resistance to the free steady-state motion of a sphere in a viscous medium. J. Eng. Phys. Thermophys. 1968, 15, 833–838. [Google Scholar]
- Li, H.P.; Chen, X. Three-dimensional modeling of the turbulent plasma jet impinging upon a flat plate and with transverse particle and carrier-gas injection. Plasma Chem. Plasma Process. 2002, 22, 27–58. [Google Scholar] [CrossRef]
- Haider, A.; Levenspiel, O. Drag coefficient and terminal velocity of spherical and nonspherical particles. Powder Technol. 1989, 58, 63–70. [Google Scholar] [CrossRef]
- Gerold, J. Experimental and Numerical Investigation of Gas Free Jets. Ph.D. Thesis, Universität der Bundeswehr München, Neubiberg, Germany, 2015. [Google Scholar]
- Richter, F.; Leder, A.; Dopheide, D.; Müller, H.; Strunck, V. (Eds.) Wechselwirkungen runder Düsenfreistrahlen mit ebenen Wänden. In Proceedings of the Fachtagung “Lasermethoden in der Strömungstechnik”, Braunschweig, Germany, 7–9 September 2006. [Google Scholar]
- Rajaratnam, N. Turbulent Jets; Elsevier: Amsterdam, The Netherlands, 1976; Volume 5. [Google Scholar]
- Wen, S.Y.; Shin, Y.C.; Murthy, J.Y.; Sojka, P.E. Modeling of coaxial powder flow for the laser direct deposition process. Int. J. Heat Mass Transf. 2009, 52, 5867–5877. [Google Scholar] [CrossRef]
- Lin, J. Numerical simulation of the focused powder streams in coaxial laser cladding. J. Mater. Process. Technol. 2000, 105, 17–23. [Google Scholar] [CrossRef]
- Tabernero, I.; Lamikiz, A.; Ukar, E.; de Lacalle, L.L.; Angulo, C.; Urbikain, G. Numerical simulation and experimental validation of powder flux distribution in coaxial laser cladding. J. Mater. Process. Technol. 2010, 210, 2125–2134. [Google Scholar] [CrossRef]
- Zhang, A.; Li, D.; Zhou, Z.; Zhu, G.; Lu, B. Numerical simulation of powder flow field on coaxial powder nozzle in laser metal direct manufacturing. Int. J. Adv. Manuf. Technol. 2010, 49, 853–859. [Google Scholar] [CrossRef]
- Kovalev, O.B.; Kovaleva, I.O.; Smurov, I.Y. Numerical investigation of gas-disperse jet flows created by coaxial nozzles during the laser direct material deposition. J. Mater. Process. Technol. 2017, 249, 118–127. [Google Scholar] [CrossRef]
- Yang, N. Concentration model based on movement model of powder flow in coaxial laser cladding. Opt. Laser Technol. 2009, 41, 94–98. [Google Scholar] [CrossRef]
- Qi, H.; Mazumder, J.; Ki, H. Numerical simulation of heat transfer and fluid flow in coaxial laser cladding process for direct metal deposition. J. Appl. Phys. 2006, 100, 024903. [Google Scholar] [CrossRef]
- Liu, S.; Zhang, Y.; Kovacevic, R. Numerical simulation and experimental study of powder flow distribution in high power direct diode laser cladding process. Lasers Manuf. Mater. Process. 2015, 2, 199–218. [Google Scholar] [CrossRef]
- Diniz Neto, O.O.; Alcalde, A.M.; Vilar, R. Interaction of a focused laser beam and a coaxial powder jet in laser surface processing. J. Laser Appl. 2007, 19, 84–88. [Google Scholar] [CrossRef]
- Pinkerton, A.J. An analytical model of beam attenuation and powder heating during coaxial laser direct metal deposition. J. Phys. D Appl. Phys. 2007, 40, 7323. [Google Scholar] [CrossRef]
- Pinkerton, A.J.; Li, L. Modelling powder concentration distribution from a coaxial deposition nozzle for laser-based rapid tooling. J. Manuf. Sci. Eng. 2004, 126, 33–41. [Google Scholar] [CrossRef]
- Pinkerton, A.J.; Li, L. A verified model of the behaviour of the axial powder stream concentration from a coaxial laser cladding nozzle. In Proceedings of ICALEO; Laser Institute of America: Orlando, FL, USA, 2002; Volume 2. [Google Scholar]
- Lin, J.; Hwang, B.C. Coaxial laser cladding on an inclined substrate. Opt. Laser Technol. 1999, 31, 571–578. [Google Scholar] [CrossRef]
- Liu, J.; Li, L.; Zhang, Y.; Xie, X. Attenuation of laser power of a focused Gaussian beam during interaction between a laser and powder in coaxial laser cladding. J. Phys. D Appl. Phys. 2005, 38, 1546. [Google Scholar] [CrossRef]
- Fraunhofer Gesellschaft zur Forderung der Angewandten Forschung. Method and Device for Detecting a Particle Density Distribution in the Jet of a Nozzle. DE Patent DE102011009345B3, 25 January 2011.


© 2020 by the authors. Licensee MDPI, Basel, Switzerland. This article is an open access article distributed under the terms and conditions of the Creative Commons Attribution (CC BY) license (http://creativecommons.org/licenses/by/4.0/).
Share and Cite
Schopphoven, T.; Pirch, N.; Mann, S.; Poprawe, R.; Häfner, C.L.; Schleifenbaum, J.H. Statistical/Numerical Model of the Powder-Gas Jet for Extreme High-Speed Laser Material Deposition. Coatings 2020, 10, 416. https://doi.org/10.3390/coatings10040416
Schopphoven T, Pirch N, Mann S, Poprawe R, Häfner CL, Schleifenbaum JH. Statistical/Numerical Model of the Powder-Gas Jet for Extreme High-Speed Laser Material Deposition. Coatings. 2020; 10(4):416. https://doi.org/10.3390/coatings10040416
Chicago/Turabian StyleSchopphoven, Thomas, Norbert Pirch, Stefan Mann, Reinhart Poprawe, Constantin Leon Häfner, and Johannes Henrich Schleifenbaum. 2020. "Statistical/Numerical Model of the Powder-Gas Jet for Extreme High-Speed Laser Material Deposition" Coatings 10, no. 4: 416. https://doi.org/10.3390/coatings10040416
APA StyleSchopphoven, T., Pirch, N., Mann, S., Poprawe, R., Häfner, C. L., & Schleifenbaum, J. H. (2020). Statistical/Numerical Model of the Powder-Gas Jet for Extreme High-Speed Laser Material Deposition. Coatings, 10(4), 416. https://doi.org/10.3390/coatings10040416