SERS Activity of Silver Nanosphere, Triangular Nanoplates, Hexagonal Nanoplates and Quasi-Spherical Nanoparticles: Effect of Shape and Morphology


Abstract
1. Introduction
2. Materials and Methods
2.1. Synthesis of Silver Nanoparticles
2.2. Characterization of AgNPs
2.3. SERS Substrate Preparation
2.4. SERS—Raman Setup
3. Results and Discussion
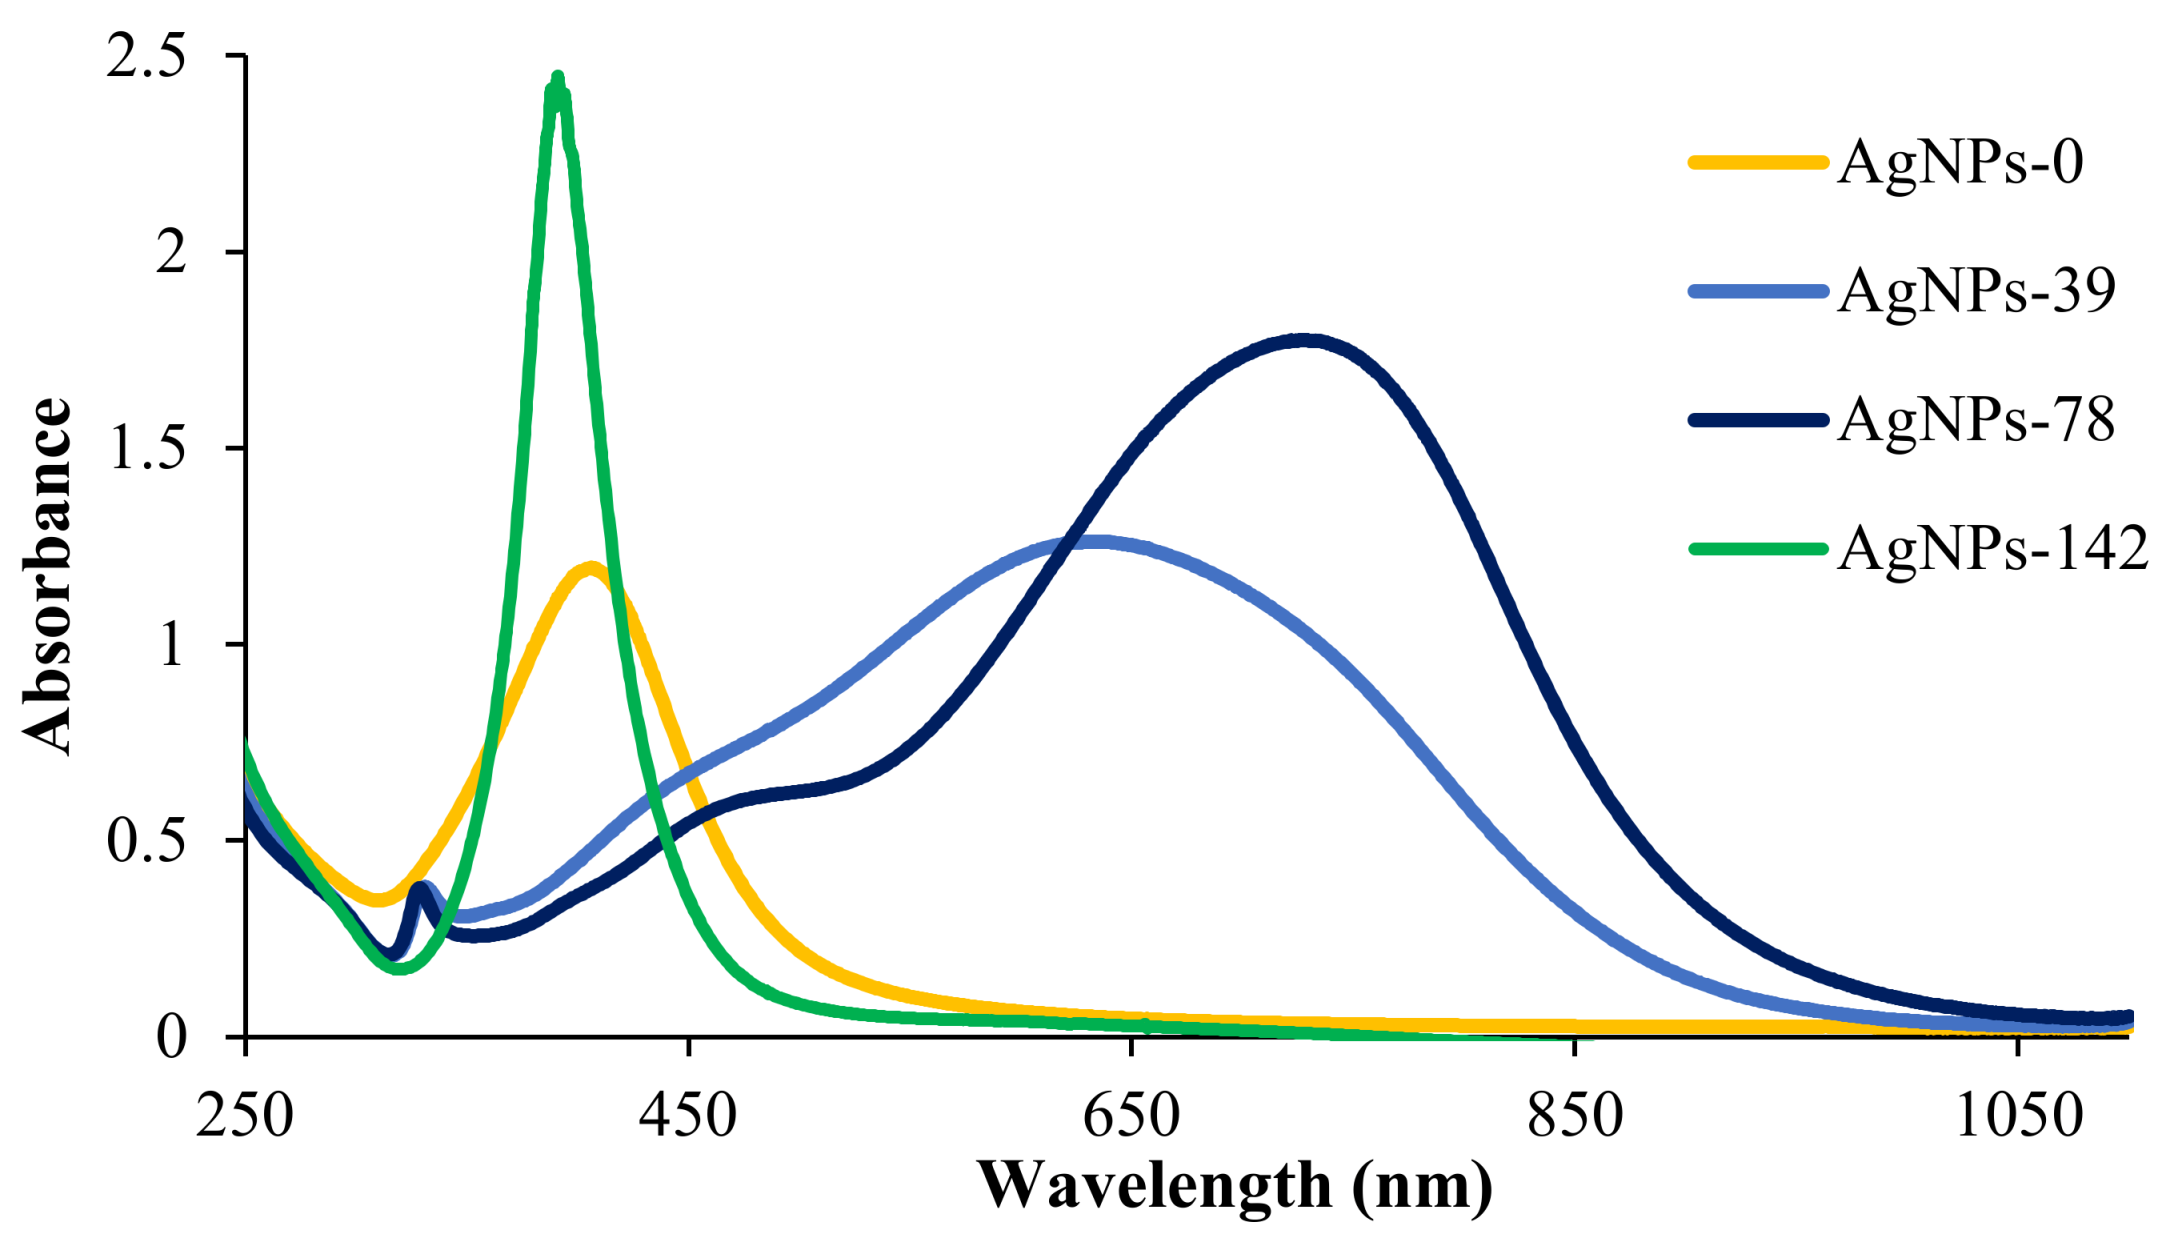
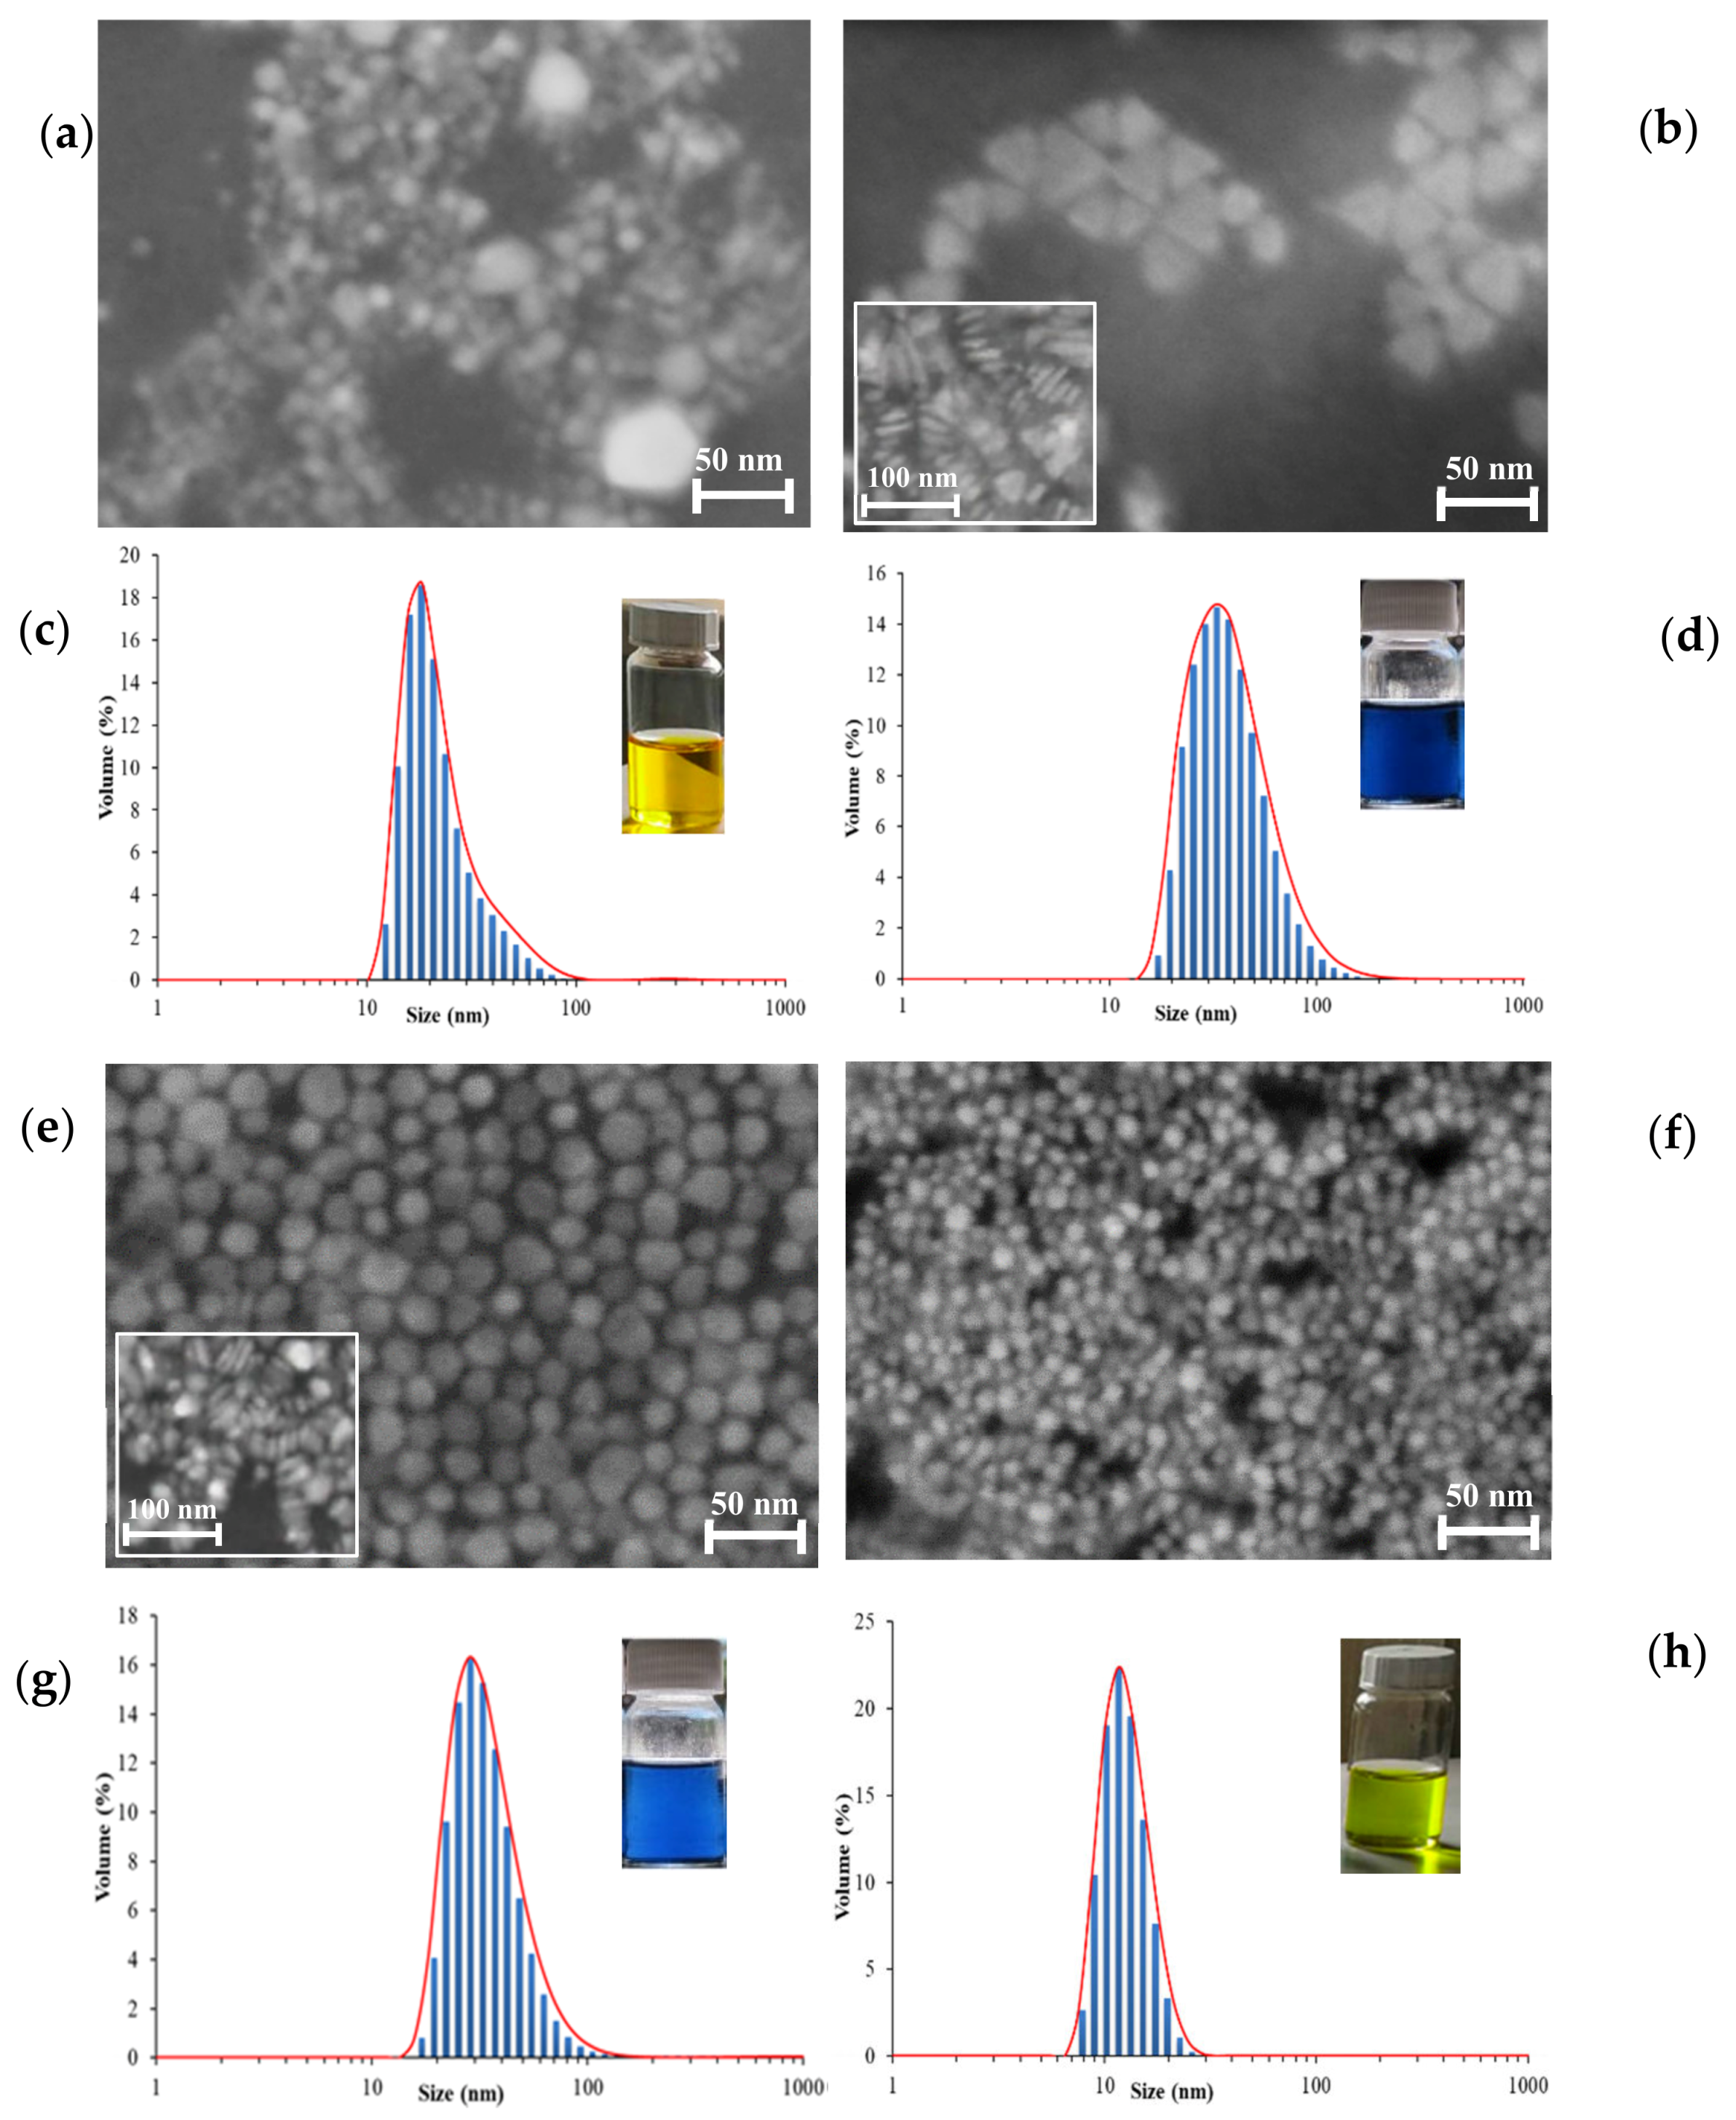
3.1. Nanoparticles Characterization
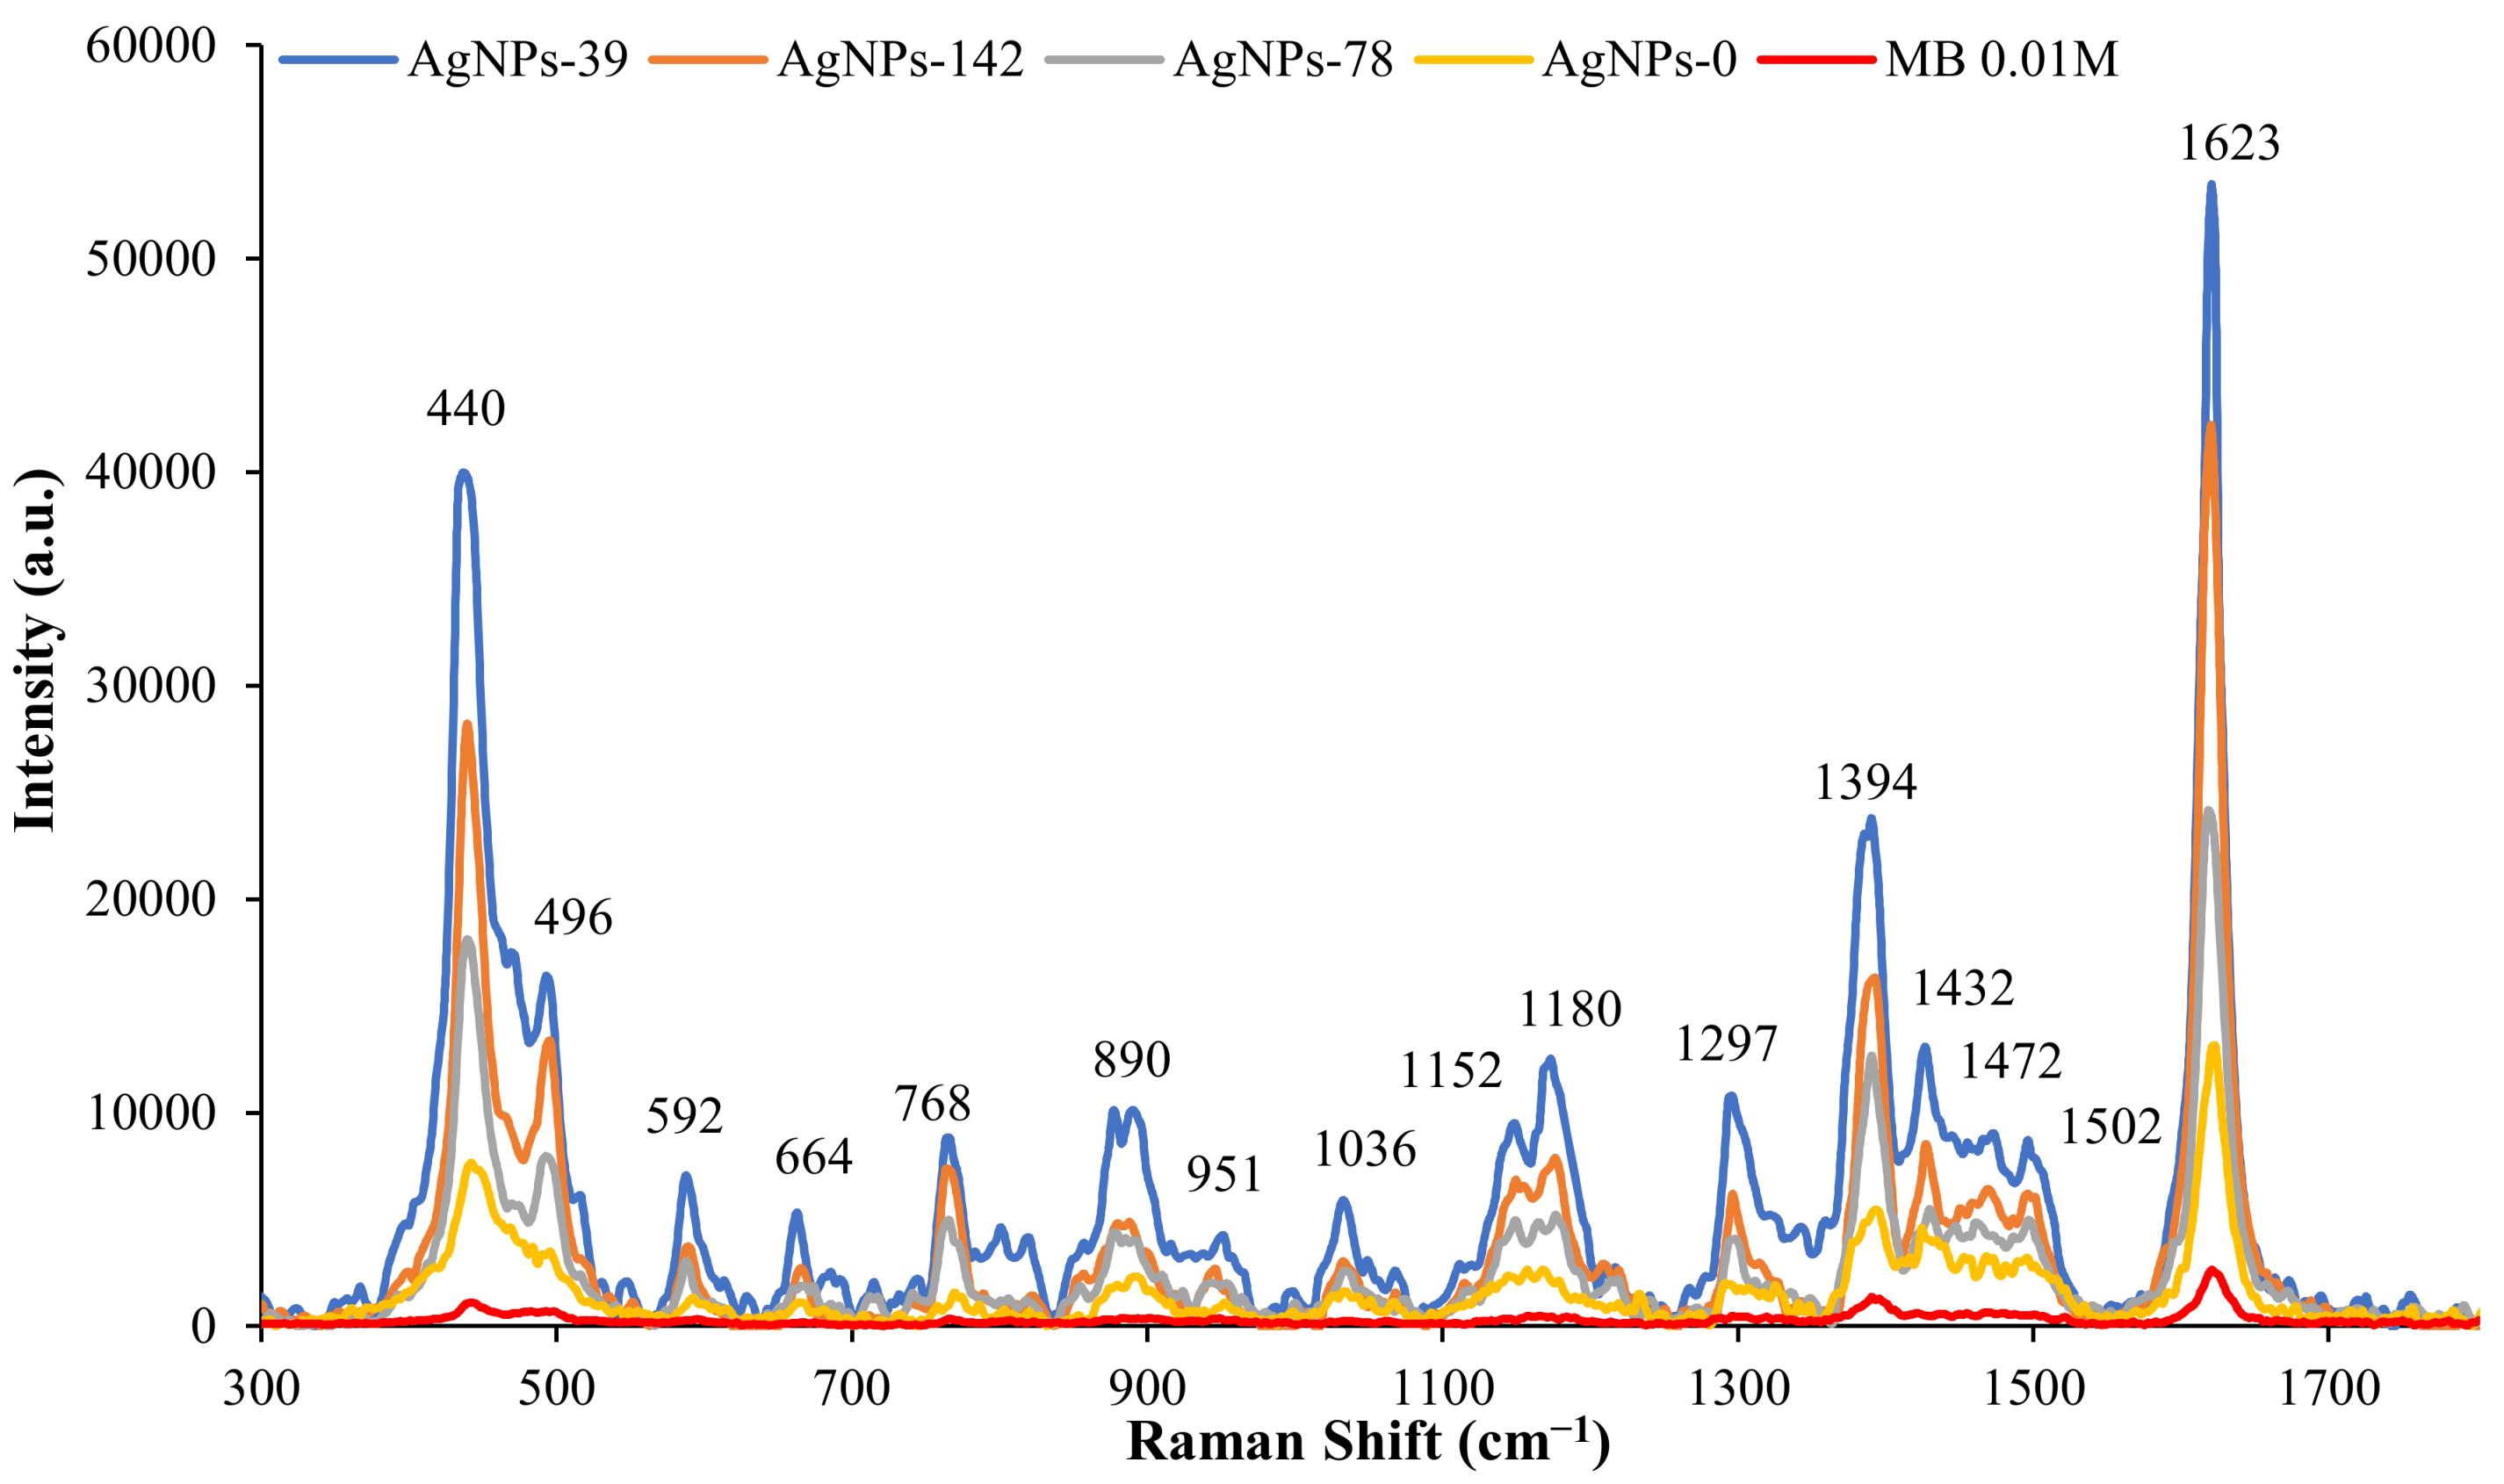
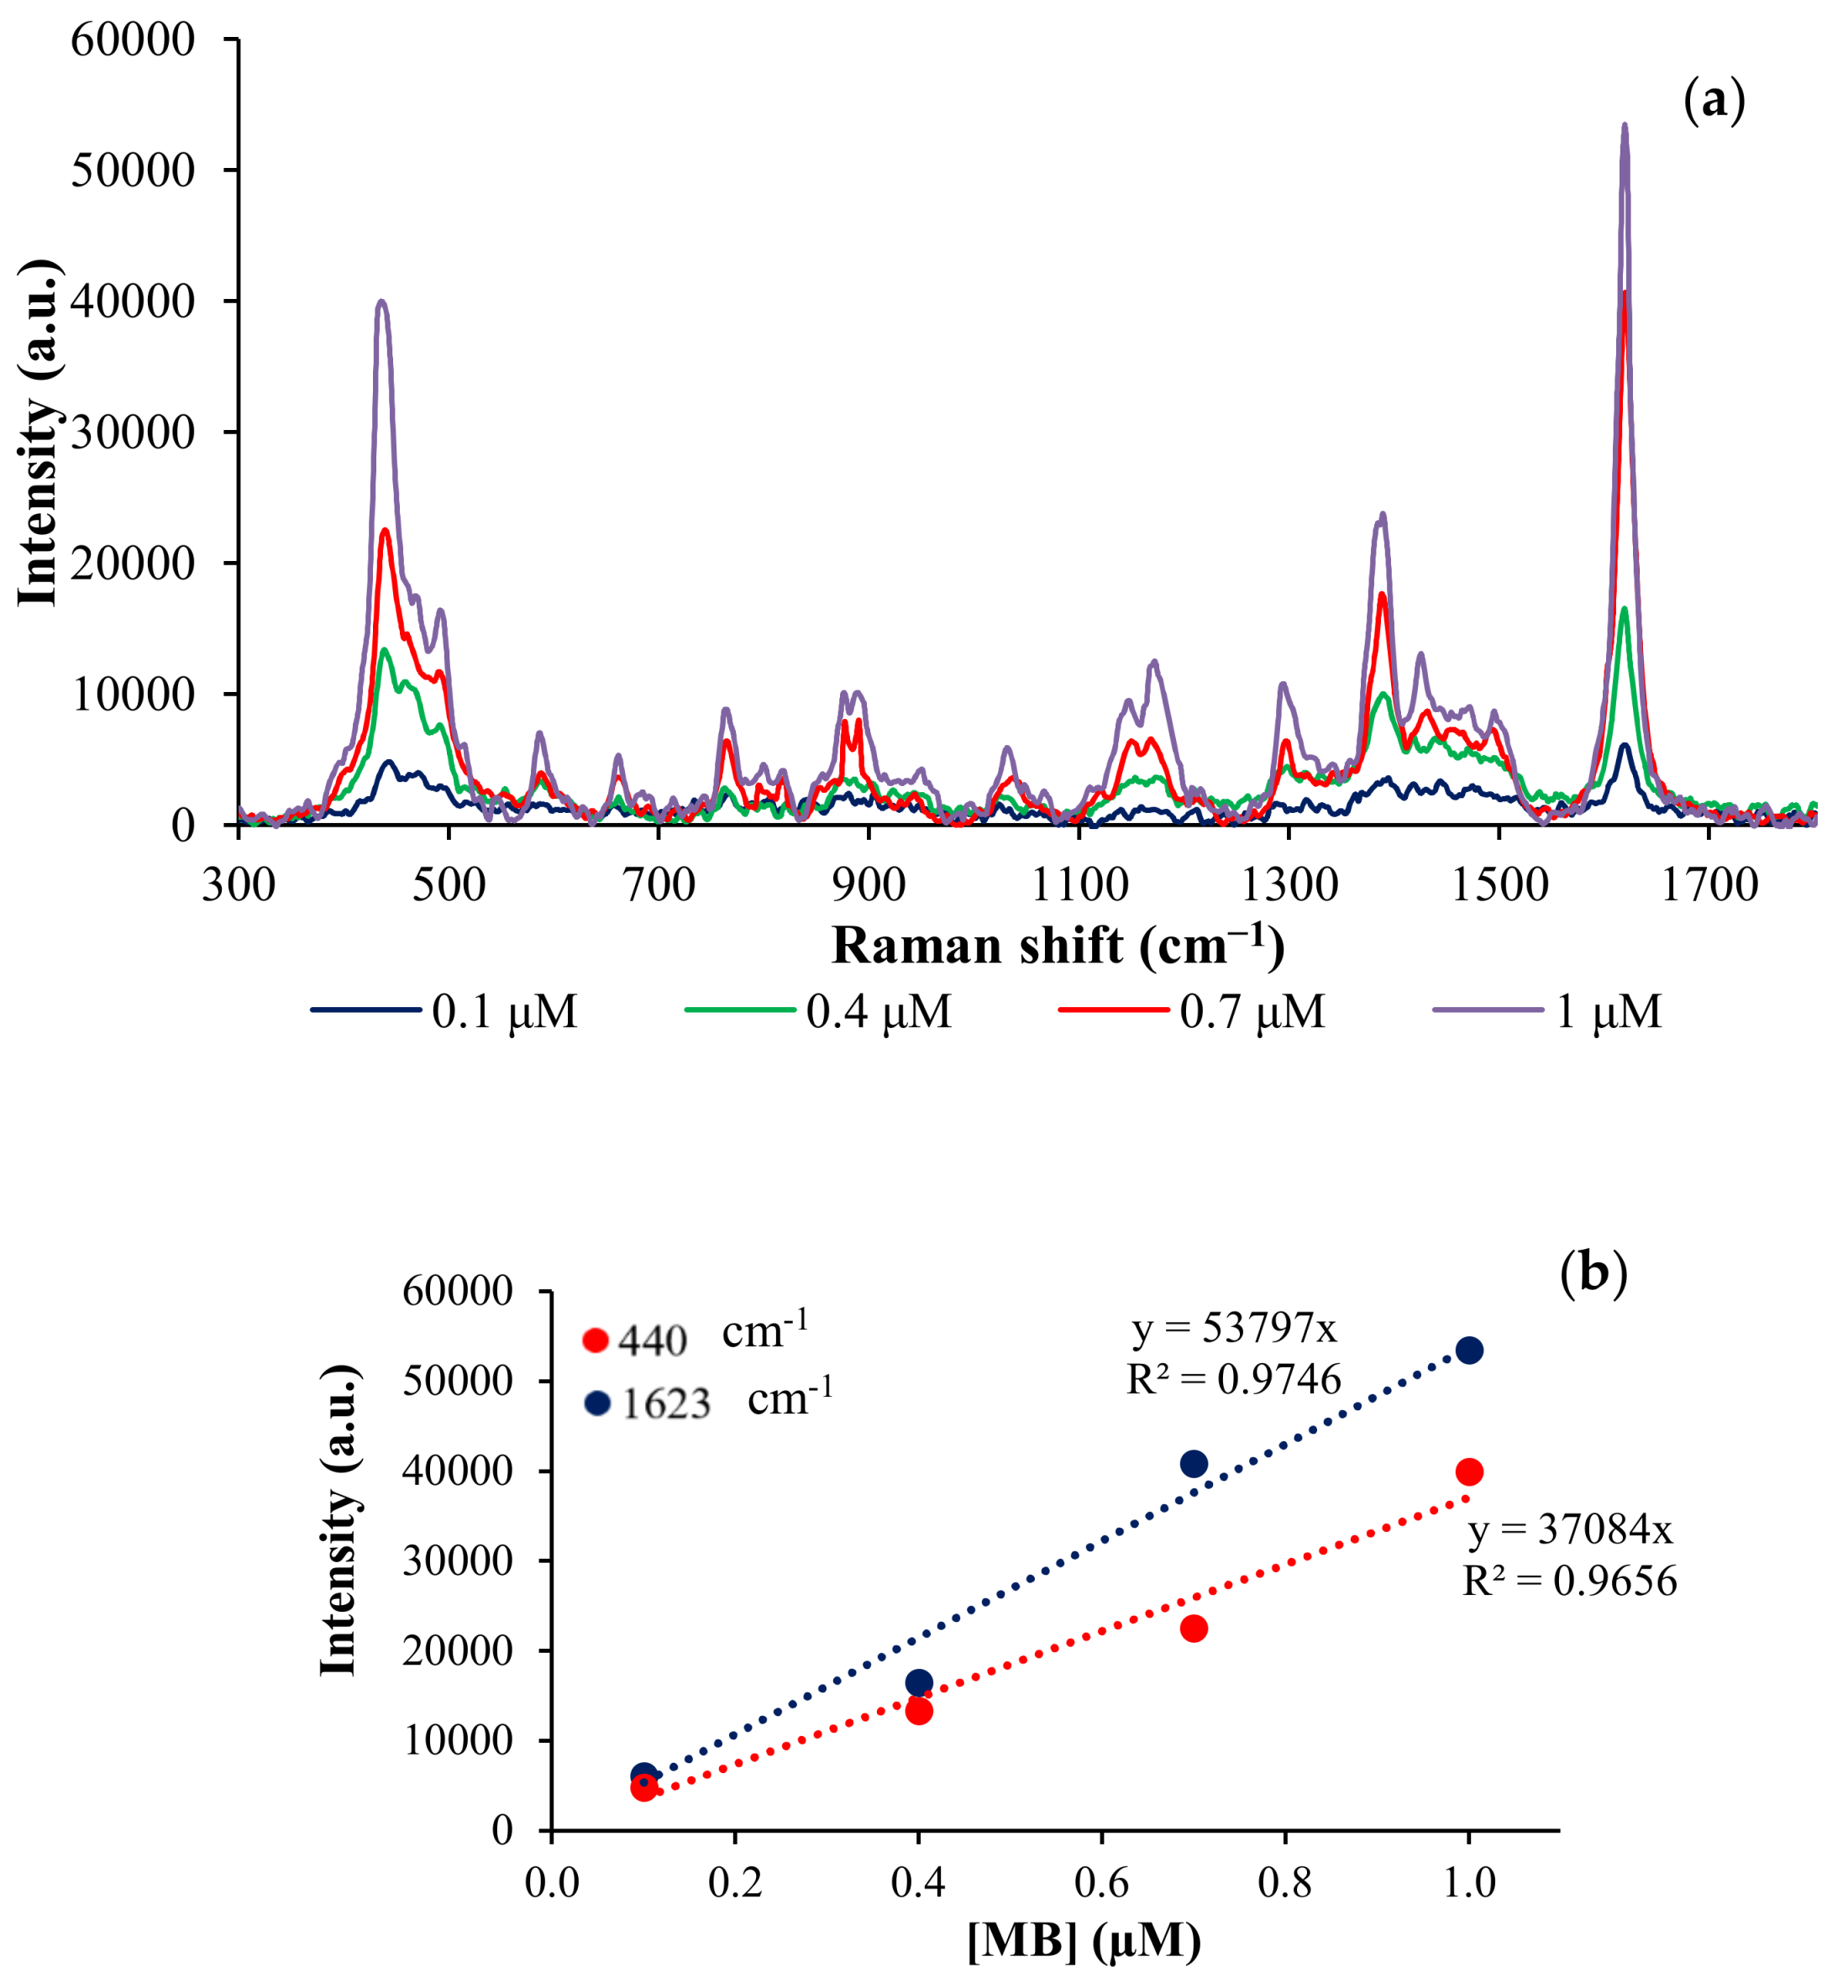
3.2. SERS Analysis
4. Conclusions
Supplementary Materials
Author Contributions
Acknowledgments
Conflicts of Interest
References
- Okeil, S.; Schneider, J.J. Controlling surface morphology and sensitivity of granular and porous silver films for surface-enhanced Raman scattering, SERS. Beilstein J. Nanotechnol. 2018, 9, 2813–2831. [Google Scholar] [CrossRef] [PubMed]
- Kneipp, K.; Kneipp, H.; Kneipp, J. Surface-Enhanced Raman Scattering in Local Optical Fields of Silver and Gold Fields of Silver and Gold Nanoaggregates—From Single-Molecule Raman Spectroscopy to Ultrasensitive Probing in Live Cells. Acc. Chem. Res. 2006, 39, 443–450. [Google Scholar] [CrossRef] [PubMed]
- Almehmadi, L.M.; Curley, S.M.; Tokranova, N.A.; Tenenbaum, S.A.; Lednev, I.K. Surface Enhanced Raman Spectroscopy for Single Molecule Protein Detection. Sci. Rep. 2019, 9, 12356–12359. [Google Scholar] [CrossRef] [PubMed]
- Khoury, C.G.; Vo-Dinh, T. Gold Nanostars for Surface-Enhanced Raman Scattering: Synthesis, Characterization and Optimization. J. Phys. Chem. C 2008, 112, 18849–18859. [Google Scholar] [CrossRef] [PubMed]
- Sharma, B.; Frontiera, R.R.; Henry, A.-I.; Ringe, E.; Van Duyne, R.P. SERS: Materials, applications, and the future. Mater. Today 2012, 15, 16–25. [Google Scholar] [CrossRef]
- Zhang, W.; Jiang, L.; Piper, J.A.; Wang, Y. SERS Nanotags and Their Applications in Biosensing and Bioimaging. J. Anal. Test. 2018, 2, 26–44. [Google Scholar] [CrossRef]
- Tsai, M.-H.; Lin, Y.-K.; Luo, S.-C. Electrochemical SERS for in Situ Monitoring the Redox States of PEDOT and Its Potential Application in Oxidant Detection. ACS Appl. Mater. Interfaces 2018, 11, 1402–1410. [Google Scholar] [CrossRef]
- Pang, S.; Yang, T.; He, L. Review of surface enhanced Raman spectroscopic (SERS) detection of synthetic chemical pesticides. TrAC Trends Anal. Chem. 2016, 85, 73–82. [Google Scholar] [CrossRef]
- Ai, Y.-J.; Liang, P.; Wu, Y.-X.; Dong, Q.-M.; Li, J.-B.; Bai, Y.; Xu, B.-J.; Yu, Z.; Ni, D. Rapid qualitative and quantitative determination of food colorants by both Raman spectra and Surface-enhanced Raman Scattering (SERS). Food Chem. 2018, 241, 427–433. [Google Scholar] [CrossRef]
- Darienzo, R.E.; Chen, O.; Sullivan, M.; Mironava, T.; Tannenbaum, R. Au nanoparticles for SERS: Temperature-controlled nanoparticle morphologies and their Raman enhancing properties. Mater. Chem. Phys. 2020, 240, 122143. [Google Scholar] [CrossRef]
- Darienzo, R.; Mironava, T.; Tannenbaum, R. Raman Signal Enhancement by Quasi-Fractal Geometries of Au Nanoparticles. J. Nanosci. Nanotechnol. 2019, 19, 4740–4746. [Google Scholar] [CrossRef] [PubMed]
- Dharmalingam, P.; Venkatakrishnan, K.; Tan, B. An atomic-defect enhanced Raman scattering (DERS) quantum probe for molecular level detection—Breaking the SERS barrier. Appl. Mater. Today 2019, 16, 28–41. [Google Scholar] [CrossRef]
- Reguera, J.; Langer, J.; De Aberasturi, D.J.; Liz-Marzán, L.M. Anisotropic metal nanoparticles for surface enhanced Raman scattering. Chem. Soc. Rev. 2017, 46, 3866–3885. [Google Scholar] [CrossRef] [PubMed]
- Bindhu, M.; Umadevi, M. Silver and gold nanoparticles for sensor and antibacterial applications. Spectrochim. Acta Part A Mol. Biomol. Spectrosc. 2014, 128, 37–45. [Google Scholar] [CrossRef] [PubMed]
- Seney, C.S.; Gutzman, B.M.; Goddard, R.H. Correlation of Size and Surface-Enhanced Raman Scattering Activity of Optical and Spectroscopic Properties for Silver Nanoparticles. J. Phys. Chem. C 2008, 113, 74–80. [Google Scholar] [CrossRef]
- Tiwari, V.S.; Oleg, T.; Darbha, G.K.; Hardy, W.; Singh, J.; Ray, P.C. Non-resonance SERS effects of silver colloids with different shapes. Chem. Phys. Lett. 2007, 446, 77–82. [Google Scholar] [CrossRef]
- Oh, M.-K.; Shin, Y.-S.; Lee, C.-L.; De, R.; Kang, H.; Yu, N.E.; Kim, B.H.; Kim, J.H.; Yang, J.-K. Morphological and SERS Properties of Silver Nanorod Array Films Fabricated by Oblique Thermal Evaporation at Various Substrate Temperatures. Nanoscale Res. Lett. 2015, 10, 962. [Google Scholar] [CrossRef]
- Rigó, I.; Veres, M.; Himics, L.; Tóth, S.; Czitrovszky, A.; Nagy, A.; Fürjes, P. Comparative Analysis of SERS Substrates of Different Morphology. Procedia Eng. 2016, 168, 371–374. [Google Scholar] [CrossRef]
- Liu, K.-K.; Tadepalli, S.; Tian, L.; Singamaneni, S. Size-Dependent Surface Enhanced Raman Scattering Activity of Plasmonic Nanorattles. Chem. Mater. 2015, 27, 5261–5270. [Google Scholar] [CrossRef]
- Garcia-Leis, A.; Garcia-Ramos, J.; Sanchez-Cortes, S. Silver Nanostars with High SERS Performance. J. Phys. Chem. C 2013, 117, 7791–7795. [Google Scholar] [CrossRef]
- Liu, L.; Wu, Y.; Yin, N.; Zhang, H.; Ma, H. Silver nanocubes with high SERS performance. J. Quant. Spectrosc. Radiat. Transf. 2020, 240, 106682. [Google Scholar] [CrossRef]
- Krajczewski, J.; Joubert, V.; Kudelski, A. Light-induced transformation of citrate-stabilized silver nanoparticles: Photochemical method of increase of SERS activity of silver colloids. Colloids Surfaces A: Physicochem. Eng. Asp. 2014, 456, 41–48. [Google Scholar] [CrossRef]
- Nehra, K.; Pandian, S.K.; Bharati, M.S.S.; Soma, V.R.; Kumar, P.S.; Bharathi, M.S.S. Enhanced catalytic and SERS performance of shape/size controlled anisotropic gold nanostructures. New J. Chem. 2019, 43, 3835–3847. [Google Scholar] [CrossRef]
- Parnklang, T.; Lamlua, B.; Gatemala, H.; Thammacharoen, C.; Kuimalee, S.; Lohwongwatana, B.; Ekgasit, S. Shape transformation of silver nanospheres to silver nanoplates induced by redox reaction of hydrogen peroxide. Mater. Chem. Phys. 2015, 153, 127–134. [Google Scholar] [CrossRef]
- Bastus, N.G.; Merkoçi, F.; Piella, J.; Puntes, V. Synthesis of Highly Monodisperse Citrate-Stabilized Silver Nanoparticles of up to 200 nm: Kinetic Control and Catalytic Properties. Chem. Mater. 2014, 26, 2836–2846. [Google Scholar] [CrossRef]
- Sun, Y.; Xia, Y. Triangular Nanoplates of Silver: Synthesis, Characterization, and Use as Sacrificial Templates for Generating Triangular Nanorings of Gold. Adv. Mater. 2003, 15, 695–699. [Google Scholar] [CrossRef]
- Lide, D.R.; Frederikse, H.P.R. CRC Handbook of Chemistry and Physics, 74th ed.; CRC Press: Boca Raton, FL, USA, 1993–1994. [Google Scholar]
- Ceballos, M.; Arizmendi-Morquecho, A.; Sanchez-Dominguez, M.; López, I. Electrochemical growth of silver nanodendrites on aluminum and their application as surface-enhanced Raman spectroscopy (SERS) substrates. Mater. Chem. Phys. 2020, 240, 122225. [Google Scholar] [CrossRef]
- Macia, N.; Bresolí-Obach, R.; Nonell, S.; Heyne, B. Hybrid Silver Nanocubes for Improved Plasmon-Enhanced Singlet Oxygen Production and Inactivation of Bacteria. J. Am. Chem. Soc. 2018, 141, 684–692. [Google Scholar] [CrossRef]


| Sample | Morphology | SEM a Diameter (nm) | DLS Diameter (nm) | PdI b |
|---|---|---|---|---|
| AgNPs-0 |  | 15 | 18.2 ± 0.94 | 0.592 |
| AgNPs-39 |  | 35–40 | 32.2 ± 0.71 | 0.471 |
| AgNPs-78 |   | 25–30 | 22.3 ± 0.91 | 0.486 |
| AgNPs-142 |  | 10 | 15.7 ± 0.74 | 0.478 |
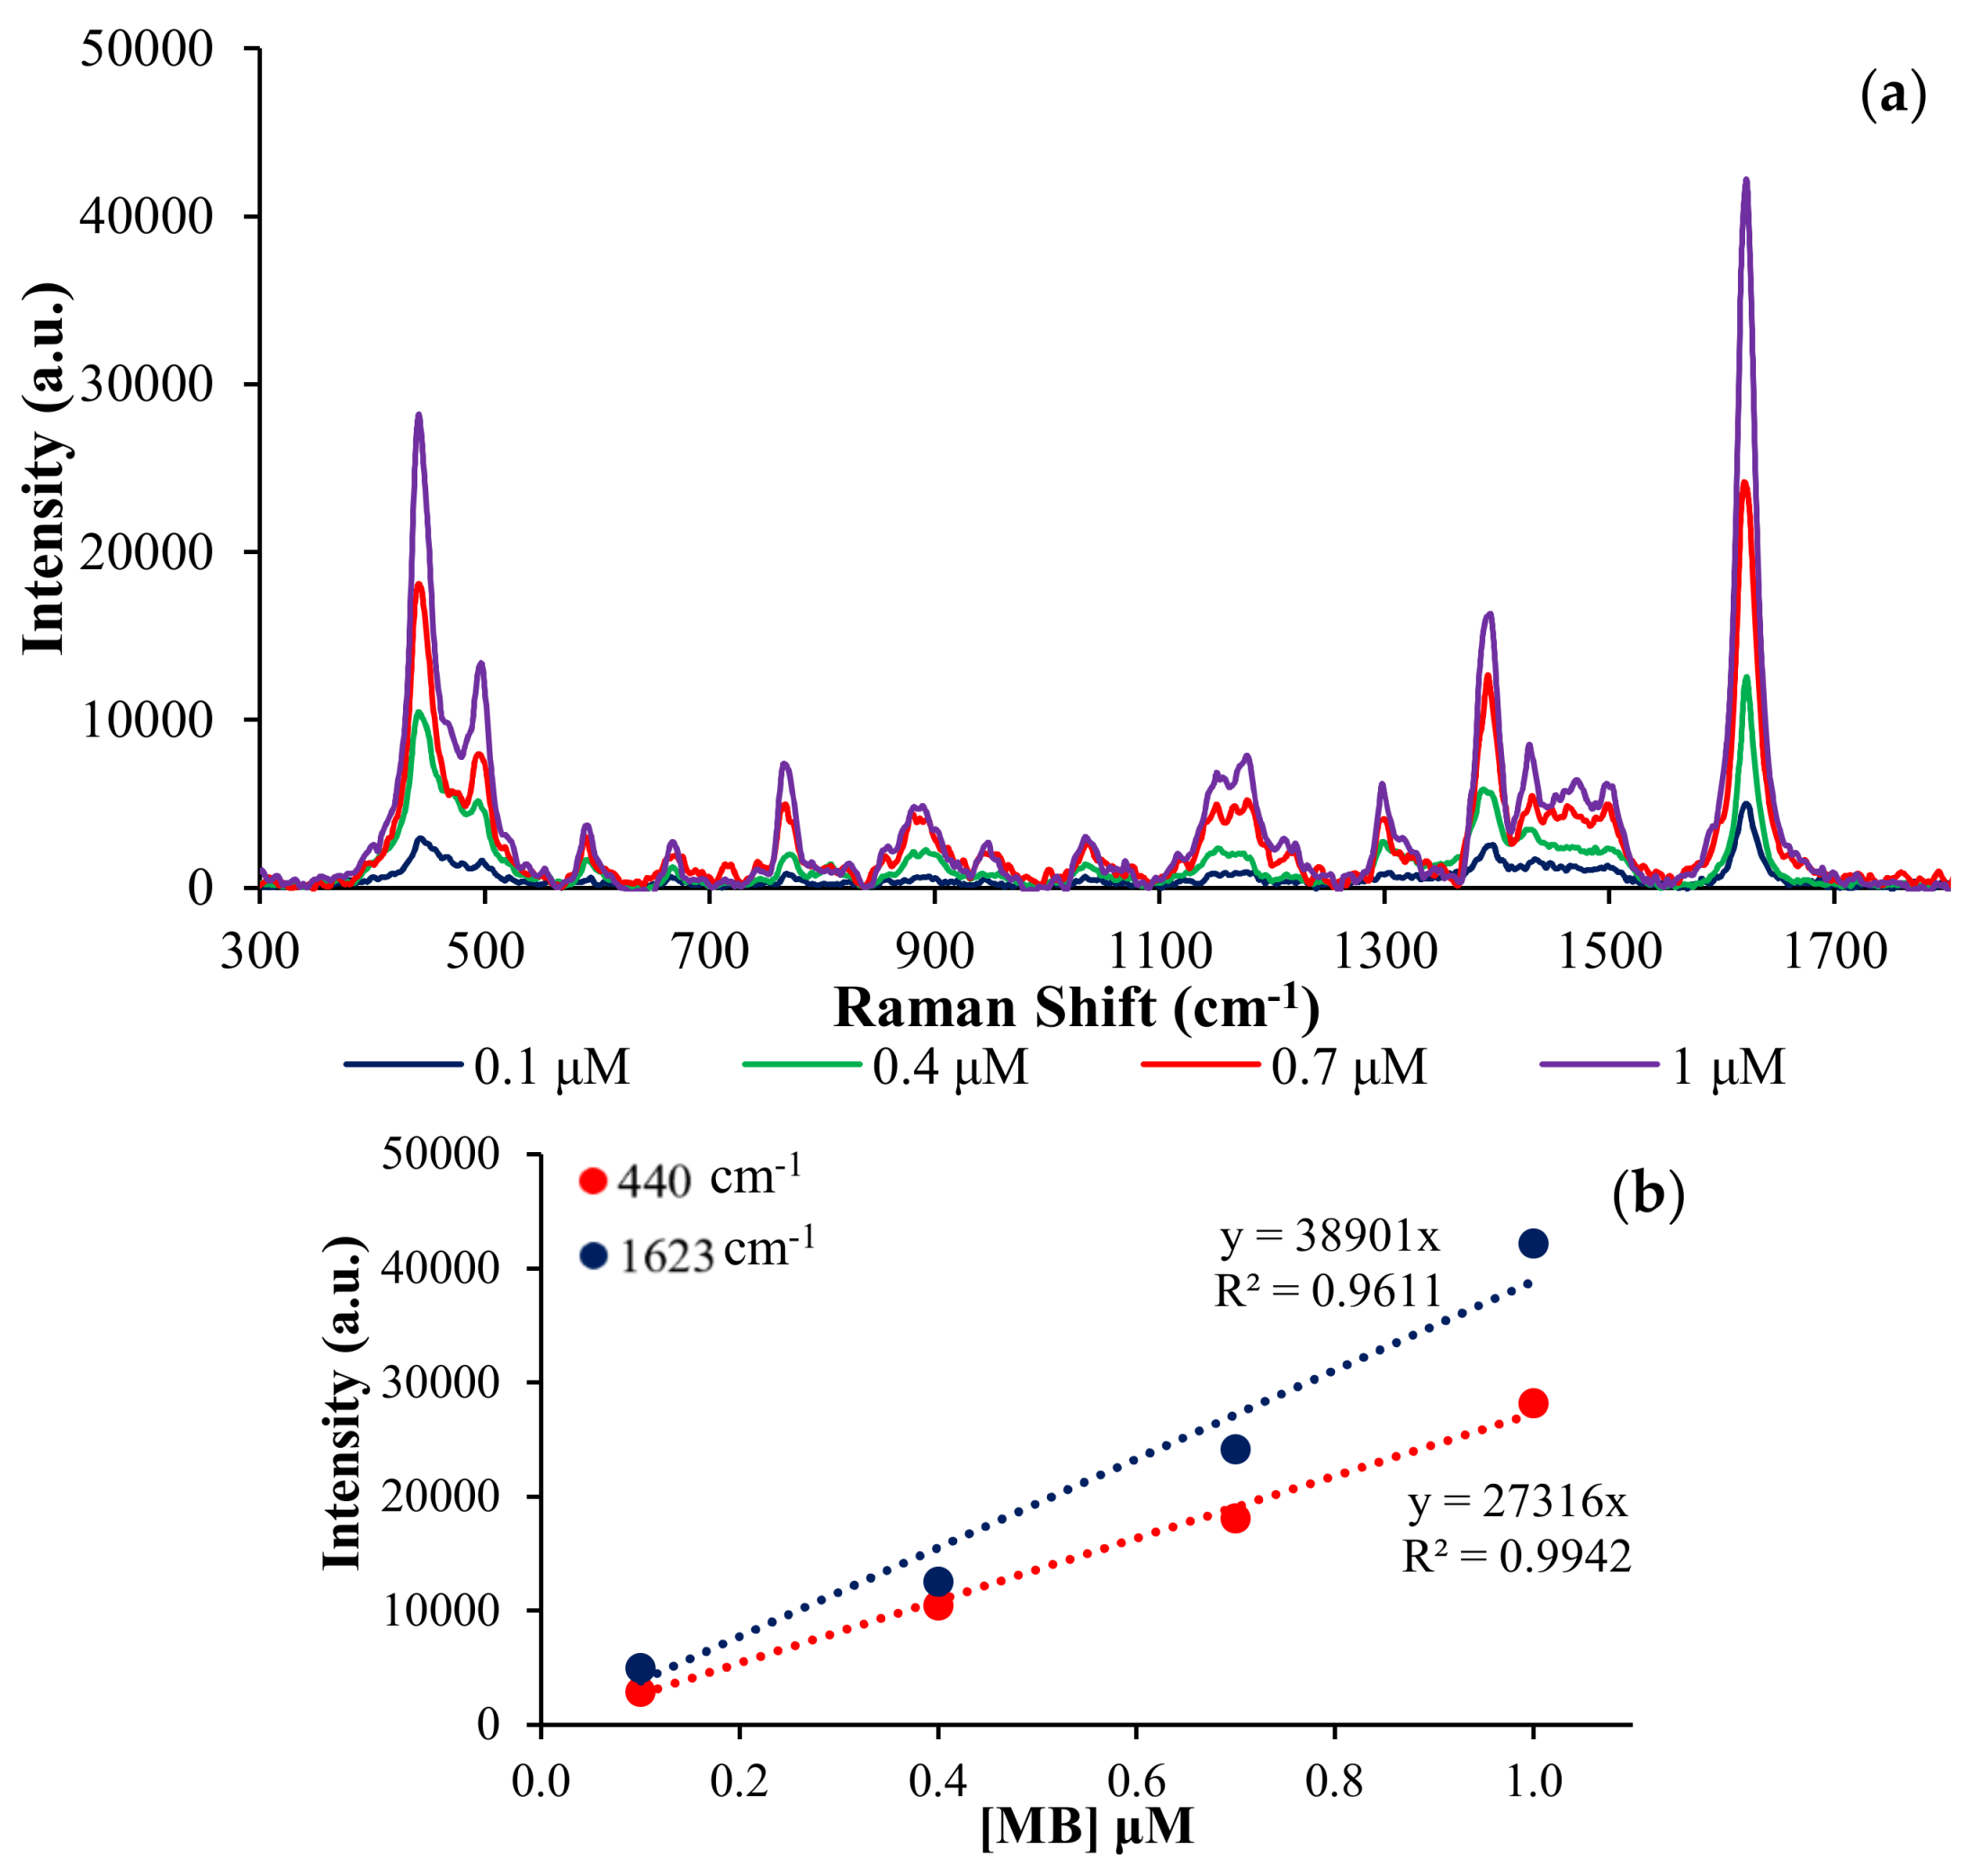
| Raman Shifts (cm−1) | Band Assignments |
|---|---|
| 440 (s) | Skeletal deformation of C-N-C |
| 496 (m) | Skeletal deformation C-N-C |
| 592 (w) | Skeletal deformation of C-S-C |
| 664 (w) | Out-of-plane bending of C-H |
| 768 (w) | In-plane bending of C-H |
| 890 (w) | In-plane bending of C-H |
| 951(w) | In-plane bending of C-H |
| 1036 (w) | In-plane bending of C-H |
| 1152(w) | In-plane bending of C-H |
| 1180 (w) | Stretching of C-N |
| 1297 (w) | In-plane ring deformation of C-H |
| 1394 (m) | Symmetrical stretching of C-N |
| 1432 (w) | Asymmetrical stretching of C-N |
| 1472 (w) | Asymmetrical stretching of C-N |
| 1502 (w) | Asymmetrical stretching of C-C |
| 1623 (s) | Ring stretching of C-C |
| Normal Raman | I1623 | I440 | ||
|---|---|---|---|---|
| MB 0.01 M | 2635.57 | 1085.33 | ||
| SERS Substrate (MB 1uM) | I1623 | AEF (× 105) | I440 | AEF (× 105) |
| AgNPs-0 | 13126 | 0.50 | 7654.16 | 0.71 |
| AgNPs-78 | 24130.5 | 0.92 | 18111.8 | 1.67 |
| AgNPs-142 | 40742.7 | 1.55 | 28186.4 | 2.60 |
| AgNPs-39 | 53480.1 | 2.03 | 39952.3 | 3.68 |
© 2020 by the authors. Licensee MDPI, Basel, Switzerland. This article is an open access article distributed under the terms and conditions of the Creative Commons Attribution (CC BY) license (http://creativecommons.org/licenses/by/4.0/).
Share and Cite
Zannotti, M.; Rossi, A.; Giovannetti, R. SERS Activity of Silver Nanosphere, Triangular Nanoplates, Hexagonal Nanoplates and Quasi-Spherical Nanoparticles: Effect of Shape and Morphology. Coatings 2020, 10, 288. https://doi.org/10.3390/coatings10030288
Zannotti M, Rossi A, Giovannetti R. SERS Activity of Silver Nanosphere, Triangular Nanoplates, Hexagonal Nanoplates and Quasi-Spherical Nanoparticles: Effect of Shape and Morphology. Coatings. 2020; 10(3):288. https://doi.org/10.3390/coatings10030288
Chicago/Turabian StyleZannotti, Marco, Andrea Rossi, and Rita Giovannetti. 2020. "SERS Activity of Silver Nanosphere, Triangular Nanoplates, Hexagonal Nanoplates and Quasi-Spherical Nanoparticles: Effect of Shape and Morphology" Coatings 10, no. 3: 288. https://doi.org/10.3390/coatings10030288
APA StyleZannotti, M., Rossi, A., & Giovannetti, R. (2020). SERS Activity of Silver Nanosphere, Triangular Nanoplates, Hexagonal Nanoplates and Quasi-Spherical Nanoparticles: Effect of Shape and Morphology. Coatings, 10(3), 288. https://doi.org/10.3390/coatings10030288