Article

XPS and FTIR Studies of DC Reactive Magnetron Sputtered TiO2 Thin Films on Natural Based-Cellulose Fibers

by
Telmo Eleutério
1,
Susana Sério
2,
Orlando M. N. D. Teodoro
2,
Nenad Bundaleski
2 and
Helena C. Vasconcelos
1,2,*
1
Universidade dos Açores, Faculdade de Ciências e Tecnologia, 9501-801 Ponta Delgada, Açores, Portugal
2
CEFITEC, Departamento de Física, Faculdade de Ciências e Tecnologia, Universidade NOVA de Lisboa, 2829-516 Caparica, Portugal
*
Author to whom correspondence should be addressed.
Coatings 2020, 10(3), 287; https://doi.org/10.3390/coatings10030287
Submission received: 20 January 2020 / Revised: 4 March 2020 / Accepted: 17 March 2020 / Published: 20 March 2020

Abstract

:
Natural based-cellulosic fibers are trending due to the global awareness regarding environmental health and because their properties make them a great alternative to the synthetic fibers. However, these fibers also have some hindrances that can be solved with their functionalization. The present study concerns modification of the surface of natural based-cellulosic fibers extracted from stems of the ginger lily plant (Hedychium gardnerianum) with TiO2 films deposited by DC magnetron sputtering using a titanium (Ti) target. A detailed characterization of the TiO2-coated fibers was investigated by Fourier transform infrared spectroscopy (FTIR) and X-ray photoelectron spectroscopy (XPS). The results revealed that the sputtered TiO2 films can be attached to the ginger lily fibers mainly by their OH groups. XPS analysis further shows that C–OH group is not dominant, which means that no pure cellulose is present at the surface.

Graphical Abstract

1. Introduction

Environmental concerns over global warming have encouraged academics to find new eco-friendly materials [1,2]. The huge advantages of natural based-cellulose fibers (NBCF)—such as low cost, biodegradability, abundance, and light weight—have already led to the replacement of synthetic fibers by natural ones in some cases. Hence NBCF have numerous applications in almost all fields of engineering and have also emerged as potentially reinforcement alternatives of advanced composite materials [3,4,5]. Stems of plants such as jute, flax, ramie, and hemp have been used to obtain NBCF [6]. However, these plants are almost exclusively grown as fiber crops and there is a growing concern regarding their upcoming availability and harvesting costs due to the restrictions of land and water needed to produce these crops. Therefore, several attempts are being made to find alternative plants for natural fibers. Recently, Eleutério et al. [7] have extracted hard fibers from the stems of the ginger lily plant (Hedychium gardnerianum), which is on the list of the 100 most invasive non-native species in the world. Ginger lily grows easily in mild climates [8] and might even be harvested several times per year. They are similar to all other NBCF in many aspects but reveal marked differences in the relative amounts of their main components (cellulose, lignin, and hemicellulose) [7,9]. Ginger lily fibers contain by weight ~6% hemicelluloses, ~12% lignin [7,9], and high cellulose content of ~79%, while cellulose content of sisal, jute, and hemp fibers has been found to be 65%, 61–71%, and 68%, respectively [7]. From a chemical point of view, natural cellulose is a molecule of potentially reactive functional groups due to the abundant hydroxyls (–OH) groups and other oxygen-containing functional groups –C=O, –C–O–C–, –CHO, and –COOH on the fiber surface [10,11]. While the surface reactivity of pure manmade cellulosic fibers is mainly determined by their reactive hydroxyls groups, the NBCF exhibit a wide variety of functional groups at their surface that can bond to additional functional atoms or molecules and thus provide new properties and new applications for NBCF [12,13].
Nowadays, research activities are focused on the development of the so-called ‘smart textiles’ capable of photocatalytic self-cleaning—i.e., decomposition of toxic chemicals. This objective can be successfully achieved by TiO2 nanoparticles (or thin films) embedded in fabric substrates [14,15]. However, insufficient binding efficiency between certain fibers and TiO2 nanoparticles or lack of film adhesion can compromise the stability and durability of those systems during their use. Therefore, achieving maximum chemical compatibility between TiO2 and fibers surface is a highly relevant task. Marques et al. [16] promoted the hydrolysis of titanyl sulphate in acidic medium (direct sol–gel process) in the presence of cellulosic fibers and showed that they can act as efficient hydrophilic substrates for the nucleation and growth of TiO2 particles. Y. Xu et al. [17] have used direct current (DC) reactive magnetron sputtering to deposit TiO2 films on the surface of three manmade polymeric fibers (polyester, polypropylene, and viscose) and concluded that smooth surfaces lead to a more uniform film and fine grain structure. It was also revealed that viscose fibers exhibited the largest surface energy value (due to more OH groups present in their structure) and hence the lowest nucleation barrier for TiO2 film deposition. The feasibility of using sputtering for TiO2 nanoparticle deposition on cellulose fibers (cotton) has been further demonstrated by Y. Xie et al. [18]. These authors reported that TiO2 is linked with the cotton fiber by hydrogen bonding or van der Waals force and justify this type of bonding not only due to the sputtered particles impact but also to the presence of a large number of –OH groups on the fiber surface. However, reports on this topic are very limited. Despite NBCF having been extensively treated with various chemicals—such as alkali and silane, among others [19]—little is known about their surface reaction abilities in treatments by physical vapor deposition (PVD), especially DC magnetron sputtering, which depends not only on the quantity and quality of the cellulose reactive accessible groups but also on sputtering conditions, such as the operating pressure, discharge power, O2 gas partial pressure, and deposition time. Additionally, the nucleation and growth mechanism of sputtered particles on NBCF are not yet well understood. Hence, understanding of the fundamental reactions by which sputtered TiO2 films bond to NBCF is necessary to predict coating adhesion behavior.
This study describes the process of DC magnetron sputtering of TiO2 coatings on ginger lily fibers. A detailed investigation on the covered and uncovered fibers surface via XPS (X-ray photoelectron spectroscopy) and ATR-FTIR (attenuated total reflectance Fourier transform infrared spectroscopy) is also reported.

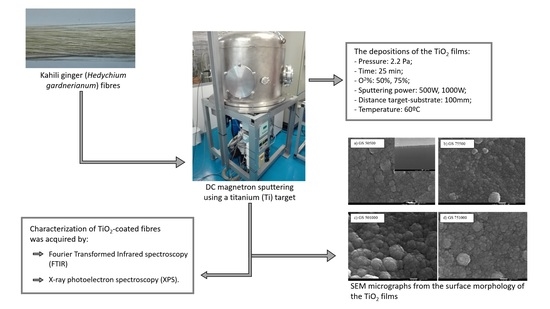
2. Materials and Methods

2.1. Preparation of TiO2 Films

TiO2 films were deposited on ginger lily fibers ‘as received’ (fiberf), previously pulled out from stem plant as earlier reported and described in detail elsewhere [7], and on glass substrates (GS), using reactive DC magnetron sputtering in a custom-made system. The surface of the fibers was not flat or smooth, having fewer xylem vessels elements. Figure 1 exhibits a SEM micrograph of a fiber surface ‘as received’. The fiber samples were kept under the same conditions of storage and without interference of external temperature.
The GS were used as ‘model substrate’ in order to study the films morphology versus different sputtering experimental conditions by scanning electron microscopy (SEM). Prior to the deposition, the GS were cleaned successively in acetone, isopropanol, and deionized water for 5 min each step and dried with nitrogen gas to remove any organic contamination.
The sputtering was carried out at room temperature (RT) using a titanium disc (99.99% purity, GoodFellow) with 64.5 mm of diameter and 4 mm of thickness as a sputtering target. A turbomolecular pump was used to achieve a base pressure of 10−4–10−5 Pa (before introducing the sputtering and reactive gases). Before the deposition, a movable shutter was interposed between the target and the substrates, and the target was pre-sputtered in Ar atmosphere for 5 min to clean the target surface.
The depositions of the TiO2 films were carried out at constant total gas pressure of 2.2 Pa, for two distinct oxygen percentages, 50% and 75% O2, and two different sputtering powers, 500 and 1000 W, for 50 and 75 min, respectively. The target-to-substrate distance was kept constant at 100 mm. No external substrate heating was used during the depositions. The substrate temperature was measured by a thermocouple passing through a small hole in a copper piece, which was placed in contact with the substrate. During the deposition process, the sample temperature increased up to 60 °C due to the plasma particle‘s bombardment of the substrate. The details of the sputtering conditions are summarized in Table 1. For convenience of the reader, the fiber samples were labeled considering the oxygen percentage followed by the sputtering power used to prepare the TiO2 films.

2.2. Characterization

Characterization of the thin films thickness and morphology was performed by a field emission scanning electron microscope (FEG-SEM JEOL 7001F, Tokyo, Japan) operating at 15 keV. A gold thin film was coated on the film’s surface before SEM analysis, for charge buildup prevention. The images of the cross-section allowed the estimation of the films’ thickness. Therefore, since the positioning of the sample has a slope relative to the axis of incidence of the electron beam, the measured thickness is given by the trigonometric equation, which can be deduced through the geometry involved. The indicated correction was calculated using the equation
d SEM = d obs cos 20 ° .
where the dSEM is the real thickness and dobs is an average of the measured thickness values estimated from the cross-section images.
XPS measurements were carried out on a VSW XPS system with the Class 100 energy analyzer being a part of a home-made experimental setup (Multitécnica) assembled for surface investigation [20]. The survey spectra were taken in a fixed analyzer transmission mode with the pass energy of 44 eV i.e., FAT 44, while the detailed spectra were taken in FAT 22 mode. The analysis was performed using the non-monochromatic Mg Kα line (photon energy of 1253.6 eV). For the energy axis calibration Ag (110) and polycrystalline Au samples (previously cleaned by ion sputtering) were used. The energy was calibrated to the peak position of Ag 3d5/2 (binding energy of 368.22 eV) and Au 4f7/2 (binding energy of 83.96 eV) lines. The direction of detected photoelectrons is perpendicular to the sample surface. The angle between the surface normal and the direction of X-irradiation is 54°. (corresponding to the so-called ’magic angle’ configuration). For the composition determination sensitivity factors from [21] were used, which are appropriate for this XPS system, under the assumption that the samples are in-depth and laterally uniform. Since the latter assumption is not correct for these samples, the composition analysis should be considered as a relative measure of the amounts of different species.
The reference sample was cleaned, dried, and measured ‘as-received’. All samples were analyzed ‘as-deposited’, without previous sputter cleaning. The samples appeared to be hygroscopic, which hindered their pumping.
The FTIR analysis was conducted in the attenuated total reflectance (ATR) mode using a Nicolet 5700 FTIR spectrometer (Thermo Fisher™, Waltham, MA, USA) equipped with an ATR Thermo Orbit accessory, with a crystal of ZnSe. All spectra were acquired in the range 4000–500 cm−1 with a spectral resolution of 4 cm−1. The sample chamber was purged with dry gas nitrogen for 10 min before each spectrum acquisition. Each spectrum was obtained from an average of 30 scans.

3. Results and Discussion

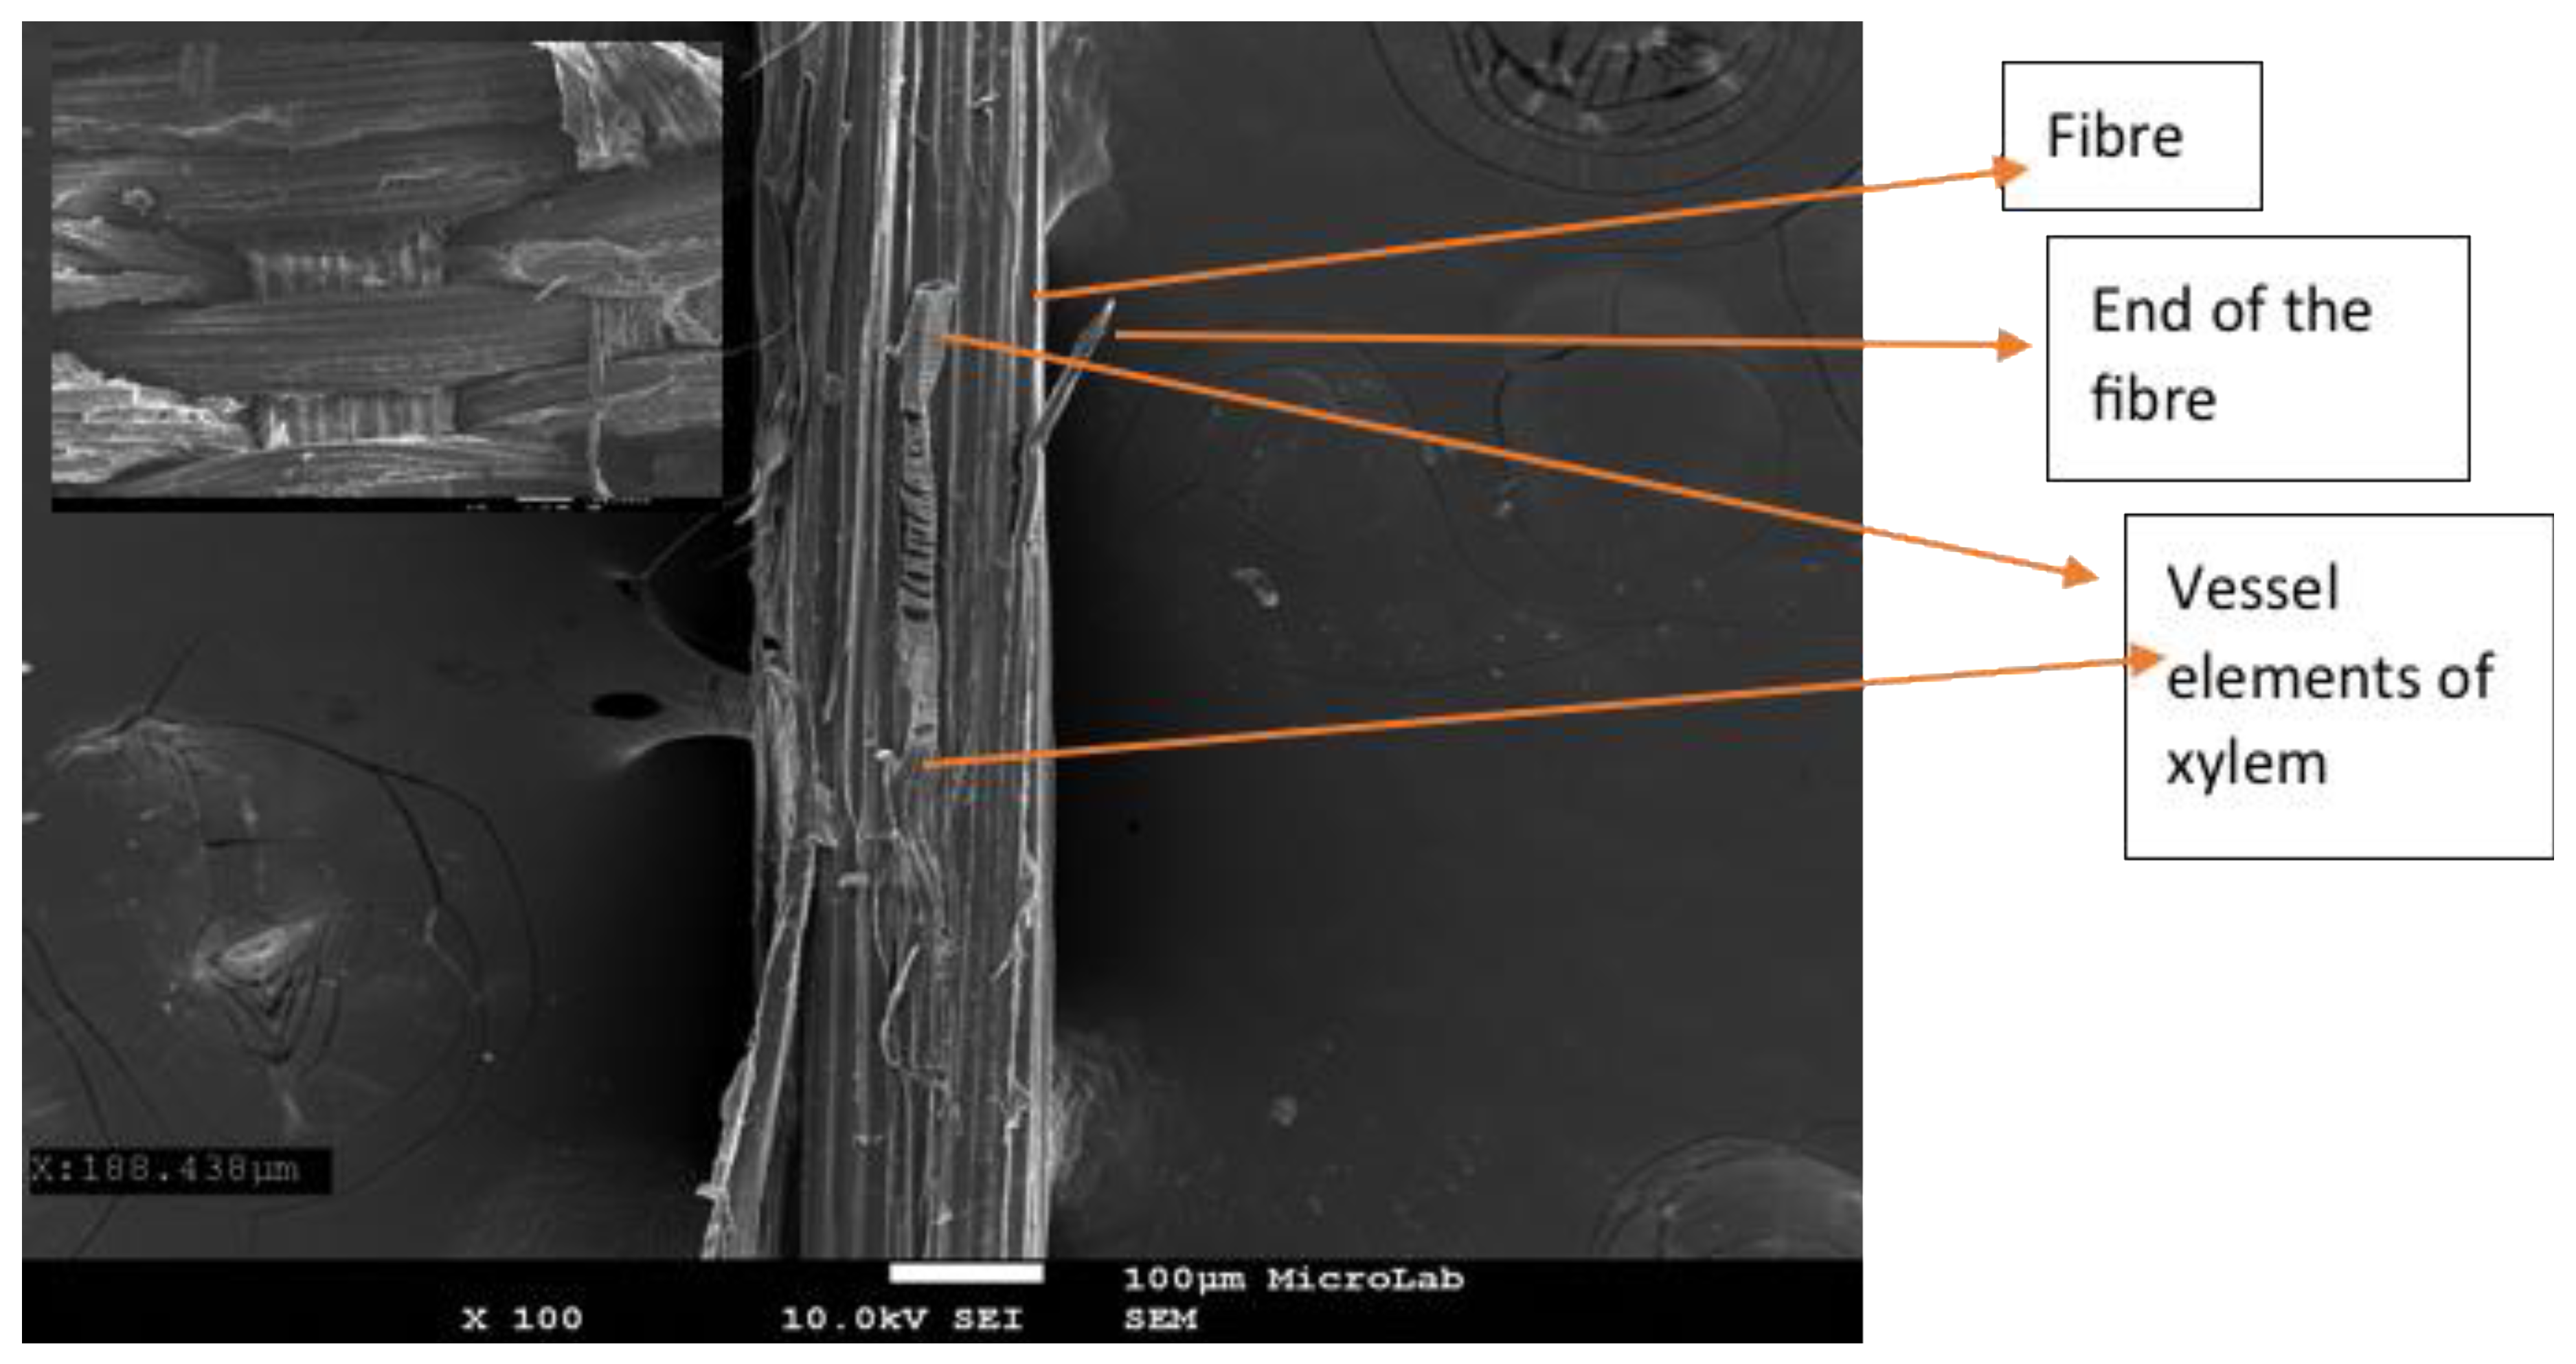
3.1. Surface Morphology

The effect of increasing the oxygen partial pressure on the surface morphology of TiO2 films deposited on glass substrates at P = 500 and 1000 W was investigated by using SEM. Figure 2 shows SEM micrographs of the films for the different deposition parameters summarized in Table 1. From the analysis of Figure 2, it can be observed that the surface morphology of the films consists of agglomerates of grains or particulates distributed over the substrate surface with a ‘blooming flower-like’ appearance. A more detailed observation of this image evidences the formation of the nanosized grains protruding on the sub-micrometer-sized grains, which exhibit different dimensions. Similar behavior was previously described for the TiO2 films deposited by DC reactive magnetron sputtering [22]. Although it can be noticed agglomerates of micro-phase grains in all produced films, for both sputtering powers an increase in % O2 leads to a decrease of the agglomerates, from an average size of 150–350 nm to 5–150 nm. The texture of the films is different when O2/(Ar + O2) ratio changes [23]. O2 forms negatively charged ions in plasma, in contrast to Ar that only forms positively charged ions. O ions are accelerated towards the substrate and bombard it, which can induce changes in film texture. When the relative content of O2 in the operating gas is higher, the nucleation rate is also higher, and therefore the particle size grows fast, resulting in smaller particle size. Less oxygen in the sputtering chamber will cause an opposite behavior.
Film thickness allows estimation of the deposition rate (Rd) (in nm/min) for any working condition (Rd = thickness/deposition time). Their values were evaluated from FEG-SEM cross-section images (which is presented as inset a representative image in Figure 2a of the corresponding film). The obtained values are summarized in Table 2.
It can be observed that the thickness of the films for the same sputtering power does not depend strongly on % O2, although a decreasing trend is revealed. Usually, more O2 in the gas mixture might reduce significantly the Rd because of the shielding effect (promoted by the oxidation of the target surface) that decrease the sputtering rate [24]. However, in this study the increase in O2 from 50% to 75% does not seem to significantly affect the thickness of the films. On the other hand, the increase of the sputtering power induces an evident increase of the thickness from approximately 160–330 nm, as it was expected. The increase of thickness is related to Ti–O bond formation at the film surface. During sputtering, chemical reactions between the sputtered Ti atoms and the reactive gas (O2) lead to the formation of sputtered species (e.g., Ti, O2, Ti–O) and thus deposition of TiO2. From the thermodynamic point of view, Ti–O–Ti bond formation is favourable since excess heat can be released as Ti–O bonds are formed on the substrate/film surface [25].

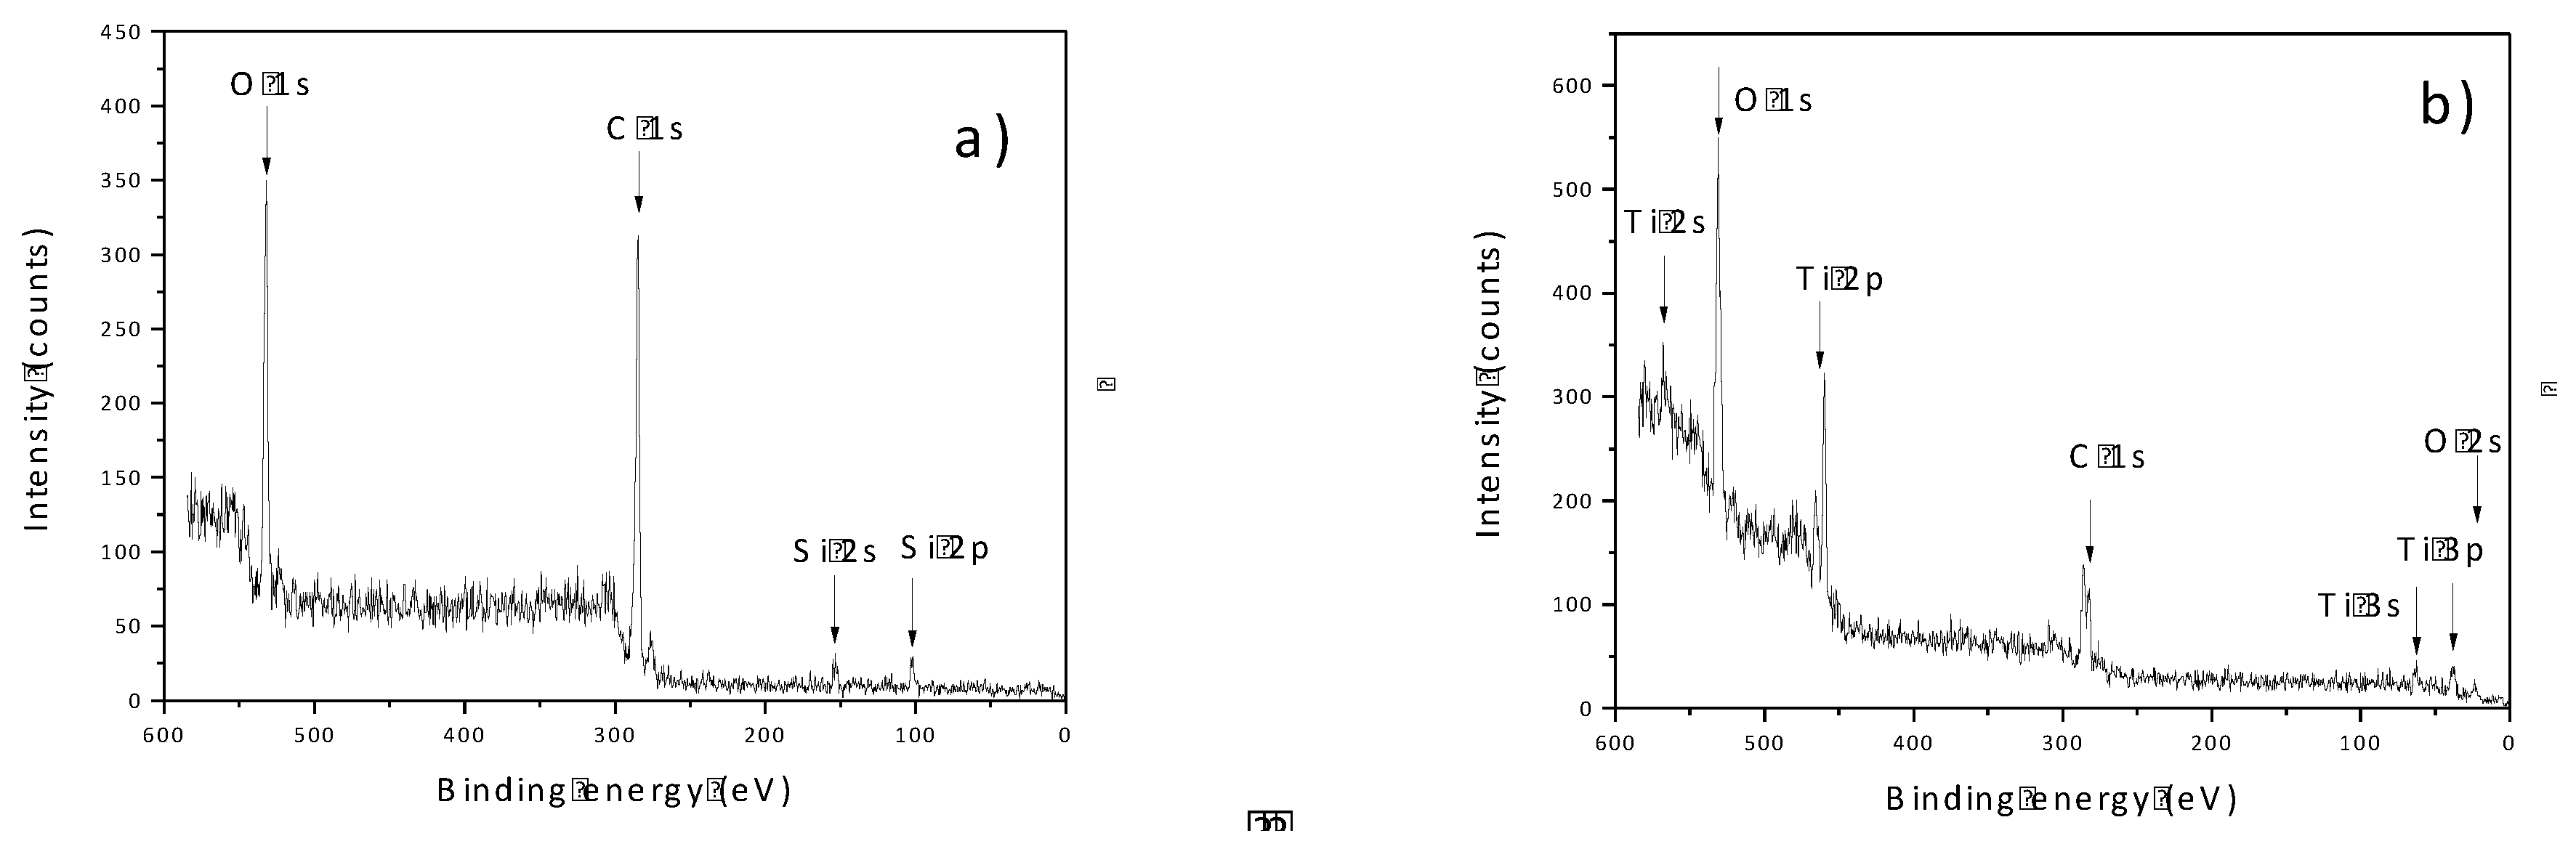
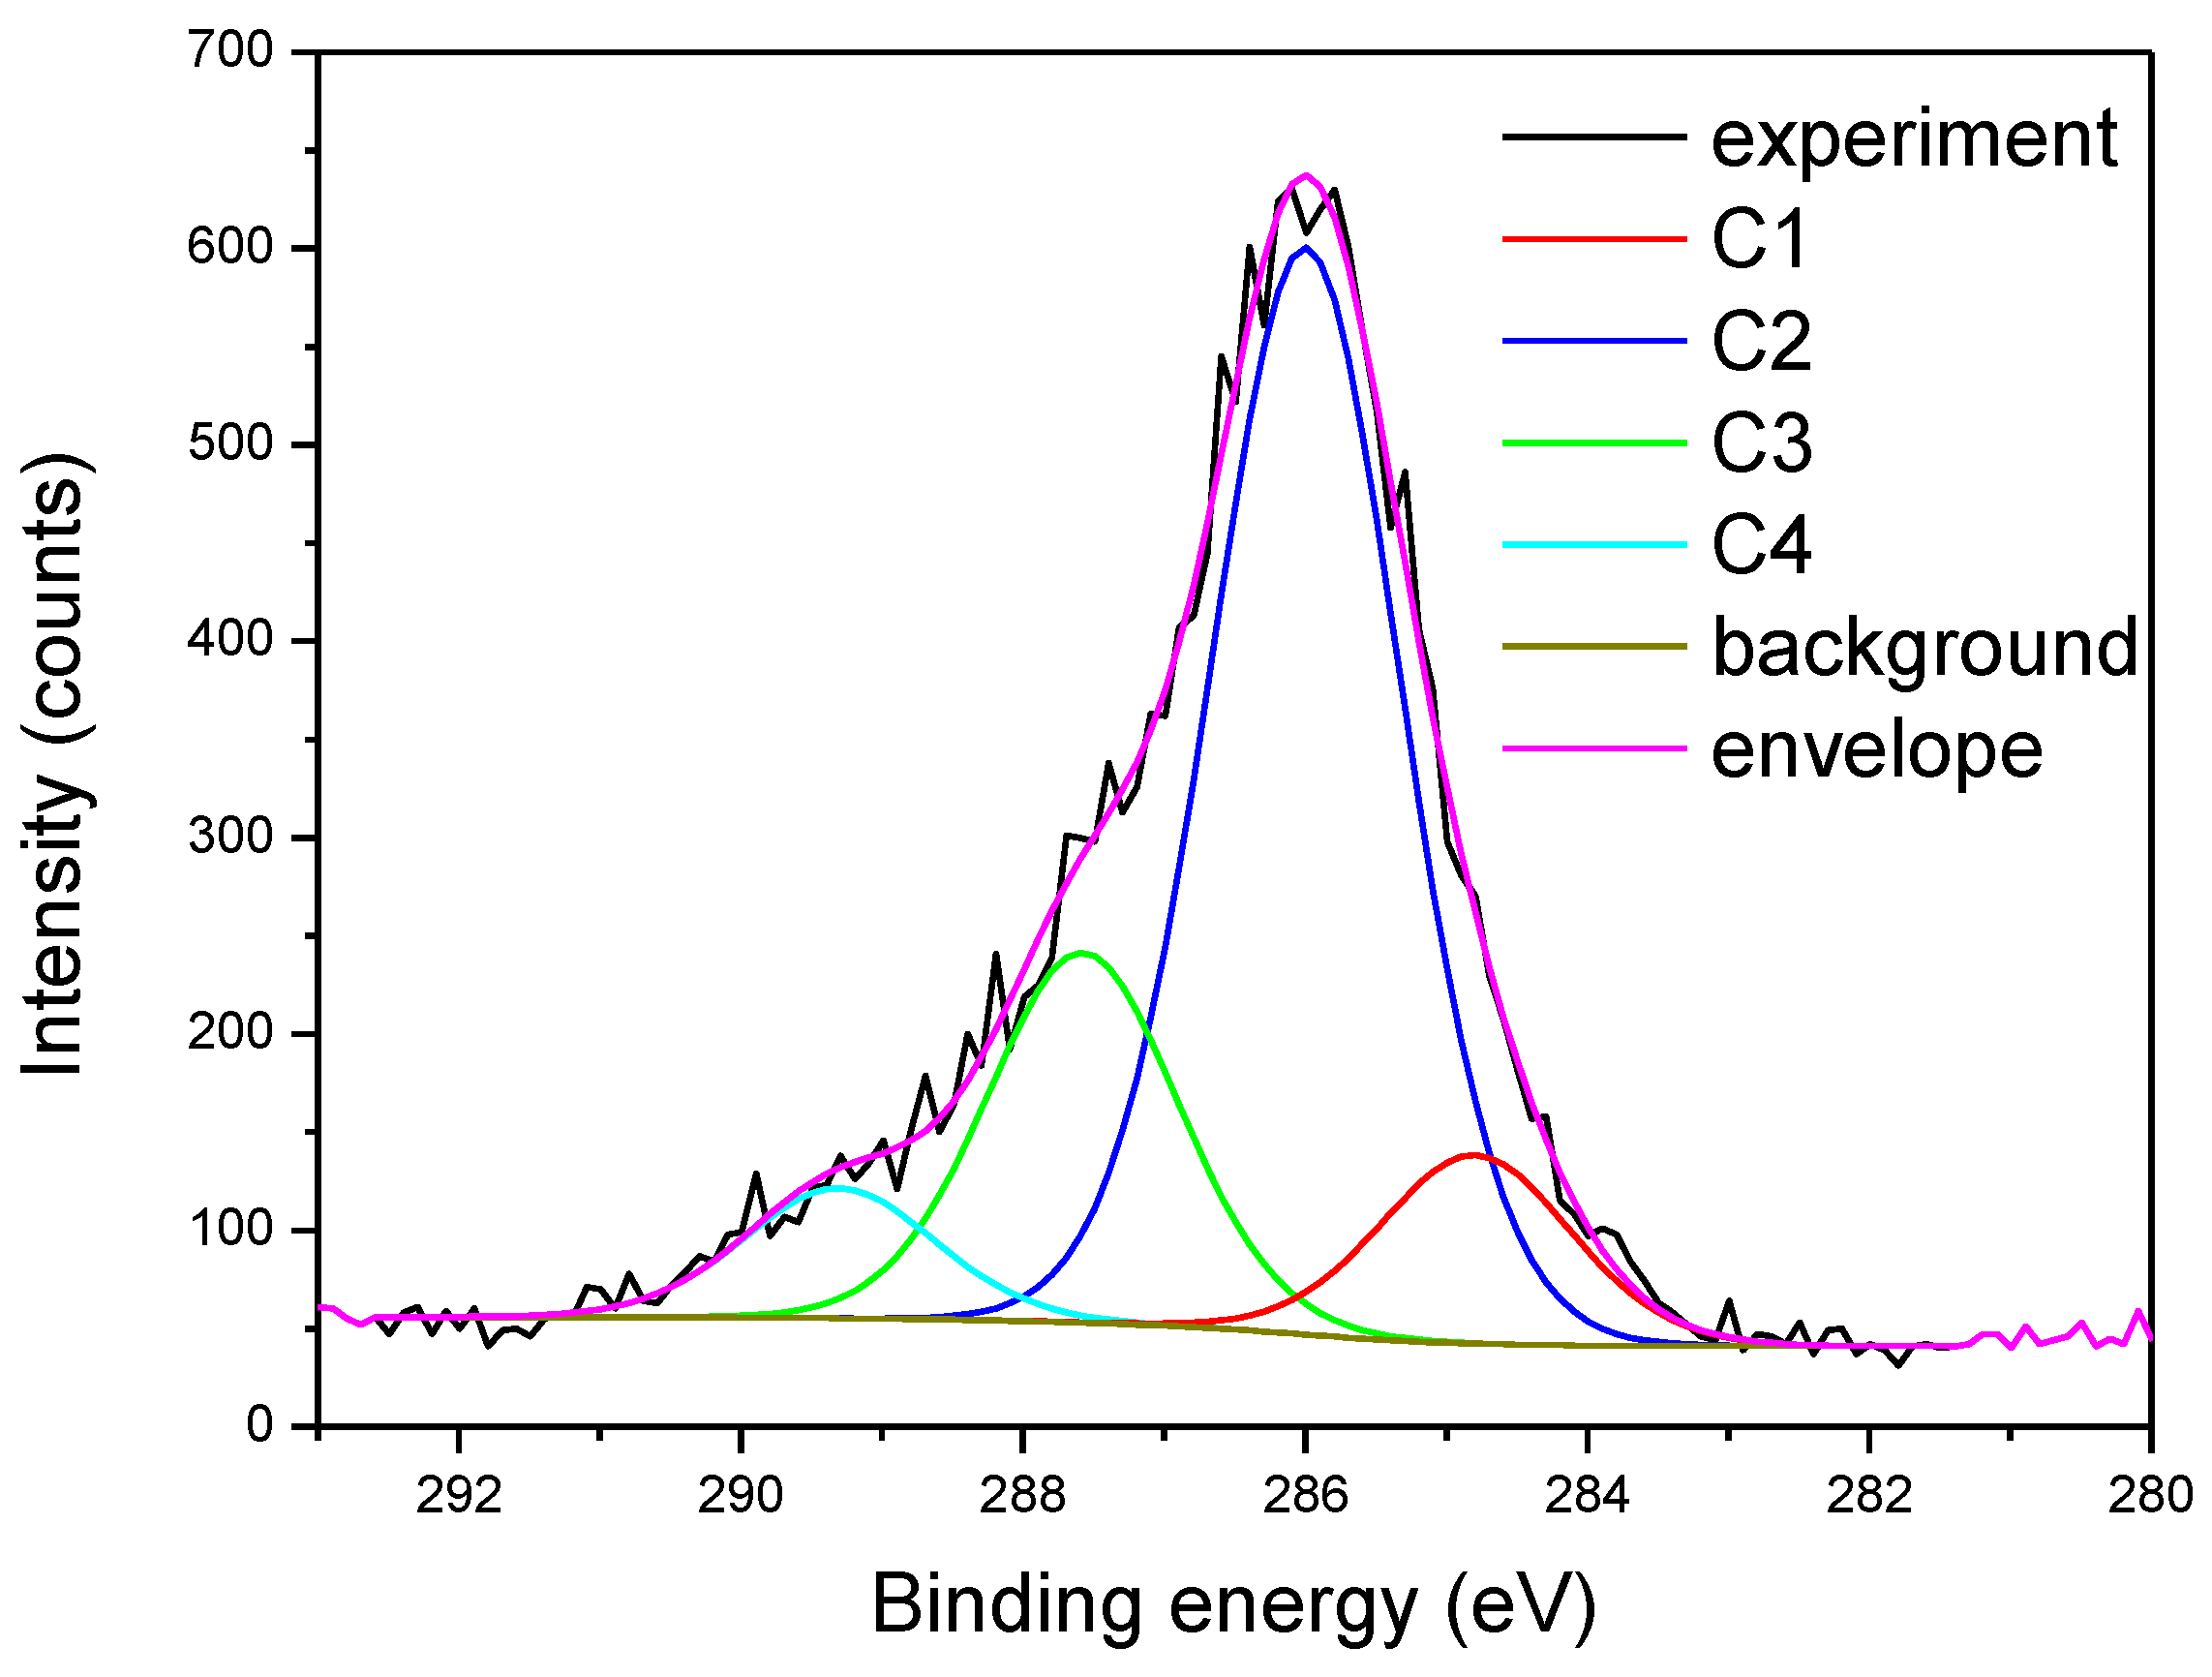
3.2. XPS—Surface Qualitative and Quantitative Composition Analysis

In Figure 3 are depicted a XPS survey spectra of the reference sample and of the fib751000. In all samples, carbon and oxygen lines dominate. As expected, intense Ti lines are also observed in fib751000 sample. A small amount of silicon was observed in the reference sample. Most probably this issue is a consequence of contamination during the sample preparation (maybe in the oven used for the drying of fibers after extraction from plants).
The results of the composition analysis are given in Table 3. The composition of the reference sample clearly shows a much lower presence of oxygen than expected for cellulose. The reason for that might be an inefficient mercerization, resulting in partially removed lignin, wax, xylem, and hemicellulose, but also in surface contamination by adventitious carbon due to the air exposure of the sample.
Deposition of TiO2 practically doubles the amount of oxygen in all samples. While this can be possibly justified by the formation of TiO2 in fib751000 sample (characterized by significant a quantity of Ti), this is not the case for other samples exposed to the chemically reactive atmosphere during the TiO2 deposition. This fact can be interpreted in three ways: a) the reactive atmosphere during the deposition process contribute to significant surface oxidation [26] of the organic material; b) the reactive atmosphere in the magnetron chamber etches (probably chemically) adventitious carbon from the surface and ‘opens’ oxygen-rich phases [27] laying below the carbon-rich surface layer; c) after the magnetron sputtering the samples are able to adsorb more water [28,29] which is strongly bonded so that it remains at the surface in vacuum. Some insight into the probability of the three scenarios could give bond identification.

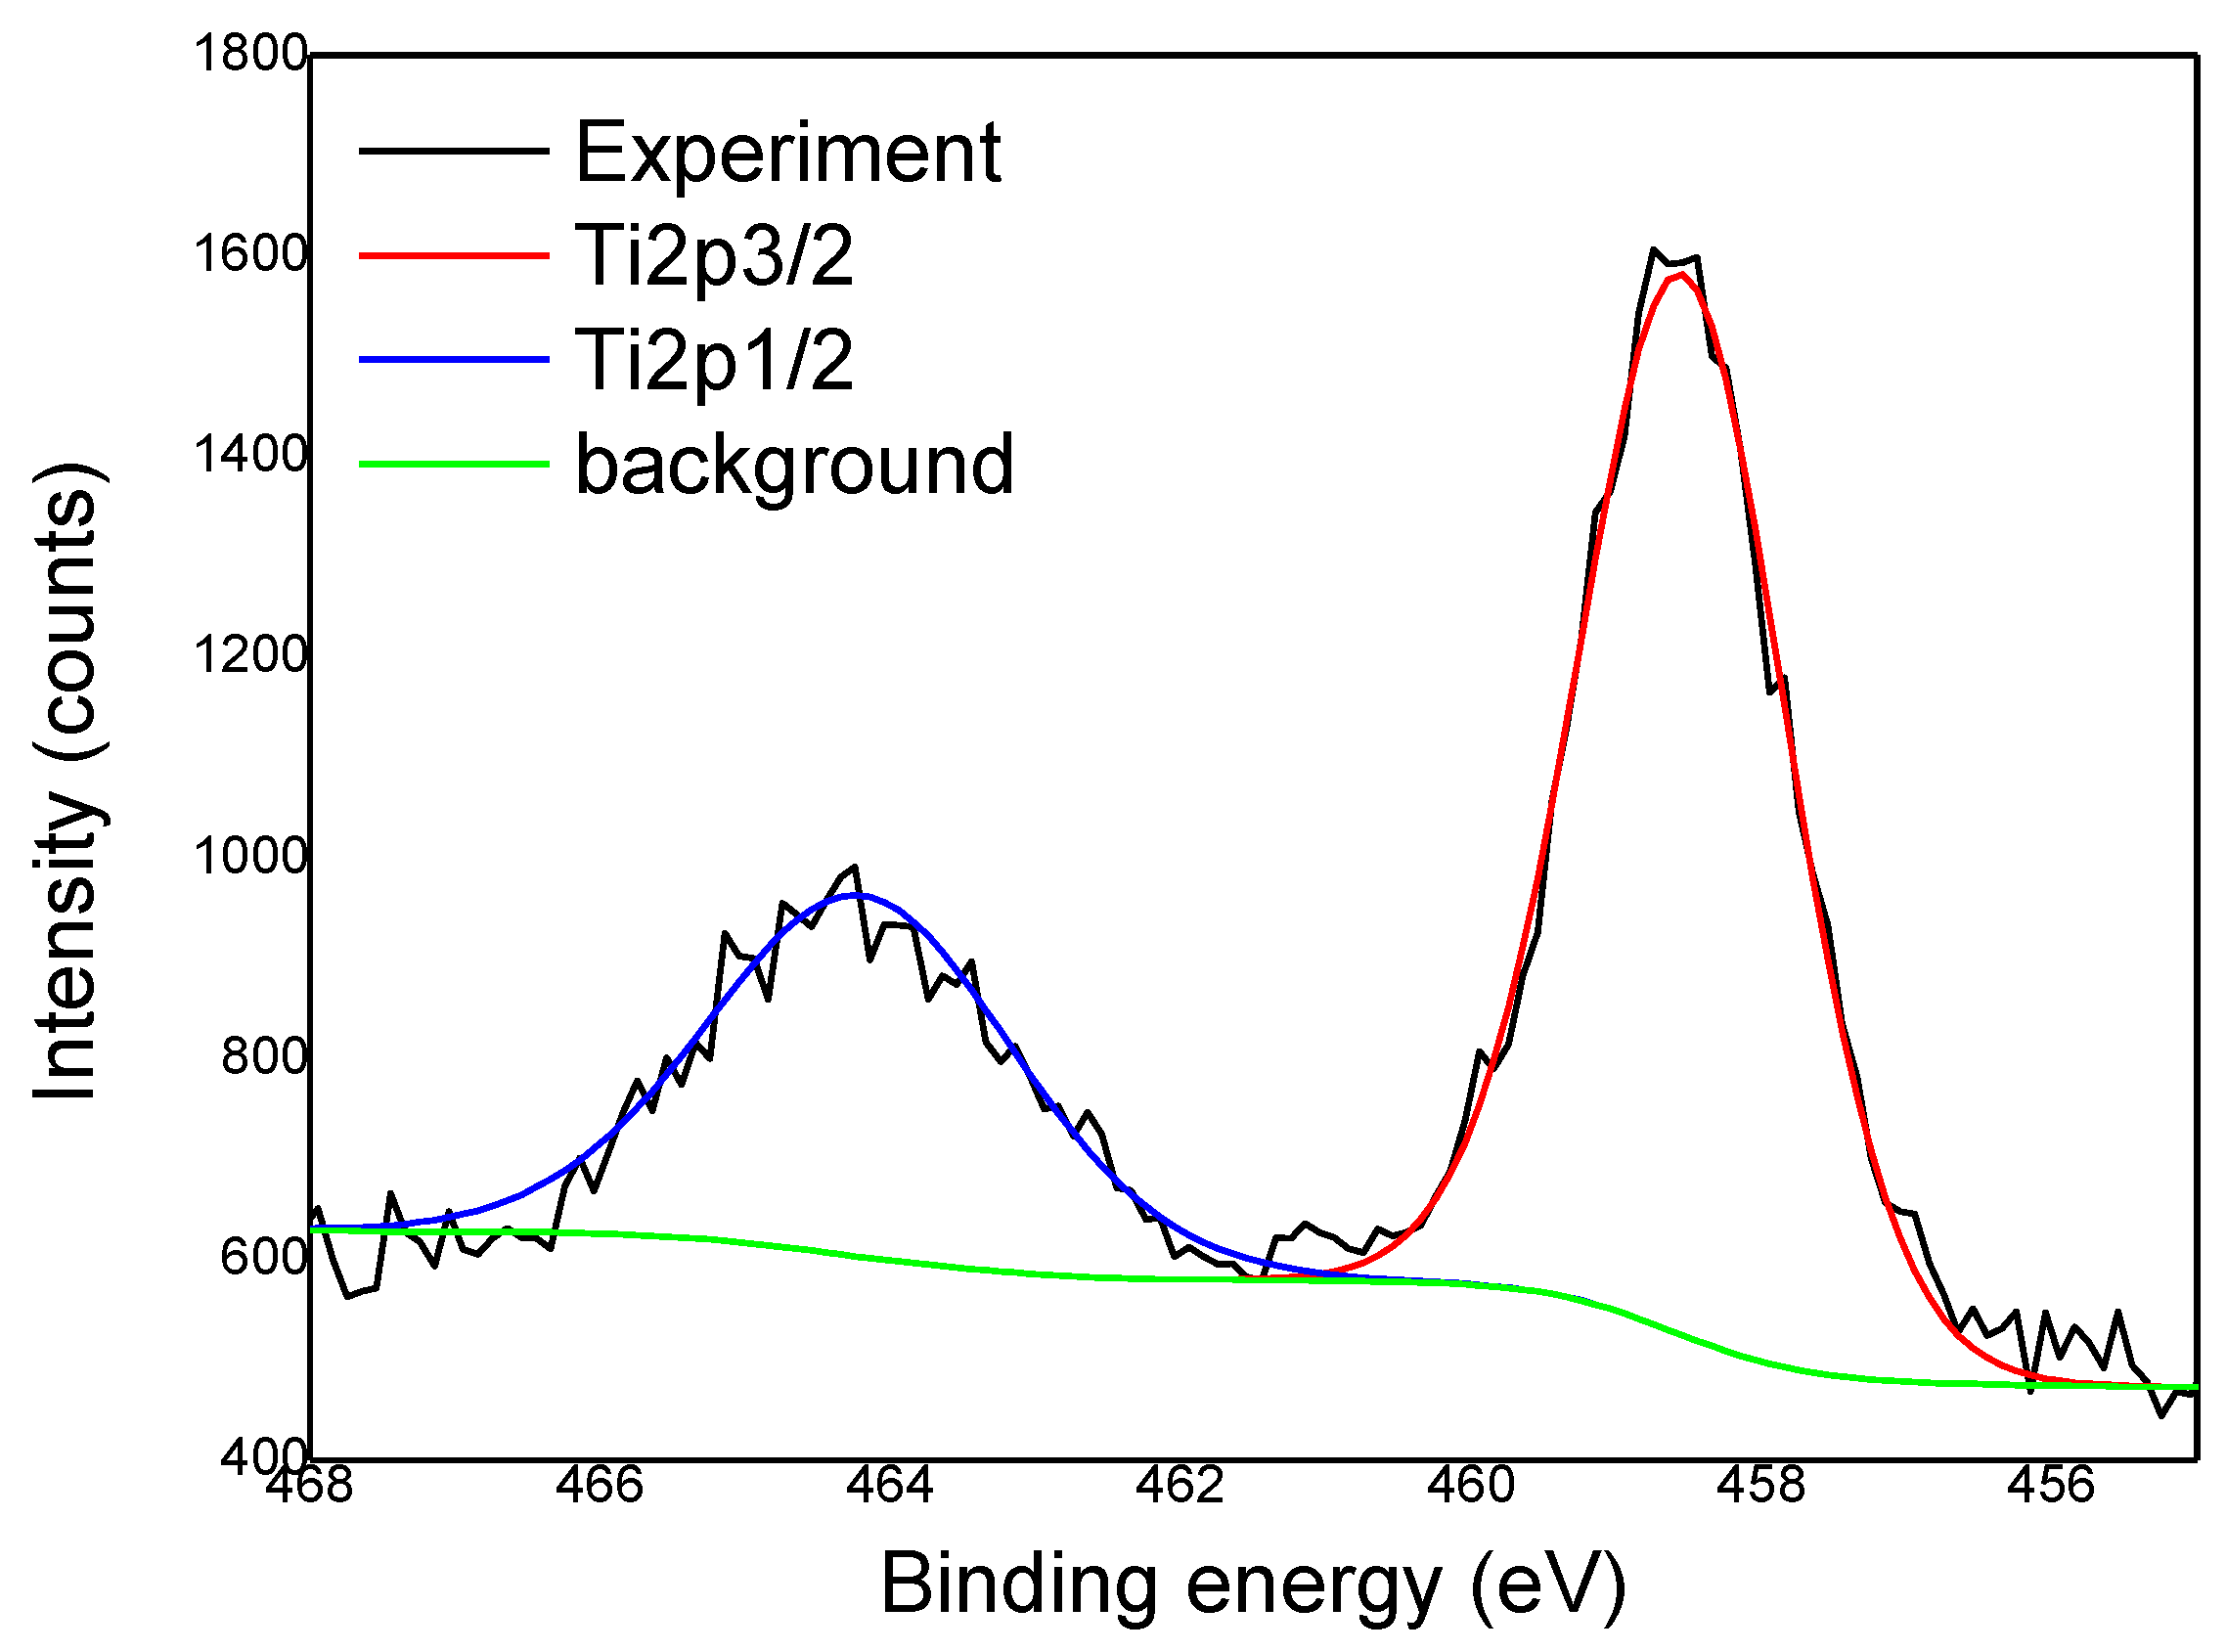
Detailed Analysis of High-Resolution Spectra

  • Sample Fiberf
Chemical bonds in cellulose-like materials are mainly identified from the fitting of the C 1s line. Typically, this line has four contributions attributed to a) C–C and C–H bonds at ~284.8 eV, b) C–OH and C–O–C bonds at ~286.3 eV, c) O–C–O bonds at ~288.0 eV, and d) COO carboxyl group at about 289.5 eV [30,31]. C–C and C–H bonds can be originated (also) from common organic surface impurities. While the latter is the dominant contribution of C 1s line in non-organic samples, here it is usually of lower intensity than the contribution at about 286.3 eV.
Having in mind the expected structure of the C 1s line of cellulose-like materials, shown in Figure 4, it can be assumed that the line contribution C1 with lowest binding energy was originated from saturated hydrocarbons, i.e., C–C and C–H bonds. Under this assumption, the binding energy correction was performed by considering that the contribution C1 is at 284.8 eV. These results in rather consistent positions of all photoelectron lines, thus supporting the applied binding energy reference. In the case of the C 1s line, four contributions were observed that can be attributed to those mentioned above, typical for cellulose. O 1s line can be fitted to two contributions: the dominant one at 533.9 eV could be attributed to adsorbed water [31], while the one at 532.7 eV fits well with C–OH bonds [27]. It should be also stated that carboxyl group, observed in C 1s line, has typically two contributions that fit well with O1 and O2. Finally, O–C–O should be in-between O1 and O2 [30] (see Table 4).
  • Samples with Deposited TiO2
All measured Ti 2p lines clearly show the presence of a single-phase, as can be seen from Figure 5 depicting a high resolution spectrum of Ti 2p line taken from sample fib751000. This proves the existence of a single Ti phase present, namely TiO2.
Unlike the previous sample, those deposited by TiO2 were affected by strong non-uniform charging, which is directly reflected on the reliability of the bond identification. Typically, the sample surface can be divided into the regions covered with TiO2 and those covered with organic material. These two areas are on different potentials due to the different X-ray induced secondary electron emission yields, and due to the overall low conductivity of samples. Consequently, their binding energy shifts are generally different. This problem was tackled by introducing two charging references: Ti 2p3/2 is assumed to be at 458.5 eV, which is characteristic for TiO2 phase [32]; the contribution of the C 1s line with the smallest binding energy is assumed to be adventitious carbon at 284.8 eV. While the C 1s and Ti 2p lines can be indeed considered separately (since they can be originated from different surface areas) this is not the case with oxygen, which is found in both areas. At TiO2 areas the energy of the O 1s line is expected to be at about 529.7 eV [32]. Therefore, both binding energy references were used in the analysis of the O 1s line: the energy reference of each line contribution was chosen in such way to provide the highest consistency with the interpretations of the corresponding Ti 2p and C 1s lines. O 1s line was fitted to two contributions (O1 and O2) attributed to organic areas, and an additional contribution O3 related to TiO2. It is important to point out that this approach introduces additional uncertainties in the O 1s line interpretation.
The fitting results of the photoelectron lines are summarized in Table 4. The positions of the contributions, determined using the Ti 2p line as a reference, are denoted by an asterisk. The simplest situation is obtained in the case of the fib75500 sample. Four contributions typical for cellulose-like materials are identified in the C 1s line, just as in the reference sample. This interpretation is supported by the positions and relative intensities of the O1 and O2 contributions: they are practically the same as the corresponding contributions in the reference sample. The contribution of O3 fits perfectly to the expected position for TiO2. It appears that the C2 (i.e., C–OH) contribution dropped, while all other contributions increased.
The sample fib751000, with the highest amount of Ti, is characterized by a dramatic change of the C 1s line shape. It can be fitted to only two contributions of roughly equal intensity, which correspond well to the contributions C1 (saturated hydrocarbons) and C3 (O–C–O bonds), respectively. The oxygen line can be fitted to the dominant O1 contribution, accompanied by low-intensity O2 contribution. In this case, it was attributed the contribution O1 to O–C–O bonds, although its position is about 0.3 eV below that expected for this group [30] since the C–OH contribution is absent in the C 1s line. The absence of the contribution O3 in spite of the intense Ti 2p line (cf. Table 3) is only apparent: the position of O3 contribution (the position of which can be predicted from the Ti 2p3/2 line position) coincides with that of O1. The contribution of O2 is most probably related to the adsorbed water.
In the case of the samples fib50500 and fib501000, the amount of Ti is small with respect to that of O. Therefore, in the peak fitting of the O 1s line, the contributions should be mainly related to different kinds of C–O bonds (or adsorbed water). C 1s line of both samples can be readily fitted to four contributions, although the positions shifted in respect to those of the reference sample. Closer inspection reveals that the contributions C2-4 are systematically shifted for 1.0 eV towards higher binding energy as compared to the same peaks in samples fiberf and fib75500 (cf. Table 4), which indicates non-uniform sample charging. This is additionally supported by the positions of the contributions O1 and O2 of the sample fib501000, which are also shifted for about 1 eV in respect to the same contributions in samples fiberf and fib75500. Although the positions of O3 contribution of the fib501000 sample fits perfectly to TiO2, this contribution cannot be solely attributed to the titania phase having in mind relative intensities of the Ti 2p line and the O3 contribution (cf. Table 3 and Table 4). Part of the O3 contribution should be originated from organic areas, and therefore have a binding energy of about 532.3 eV. Consequently, the later can be attributed to C–O–C or C=O bonds [30]. From that perspective, it appears that the contributions O1 and O3 of the fib50500 sample coincide with those of the fib501000 sample. At the same time, the contribution O2, attributed to the adsorbed water, is missing in fib50500.
In spite of the limited reliability of the fittings with a high-resolution spectra due to the non-uniform charging, the obtained results give strong hints on the character of oxygen bonding in the samples. During the deposition process, the increase of the oxygen content takes place due to the two main reasons: deposition of TiO2, and oxidation of the organic material. The latter is clear from the increase of the contributions C3 and C4, attributed to O–C–O and COO groups, after the deposition. The exception from this trend is sample fib751000, in which the contributions C2 (typical for cellulose) and C4 disappeared after the deposition. However, this sample is characterized by the conceivably highest amount of deposited TiO2, which in total contributes to high oxygen amount at the surface.

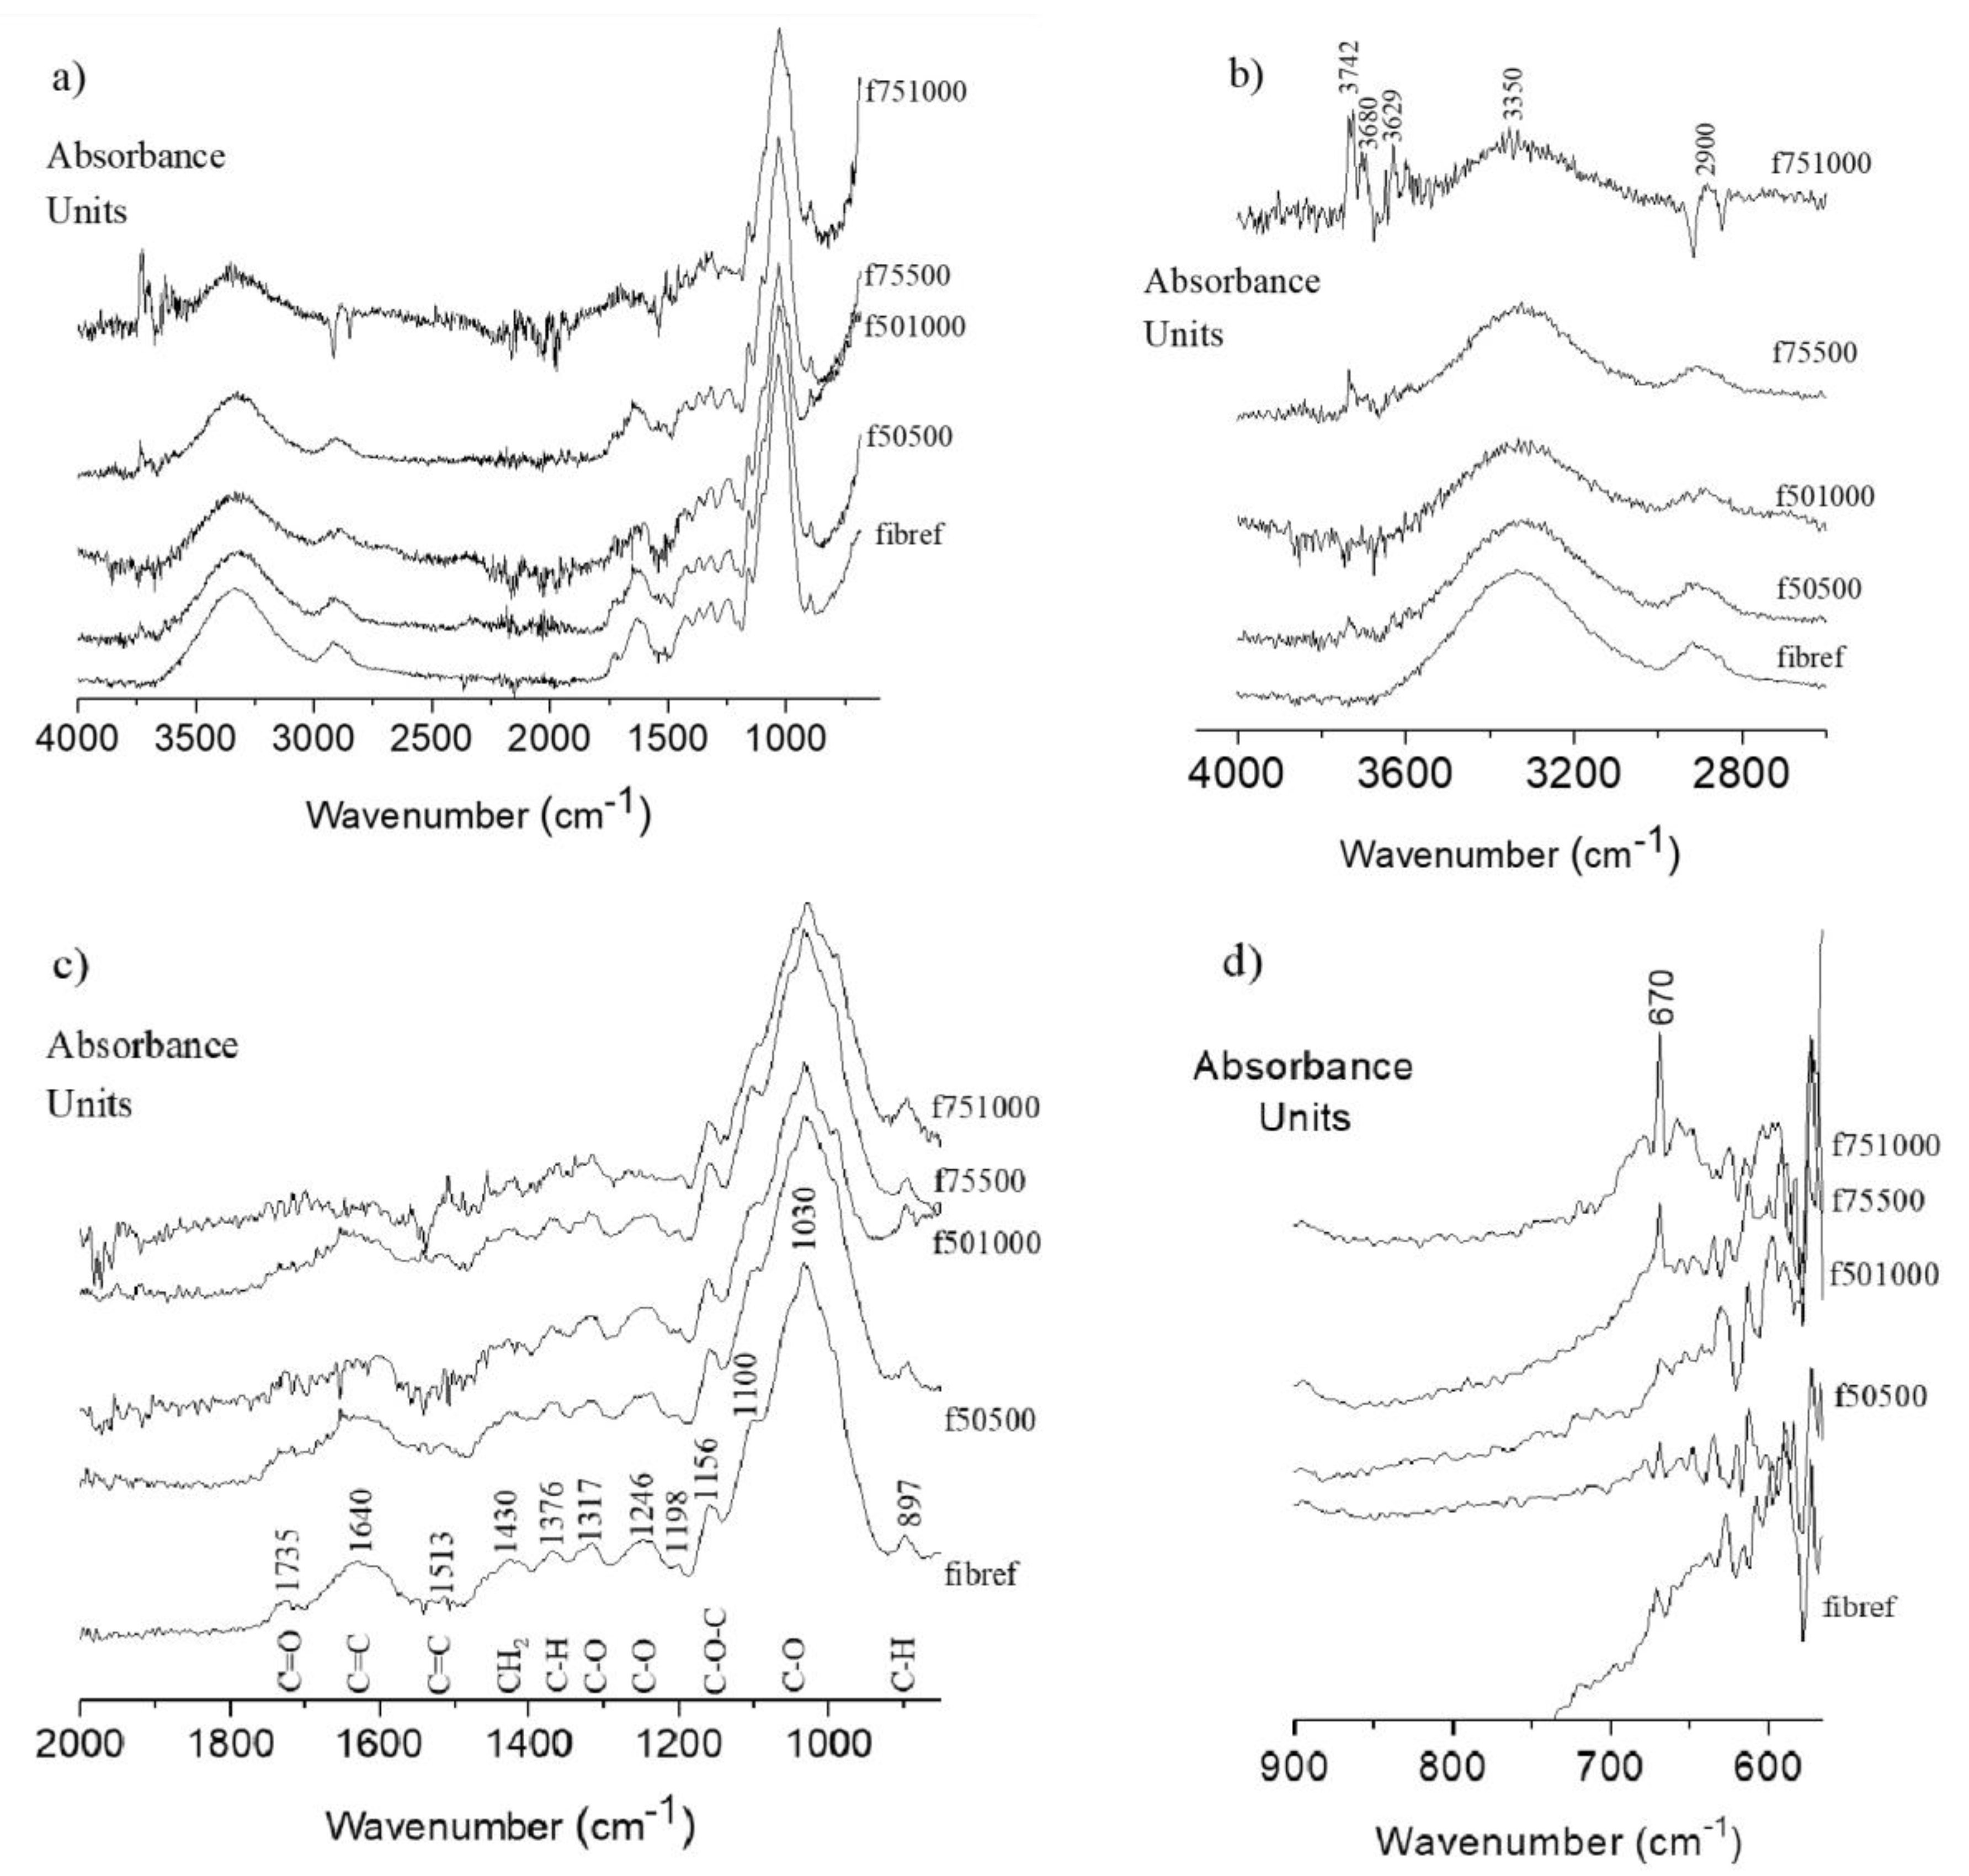
3.3. FTIR-ATR—Surface Functional Group Analysis

Figure 6 shows a sequence of normalized FTIR-ATR spectra for fiberf and TiO2 sputtered ginger lily fibers. The analysis of the spectrum in Figure 6a reveals bands in the 4000–750 cm−1 range, attributed, respectively, to the –OH and CH stretching vibrations of the cellulose groups in the 4000–2700 cm−1 range, detailed in Figure 6b, and to stretching vibrations corresponding to cellulose, hemicellulose and lignin in the 2000–850 cm−1 range, detailed in Figure 6c. Within the quality of the IR signal achievable in the 900–500 cm−1 range, the presence of the Ti–O band also shows evidence for TiO2 formation (Figure 6d). In a recent publication, the Ti–O stretching band between 640 and 700 cm−1, with a shape and position very similar to that of the present study, was highlighted in a study of deposition of TiO2 films on Al2O3 substrates [33]. In an earlier work, we have acquired the FTIR-ATR spectrum of the ‘as-obtained’ ginger lily fibers, just after chemical extraction and the infrared absorbance bands of the ginger lily fibers have been assigned [7].
In Figure 6b, the region of the broad absorption band at 3350 cm−1 for all fibers is characterized by O–H stretching and H fixed to the bond structure that generally contains the highest functional groups of cellulose. Compared with the fiberf, the peak at 3350 cm−1 (O–H stretching) and 2900 cm−1 (CH2 asymmetrical stretching) for all the sputtered fibers are weakened and, in particular, that of f751000 at 3350 cm−1 is more weak, indicating differences in the concentration of OH groups on the surface in the f751000 sample. In addition, is a general feature of TiO2 surfaces to retain adsorbed water molecules, which are linked to the Ti4+ Lewis acidic sites. Furthermore, the results suggest that the amount of water bonded to the surface of the samples changes, which indicates differences in the acidity of the Ti4+ Lewis sites between the samples. However, since the OH region at 3350 cm−1 is a combination of the contribution of OH groups from water molecules as well from cellulose polymer OH groups and Ti–OH, is not possible identify exactly the occurrence of Ti–OH vibrations. Nevertheless, additional peaks groups in the 3600–3700 cm−1 region for the fiber f751000, usually assigned to adsorption of water vapor (free H2O) and gaseous CO2 in normal air, present on the surface of titania, have been correlated with Lewis acidity of Ti4+ in TiO2 and Ti3+–OH [34,35,36,37]. Our XPS results also reveals a hygroscopic fiber behavior after TiO2 deposition. The water adsorption on TiO2 surface can result from the presence of OH groups, as well as from the existence of stronger electron-acceptor centers, namely, coordinate non-saturated Ti4+ [29]. The higher xylan content in ginger lily fibers (fiberf) is evidenced in Figure 6c by a stronger carbonyl band at 1735 cm−1. The enhanced carbonyl absorption peak at 1735 cm−1 (C=O ester), C–H absorption at 1376 cm−1 and –C–O–H stretching band at 1246 cm−1 confirmed the presence of the ester bonds detected by XPS. Additionally, there are slight changes in the intensities of the signals at the absorption bands at 1430, 1376, 1317, 1030, and 897 cm−1 which belong to stretching and bending vibrations of –CH2, –CH, C–OH, and C–O bonds in cellulose. The IR absorption band at 1640 cm−1 indicates the O–H bending mode of water, which goes accordingly with previous works [7] where the water absorbed was in the cellulose or hemicellulose.
Moreover, the FTIR spectra of Figure 6d provide clear evidence that TiO2 is attached to the surface of ginger lily fibers. The peak between 800 and 450 cm−1, at 670 cm−1, is intensified in sample f751000, which is assigned to the Ti–O stretching band which is the characteristic peak of TiO2 [33,38]. This is attributed to the formation of O–Ti bonds between the impinging species from the target (atomic Ti, molecular TiO, molecular TiO2) [23] and negative ions (O) that link to ginger lily fibers, probably by hydrogen bonding or van der Waals forces [18].

4. Conclusions

In this work, five samples of natural based-cellulosic fibers extracted from stems of the ginger lily plant (Hedychium gardnerianum) were investigated. FTIR and XPS results show that sputtered TiO2 films are attached to the ginger lily fibers.
A typical strategy in XPS analysis of these samples is related to the fitting of the C 1s line to four contributions related to a) C–C and C–H bonds, b) C–OH and C–O–C bonds, c) O–C–O bonds, and d) COOH group. The reference sample falls into this scheme: both, composition analysis and the C 1s line fitting reveal that the C–OH group is not dominant, which means that no pure cellulose is present at the surface. Deposition of TiO2 yielded in non-uniform charging, which was tackled by introducing two binding energy references: one for the TiO2 regions and the other for the organic region. The main conclusions of the XPS analysis can be summarized as follows:
  • In the case of the fib75500 sample, it is clearly observed TiO2 signal in both Ti 2p and O 1s lines, while the organic region kept the general structure of the reference sample with the exception that the relative amount of C–OH component (contribution C2) decreased.
  • The TiO2 content in fib751000 sample is several times greater than in other samples. The organic region consists mainly of saturated hydrocarbons and O–C–O bonds with a small quantity of adsorbed water. As for the previous sample, TiO2 deposition is accompanied by the drop or even disappearance of C–OH bonds from the surface. This implies that OH groups (including cellulose surface) may serve as nucleation sites for TiO2 growth.
  • In the case of fib501000 sample, the amount of TiO2 is comparable to fib75500 (~3 % of Ti), while the amount of Ti in fib50500 is only 1.2 %. C 1s line in both samples can be fitted to the same four contributions, although those related to oxygen bonds are shifted in energy due to the non-uniform charging of organic areas. At the same time, the amount of O in these samples is almost doubled with respect to the reference sample. Apart from the increase the content of oxygen-rich bonds (attributed to contributions C3 and C4) an additional bond seems to appear with the O 1s line at about 532 eV. The later could be attributed to C–O–C or C=O bonds.
FITR-ATR spectrum provided clear evidence that TiO2 is physically bonded to the surface of ginger lily fibers, which is probably due to a strong interaction between the hydroxyl groups of cellulose and the TiO2 films on the fiber surface.

Author Contributions

Conceptualization, T.E. and H.C.V.; Methodology, T.E., S.S., and N.B.; Formal analysis, S.S., N.B., O.M.N.D.T., and H.C.V.; Investigation, T.E., S.S., and N.B.; Data curation, H.C.V.; Writing—original draft preparation, S.S., N.B., O.M.N.D.T., and H.C.V.; Writing—review and editing, S.S. and H.C.V.; Supervision, H.C.V.; Project administration, H.C.V.; Funding acquisition, all authors. All authors have read and agreed to the published version of the manuscript.

Funding

This research was funded by: (1) FEDER, through Programa Operacional Factores de Competitividade − COMPETE and Fundação para a Ciência e a Tecnologia – FCT by the project UID/FIS/00068/2019; (2) FEDER, through POACORES - Valorização e Desenvolvimento de Produtos da Conteira (Hedychium gardnerianum) - 01-0247-FEDER-000011; (3) Regional Government of the Azores-Fundo Regional da Ciência e Tecnologia (Fellowship M3.1.a/F/040/2015).

Conflicts of Interest

The authors declare no conflict of interest.

References

  1. Mohanty, A.K.; Misra, M.; Drzal, L.T. Sustainable Bio-composites from renewable resources: Opportunities and challenges in the green materials world. J. Polym. Environ. 2002, 10, 19–26. [Google Scholar] [CrossRef]
  2. Yang, J.; Ching, Y.C.; Chuah, C.H. Applications of Lignoccellulosic Fibers and Lignin in Bioplastics: A Review. Polymers 2019, 11, 751. [Google Scholar] [CrossRef] [Green Version]
  3. Cheung, H.; Ho, M.; Lau, K.; Cardona, F.; Hui, D. Natural fibre-reinforced composites for bioengineering and environmental engineering applications. Comp. Part B 2009, 40, 655–663. [Google Scholar] [CrossRef]
  4. Sanjay, M.R.; Arpítha, G.R.; Naik, L.L.; Gopalakrisha, K.; Yogesha, B. Applications of Natural Fibers and its Composites: An Overview. Nat. Resour. 2016, 7, 108–114. [Google Scholar] [CrossRef] [Green Version]
  5. Arias Arias, F.E.; Beneduci, A.; Chidichimo, F.; Furia, E.; Straface, S. Study of the adsorption of Mercury (II) on lignocellulosic materials under static and dynamic conditions. Chemosphere 2017, 180, 11–23. [Google Scholar] [CrossRef] [PubMed]
  6. Ramamoorthy, S.K.; Skrifvars, M.; Persson, A. A Review of Natural Fibers used in biocomposites: Plant, animal, and regenerated cellulose fibers. Polym. Rev. 2015, 55, 107–162. [Google Scholar] [CrossRef]
  7. Eleutério, T.; Pinto, A.S.; Pereira, M.J.; Vasconcelos, H.C. Preliminary Structural and Thermal Characterization of Conteira’s (Hedychium gardnerianum) fibers for further functionalization with silica colloidal nanoparticles. Procedia Eng. 2017, 200, 162–169. [Google Scholar] [CrossRef]
  8. Csurhes, S.; Hannan-Jones, M. Kahili ginger (Hedychium gardnerianum), white ginger (Hedychium coronarium), yellow ginger (Hedychium flavescens). In Invasive Plant Risk Assessment; Department of Agriculture and Fisheries Biosecurity: Queensland, Australia, 2008; Volume 1, pp. 1–20. [Google Scholar]
  9. Tursi, A. A review on biomass: Importance, chemistry, classification, and conversion. Biofuel Res. J. 2019, 22, 962–979. [Google Scholar] [CrossRef]
  10. Varshney, V.K.; Naithani, S. Chemical Functionalization of Cellulose derived from nonconventional sources. Chap. 2. In Cellulose Fibers: Bio and Nano Polymer Composites, 1st ed.; Springer: Berlin, Germany, 2011; pp. 43–60. [Google Scholar]
  11. Gonzalez, A.V.; Cervantes-Uc, J.M.; Olayo, R.; Franco, P.J.H. Effect of fiber surface treatment on the fiber- matrix bond strength of natural fiber reinforced composites. Compos. Part B Eng. 1999, 30, 309–320. [Google Scholar] [CrossRef]
  12. Bledzki, A.K.; Reihmane, S.; Gassan, J. Properties and modification methods for vegetable fibers for natural fiber composites. J. Appl. Polym. Sci. 1996, 59, 1329–1336. [Google Scholar] [CrossRef]
  13. Wongsriraksa, P.; Togashi, K.; Nakai, A.; Hamada, H. Continuous Natural Fiber Reinforced Thermoplastic Composites by Fiber surface modification. Adv. Mech. Eng. 2013, 1, 1–6. [Google Scholar] [CrossRef]
  14. Tudor, I.A.; Petriceanu, M.; Piticescu, R.R.; Predescu, C. Hydrothermal synthesis of doped ZnO and TiO2 nanomaterials: Opportunities for textile applications. Ser. B Chem. Mater. Sci. 2014, 76, 207–215. [Google Scholar]
  15. De Vietro, N.; Tursi, A.; Beneduci, A.; Chidichimo, F.; Milella, A.; Fracassi, F.; Chatzisymeon, E.; Chidichimo, G. Photocatalytic inactivation of Escherichia coli bacteria in water using low pressure plasma deposited TiO2 cellulose fabric. Photochem. Photobiol. Sci. 2019, 18, 2248–2258. [Google Scholar] [CrossRef] [PubMed]
  16. Marques, P.A.A.P.; Trindade, T.; Neto, C.P. Titanium dioxide/cellulose nanocomposites prepared by a controlled hydrolysis method. Compos. Sci. Technol. 2006, 66, 1038–1044. [Google Scholar] [CrossRef]
  17. Xu, Y.; Xu, W.; Huang, F. Surface and Interface Analysis of Fibers Sputtered with Titanium Dioxide. J. Eng. Fibers Fabr. 2012, 7, 1–6. [Google Scholar] [CrossRef] [Green Version]
  18. Xie, Y.; Zhang, X.; Liu, Q.; Shu, S. Preparation and Characterization of Composite TiO2/Natural Cotton Nanofiber Material. Adv. Mater. Res. 2013, 800, 44–47. [Google Scholar] [CrossRef]
  19. Li, X.; Tabil, L.G.; Panigrahi, S. Chemical Treatments of Natural Fiber for Use in Natural Fiber-Reinforced Composites: A Review. J. Polym. Environ. 2007, 15, 25–33. [Google Scholar] [CrossRef]
  20. Teodoro, O.M.N.D.; Silva, J.M.A.C.; Moutinho, A.M.C. Multitechnique surface analysis system: Apparatus description. Vacuum 1995, 46, 1205–1209. [Google Scholar] [CrossRef]
  21. Wagner, C.D.; Davis, L.E.; Zeller, M.W.; Taylor, J.A.; Raymond, R.M.; Gale, L.H. Empirical atomic sensitivity factors for quantitative analysis by electron spectroscopy for chemical analysis. Surf. Interface Anal. 1981, 3, 211–225. [Google Scholar] [CrossRef]
  22. Sério, S.; Jorge, M.E.M.; Maneira, M.J.P.; Nunes, Y. Influence of O2 partial pressure on the growth of nanostructured anatase phase TiO2 thin films prepared by DC reactive magnetron sputtering. Mater. Chem. Phys. 2011, 126, 73–81. [Google Scholar] [CrossRef]
  23. Toku, H.; Pessoa, R.S.; Maciel, H.S.; Massi, M.; Mengui, U.A. The effect of oxygen concentration on the low temperature deposition of TiO2 thin films. Surf. Coat. Technol. 2008, 202, 2126–2131. [Google Scholar] [CrossRef]
  24. Hippler, R.; Cada, M.; Stranak, V.; Hubicka, Z. Ion formation in an argon and argon-oxygen gas mixture of a magnetron sputtering discharge. J. Phys. Commun. 2019, 3, 1–9. [Google Scholar] [CrossRef]
  25. Cormier, P.-A.; Balhamri, A.; Thomann, A.-L.; Dussart, R.; Semmar, N.; Lecas, T.; Snyders, R.; Konstantinidis, S. Titanium oxide thin film growth by magnetron sputtering: Total energy flux and its relationship with the phase constitution. Surf. Coat. Technol. 2014, 254, 291–297. [Google Scholar] [CrossRef]
  26. Feng, B.; Chen, J.Y.; Qi, S.K.; Zhao, J.Z.; Zhang, X.D. Characterization of surface oxide films on titanium and bioactivity. J. Mater. Sci. Mater. Med. 2002, 13, 457–464. [Google Scholar] [CrossRef] [PubMed]
  27. Peng, J.; Xu, Z.; Wang, S.; Jie, Q.; Chen, C. Preparation and Performance of Nickel Oxide Films by Ion Beam Sputtering Deposition and Oxidation Annealing. Sens. Mater. 2010, 22, 409–416. [Google Scholar]
  28. Jaya, H.; AbdulKadir, H.K.; Noriman, N.Z.; Dahham, O.S.; Mazelan, A.H.; Latip, N.A.; Aini, A.K. The influences of chicken feathers loading on tensile and physical properties of R-Hdpe/Eva/CffComposites. Mater. Sci. Eng. 2018, 454, 1–10. [Google Scholar]
  29. Bredzona, T.; Puchkovska, G.; Shymanovska, V.; Baran, J.; Ratajczak, H. IR-Analysis of H-Bonded H2O on the Pure TiO2 Surface. J. Mol. Struct. 2004, 700, 175–181. [Google Scholar]
  30. Beamson, G.; Briggs, D. Appendices 3.1 and 3.2. In High Resolution XPS of Organic Polymers; The Scienta ESCA300 Database; Wiley: New York, NY, USA, 1992; Volume 1, pp. 1–295. [Google Scholar]
  31. Payne, B.P.; Biesinger, M.C.; McIntyre, N.S. The study of polycrystalline nickel metal oxidation by water vapour. J. Electron Spectrosc. Relat. Phenom. 2009, 175, 55–65. [Google Scholar] [CrossRef]
  32. Biesinger, M.C.; Lau, L.W.M.; Gerson, A.R.; Smart, R.S.C. Resolving surfaxe chemical states in XPS analysis of first row transition metals, oxide and hydroxides: Sc, Ti, V, Cu and Zn. Appl. Surf. Sci. 2010, 257, 887–898. [Google Scholar] [CrossRef]
  33. Švagelj, Z.; Mandić, V.; Ćurković, L.; Biošić, M.; Žmak, I.; Gaborardi, M. Titania-Coated Alumina Foam Photocatalyst for Memantine Degradation Derived by Replica Method and Sol-Gel Reaction. Materials 2020, 13, 227. [Google Scholar] [CrossRef] [Green Version]
  34. Siddick, S.Z.; Lai, C.W.; Juan, J.C. An investigation of the dye-sensitized solar cell performance using graphene-titania (TrGO) photoanode with conventional dye and natural green chlorophyll dye. Mater. Sci. Semicond. Process. 2018, 74, 267–276. [Google Scholar] [CrossRef]
  35. Deiana, C.; Fois, E.; Coluccia, S.; Martra, G. Surface Structure of TiO2 P25 Nanoparticles: Infrared Study of Hydroxy Groups on Coordinative Defect Sites. J. Phys. Chem. C 2010, 114, 21531–21538. [Google Scholar] [CrossRef]
  36. Vuk, A.Š.; Ješe, R.; Orel, B.; Dražc, G. The effect of surface hydroxyl groups on the adsorption properties of nanocrystalline TiO2 films. Int. J. Photoenergy 2005, 7, 163–168. [Google Scholar] [CrossRef] [Green Version]
  37. Finnie, K.S.; Cassidy, D.J.; Bartlett, J.R.; Woolfrey, J.L. IR Spectroscopy of Surface Water and Hydroxyl Species on Nanocrystalline TiO2 Films. Langmuir 2001, 17, 816–820. [Google Scholar] [CrossRef]
  38. Ba-Abbad, M.M.; Kadhum, A.A.H.; Mohamad, A.B.; Takriff, M.S.; Sopian, K. Synthesis and catalytic activity of TiO2 nanoparticles for photochemical oxidation of concentrated chlorophenols under direct solar radiation. Int. J. Electrochem. Sci. 2012, 7, 4871–4888. [Google Scholar]
Figure 1. SEM micrographs from the surface morphology of Hedychium gardnerianum fibers.
Coatings 10 00287 g001
Figure 2. SEM micrographs from the surface morphology of the TiO2 films deposited on GS.
Coatings 10 00287 g002
Figure 3. XPS survey spectra taken from samples (a) fiberf and (b) fib751000.
Coatings 10 00287 g003
Figure 4. High-resolution XPS spectrum of the line C 1s taken from the sample fiberf and the corresponding fitting. The overall C 1s line structure agrees with the C 1s line of typical cellulose-like materials.
Coatings 10 00287 g004
Figure 5. High-resolution XPS spectrum of the line Ti 2p taken from sample fib751000, and the corresponding fitting. We used the constraint concerning the intensity ratio (Ti 2p3/2:Ti 2p1/2 = 2:1).
Coatings 10 00287 g005
Figure 6. FTIR spectra of fiberf and the TiO2 sputtered ginger lily fiber samples, recorded over the ranges: (a) 4000–750 cm−1, (b) 4000–2700 cm−1, (c) 2000–850 cm−1 (d) 900–500 cm−1.
Coatings 10 00287 g006
Table 1. Sputtering conditions used in the growth of TiO2 films
SampleO2 Concentration
(%)
Voltage
(V)
Current
(A)
Sputtering Power
(W)
Deposition
Time (min)
fib50500504781.1450050
fib75500754741.1450050
fib501000505052.02100075
fib751000754982.07100075
Table 2. Thickness of TiO2 films
SampleO2 Concentration
(%)
Sputtering Power
(W)
Thickness
(nm)
Deposition Rate (Rd)
(nm/min)
fib5050050500160 ± 63.2
fib7550075500133 ± 42.7
fib501000501000333 ± 64.4
fib751000751000319 ± 84.3
Table 3. Results of the composition analysis
SampleC (%)O (%)Ti (%)
fiberf74.325.7-
fib7550053.442.54.1
fib75100052.538.98.6
fib5050060.438.41.2
fib50100047.748.24.1
Table 4. Fitting results
SampleC 1s Line (eV/%)O 1s Line (eV/%)Ti 2p3/2 (eV)
C1C2C3C4O1O2O3
fiberf284.8/
10.6
286.0/
61.2
287.6/
20.9
289.3/
7.3
532.7/
39.5
533.8/
60.5
--
fib75500284.8/
17.2
286.1/
43.0
287.7/
26.1
289.6/
13.7
532.7/
33.5
534.1/
53.0
529.8 */
14.5
458.5 *
fib751000284.8/
57.4
-287.9/
42.6
-532.7/
94.0
535.2/
6.0
-458.5 *
fib50500284.8/
15.4
287.0/
47.2
288.7/
24.4
290.6/
13.0
533.7/
64.4
-532.0/
35.6
458.5 *
fib501000284.8/
22.7
287.0/
32.3
288.7/
31.5
290.7/
13.4
533.8/
35.1
535.3/
29.4
529.6 */
35.4
458.5 *
* the binding energy reference is 458.5 eV for the position of the Ti 2p3/2 photoelectron line.

