Article

Adsorption Kinetics of a Cationic Surfactant Bearing a Two-Charged Head at the Air-Water Interface

by
Marcos Fernández Leyes
,
Santiago Gimenez Reyes
,
Ezequiel Cuenca
,
Jhon F. Sánchez Morales
and
Hernán Ritacco
*
Instituto de Física del Sur (IFISUR), Departamento de Física, Universidad Nacional del Sur (UNS), CONICET, Av. L. N. Alem 1253, B8000CPB—Bahía Blanca, Argentina
*
Author to whom correspondence should be addressed.
Coatings 2020, 10(2), 95; https://doi.org/10.3390/coatings10020095
Submission received: 19 December 2019 / Revised: 18 January 2020 / Accepted: 19 January 2020 / Published: 22 January 2020
(This article belongs to the Special Issue Fluid Interfaces)

Abstract

:
We studied the dynamics of adsorption at the air-water interface of a cationic surfactant bearing two charges, Gemini 12-2-12, at concentrations below and above the critical micelle concentration (cmc). We used maximum bubble pressure and Wilhelmy plate techniques in order to access all time scales in the adsorption process. We found that the adsorption dynamics are controlled by diffusion at the initial stage of the adsorption process (milliseconds) and it is kinetically controlled by an electrostatic barrier (minute) approaching the equilibrium surfactant surface concentration. Between these two extremes, we found several relaxation phenomena, all following exponential decays with characteristic times spanning from one to hundreds of seconds. By means of time-resolved surface potential measurements, we show that these processes involve charge redistribution within the interfacial region. The surface tension data are analyzed and interpreted in the framework of the free energy approach.

1. Introduction

The dynamics of adsorption-desorption of soluble surfactants at water-air interfaces play a very important role in many phenomena and technological applications such as wetting, detergency, emulsification, and foaming [1,2,3,4]. These processes express themselves in the time-dependent surface properties, such as surface tension (dynamic surface tension) and surface dilatational [3] and shear rheology [4]. Although, the phenomenon has been extensively studied, the physics of the adsorption-desorption dynamics of surfactants at fluid-fluid interfaces is far from completely understood [5]. For ionic surfactants, the adsorption dynamics deviates from the diffusion limited model developed by Ward and Tordai [6] in the 1940s. The origin of these deviations can be found in the presence of electrostatic adsorption barriers [7,8,9,10]. In a previous paper [10] we studied the adsorption kinetics of a cationic surfactant, dodecyltrimethylammonium bromide (DTAB), using dynamic surface tension measurements. It was found that the adsorption dynamics is controlled by diffusion (DLA) at very short adsorption times but it is kinetically limited (KLA), at times close to the equilibrium, by an electrostatic barrier built-up, as the ionic surfactant molecules adsorb onto the interface. In another very recent article, we explain the appearance of negative surface viscosities for a cationic Gemini surfactant, dimethylene-1,2-bis(dodecyldimethylammonium) bromide (G12-2-12), by the asymmetries found in the adsorption-desorption processes and dynamics [11]. The unphysical result (negative viscosities) is just an artifact due to the procedure used for data analysis, which is invalidated by the existence of those asymmetries.
In this article, we extend the study on G12-2-12 by systematically measuring the dynamic surface tension and time-resolved surface potential, trying to shed light on those processes, their origin, and mechanisms. We used the maximum bubble pressure technique in order to access the very short intermediate adsorption times and Wilhelmy plate technique [12], in order to study the long adsorption time dynamics and to obtain the equilibrium values. We explored the whole range of surfactant concentrations, from very dilute to twice the critical micelle concentration, cmc, of the surfactant. As mentioned, we also performed time-resolved surface potential measurements in the hope to elucidate the role played by charge redistribution within the interface, in the adsorption dynamics and the corresponding evolution of surface tension. We found very complex behavior, with several characteristic times, both for the dynamic surface tension and surface potential. For the more dilute solutions, the initial adsorption step is controlled by diffusion (DLA), and in the last part, close to the equilibrium, the adsorption is kinetically limited (KLA). Between those extremes, the adsorption involves several processes with different characteristic times, where the redistribution of charges at the interface is evident. The existence of these numerous processes is compatible with the observation of several characteristic times in compression surface rheology experiments [11]. The results presented here shed light on the role played by charge organization on the dynamics of adsorption of ionic surfactants.

2. Materials and Methods

2.1. Materials

The Gemini 12-2-12 surfactant (from now on, G12-2-12), was synthetized in our laboratory [13] following a slightly modified method employed by Zana et al. [14]. The success of the synthesis was confirmed by nuclear magnetic resonance (NMR) measurements. After synthesis and purification, the surfactant was kept under vacuum over dried silica to minimize water absorption before use. Milli-Q water (resistance >18.2 MΩ·cm) was used for the preparation of all solutions used in this work.

2.2. Methods

2.2.1. Equilibrium Surface Tension

Surface pressure measurements were performed using the sensor of a KSV LB-5000 Langmuir balance system (KSV-NIMA, Biolin Scientific, Spoo, Finland). The surface pressure is defined as Π = γ 0 γ , being γ0 and γ the surface tension of pure solvent, and solution, respectively. Disposable 20.6 mm paper (KSV-NIMA) or Pt-Wilhelmy probes were used. The measuring cell (10 cm3) is made of Teflon and the temperature was controlled by circulating water from a thermostat (Lauda ALPHA RA 8, Lauda-Königshofen, Germany) through a jacket placed at the bottom of the cell. The temperature near the surface is measured with a 0.01 °C precision using a calibrated Pt-100 sensor. All measurements were performed at 22 °C. For the measurements, the Teflon recipient is filled with an accurately measured amount of Mili-Q water, a small accurately measured amount of stock concentrated surfactant solution is then added to the water in order to prepare, in situ, the surfactant solution at the desired concentration. The solution is left for 60 min to stabilize before surface pressure measurements are carried out.

2.2.2. Dynamic Surface Tension

For very short and intermediate adsorption times (from milliseconds to hundreds of seconds), dynamic surface tension, γ(t), was measured by means of a homemade apparatus using the maximum bubble pressure technique (MBP). The setup is similar to the one described elsewhere [10,15] and is shown in Figure 1. The technique is based on the measurement of the maximum pressure needed to form a bubble at the tip of a capillary immersed in the surfactant solution. The pressure is related to the surface tension by the Young-Laplace equation [16], ∆P = 2γ/r being r the radius of the capillary. The device consists of a peristaltic pump which pressurizes a 1 dm3 air reservoir, an electrically controlled needle valve (Aalborg PSV1S-VA with its driver module PSV-D, Organgeburg, NY, USA) that controls the air flow to a micro-pipette tip (Sartorius Optifit 791000, Buenos Aires, Argentina) and acts as the capillary, and is placed 5 mm below the solution’s surface. The pressure difference, ∆P, inside the tip was measured with a differential pressure transducer (Cole-Palmer GY-98073-08, Vernon Hills, IL, USA) and transmitted using USB to a PC by a Teensy 3.2 microcontroller board. The Teensy board also senses and controls the reservoir pressure (pressure transducer Ashcroft G2-7-M02-15-G2-30G, Stanford, CT, USA) and the needle valve opening. The tip makes an angle of 30° with respect to the interface and is discarded after each measurement. Each tip is calibrated with pure water prior to measurement by measuring the ∆P as a function of depth, which is precisely controlled by means of the step-motor.

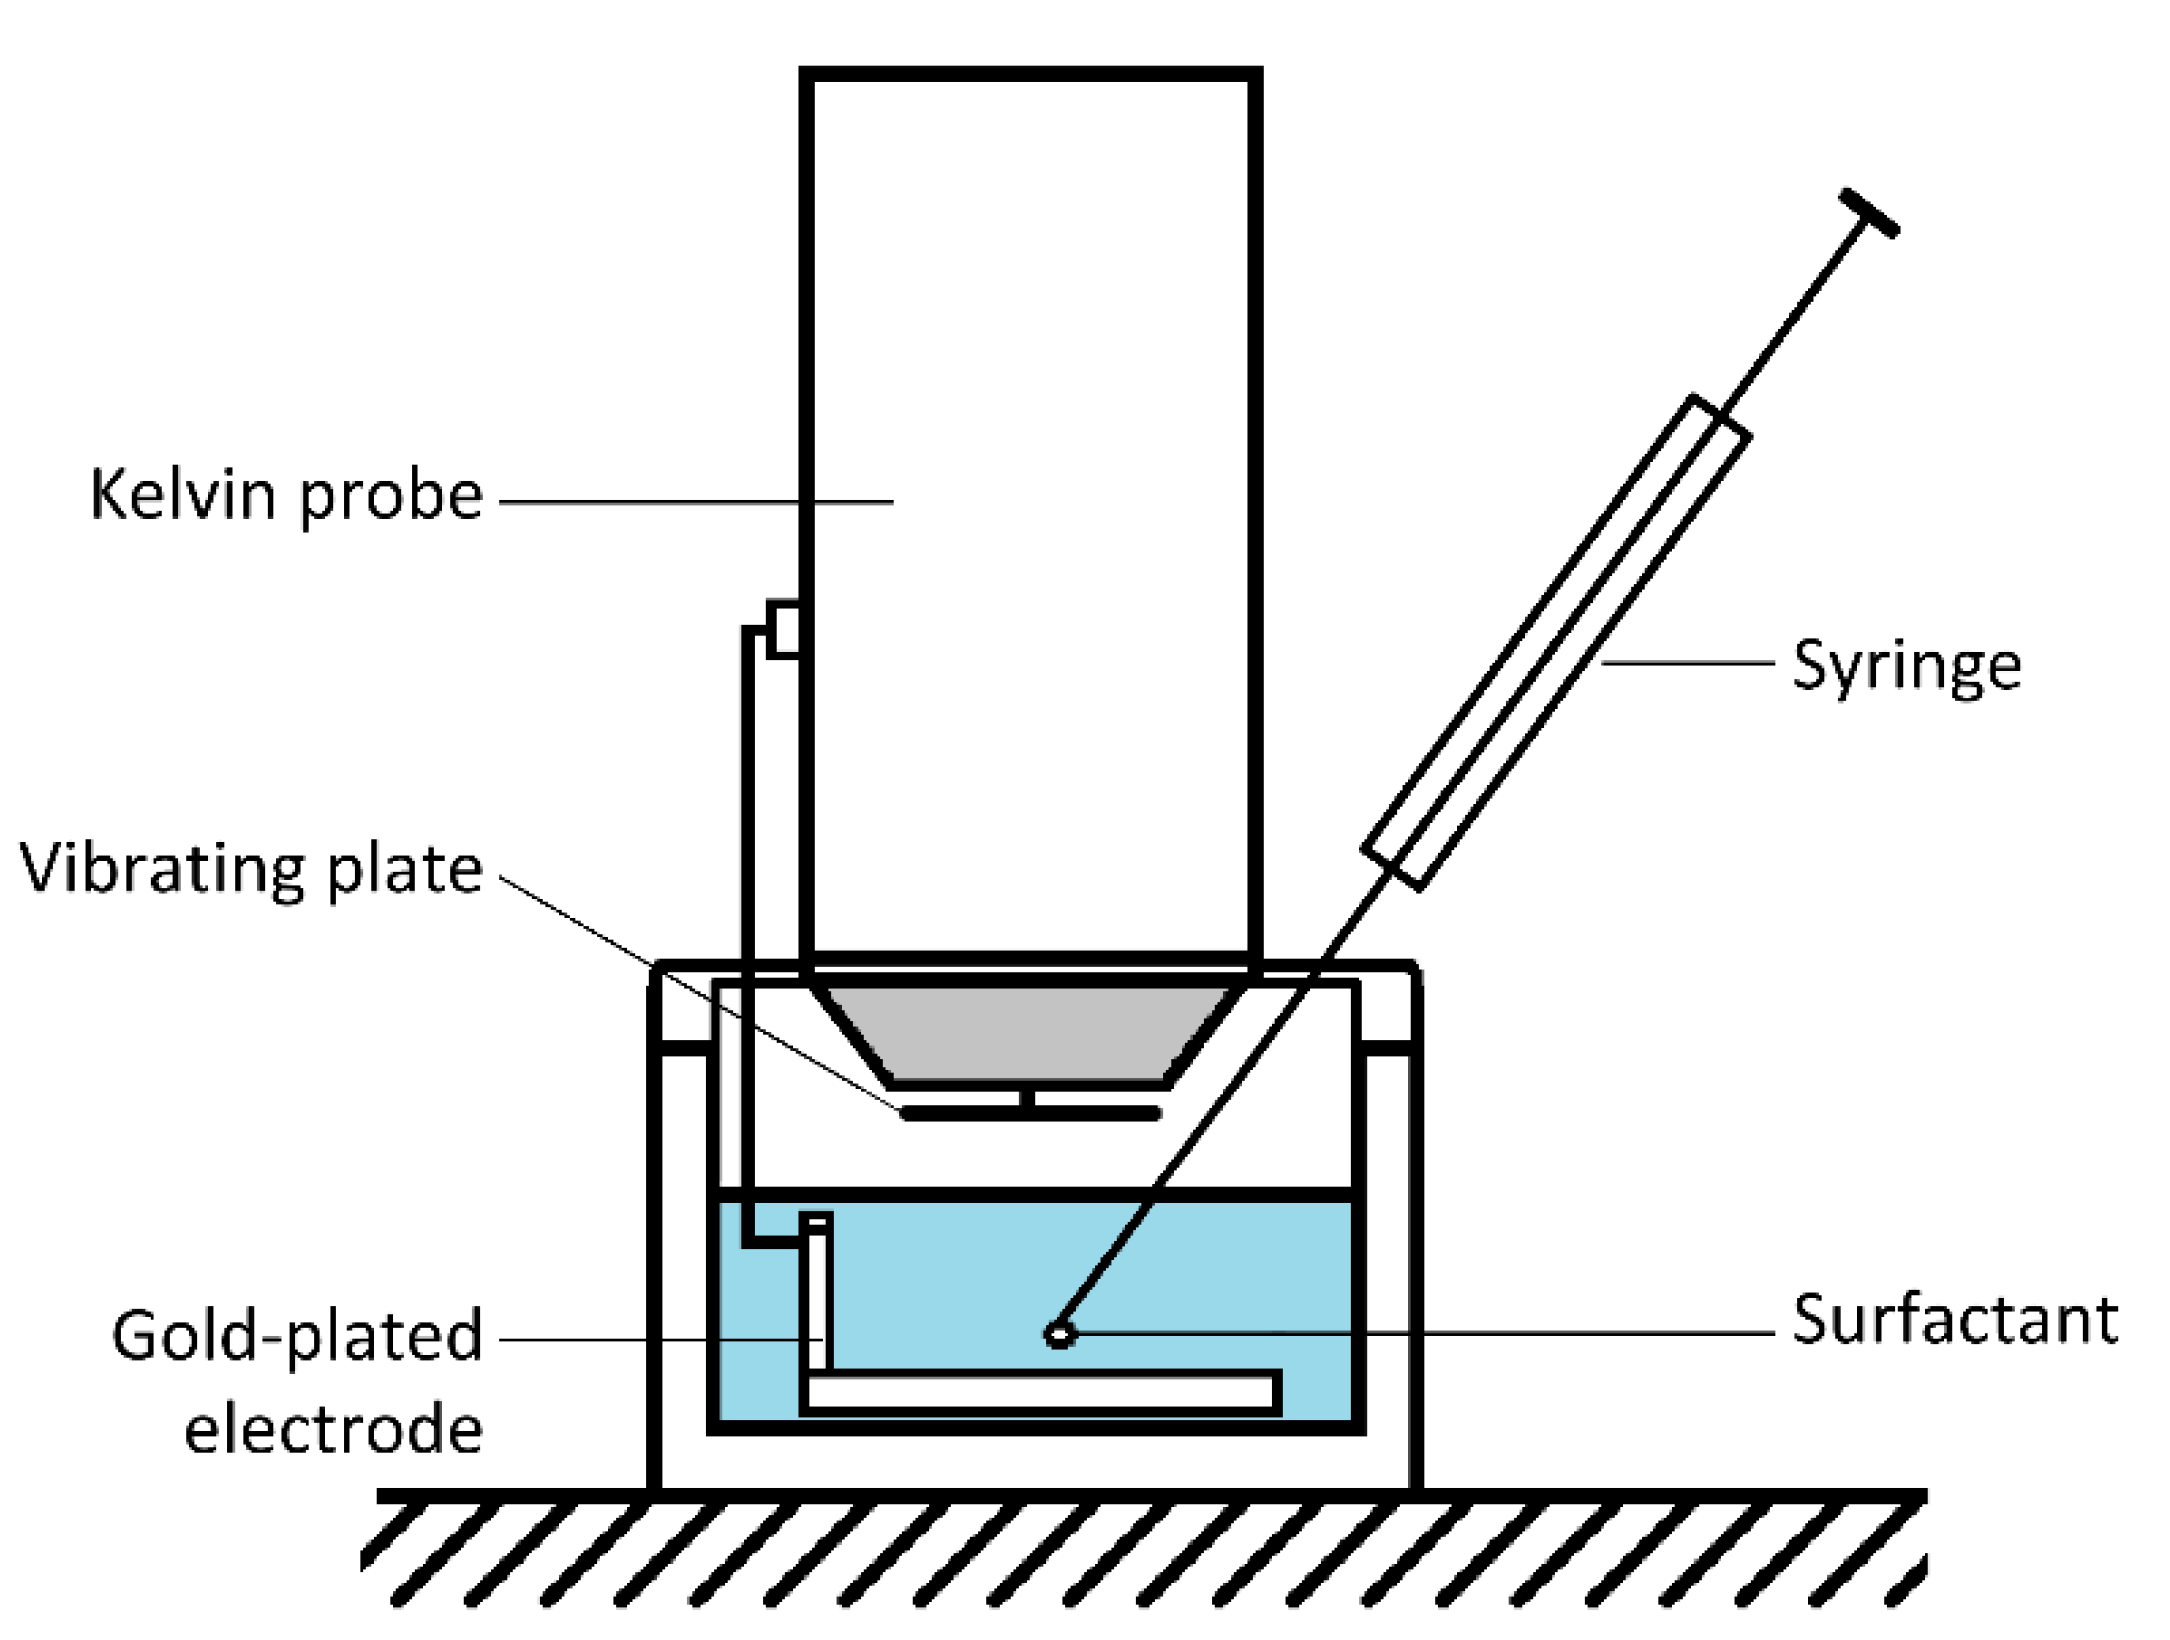
2.2.3. Time-Resolved Surface Potential Experiments

We measured the surface potential as a function of time by means of a Kelvin probe (KSV-NIMA SPOT). The experiment is schematized in Figure 2 and it is as follows: A concentrated solution of G12-2-12 (surfactant concentration, cs = 0.1 M), is prepared and let stabilize for 24 h. Separately, a precisely measured volume of pure water (Milli-Q) is placed in a small Teflon cuvette. The surface potential probe is placed at about 2 mm above the water surface. The surface potential of pure water is then measured and the result saved. By means of a Hamilton syringe (50 µL), a certain volume of the concentrated Gemini solution, calculated in order to obtain the desired final concentration, is injected at the bottom of the Teflon cuvette, producing a concentration impulse while the surface potential is continuously monitored. The injection process takes about 5 s. The injection process must be done very carefully, the syringe needle must be perfectly cleaned and any movement that could produce convection must be avoided. For changing the final surfactant concentration, we changed either the initial volume of water or the volume of the surfactant solution injected.

3. Results

3.1. Equilibrium Surface Tension Isotherm

In Figure 3a we show the surface tension isotherm for aqueous solutions of the G12-2-12 surfactant. The critical micelle concentration, cmc, obtained from these measurements is 0.9 mM. This value is in good agreement with values previously reported [5,14,17] which are in the range of 0.7 to 1 mM.

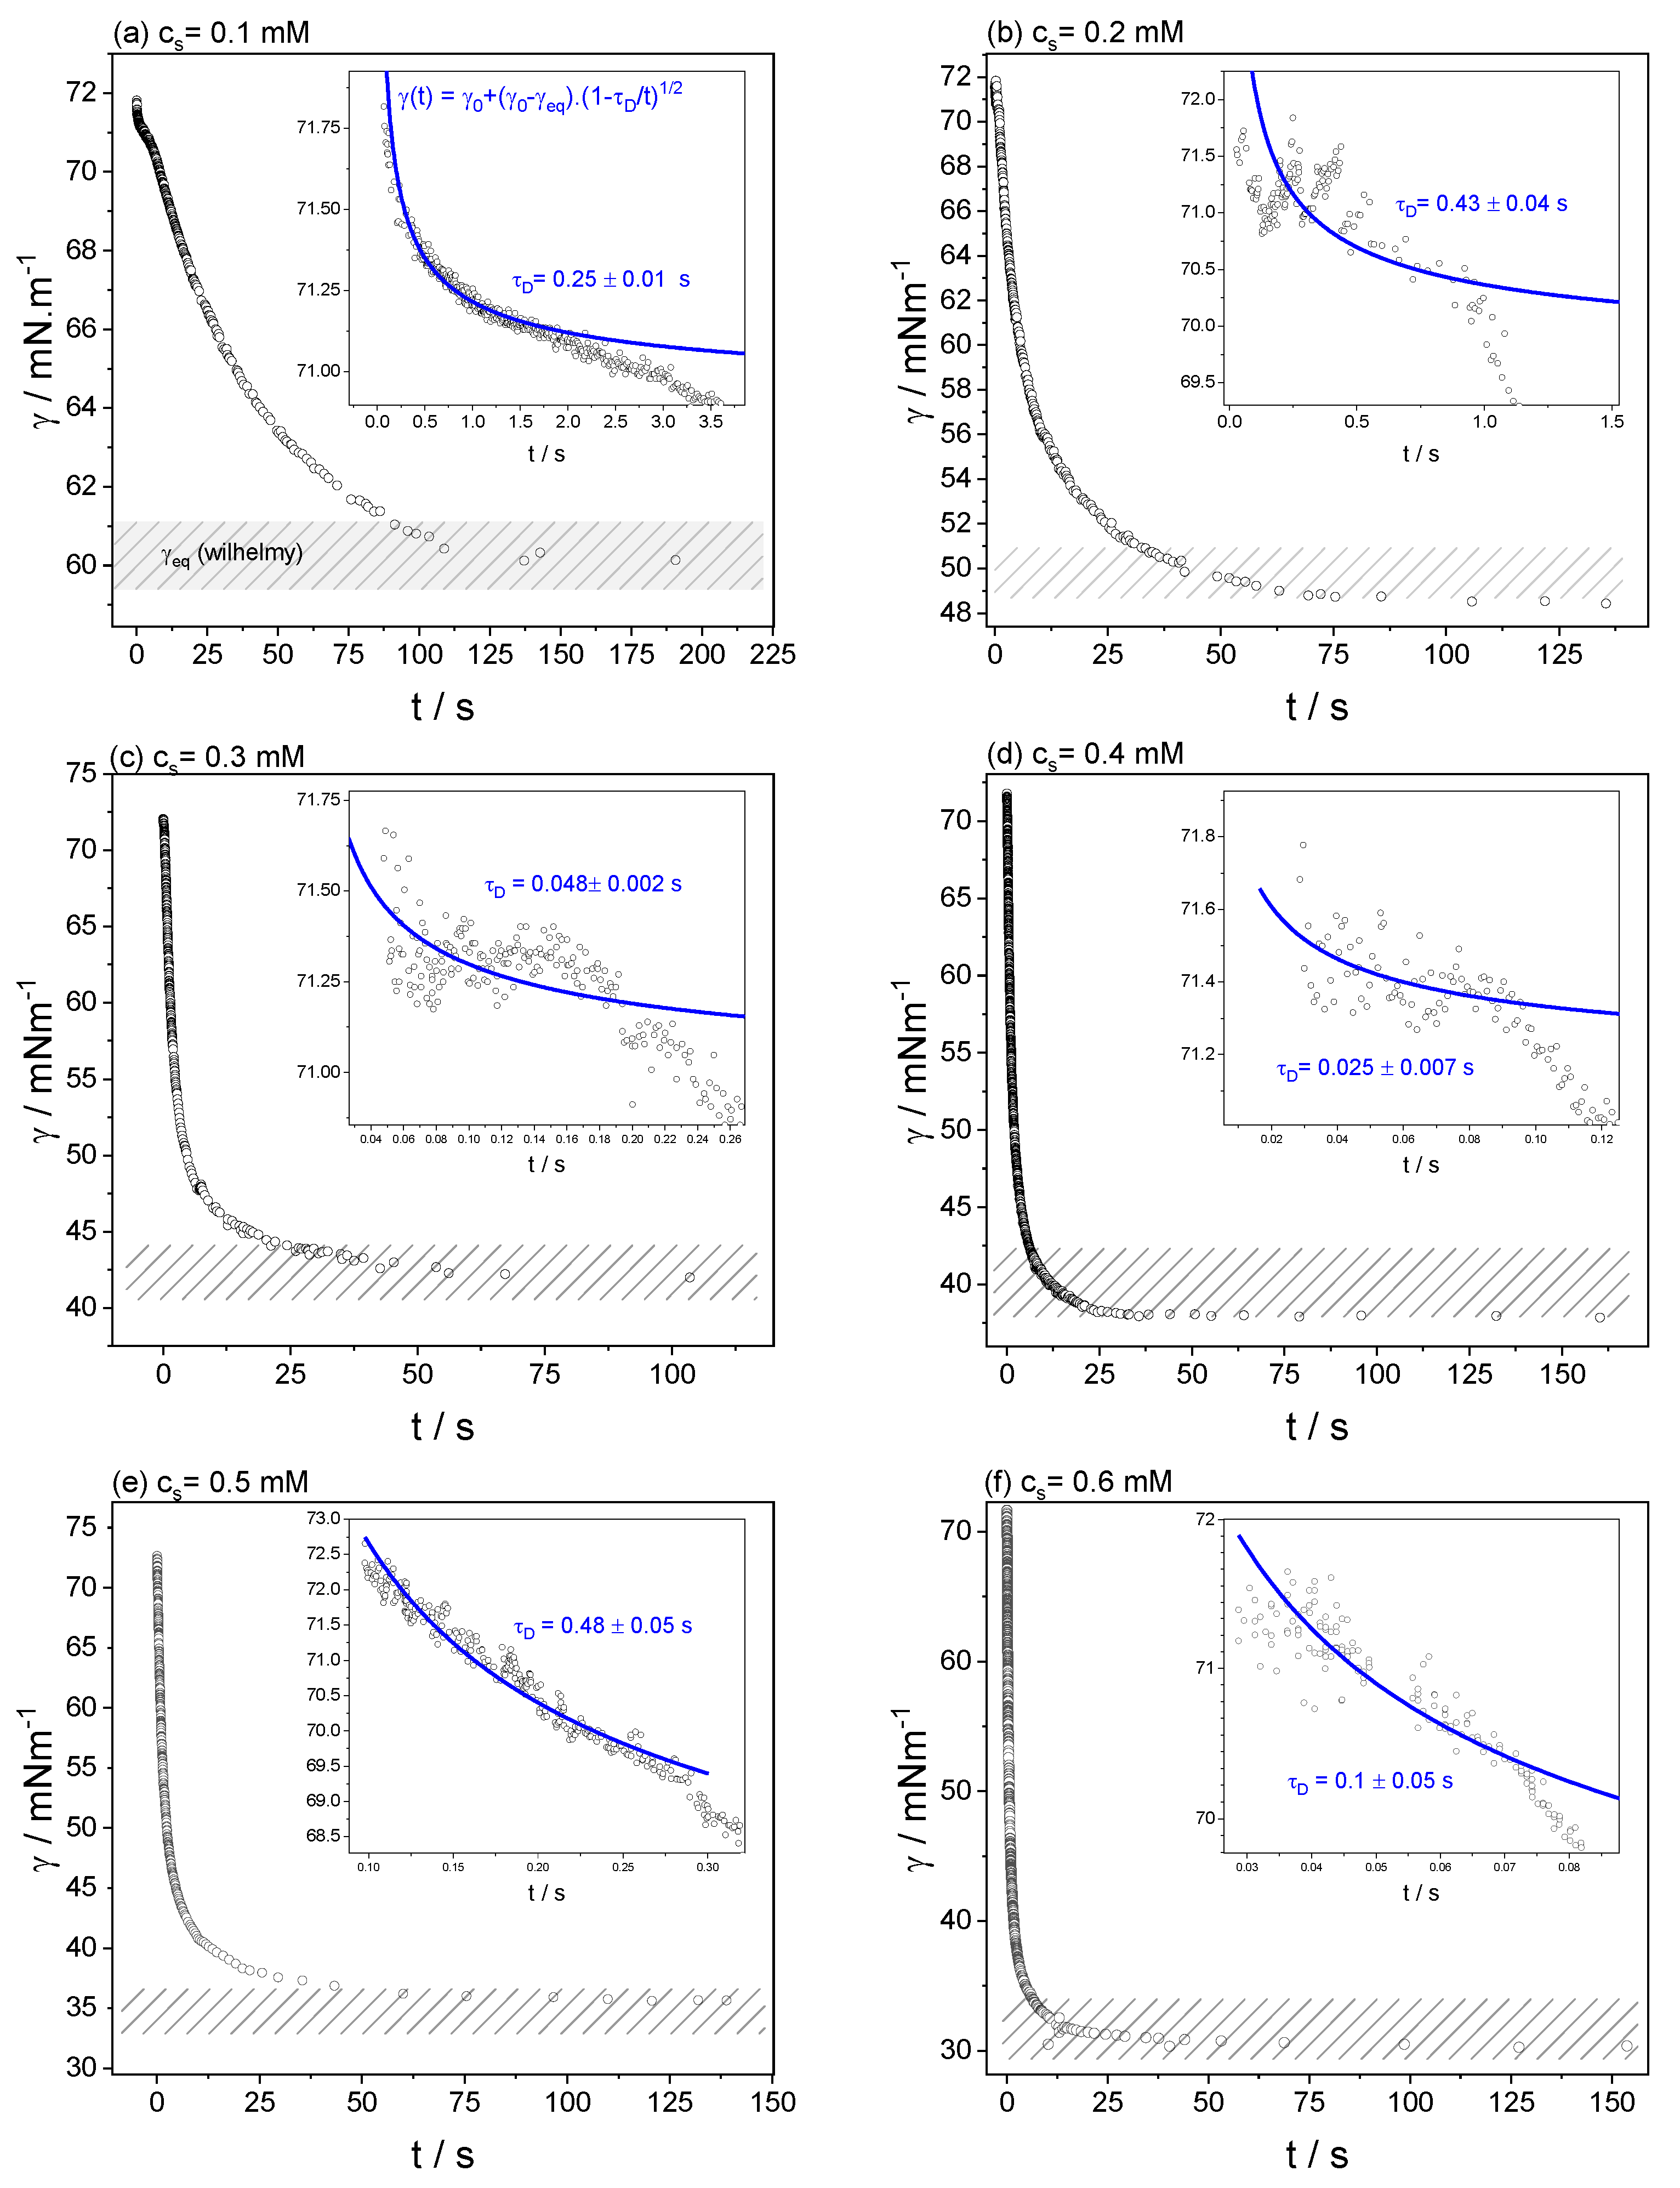
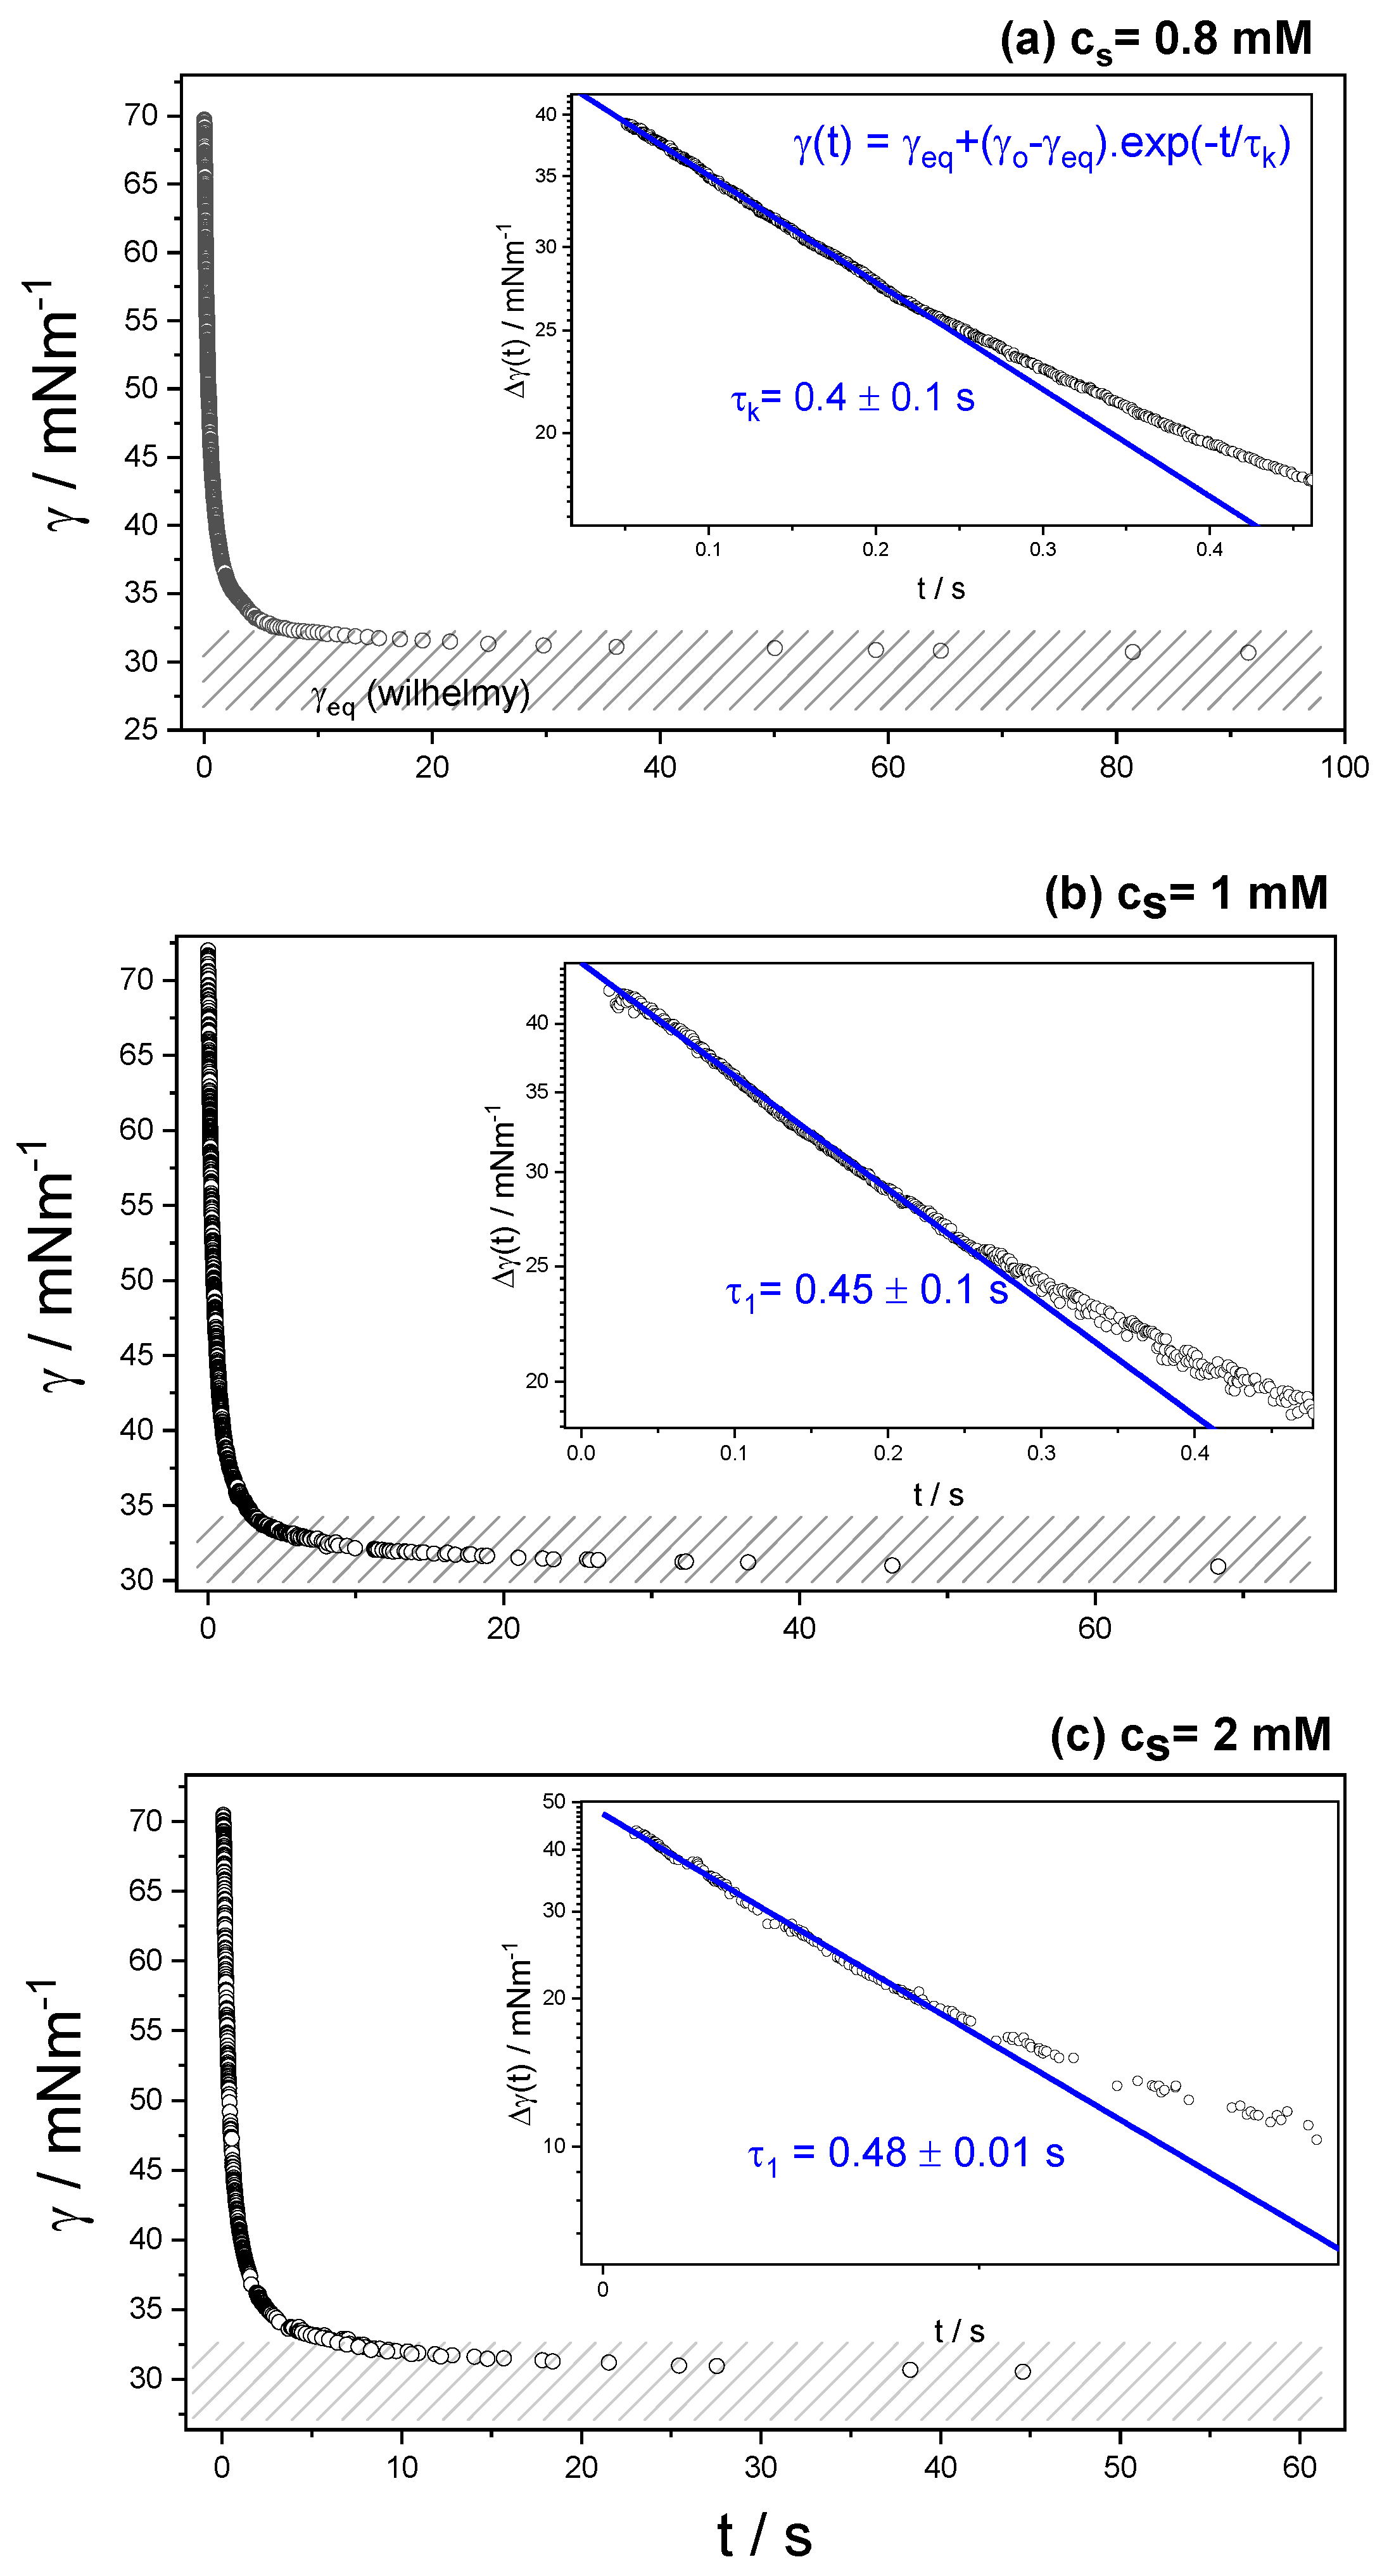
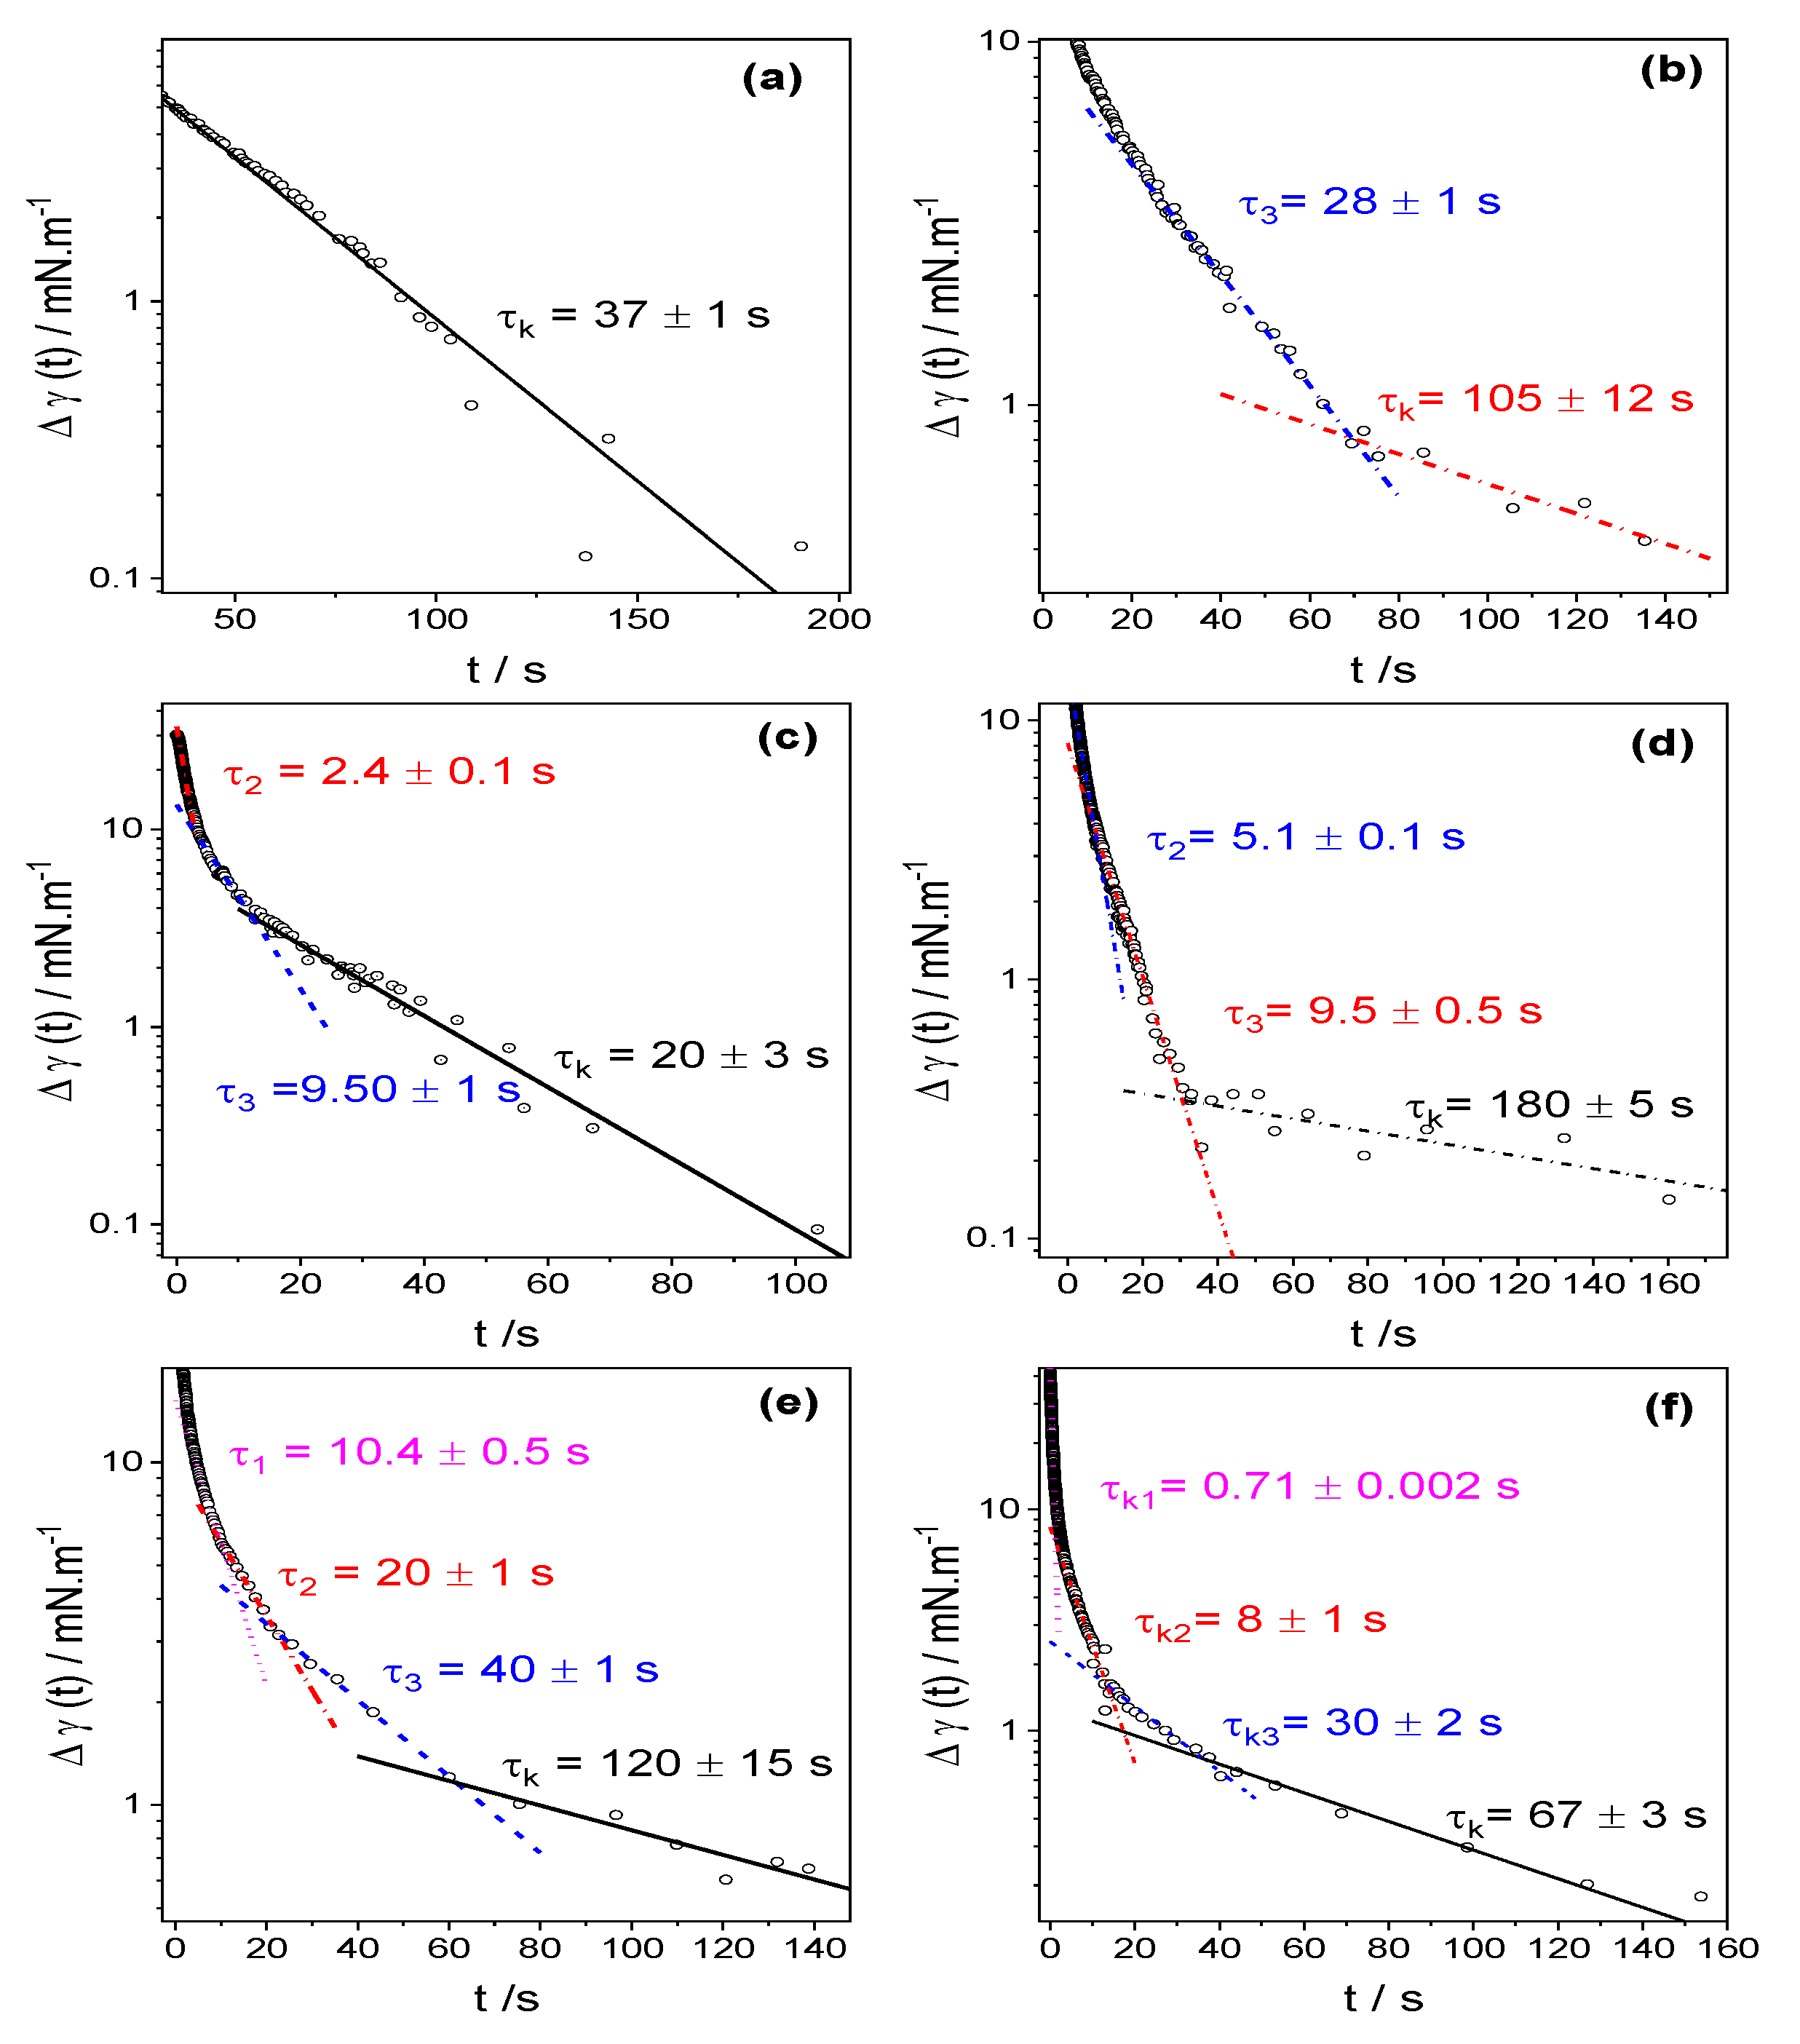
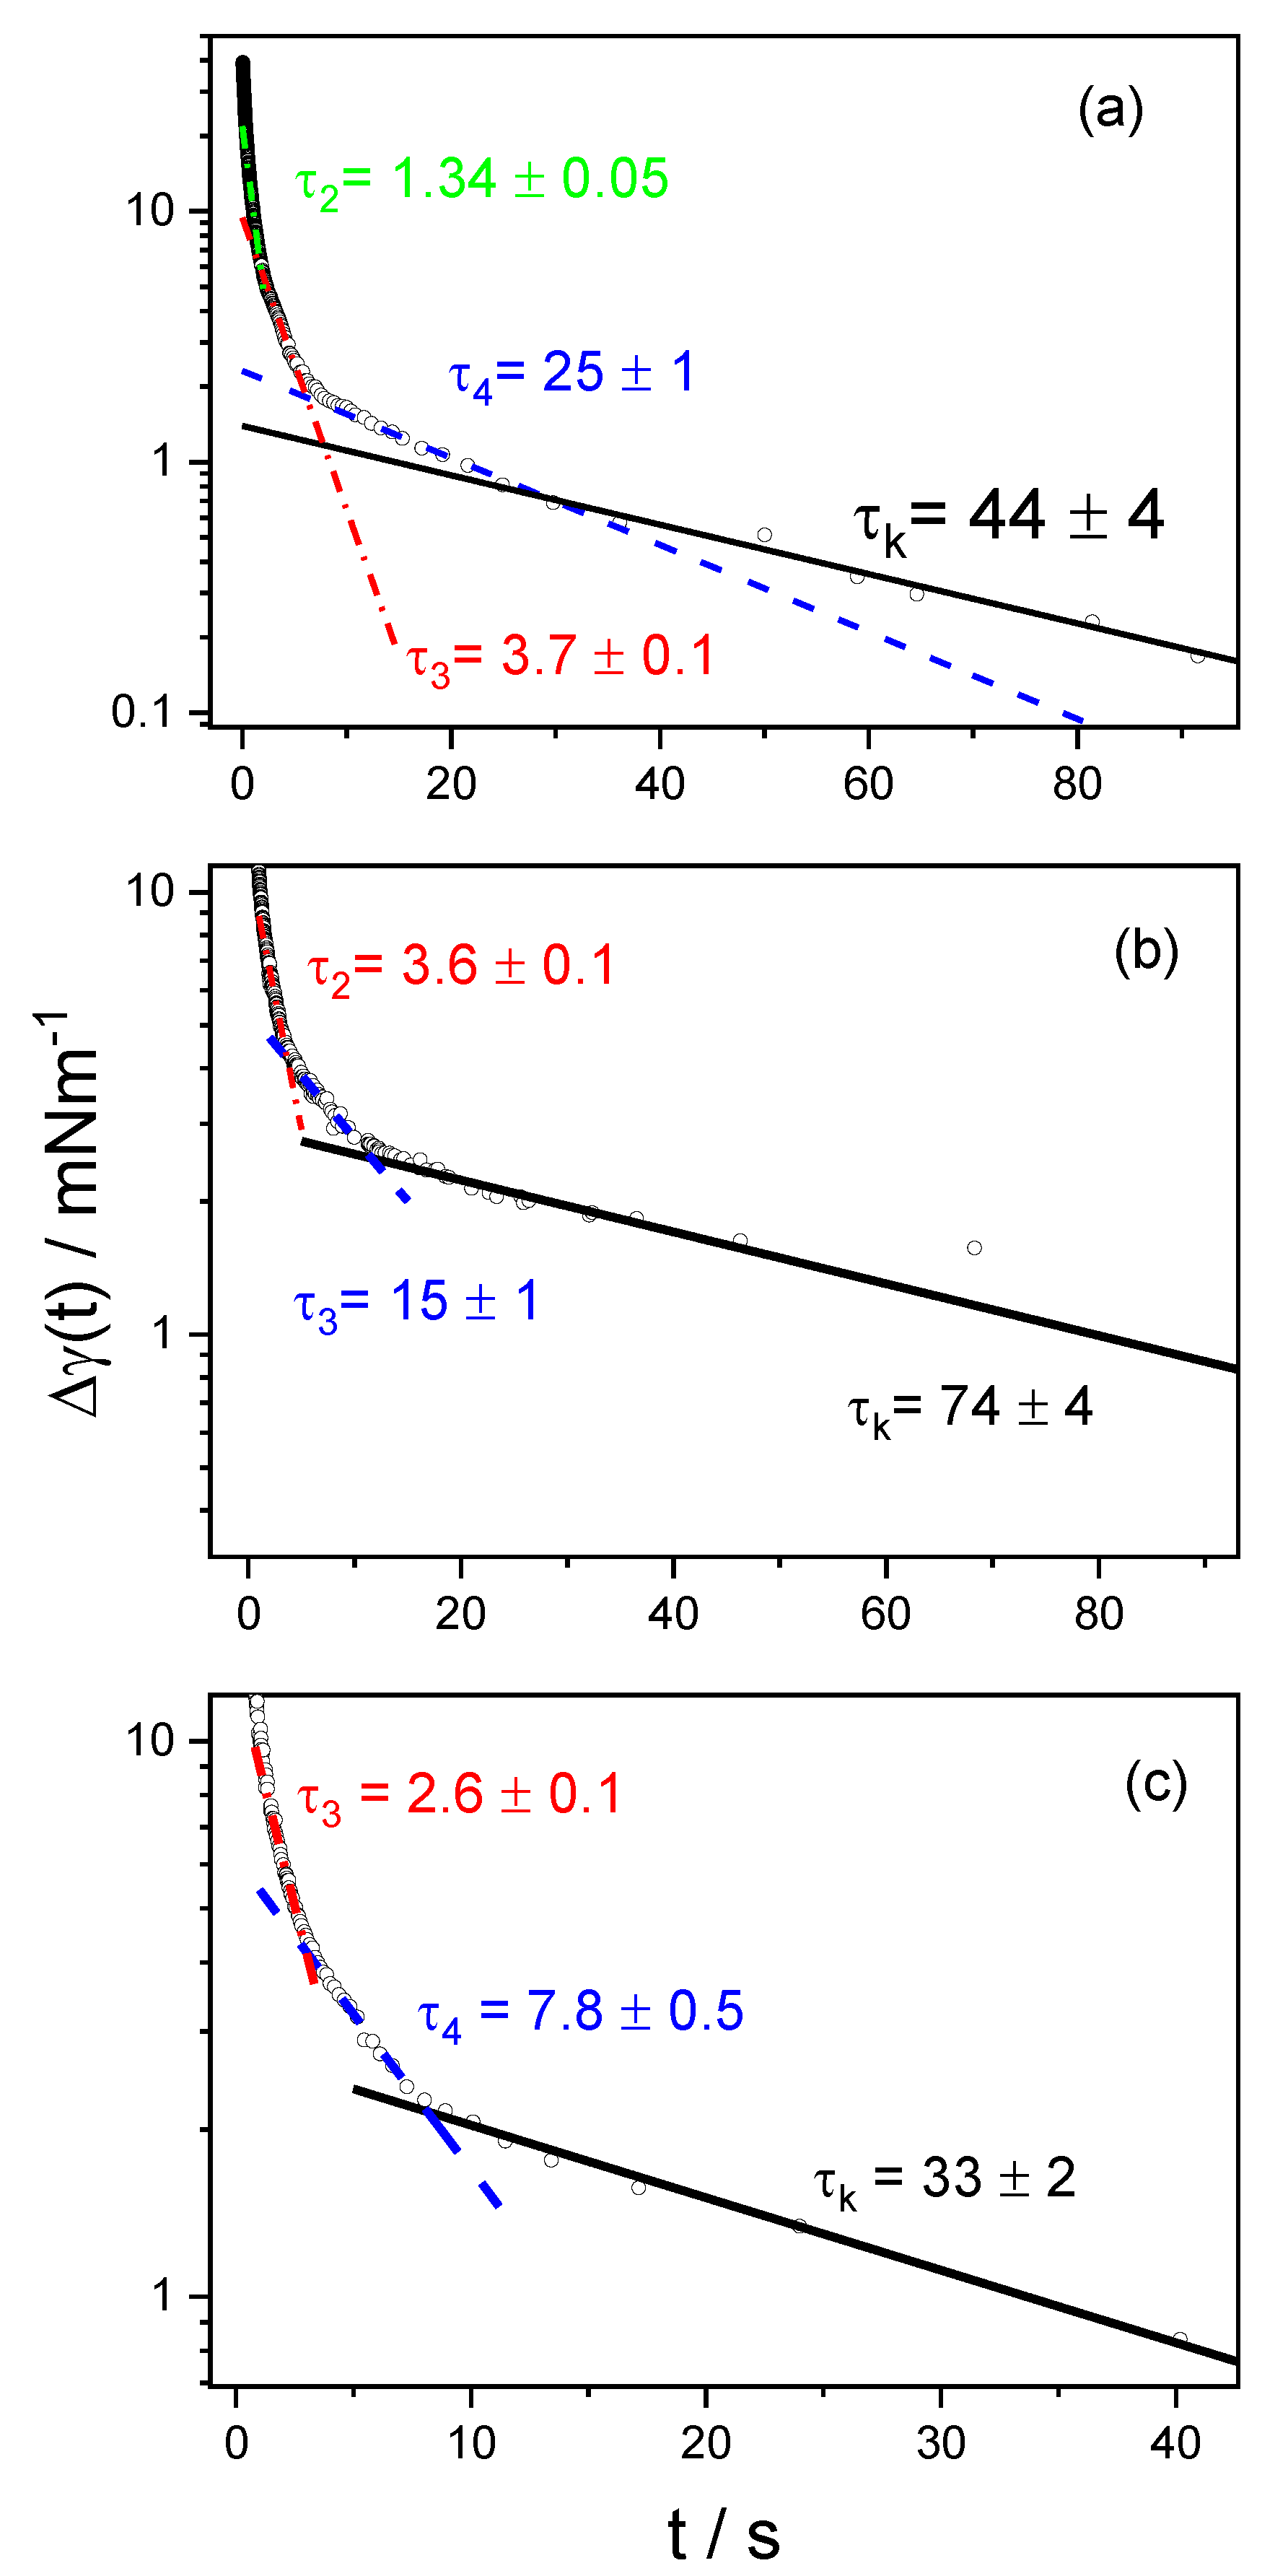
3.2. Dynamic Surface Tension

In Figure 4 we present the results of the dynamic surface tension for 6 surfactant concentrations below the cmc. Those concentrations are cs = 0.1; 0.2; 0.3; 0.4; 0.5, and 0.6 mM. All the curves are well-behaved (smooth) and in all cases, they reach the equilibrium values obtained from Wilhelmy plate technique, considering the errors (in the figures the errors are represented by the dashed regions). In the insets in said figures we show, amplified, the very short adsorption times region (≤2 s). The lines shown are fittings using Equation (3) (see discussion below).
In Figure 5 we show the results for the same kind of experiments but for solutions at concentrations close and above the cmc.
The behavior at short adsorption times (insets) is different from those observed for cs < cmc. The lines are fittings with exponentials (Equation (5), see discussion).

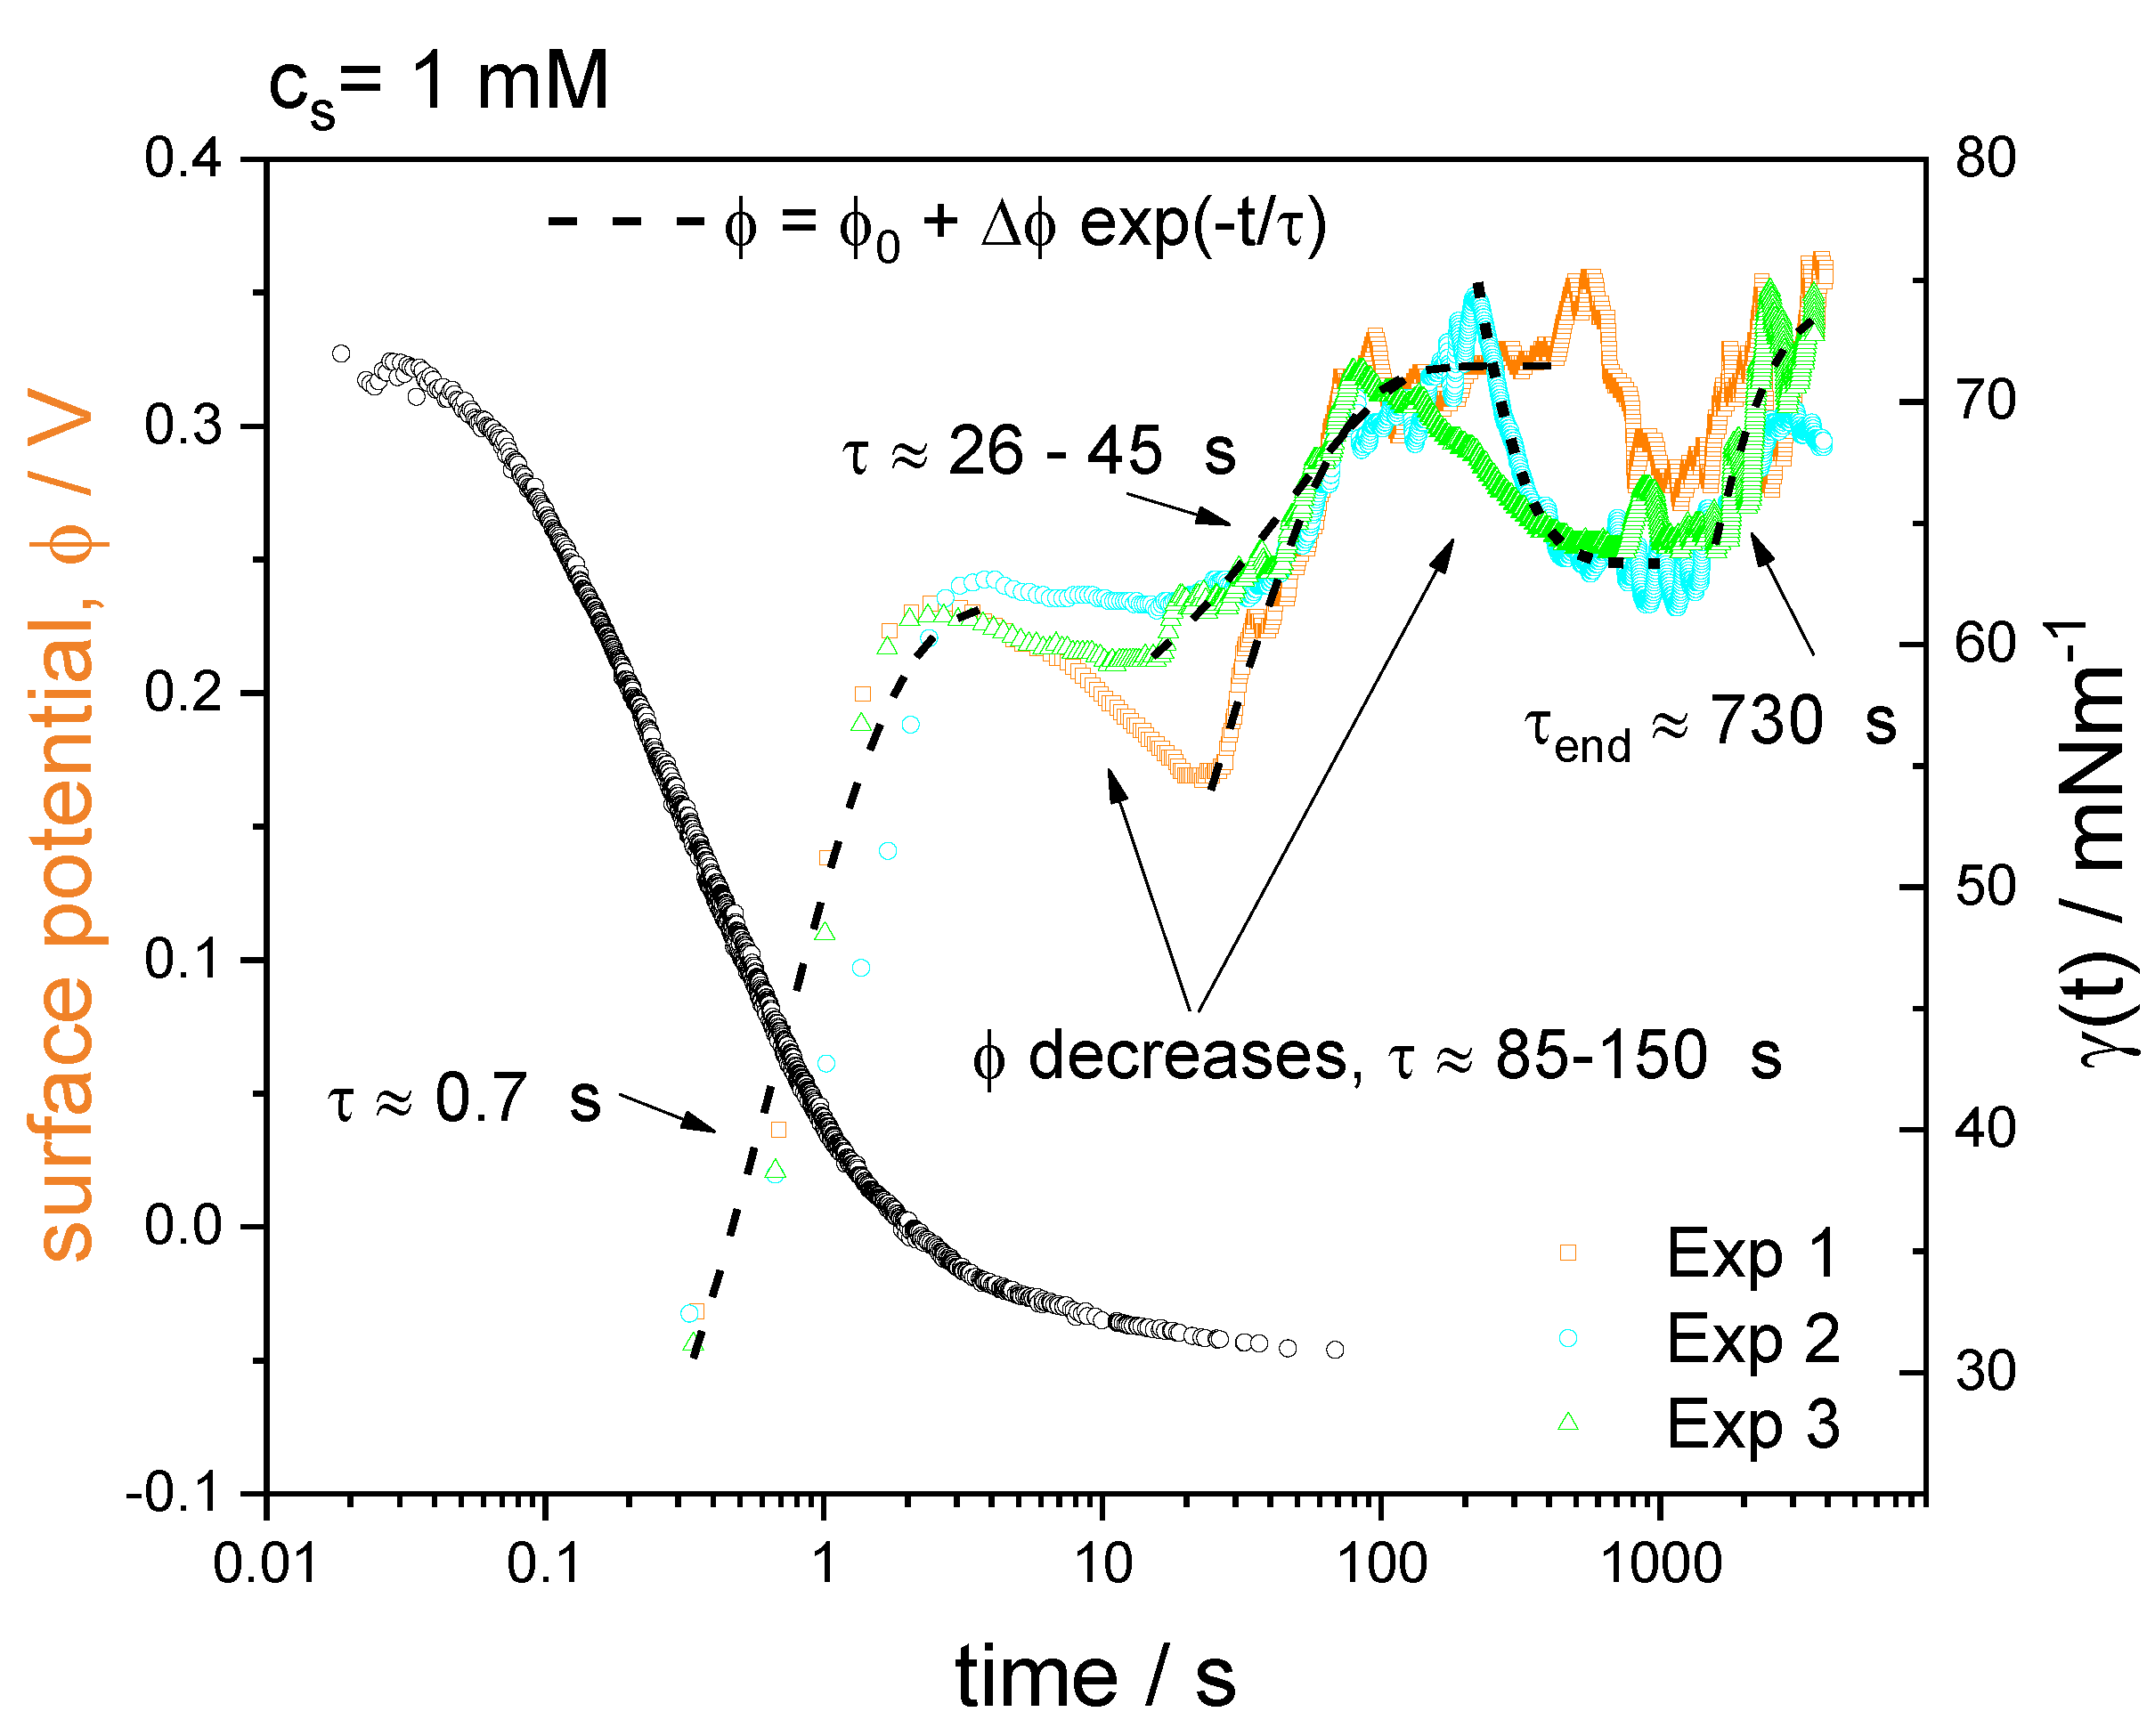
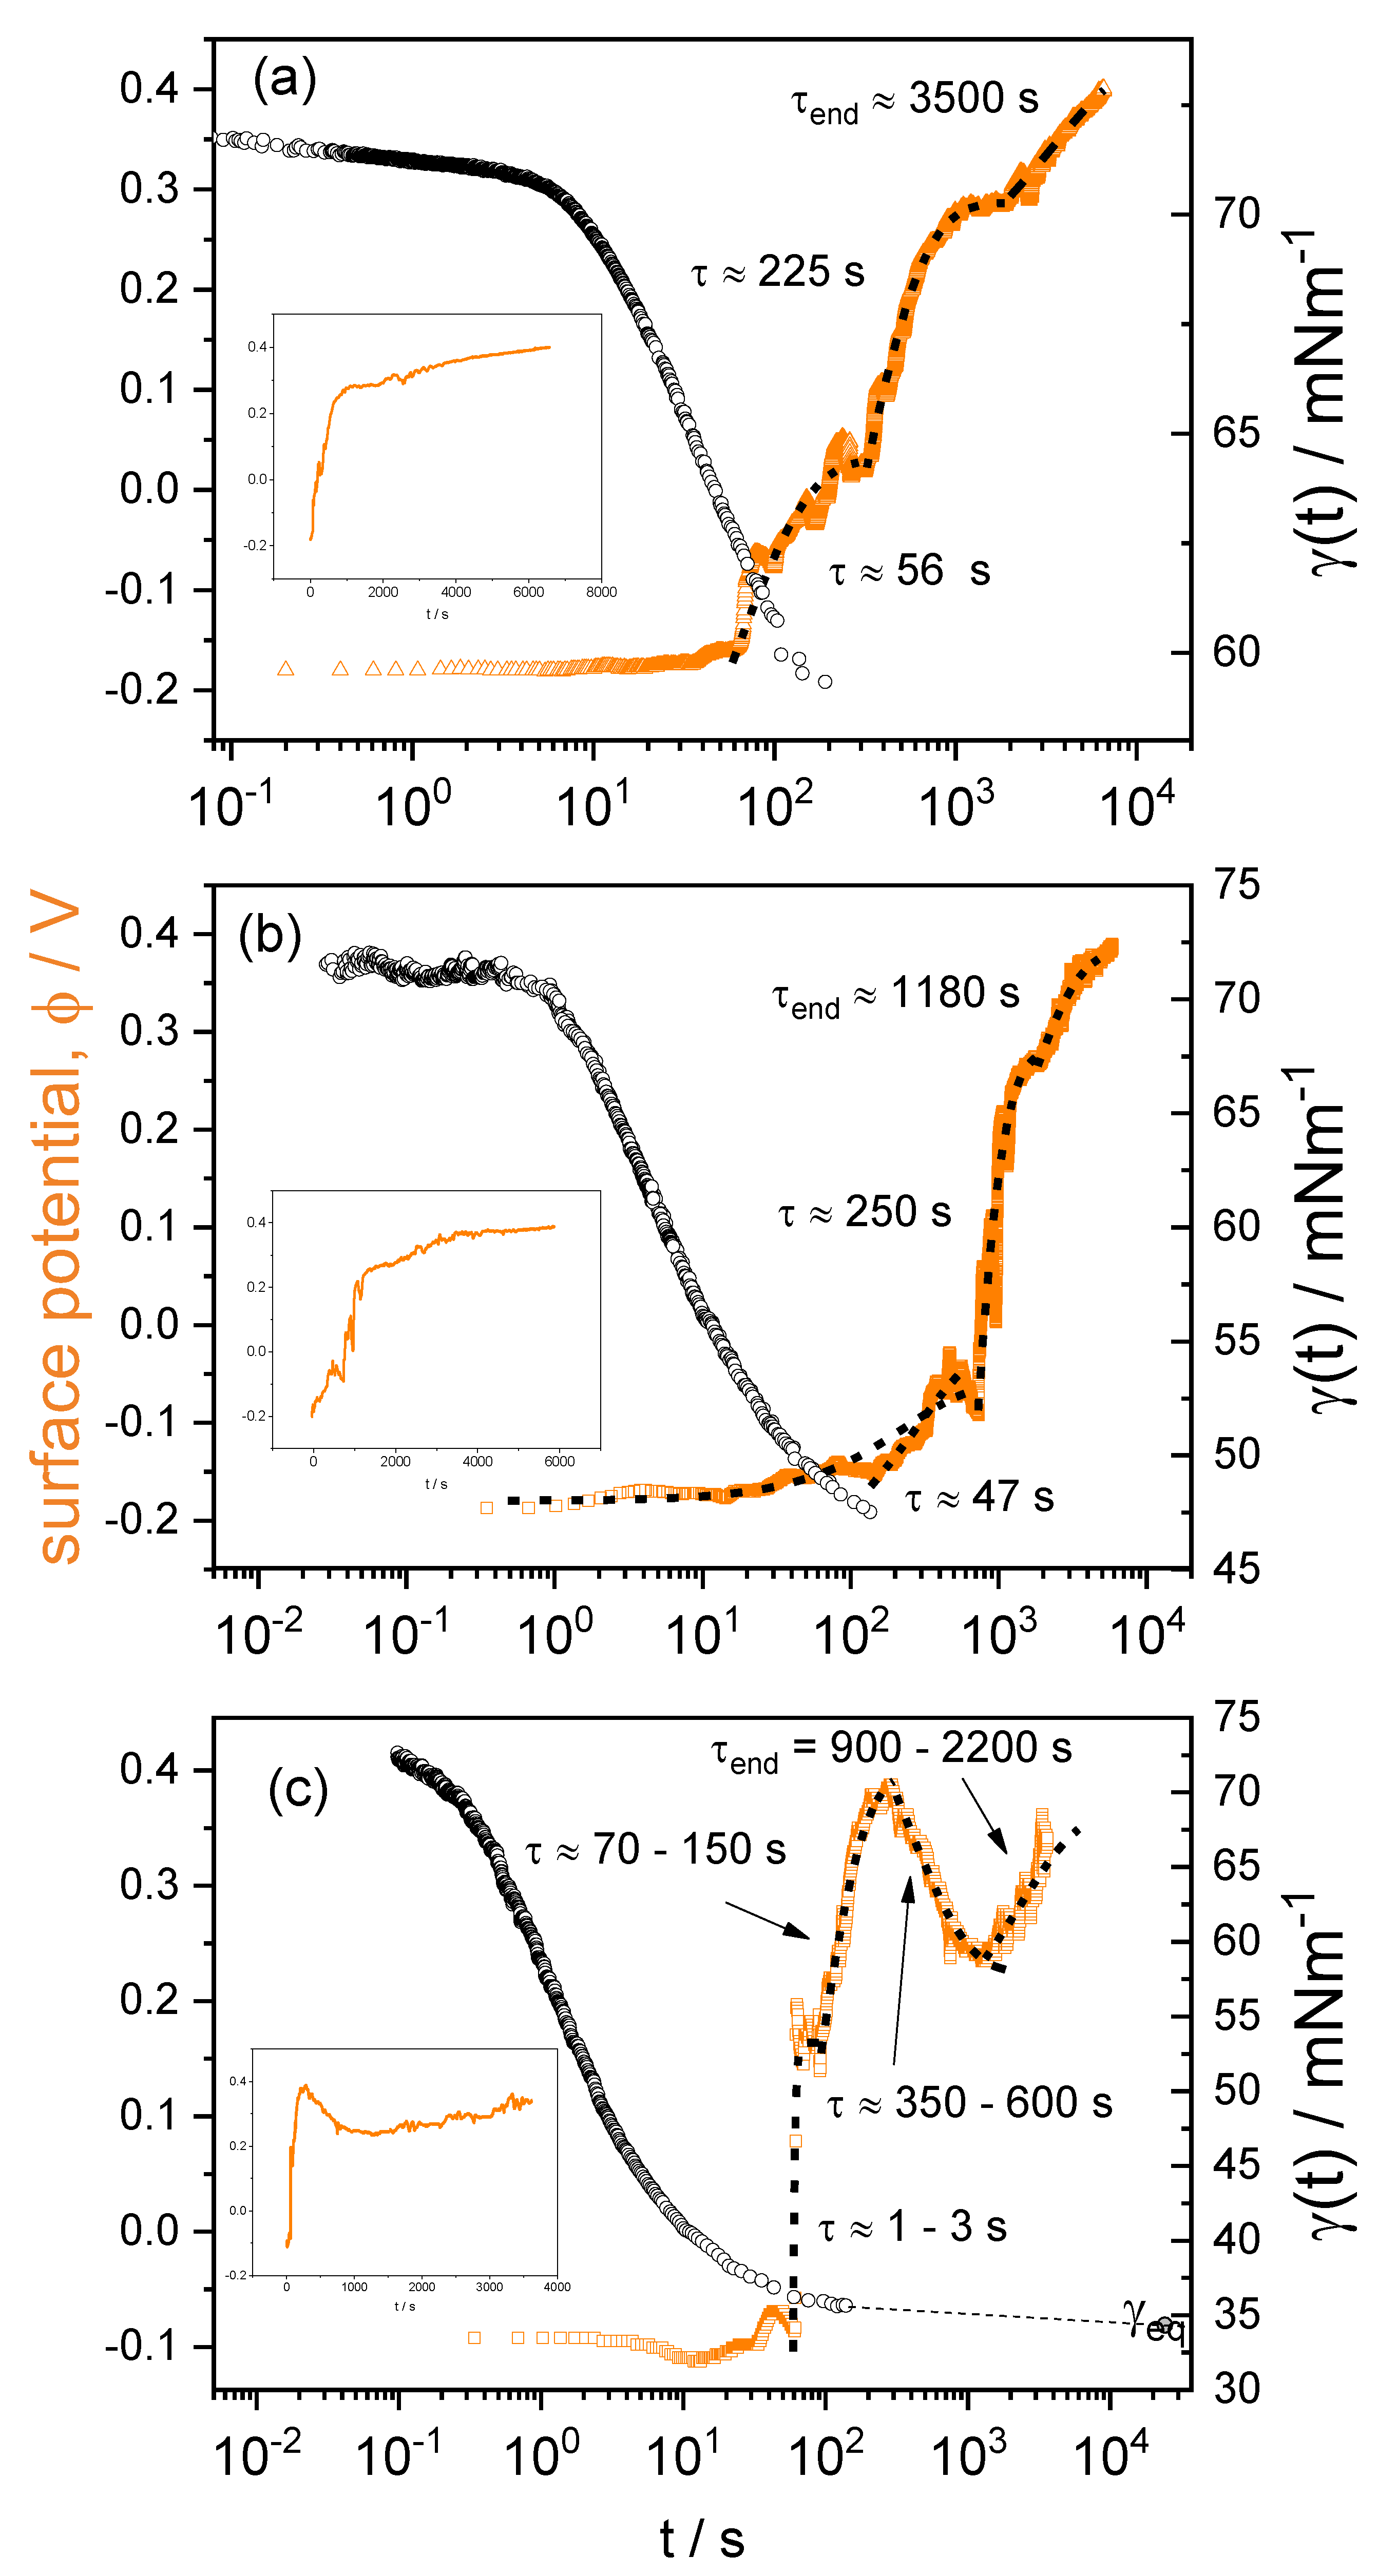
3.3. Time-Resolved Surface Potential

In order to shed light on the processes involved in the adsorption dynamics, and the role played by the charges at the interface, we performed time-resolved surface potential experiments, as explained in the methods section. In Figure 6 we present the results for cs = 1 mM, superimposed to the dynamic surface tension curve in a semi-log plot. We show simultaneously three independent measurements of the surface potential as a function of time. The three curves are different but all of them present general common features. Note that, at short times, there is a fast increase of surface potential followed by a decrease and several oscillations, those oscillations were not replicated on the surface tension dynamics. In the figure, we included the relaxation times obtained by fitting certain parts of the curves with exponentials (see discussion).
In Figure 7 we show the results corresponding to cs = 0.1 mM, cs = 0.2 mM and cs = 0.5 mM. Note that the surface potential curves have the same features mentioned above, a fast increase of the surface potential and oscillations.
For all surfactant concentrations the initial (water) surface potential was about −0.2 volts and reaches the stationary value of 0.3–0.5 volts, depending on surfactant concentration. The insets on those figures are included to show that φ tends to a stationary value, a fact that is difficult to see when time is in logarithmic scale.

4. Discussion

4.1. Equilibrium Surface Tension

The first step in the discussion of the results shown in previous sections is the equilibrium isotherm of Figure 3a. Our point of departure is the Gibbs adsorption equation [12]:
Γ = 1 n k B T d γ d l n ( c s )
From the dependence of the surface tension, γ, on the surfactant bulk concentration, cs, the surface excess, Γ, (surface surfactant concentration) can be obtained by means of this equation. Here kB is the Boltzmann constant and T the absolute temperature. The constant n takes the value 3 for a dimeric surfactant made up of a divalent surfactant ion and two univalent counterions, such as G12-2-12, in the absence of added salt. However, by means of neutron reflectivity measurements [18,19], it was found that, for G12-2-12, n = 2. This means that one counterion is condensed onto the Gemini polar head at the interface and thus G12-2-12 behaves like a monovalent ionic surfactant (n = 2). In Figure 3b we show the surface excess obtained from the experimental data of Figure 3a and the Gibbs adsorption equation, Equation (1). Note that the surface saturates at about 0.2 mM with a surface concentration of Γ ~ 1.9 × 10¹⁸ molec.m−2, given an area per surfactant head of 5.3 × 10⁻¹⁹ m2, which gives 7.25 Å as an estimation for the distance between surfactant heads at the interface. On the other hand, from a free energy approach [10,20,21], the adsorption isotherms and the equation of state for a 1:1 ionic surfactant (note that we consider that one of the surfactant charges is also condensed in bulk because the distance between charges in the surfactant head [22], ~4 Å, is less than the Bjerrum length) can be expressed as,
ϕ 0 = ϕ b ϕ b + [ b ϕ 0 + ( b ϕ 0 ) 2 + 1 ] 2 e x p ( α β ϕ 0 ) γ = γ w + k B T a 2 [ l n ( 1 ϕ 0 ) + β 2 ϕ 0 2 2 b ( ( b ϕ 0 ) 2 + 1 1 ) ]
a being the average size of a surfactant molecule, φ0 is the surfactant area fraction at equilibrium (φ0 = Γa2), β the Frumkin lateral interaction parameter, α the Langmuir adsorption parameter and b a parameter characterizing the strength of electrostatic interactions [10], b = [ π l B / ( 2 a ϕ b ) ] 1 / 2 (φb is the surfactant volume fraction, ϕ b = a 3 c s ). In Figure 3c we show the fitting of the data, γ(φ0), with Equation (2). The lines in Figure 3a correspond to the same fitting for the curve γ(cs). We show two fittings, in one case keeping the solvent surface tension constant at 72 mNm−1 and for the other leaving this parameter free to adjust the curve. From the former fitting we found: a = (0.89 ± 0.2) nm, β = (−3.24 ± 1) kBT; α = (8.9 ± 2) kBT; from the latter, a = (0.77 ± 0.2) nm, β = (−0.6 ± 0.2) kBT; α = (10 ± 2) kBT and γ0 = 72.8 mNm−1. The molecular size, a, obtained from the fittings with this model is 7.7–8.9 Å, which is close but larger than that obtained for DTAB solutions [10], for which a = 7.2 Å was obtained. This result is somehow expected because G12-2-12 has two DTAB chains linked by the heads with an ethyl group. Note that the Frumkin interaction parameter β is negative, this indicates a repulsive interaction among surfactant molecules at the interface.

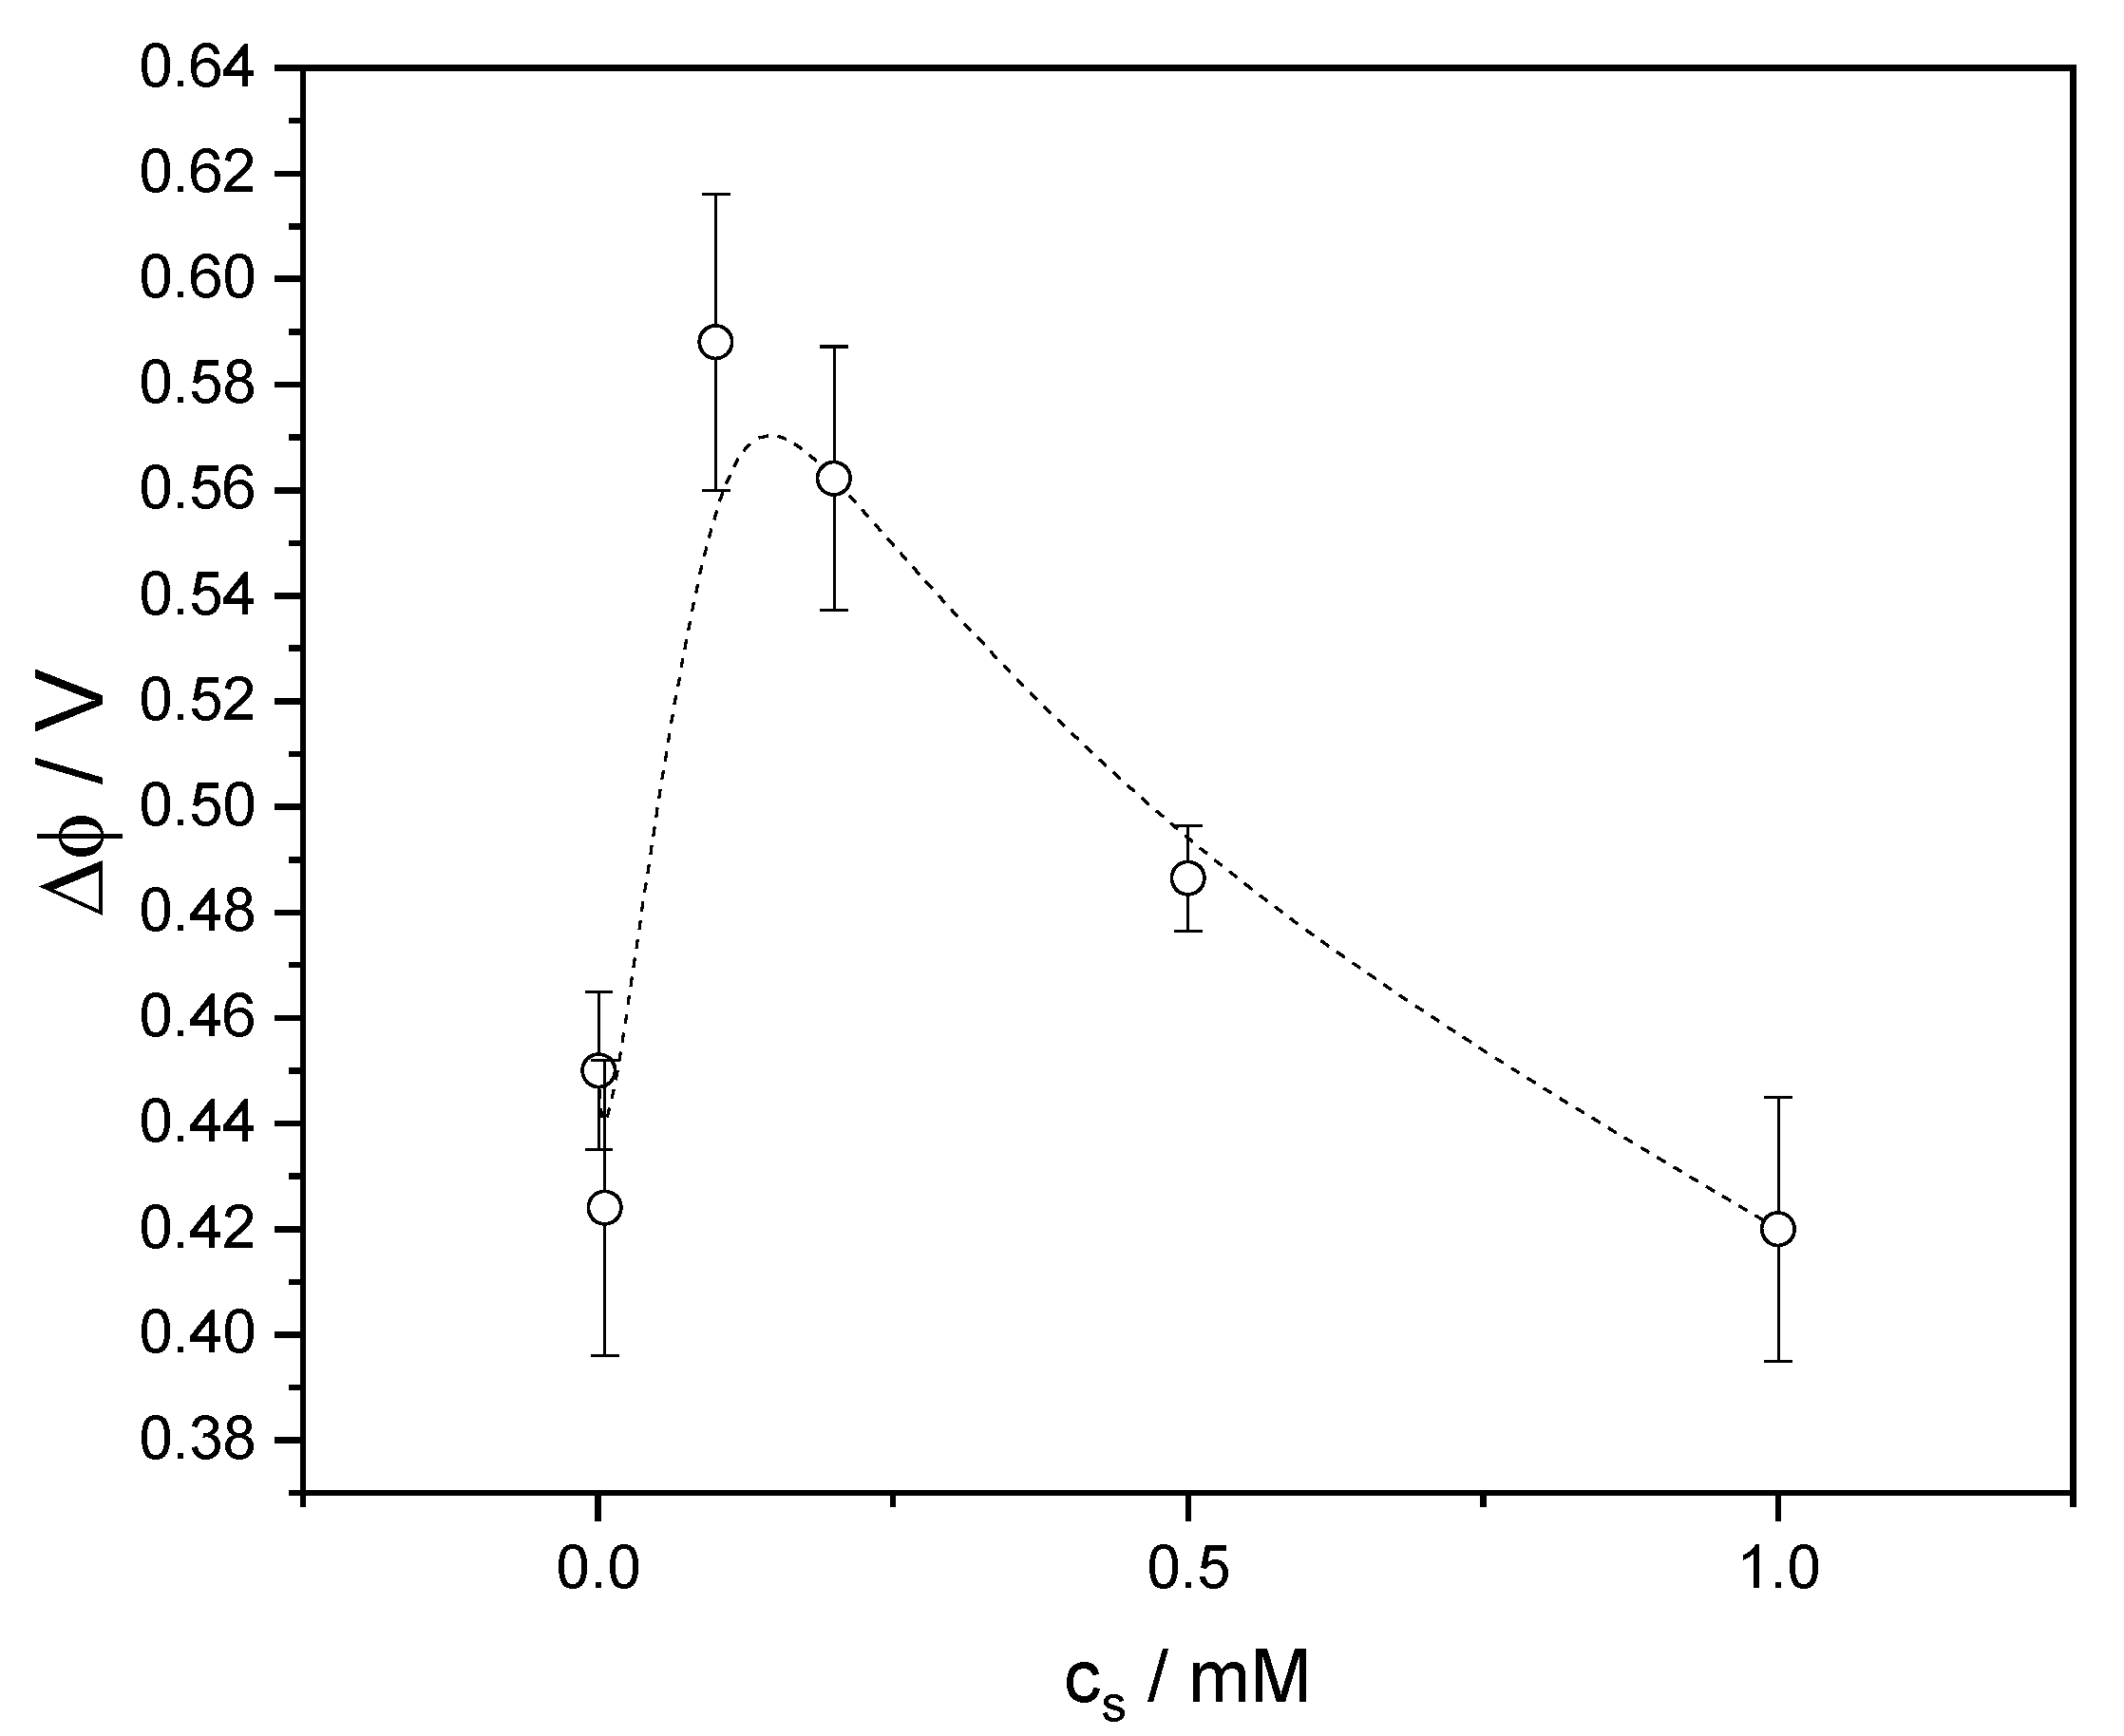
4.2. Equilibrium Surface Potential

In Figure 8 we plot the change in surface potential, ∆φ, between pure water interface (φwater ~ −0.2 V) and the final stationary value at the surfactant solution-air interface, φ. Note that the surface potential difference seems to go through a maximum at a surfactant concentration between 0.2 and 0.4 mM. Above this concentrations, ∆φ diminishes continuously indicating the condensation of counterions onto the interface. This is consistent with the distance separating surfactant heads at the interface estimated from Gibbs equation, ~7.25 Å, which is very close to the value of the Bjerrum length lB ( l B = e 2 ε k B T 7 Å , e is the electron charge and ε is the water dielectric constant). We recall that, when the distance between charges is less than lb, condensation of counter-ions is expected, such that the effective distance between charges become equal to the Bjerrum length [23,24].

4.3. Dynamic Surface Tension

Let us first discuss the short adsorption times. In the insets of Figure 4 and Figure 5 the dynamics in this time range can be observed in an amplified scale. For cs = 0.1 mM and for adsorption times shorter than about 2 s, the dynamic surface tension data is beautifully fitted (see inset in Figure 4a) with the diffusional model [20,21], indicating that the adsorption dynamics is limited by diffusion (DLA),
γ ( t ) γ 0 + ( γ 0 γ eq ) ( 1 τ D t )
where τD is the characteristic diffusional time. From the fitting with Equation (3), we obtain τD = 0.25 ± 0.01 s. As the surfactant concentration increases, but always below the cmc, the experimental points become noisy and the fittings less reliable (see insets in Figure 4b–f). The corresponding times, τD, obtained from Equation (3) for each concentration are summarized in Table 1.
From the theory the characteristic time for a DLA process can be estimated [20,21],
τ D = ϕ 0 4 ϕ b 2 a 2 π D
being φb and D the bulk surfactant volume fraction and diffusion coefficient respectively. From the bulk concentration, the surfactant volume fraction can be estimated, ϕ b = a 3 c s , for cs = 0.1 mM, φb = 3.1 × 10⁻⁵. Now, making use of the data on Figure 3, we estimate φ0 ~ 0.83. With these values, from Equation (4) and τD = 0.25 s, we calculate D = 4.1 × 10⁻¹⁰ m2 s−1. This value coincides perfectly with the literature value [25] of 4 × 10⁻¹⁰ m2 s−1. The same calculation for larger surfactant concentrations deviates from this value but they fall in the correct order of magnitude except for cs = 0.5 and 0.6 mM. The results are summarized in Table 1.
For surfactant concentrations close and above the cmc, the adsorption dynamics is consistent with an exponential decay of surface tension even at very short adsorption times:
γ ( t ) γ eq = ( γ 0 γ eq ) e x p ( t τ ) .
This behavior can be seen in the insets of Figure 5, the characteristic times found by fitting with Equation (5) are labelled as τ1 and shown in Table 2. In Equation (5), γeq and γ0 are the equilibrium surface tension of the solutions, and pure solvent, respectively.
Turning our attention to the last part of the adsorption process, close to equilibrium, the relaxation is consistent with a kinetically limited adsorption (KLA), following an exponential decay [10,20,21] as in Equation (5). We label the characteristic time of this final stage of the adsorption dynamics as τk.
In Figure 9 and Figure 10 we plot, in a semi-log scale, ∆γ = γ(t) − γeq as a function of time for surfactant concentrations below and close/above the cmc respectively. The results of the fittings with exponentials are shown as lines on the figures and labelled with the corresponding characteristic time. Note that there are several processes (and characteristic times) all consistent with an exponential decay. Those results are summarized in Table 2. Note that the number of processes increases with surfactant concentration until the cmc. The observation of several processes, each with its characteristic time, is consistent with what was found in surface rheology experiment on the same surfactant system [11].
The origin of the intermediate relaxations, between τD and τk, seems to be related to charge redistribution as observed from surface potential results on Figure 6 and Figure 7. This redistribution of charges may include the formation of aggregates at the interface, condensation of counterions onto those aggregates and further surfactant adsorption, as well as phase transitions [26].
Now, from the values of the characteristics times in the KLA regime, τK, we can estimate the average ( ψ ¯ ), the equilibrium surface (ψ0) and subsurface (ψa) electrostatic potentials, ψ ¯ = ( ψ 0 + ψ a ) / 2 [10,20,21]:
e ψ ¯ k B T = ( α + β + l n ( π a 4 D c 2 τ k ) ) 2 .
From previous calculations we have a ~ 8 × 10⁻¹⁰ m, α = 8.9 kBT and β = −3.24 kBT, using for the diffusion coefficient the value of D = 4 × 10⁻¹⁰ m2 s−1 and the τK values from the last column on Table 2, we calculate the average surface and subsurface electrostatic potential shown in Table 3. In that table ψ0 was estimated from the Poisson-Boltzmann theory [21],
e ψ 0 k B T 2 l n ( 2 b ϕ 0 )
where b was defined above, b = [ π l B / ( 2 a ϕ b ) ] 1 / 2 .
The obtained theoretical values for the surface electrostatic potential, ψ0, are larger than the average, ψ ¯ , obtained from dynamic surface tension experiments. Because the subsurface electrostatic potential, ψa, should be lower than the surface electrostatic potential, ψ0, the average should be ψ ¯ <   ψ 0 , as it is in fact observed on Table 3. Note that the values of ψ0 and ψ ¯ approach each other as the surfactant concentration increases, which could be explained by ions self-screening (being G12-2-12 a cationic surfactant, as the surfactant concentration increases, the ionic strength increases, and the Debye length diminishes reducing the distance of the electrostatic interaction, even in the absence of added salt). It is worth mentioning that the obtained values are similar to those found for the cationic surfactant DTAB [10].
We cannot use the previous analysis for surfactant concentrations above the cmc, in this case the adsorption-desorption and aggregation-disaggregation of micelles [27,28] could play a role in the observed dynamics both in γ(t) and φ(t). The fact that the dynamics of surfactant adsorption at short times follow an exponential relaxation (see insets on Figure 5) could indicate that we are not accessing times short enough to see the diffusion-limited adsorption step.

4.4. Time-Resolved Surface Potential

The main feature we want to stress about the surface potential results is the existence of oscillations in φ during the adsorption process as shown in Figure 6. Despite the variability observed from each independent experiment, the qualitative behavior is always the same and for all surfactant concentrations. The several “relaxations” observed can be roughly fitted with exponentials:
ϕ = ϕ 0 + Δ ϕ   e x p ( t τ )
Some of the results of those fittings are shown in the figures. The number of processes observed in surface potential experiments seem to be related to the several processes observed in dynamic surface tension. However, the times and characteristic times are different. The differences found in the time when the surface potential and surface tension change is probably due to the way in which time-resolved surface potential measurements are done. After the concentration impulse, there is a time delay, because of the concentration homogenization in bulk, before adsorption takes place. Despite that, it is clear that the large φ(t) oscillations are not replicated as large oscillations in surface tension. This is an indication that the behavior of φ is due to the reorganization of counterions at the interfacial region and not due to the migration of surfactant molecules into and out to the interface, at least in such amounts that could produce appreciable changes in the surface tension. We could rationalize the results as follows: First the G12-2-12 surfactant adsorbs onto the interface producing an increase of the surface potential from that of pure water. This process is fast and consistent with the decrease of the surface tension (see Figure 6 and Figure 7). The drop in surface potential that follows, could be due to the reorganization, redistribution, and condensation of charges, resulting in a temporal decrease of the measured surface potential. After that, and because the condensation of counter ions, a decrease in the charge repulsion among surfactant molecules, at the interface, would allow more surfactant molecules to adsorb, thereby producing a subsequent increase of the surface potential, and a slow decrease of surface tension, until the final equilibrium value is reached. This last process lasts from hundreds to thousands of seconds. The characteristic times obtained from fittings with Equation (8), labelled as τend in Figure 6 and Figure 7, span from 700 to 3500 s. It is worth mentioning here that these results help to explain the behavior of the surface step-compression rheology observed in these systems [11].
A final comment is needed about the apparent differences observed on the time-dependent surface potential curves of Figure 7. In those figures (see insets), we observe that the behavior for cs = 0.5 mM (and also for cs = 1mM in Figure 6) is different from those at lower surfactant concentrations. First note that, for cs = 0.1 and 0.2 mM, the change in the equilibrium surface potential goes through a maximum (Figure 8). This is probably because the interface is less saturated than for cs = 0.5 (see Figure 3b), therefore, the distances between charged heads are larger and the condensation of counterions onto the interface lower for cs = 0.1 and 0.2 (the distances between charges are larger than the Bjerrum length) than for cs = 0.5 mM. For this last concentration, the distances between charged surfactant heads at the interface are close to the Bjerrum length, thus, what we observe in the time-dependent surface potential after the first surfactant adsorption, could be a fast condensation of counterions onto the interface, followed by a slow surfactant adsorption until equilibrium is reached, a behavior not observed for the two lower concentrations.

5. Summary and Conclusions

We studied the adsorption dynamics of a cationic surfactant bearing two charges, Gemini 12-2-12, onto the air-solution interface. By means of dynamic surface tension and time-resolved surface potential, we have identified several processes with their characteristic times. For the more dilute solutions, well below the cmc, and at very short adsorption times, the adsorption is consistent with a process limited by diffusion (DLA). The final stage of the adsorption dynamics, close to equilibrium, follows the exponential law, derived from the existence of a surface potential, built up by the charged molecules as they adsorb onto the interface. This behavior for ionic surfactants were observed previously [10,20,21,29]. Between the initial diffusion controlled stage and the final kinetically controlled (KLA) adsorption process, several processes have been identified with their characteristic times. The number of processes observed depends on surfactant concentration. In this respect, the observed behavior is consistent with several processes and characteristic times, which are observed in step-compression surface rheology experiments on these systems [11], which help to explain them. Based on the surface potential results, it is clear that those processes are related to a charge reorganization in the interfacial region. The reorganization may include the formation of aggregates at the interface, condensation of counter-ions onto those aggregates, and further surfactant adsorption, as well as phase transitions [26,30]. For the surfactant concentrations above the cmc, some of the processes observed could be related to the presence of micelles and their dynamics (adsorption-desorption, aggregation-disaggregation [27,28]). The redistribution of charges within the interfacial region, as observed in the surface potential experiments, seems to be responsible for the existence of the intermediate relaxations, well-described by exponentials, which are observed on the dynamic surface tension curves. Finally, the existence of phase transitions or surfactant aggregates at the interface, mentioned above, remains to be probed experimentally.

Author Contributions

Conceptualization, H.R.; Methodology, M.F.L., E.C. and S.G.R.; Experimental realization M.F.L., S.G.R., E.C. and J.F.S.M.; Formal analysis, H.R., M.F.L and E.C; Writing—original draft preparation, H.R.; Writing—review and editing, M.F.L., E.C., J.F.S.M., H.R; Supervision, H.R. and M.F.L.; Project administration, H.R. All authors have read and agreed to the published version of the manuscript.

Funding

This research was funded by Universidad Nacional del Sur (UNS, Argentina) under grant PGI-UNS 24/F080; by Agencia Nacional de Promoción Científica y Tecnológica (ANPCyT, Argentina) under grant PICT-2016-0787 and by Consejo Nacional de Investigaciones Científicas y Técnicas (CONICET, Argentina) under grant PIP-GI 2014 Nro 11220130100668CO.

Conflicts of Interest

The authors declare no conflicts of interest.

References

  1. Georgieva, D.; Schmitt, V.; Leal-Calderon, F.; Langevin, D. On the Possible Role of Surface Elasticity in Emulsion Stability. Langmuir 2009, 25, 5565–5573. [Google Scholar] [CrossRef] [PubMed]
  2. Georgieva, D.; Cagna, A.; Langevin, D. Link between Surface Elasticity and Foam Stability. Soft Matter 2009, 5, 2063. [Google Scholar] [CrossRef]
  3. Ravera, F.; Ferrari, M.; Santini, E.; Liggieri, L. Influence of Surface Processes on the Dilational Visco-Elasticity of Surfactant Solutions. Adv. Colloid Interface Sci. 2005, 117, 75–100. [Google Scholar] [CrossRef] [PubMed]
  4. Langevin, D. Rheology of Adsorbed Surfactant Monolayers at Fluid Surfaces. Annu. Rev. Fluid Mech. 2014, 46, 47–65. [Google Scholar] [CrossRef]
  5. He, Y.; Salonen, A.; Lecchi, A.; Veber, M.; Langevin, D. Adsorption of Gemini Surfactants at the Air-Water Surface. Colloid Polym. Sci. 2016, 294, 483–490. [Google Scholar] [CrossRef]
  6. Ward, A.F.H.; Tordai, L. Time-Dependence of Boundary Tensions of Solutions I. The Role of Diffusion in Time-Effects. J. Chem. Phys. 1946, 14, 453–461. [Google Scholar] [CrossRef]
  7. Bleys, G.; Joos, P. Adsorption Kinetics of Bolaform Surfactants at the Air/Water Interface. J. Phys. Chem. 1985, 89, 1027–1032. [Google Scholar] [CrossRef]
  8. Bonfillon, A.; Langevin, D. Viscoelasticity of Monolayers at Oil-Water Interfaces. Langmuir 1993, 2172–2177. [Google Scholar] [CrossRef]
  9. Bonfillon, A.; Langevin, D. Electrostatic Model for the Viscoelasticity of Ionic Surfactant Monolayers. Langmuir 1994, 10, 2965–2971. [Google Scholar] [CrossRef]
  10. Ritacco, H.; Langevin, D.; Diamant, H.; Andelman, D. Dynamic Surface Tension of Aqueous Solutions of Ionic Surfactants: Role of Electrostatics. Langmuir 2011, 27, 1009–1014. [Google Scholar] [CrossRef] [Green Version]
  11. Cuenca, V.E.; Fernández Leyes, M.; Falcone, R.D.; Correa, N.M.; Langevin, D.; Ritacco, H. Interfacial Dynamics and Its Relations with “Negative” Surface Viscosities Measured at Water–Air Interfaces Covered with a Cationic Surfactant. Langmuir 2019, 35, 8333–8343. [Google Scholar] [CrossRef] [PubMed]
  12. Adamson, A.; Gast, A. Physical Chemistry of Surfaces, 6th ed.; Jhon Wiley & Sons: New York, NY, USA, 1997. [Google Scholar]
  13. Cuenca, V.E.; Falcone, R.D.; Silber, J.J.; Correa, N.M. How the Type of Cosurfactant Impacts Strongly on the Size and Interfacial Composition in Gemini 12-2-12 RMs Explored by DLS, SLS, and FTIR Techniques. J. Phys. Chem. B 2016, 120, 467–476. [Google Scholar] [CrossRef] [PubMed]
  14. Zana, R.; Benrraou, M.; Rueff, R. Alkanediyl-.Alpha.,.Omega.-Bis(Dimethylalkylammonium Bromide) Surfactants. 1. Effect of the Spacer Chain Length on the Critical Micelle Concentration and Micelle Ionization Degree. Langmuir 1991, 7, 1072–1075. [Google Scholar] [CrossRef]
  15. Ritacco, H.; Kurlat, D.; Langevin, D. Properties of Aqueous Solutions of Polyelectrolytes and Surfactants of Opposite Charge: Surface Tension, Surface Rheology, and Electrical Birefringence Studies. J. Phys. Chem. B 2003, 107, 9146–9158. [Google Scholar] [CrossRef]
  16. Fainerman, V.B.; Miller, R. The Maximum Bubble Pressure Technique. In Drop and Bubbles in Interfacial Science; Möbius, M.E., Miller, R., Eds.; Elsevier B.V.: Amsterdam, The Netherlands, 1998; pp. 279–326. [Google Scholar]
  17. Espert, A.; von Klitzing, R.; Poulin, P.; Colin, A.; Zana, R.; Langevin, D. Behavior of Soap Films Stabilized by a Cationic Dimeric Surfactant. Langmuir 1998, 14, 4251–4260. [Google Scholar] [CrossRef]
  18. Li, Z.X.; Dong, C.C.; Thomas, R.K. Neutron Reflectivity Studies of the Surface Excess of Gemini Surfactants at the Air-Water Interface. Langmuir 1999, 15, 4392–4396. [Google Scholar] [CrossRef]
  19. Zana, R. Dimeric and Oligomeric Surfactants. Behavior at Interfaces and in Aqueous Solution: A Review. Adv. Colloid Interface Sci. 2002, 97, 205–253. [Google Scholar] [CrossRef]
  20. Diamant, H.; Ariel, G.; Andelman, D. Kinetics of Surfactant Adsorption: The Free Energy Approach. Colloids Surf. A Physicochem. Eng. Asp. 2001, 183–185, 259–276. [Google Scholar] [CrossRef] [Green Version]
  21. Diamant, H.; Andelman, D. Kinetics of Surfactant Adsorption at Fluid-Fluid Interfaces. J. Phys. Chem. 1996, 100, 13732–13742. [Google Scholar] [CrossRef] [Green Version]
  22. Almeida, J.A.S.; Pinto, S.P.R.; Wang, Y.; Marques, E.F.; Pais, A.A.C.C. Structure and Order of DODAB Bilayers Modulated by Dicationic Gemini Surfactants. Phys. Chem. Chem. Phys. 2011, 13, 13772–13782. [Google Scholar] [CrossRef]
  23. Manning, G.S. Limiting Laws and Counterion Condensation in Polyelectrolyte Solutions II. Self-Diffusion of the Small Ions. J. Chem. Phys. 1969, 51, 934. [Google Scholar] [CrossRef]
  24. Manning, G.S. Limiting Laws and Counterion Condensation in Polyelectrolyte Solutions I. Colligative Properties. J. Chem. Phys. 1969, 51, 924. [Google Scholar] [CrossRef]
  25. Nilsson, M.; Cabaleiro-Lago, C.; Valente, A.J.M.; Söderman, O. Interactions between Gemini Surfactants, 12-s-12, and β-Cyclodextrin As Investigated by NMR Diffusometry and Electric Conductometry. Langmuir 2006, 22, 8663–8669. [Google Scholar] [CrossRef] [PubMed] [Green Version]
  26. Monroy, F.; Giermanska Kahn, J.; Langevin, D. Dilational Viscoelasticity of Surfactant Monolayers. Colloids Surf. A Physicochem. Eng. Asp. 1998, 143, 251–260. [Google Scholar] [CrossRef]
  27. Bonfillon, A.; Sicoli, F.; Langevin, D. Dynamic Surface Tension of Ionic Surfactant Solutions. J. Colloid Interface Sci. 1994, 168, 497–504. [Google Scholar] [CrossRef]
  28. Bykov, A.G.G.; Liggieri, L.; Noskov, B.A.A.; Pandolfini, P.; Ravera, F.; Loglio, G. Surface Dilational Rheological Properties in the Nonlinear Domain. Adv. Colloid Interface Sci. 2015, 222, 110–118. [Google Scholar] [CrossRef]
  29. Miller, R.; Aksenenko, E.V.; Fainerman, V.B. Dynamic Interfacial Tension of Surfactant Solutions. Adv. Colloid Interface Sci. 2017, 247, 115–129. [Google Scholar] [CrossRef]
  30. Fainerman, V.B.; Mys, V.D.; Makievski, A.V.; Petkov, J.T.; Miller, R. Dynamic Surface Tension of Micellar Solutions in the Millisecond and Submillisecond Time Range. J. Colloid Interface Sci. 2006, 302, 40–46. [Google Scholar] [CrossRef]
Figure 1. (a) Scheme of the Maximum Pressure Apparatus. (b) Picture of the device showing the tip and the step-motor.
Coatings 10 00095 g001
Figure 2. Scheme of the time-resolved surface potential experiment.
Coatings 10 00095 g002
Figure 3. (a) Surface tension isotherm for Gemini 12-2-12. The lines are two different fittings with Equation (2), see Discussion section for details. (b) Equilibrium surface concentration as a function of bulk concentration calculated from Equation (2) (c) Surface tension as a function of surfactant area fraction at equilibrium (see Equation (2)).
Coatings 10 00095 g003
Figure 4. Dynamic surface tension curves for 6 surfactant concentrations well below the cmc (a) cs = 0.1 mM; (b) cs = 0.2 mM; (c) cs = 0.3 mM; (d) cs = 0.4 mM; (e) cs = 0.5 mM; (f) cs = 0.6 mM. The insets are amplifications of the very short adsorption times regions, the curves in them are fittings with Equation (3). The shaded regions represent the equilibrium surface tension (with error) measured by the Wilhelmy plate technique.
Coatings 10 00095 g004
Figure 5. Dynamic surface tension for surfactant concentrations close and above the cmc. (a) 0.8 mM; (b) 1 mM; (c) 2 mM. The insets show the dynamics of adsorption at very short times (<0.5 s). The lines are fittings with Equation (5).
Coatings 10 00095 g005
Figure 6. Surface potential curves (symbols in color, left axis) superimposed to the dynamic surface tension, γ(t) (circles, black, right axis) for a solution at a surfactant concentration of 1 mM. We show three independent surface potential experiments (Exp 1, 2 and 3) to illustrate the “reproducibility” of such measurements.
Coatings 10 00095 g006
Figure 7. Time dependence of the Surface potential compared with dynamic surface tension (Surface tension in black, right axis) for three surfactant concentrations. (a) cs = 0.1 mM, (b) cs = 0.2 mM, (c) cs = 0.5 mM. The insets show the surface potential but with the time axis in linear scale.
Coatings 10 00095 g007
Figure 8. Change in the surface potential between water and surfactant solutions, ∆φ = φφwater, as a function of surfactant concentration. This curve includes the values for cs = 0.01 and 0.06 mM which are not included in Figure 7.
Coatings 10 00095 g008
Figure 9. Several relaxation processes following an exponential decay were observed in dynamic surface tension curves at concentrations below the cmc. (a) cs = 0.1 mM, (b) 0.2 mM, (c) 0.3 mM, (d) 0.4 mM, (e) 0.5 mM, (f) 0.6 mM.
Coatings 10 00095 g009
Figure 10. Several relaxation times following an exponential decay at concentrations above the cmc. (a) cs = 0.8 mM, (b) 1 mM, (c) 2 mM.
Coatings 10 00095 g010
Table 1. Characteristic times obtained from fittings with Equation (3), and the diffusion coefficients, D, calculated with Equation (4). The surfactant concentrations are all below the cmc.
cs/mMτD/sD/m2 s−1
0.10.25 ± 0.014.1 × 10−10
0.20.43 ± 0.041.1 × 10−10
0.30.048 ± 0.025.0 × 10−10
0.40.025 ± 0.015.4 × 10−10
0.50.48 ± 0.051.8 × 10−11
0.60.1 ± 0.056 × 10⁻¹¹
Table 2. Characteristic times, in seconds, found in dynamic surface tension for all surfactant concentrations studied.
cs/mMτ1τ2τ3τ4τk
0.1------6.5 ± 137 ± 1
0.2-------28.5 ± 1105 ± 12
0.3----2.4 ± 0.19.5 ± 120 ± 3
0.4----5.1 ± 0.19.5 ± 0.5180 ± 40
0.5--10.4 ± 0.520 ± 140 ± 2120 ± 15
0.6--0.71 ± 0.0028 ± 130 ± 267 ± 3
0.80.4 ± 0.011.34 ± 0.0053.7 ± 0.125 ± 144 ± 4
10.45 ± 0.001--3.6 ± 0.115 ± 174 ± 4
20.48 ± 0.001--2.6 ± 0.17.8 ± 0.533 ± 2
Table 3. Average ( ψ ¯ ), the equilibrium surface (ψ0) and subsurface (ψa) electrostatic potentials from Equations (6) and (7). ψa is calculated as 2 ψ ¯ ψ 0 = ψ a .
cs/mM e ψ ¯ / k B T 0/kBTa/kBT
0.14.9611.26−1.34
0.26.1710.931.41
0.35.7510.560.94
0.47.1410.274.01
0.57.1510.054.25
0.67.059.874.23
0.87.129.584.66

