Article

An Integrated Method for Multi-Objective Optimization of Multi-Pass Fe50/TiC Laser Cladding on AISI 1045 Steel based on Grey Relational Analysis and Principal Component Analysis

1
School of Materials Science and Engineering, Fujian University of Technology, Fuzhou 350118, China
2
Fujian Provincial Key Laboratory of Advanced Materials Processing and Application, Fuzhou 350118, China
3
Fujian Engineering Research Center of Precision Forming Manufacturing, Fuzhou 350118, China
4
School of Mechanical and Automotive Engineering, Fujian University of Technology, Fuzhou 350118, China
*
Author to whom correspondence should be addressed.
Coatings 2020, 10(2), 151; https://doi.org/10.3390/coatings10020151
Submission received: 10 December 2019 / Revised: 14 January 2020 / Accepted: 22 January 2020 / Published: 8 February 2020
(This article belongs to the Section Surface Characterization, Deposition and Modification)

Abstract

:
As an essentially multi-input multi-output process, determination of optimal conditions for laser cladding normally requires multi-objective optimization. To understand multi-response coupling, the effects of processing parameters on the morphology quality of multi-pass laser claddings of Fe50/TiC on medium carbon steel AISI 1045 were investigated based on composite central design using response surface methodology. Multiple responses, including clad width, flatness, and non-fusion area, were transformed into a single objective through grey relational analysis, with weights objectively identified by principal component analysis. The correlation between grey relational grade (GRG) and process parameters was established by regression analysis. The results show that the GRG response model has excellent goodness of fit and predictive performance. A validation experiment was conducted at the process condition optimized for maximum GRG. The relative error of the predicted optimal GRG is 4.87% whereas those of interested individual objectives, i.e. clad width, flatness, and non-fusion area, are 5.73%, 2.97%, and 6.73%, respectively, which verifies the accuracy of the established model. The investigation of mechanical properties suggests the hardness of substrate can be improved from 20 HRC to 60 HRC and wear resistance to over 8.14 times better.

1. Introduction

Laser cladding is a widely used surface engineering technology which applies high density laser energy to the substrate with additive powder to rapidly obtain metallurgical bonding and significantly improve mechanical, physical, and chemical properties of the substrate surface, such as wear, corrosion, and oxidization resistance [1,2]. Due to its low dilution, small distortion, and better surface quality compared with conventional processes, laser cladding technology has been implemented in numerous fields like metallurgical mining, energy transportation, machinery manufacturing, and aerospace [3,4].
Quality assessment of laser claddings normally considers a variety of aspects including morphology, properties, and production attributes, leading to an essentially multi-objective evaluation problem. Some academics considered multiple responses of laser cladding process independently when conducting optimization. The authors of [5,6,7] used regression analysis (RA) to develop empirical–statistical relationships between key parameters and geometrical characteristics of single-pass NiCrAlY, Ti-6Al-4V, and WC-12Co claddings (i.e., clad height, clad width, penetration depth, wetting angle, and dilution) as a combined parameter ( P α V β F γ ). These empirical–statistical relationships were found to be in good agreement with measured values of single clad passes. Shi et al. [8] evaluated the effects of processing parameters (laser power, scanning velocity, and powder mass flow rate) on the geometric form of clad (clad height, width, and depth penetration into the substrate) using multiple regression analysis (MRA). With optimized process parameters, a 45-mm-high thin wall was formed with smooth side surfaces. By applying individual objectives, the laser cladding process can be easily optimized for each criterion. However, multiple optimizations of process conditions are hard to combine into a common goal.
Many researchers have presented numerous methodologies to integrate multiple objectives for process optimization. Grey relational analysis (GRA), a process of quantifying the dynamic development of complex systems, has become an efficient method to reveal the correlation between influencing factors and multiple responses [9,10]. Mondal et al. [11] prepared Ni/Cr/Mo composite coatings on AISI 1040 steel with a L9 orthogonal array, using GRA (response target weight was one-third) to build the relationship between process parameters (laser power, scan speed, and powder feed rate) and clad quality characteristics (clad height and width) to produce the best geometrical morphology. Zhang and Kovacevic [12] also developed AISI 420/VC composite coatings on an A36 surface with L9 orthogonal array, applying the grey relational method (contribution one-third) to optimize processing parameters (laser power, scanning speed, and powder feed rate) considering multiple characteristics related to wear resistance (clad height, carbide volume fraction, and Fe matrix hardness). Yu et al. [13] deposited Fe313 claddings on S55C carbon steel surface with an L25 orthogonal array through grey relational theory (contribution one-third), using analysis of variance (ANOVA) to quantify the process–response correlation. The optimized cladding layer has shown advantages over others in morphology and microstructure, verifying the feasibility of the Taguchi-grey relational method. Manikandan et al. [14] coated Ti6Al4V substrate with corresponding powder using an L16 orthogonal array, and also used GRA (contribution one-quarter) to optimize the performance characteristics (tensile strength, clad hardness, grain size, and clad porosity). Therefore, GRA is an effective method for optimizing multiple-response problems. The problem with the current method is lack of objective weight assignment approach for multiple responses.
Many academics have studied the application of intelligent algorithms to optimize process parameters for an overall best performance of cladding layers. Mondal et al. [15] prepared Cr/Ni/Mo composite coatings on commercial mild steel (S235) via laser cladding, and established the interrelationship between process variables (laser power, scan speed of work table, and powder feed rate) and response variables (clad width and depth) using a back propagation artificial neural network (BPANN). Similarly, Liu et al. [16] applied a genetic algorithm-back propagation neural network (GA-BPNN) to better understand the nonlinear correlation between process parameters (laser power, powder thickness, and scanning speed) and geometrical characteristics of a single pass sectional profile (clad height, clad width, and contact angle) deposited by a high power diode laser (HPDL) with a rectangle spot. They suggested that the prediction accuracy of established BPNN was significantly improved by implementing the genetic algorithm. Sohrabpoor [17] presented an adaptive neuro-fuzzy inference system (ANFIS) to model the process response of laser powder deposition of Fe-based alloy on ASTM 36 mild steel and improved the model accuracy using the imperialist competitive algorithm (ICA). Chen et al. [18] investigated the effects of process parameters (laser power, scanning speed, pre-paced powder thickness, laser spot diameter, and overlapping ratio) on the quality characteristics (coating thickness, coating width, coating height, and micro-hardness) of TiC coating on Ti6Al4V substrates. The correlation model was then established effectively based on support vector machine (SVM). The issues for this method are that ANN modelling involves a set of complicated mathematical structures and thus requires large amount of experimental data.
In this work, a novel method integrating GRA with principal component analysis (PCA) is proposed to investigate the multiple responses of multi-pass Fe50/TiC laser cladding on cylindrical substrates composed of AISI 1045 carbon steel. A composite central design (CCD) was developed based on response surface methodology (RSM) to evaluate the effects of significant factors (power ratio, laser power, defocusing distance, and overlapping ratio) on the surface quality of single layer multi-pass claddings with only limited experimental runs. The multiple responses, including clad width, flatness, and non-fusion area, were integrated into a single objective using grey relational analysis with response weights objectively determined by PCA. The values of grey relational grade (GRG) were then found to be an exponential parabola function of process parameters. The established regression model was validated with an experiment of optimized process condition.

2. Material and Methods
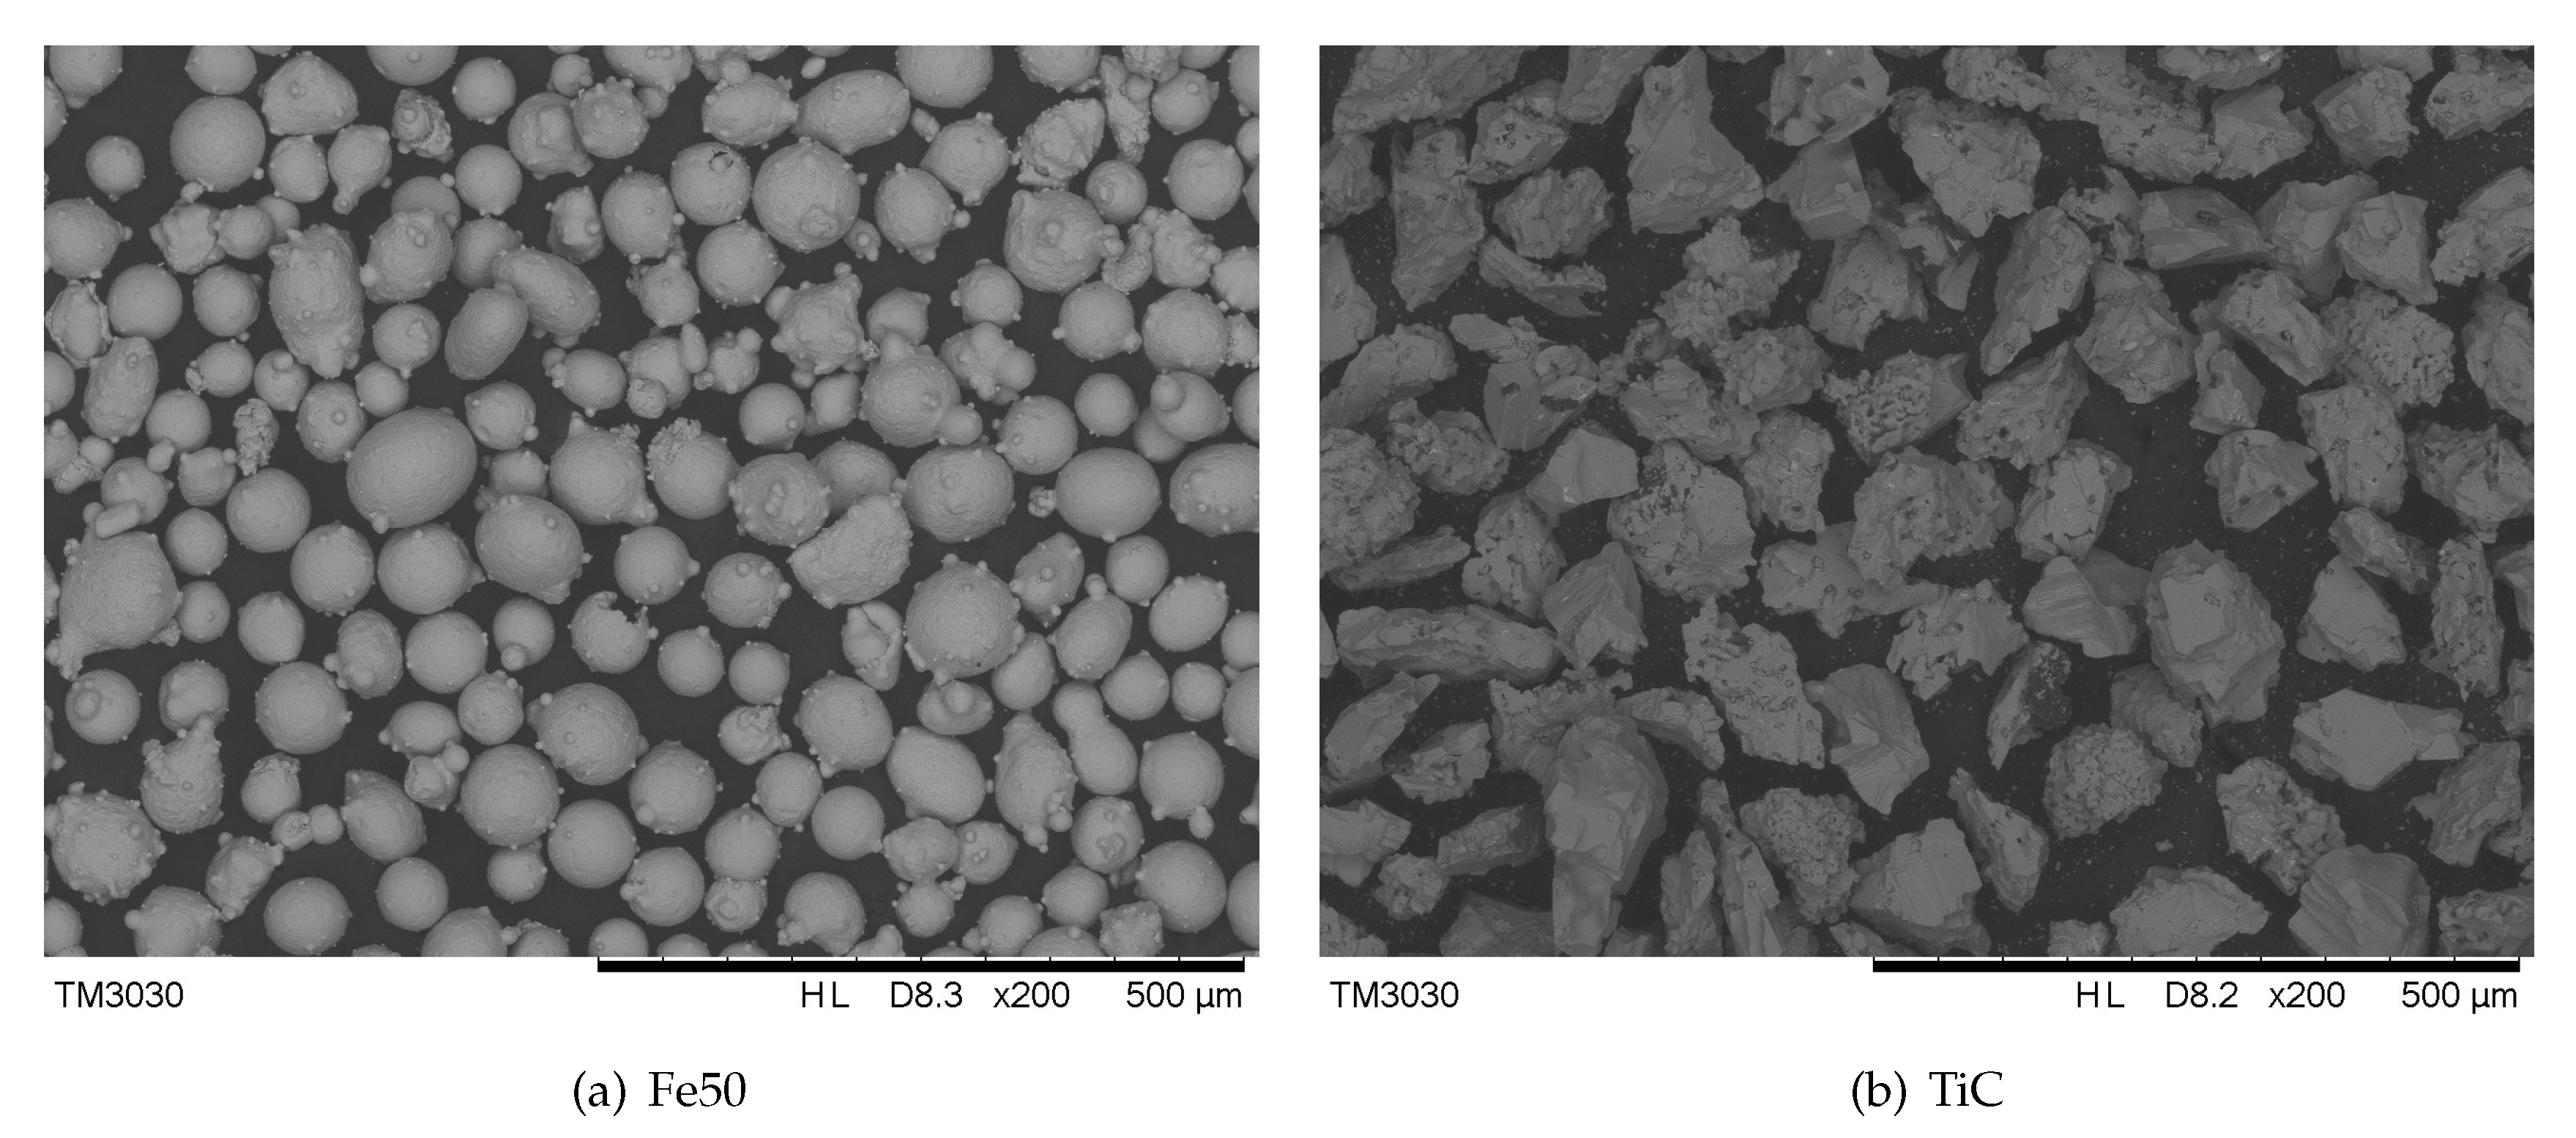
2.1. Material

The substrates, with dimension of ϕ 60 mm × 60 mm, were composed of AISI 1045 steel. Cladding powders Fe50 ( ρ = 7.78 g/cm 3 , melting point of 1080 C) and TiC ( ρ = 4.93 g/cm 3 , melting point of 3140 C) were supplied by Yuteng Ceramic Material, Ltd., Zhangzhou, China. Microscopic profiles and chemical components are illustrated in Figure 1, Table 1 and Table 2, respectively.

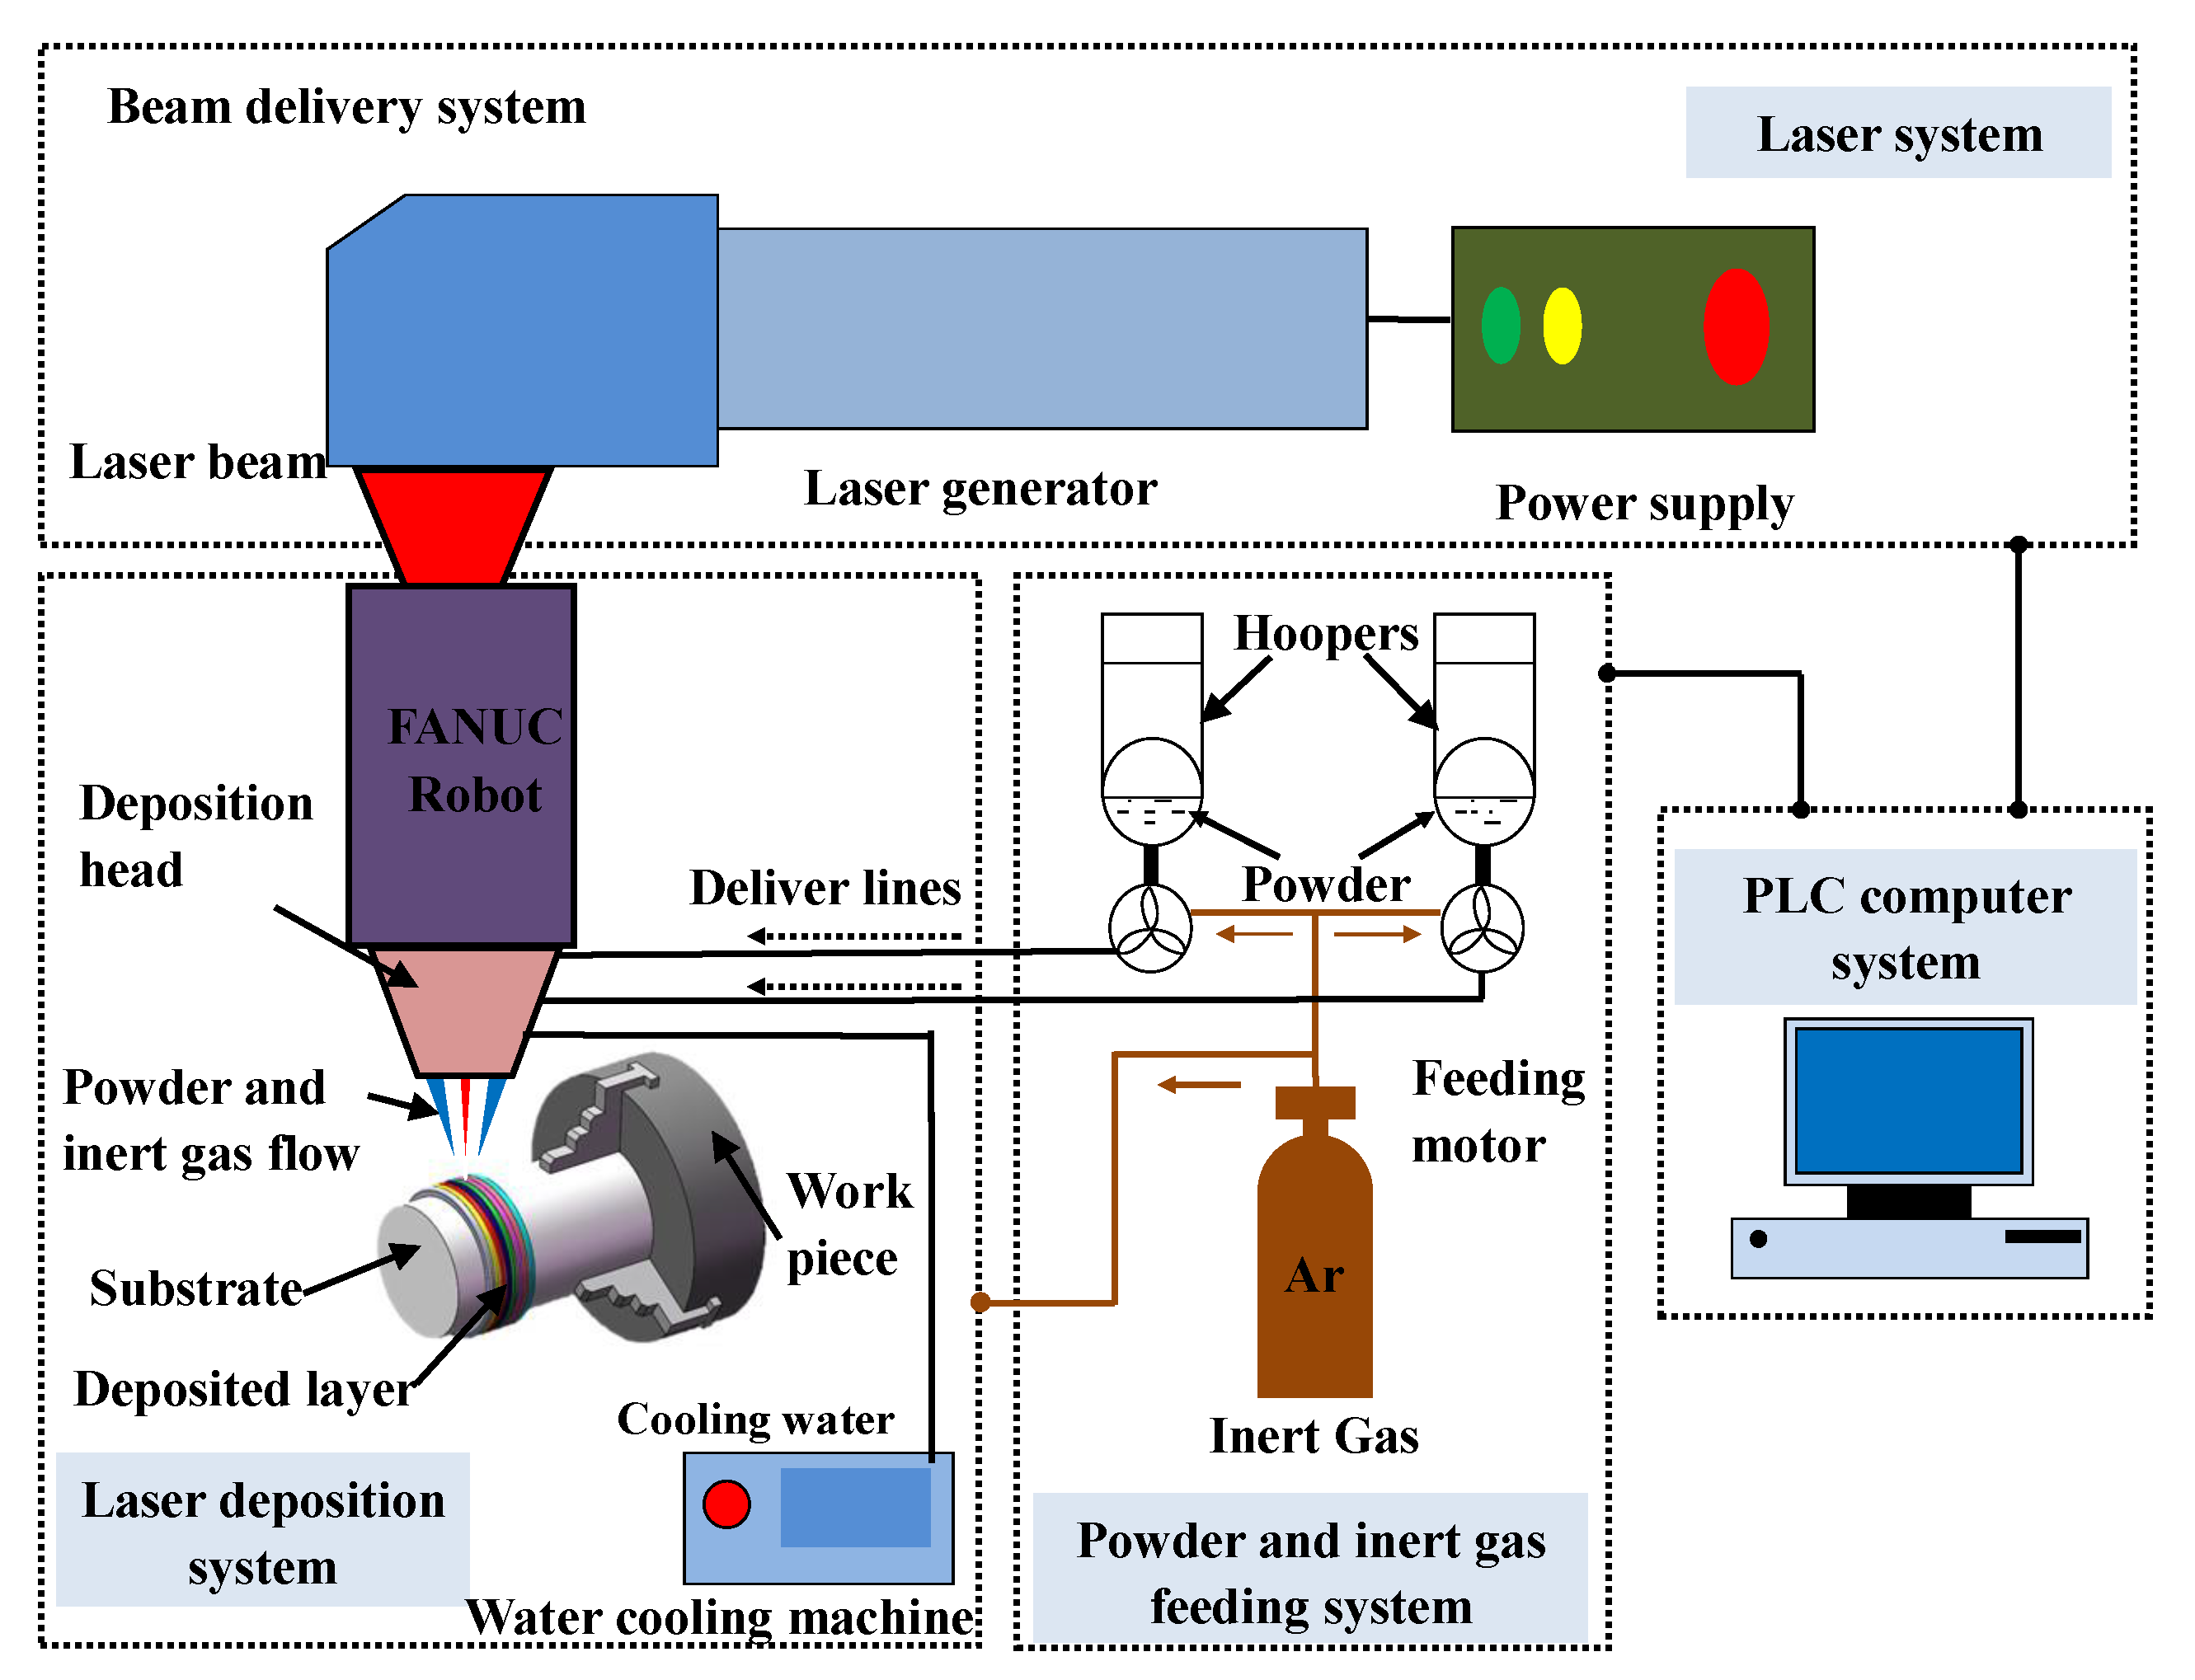
2.2. Experimental Set-up

The laser cladding system used in the work, as depicted in Figure 2, is comprised of a laser head FDH0273 (Lasermesh, USA) with a focus length of 300 mm, an industrial robot M-710iC/50 (FANUC, Japan), a high power fiber laser YLS-3000 (IPG, Germany) cooled by a TFLW-4000WDR-01-3385 laser chiller (Tongfei, China), a gas-conveyed coaxial powder feeding machine CR-PGF-D-2 (Songxing, China), and a rotational Leadshine worktable. The cladding powder as blown onto the substrate by carrier/shielding argon gas at a pressure of 0.5 MPa, with purity contents listed in Table 3.
Before cladding, the substrate was cleaned with acetone to remove surface impurities and dried in a vacuum. The cladding powder was mixed according to the designated mass fraction in a YXQM-2L planetary ball mill machine at a speed of 300 rpm for 2 h, followed by 30 min vacuum drying at a temperature of 120 C. Cladding powders were then deposited onto the substrate at ambient temperature. After laser cladding, the specimen was sectioned by wire-EDM in the longitudinal direction to prepare metallographic samples of 20 mm×3 mm×5 mm, which were then mounted, ground, and polished for geometrical morphology using a KH-1300 three-dimensional (3D) digital microscopy system (Hirox, Japan) after etching in 4% nital.

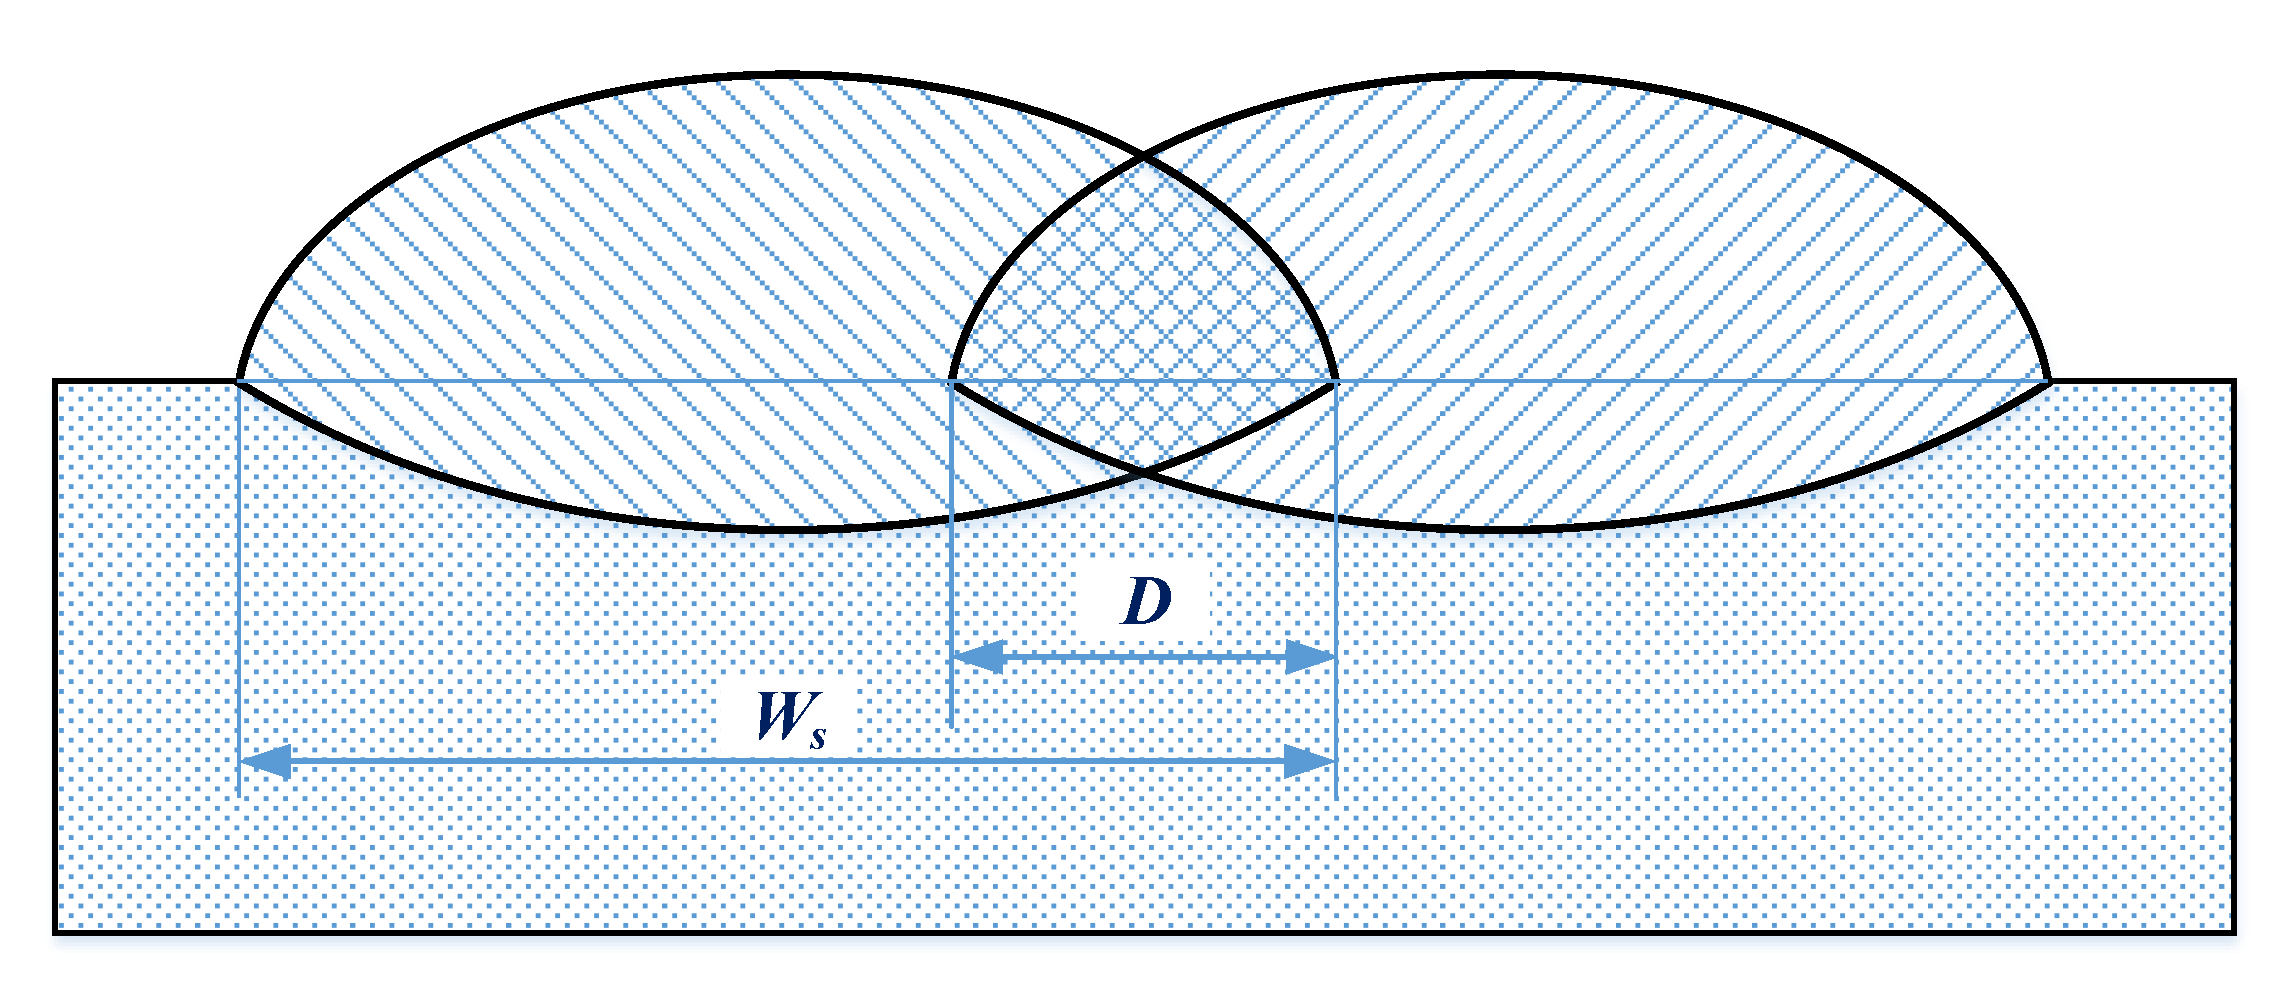
2.3. Design of Experiment

RSM is a comprehensive optimization method for experiment design and modelling. Compared with orthogonal design, RSM is capable of establishing correlations between targets and influencing factors with high accuracy but lower experiment cost [19,20]. We used central composite design to produce an experimental matrix for four factors with five levels (Specifically, 24 axial points and 6 replicated centre points). The four investigated factors were powder ratio (PR) of TiC, laser power (LP), defocusing distance (DD), and overlapping ratio (OR). Table 4 illustrates the studied factors and their levels. The detailed experimental matrix was obtained according to CCD as illustrated in Table 5. A laser beam of 4 mm in diameter was obtained when focused on the substrate surface. OR is the ratio of overlapped distance (D) between two adjacent passes to the width of single pass ( W s ), as demonstrated in Figure 3. The ranges of the four variables were selected based on previous investigation. Other parameters were remained constant: scanning speed = 7 mm/s and gas-powder flow rate = 1100 L/h.
The response variables investigated included clad width (W), flatness (F) of multi-pass, and non-fusion areas ( A nf ), as illustrated in Figure 4 and defined by Equations (1) and (2) [21], respectively. The experimental results are appended in Table 5.
F = A c W × H
A nf = i = 1 n A nf i
where A c is the multi-pass clad area, W is the total width of 8 passes, H is the maximum height of the clad layer, and A nf i is the non-fused area between adjacent ith and i + 1 th pass.

3. Multi-Objective Approach

In this section, a new approach integrating GRA with PCA for weight determination is proposed to optimize the multi-objective problem, with the detailed procedure outlined below.

3.1. Selection of Signal-to-Noise Ratios

In signal processing, signal-to-noise ratio (SNR) is commonly used to understand the extent to which a desired property is affected by background noise. The higher the SNR, the better the product performance [22,23]. To obtain good quality multi-pass laser claddings, the SNRs of three responses were investigated to reveal the effects of the process parameters. The performance characteristics can be classified into three categories: the Larger the Better (LB), the Smaller the Better (SB), and the Nominal the Better (NB) [23,24]. Specifically, the clad width (W) and flatness (F) are considered as LB, whereas the non-fusion area ( A nf ) is set to be SB, as calculated by
S / N = 10 log 1 n i = 1 n 1 y i 2 for LB 10 log 1 n i = 1 n y i 2 for SB
where n is the total number of experiments and y i is the output value of the ith experimental run.

3.2. Normalization of SNR Values

As the three responses have different ranges, normalization of SNR values was conducted to obtain a common scale. In grey relational generation, the normalized responses correspond to the LB criterion, which can be expressed as [25,26]:
y i * ( k ) = y i ( k ) min y i ( k ) max y i ( k ) min y i ( k )
where y i * ( k ) are the data after normalization, y i ( k ) is the response SNRs, and max y i ( k ) and min y i ( k ) are the maximum and minimum of the S/N data, respectively.

3.3. Calculation of Grey Relational Coefficients

The grey relational coefficient can be computed as follows [27,28]:
ξ i * ( k ) = Δ min + ψ Δ max Δ O i ( k ) + ψ Δ max
where Δ O i ( k ) = | Y i ( k ) y i * ( k ) | is the absolute value of difference between Y i ( k ) and y i * ( k ) , which are the ideal sequence (always 1), and the normalized value for the kth response. ψ is a distinguishing coefficient 0 ψ 1 , where ψ = 0.5 for all quality characteristics. Δ max and Δ min are the largest and smallest values of Δ O i ( k ) , respectively.

3.4. Determination of Response Weights

Conventionally, the weights for responses in grey relational generation are subjectively selected and usually set impartially. However, for laser cladding, different responses in terms of clad profile and mechanical properties normally require objective weight assignment. PCA, as a dimension reduction technique, is useful for identifying significant features of high-dimensional data and projects them onto a new subspace with equal or fewer dimensions [29]. The contributions of the three responses, i.e., clad width, flatness, and non-fusion area, were determined with PCA using the following procedure [30,31].

3.4.1. Selection of Principal Components

(a) Establish original data sequence for multiple responses by Equation (6).
Y = y 11 y 12 . y 1 n y 21 y 22 . y 2 n y m 1 y m 2 . y m n
where m is the number of experiment runs, n is the number of output variables, and y represents the observed response value. For this work, m = 30 and n = 3.
(b) Compute the correlation efficient matrix using Equation (7).
R j l = C o v ( y i ( j ) , y i ( l ) ) η y i ( j ) × η y i ( l ) )
where C o v ( y i ( j ) , y i ( l ) ) is the covariance of data sequence y i ( j ) and y i ( l ) , and η y i ( j ) and η y i ( l ) are the standard deviations of y i ( j ) and y i ( j ) , respectively.
(c) Determine eigenvalues λ k and eigenvectors by solving the characteristic equation:
| λ k I m R | = 0
where I m is the unit matrix. λ 1 λ 2 λ 3 λ k 0 , k = 1 , 2 , , n are ranked eigenvalues in descending order.
(d) Select principal components. With contribution rate M k and cumulative contribution rate N k obtained from Equations (9) and (10), the top k principal components are selected when N k 80% which accounts for the most significant features.
M k = λ k i = 1 n λ i
N k = i = 1 k λ k i = 1 n λ i
(e) Calculate principal component loads that reflect the correlation extent between principal component M k and original variable Y j , by:
P j l = P ( M l , Y j ) = λ l R j l ( l = 1 , 2 , , k ; j = 1 , 2 , , n )

3.4.2. Calculation of Response Weights

(a) Identify weights for principal components in linear combination using Equation (12):
K j l = P j l λ l ( l = 1 , 2 , , k ; j = 1 , 2 , , n )
(b) Compute coefficients in the score model by Equation (13):
K j = i = 1 n i = 1 k K j l M l i = 1 n M l
(c) Obtain weights after normalization by:
β j = K j i = 1 n K j

3.5. Calculation of Grey Relational Grade

Grey relational grade (GRG) is the weighted sum of grey relational coefficients, as shown in Equation (15):
G = i = 1 n β i ξ i * ( k )
where i = 1 n ξ i * = 1 , and β i is the weight of the ith response identified by PCA.

4. Results and Discussion

4.1. SNR

Table 6 illustrates the SNRs of the three responses. The maximum SNR values were obtained at the 26th, 7th, and 28th experimental runs for the three responses (S/N W = 23.7504 dB, S/N F = −0.5476 dB, and S/N A = 16.3631 dB), respectively. Therefore, an optimized condition cannot be achieved for the three variables simultaneously.

4.2. Response Weights

The results of principal component analysis are illustrated in Table 7. From Table 7, the eigenvalues for the first and second principal components are greater than one ( λ 1 = 1.847, λ 2 = 1.001), which indicates their more significant impacts. The cumulative contribution of the first and second eigenvalues was 94.926%. The load coefficients of two components were thus obtained, as listed in Table 8.
The coefficients for the linear combinations of two principal components are shown in Table 9.
With the coefficients, the corresponding combinations of three variables were obtained as depicted in Equation (16):
F 1 = 0.4503 W + 0.5452 F + 0.7071 A nf F 2 = 0.7706 W 0.6367 F + 0.0010 A nf
Table 10 illustrates the score model coefficients and response weights.
The score model was then established by Equation (17):
Y = 0.5629 W + 0.1298 F + 0.4589 A nf

4.3. Grey Relational Grade

The results of grey relational grade were computed by applying the weights determined in the previous section, as illustrated in Table 11. The table shows that the largest GRG (0.7388) was obtained from the 28th experimental run, which suggests the optimum process parameter combination.

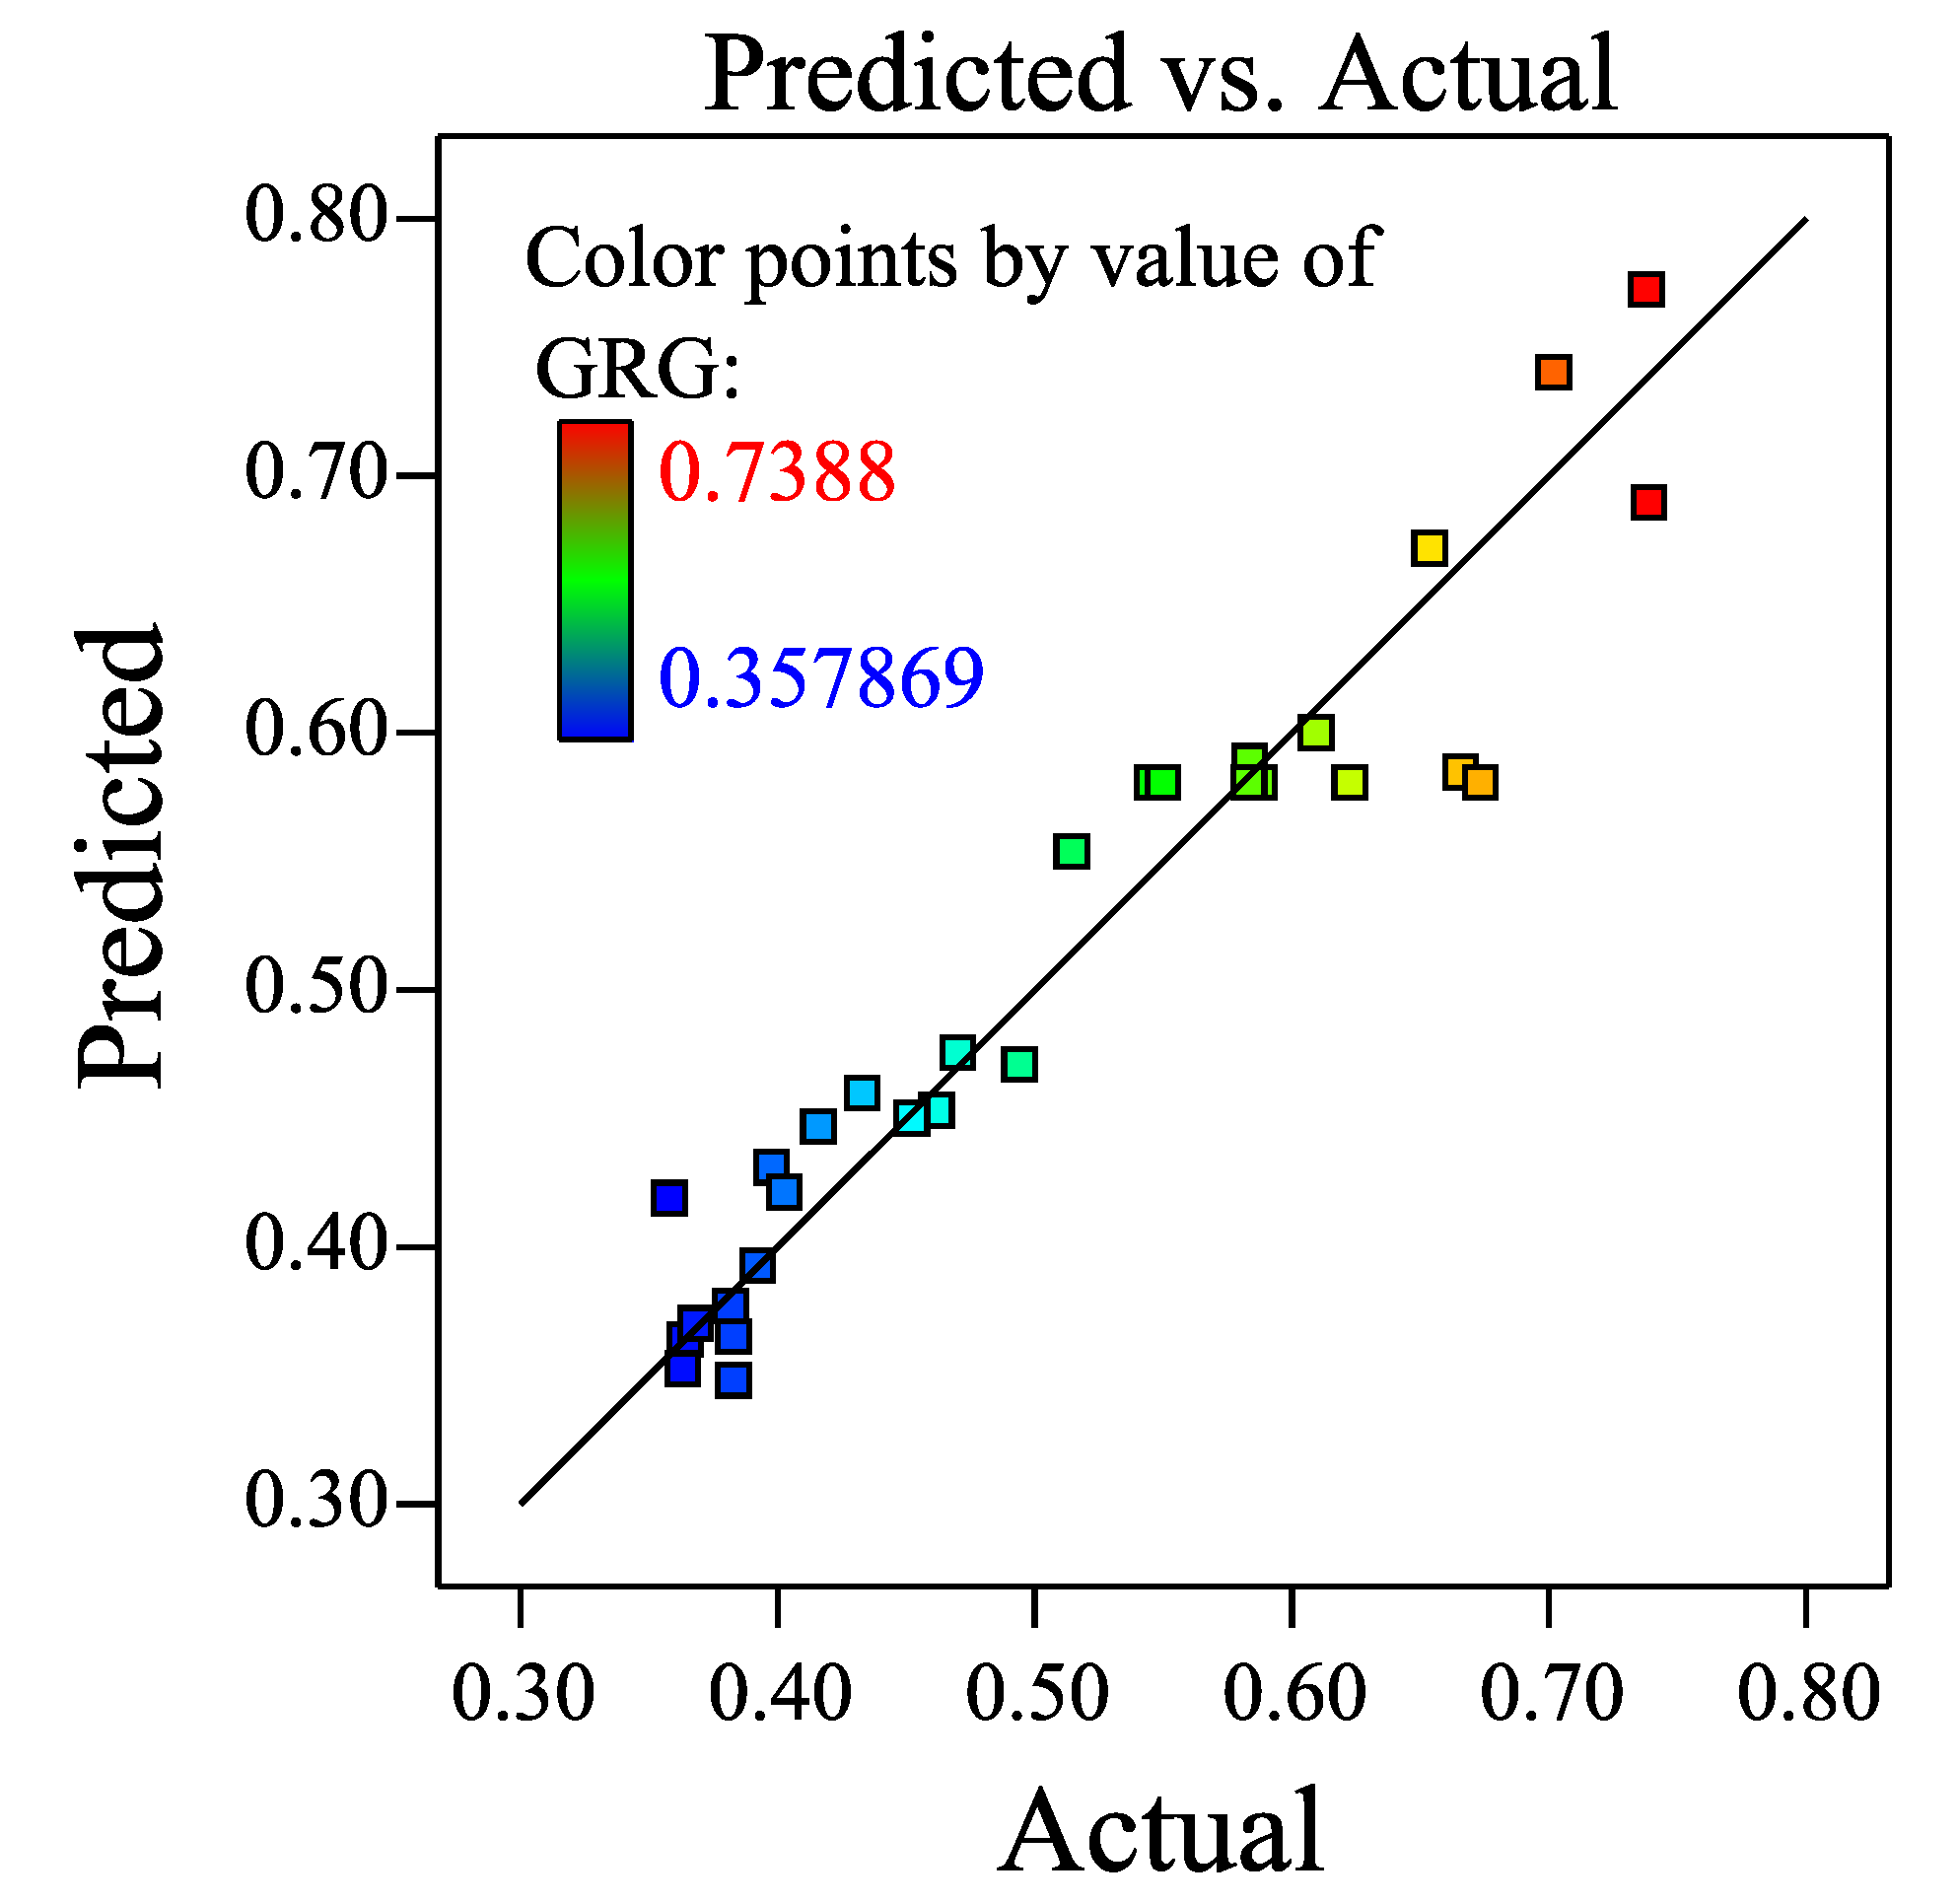
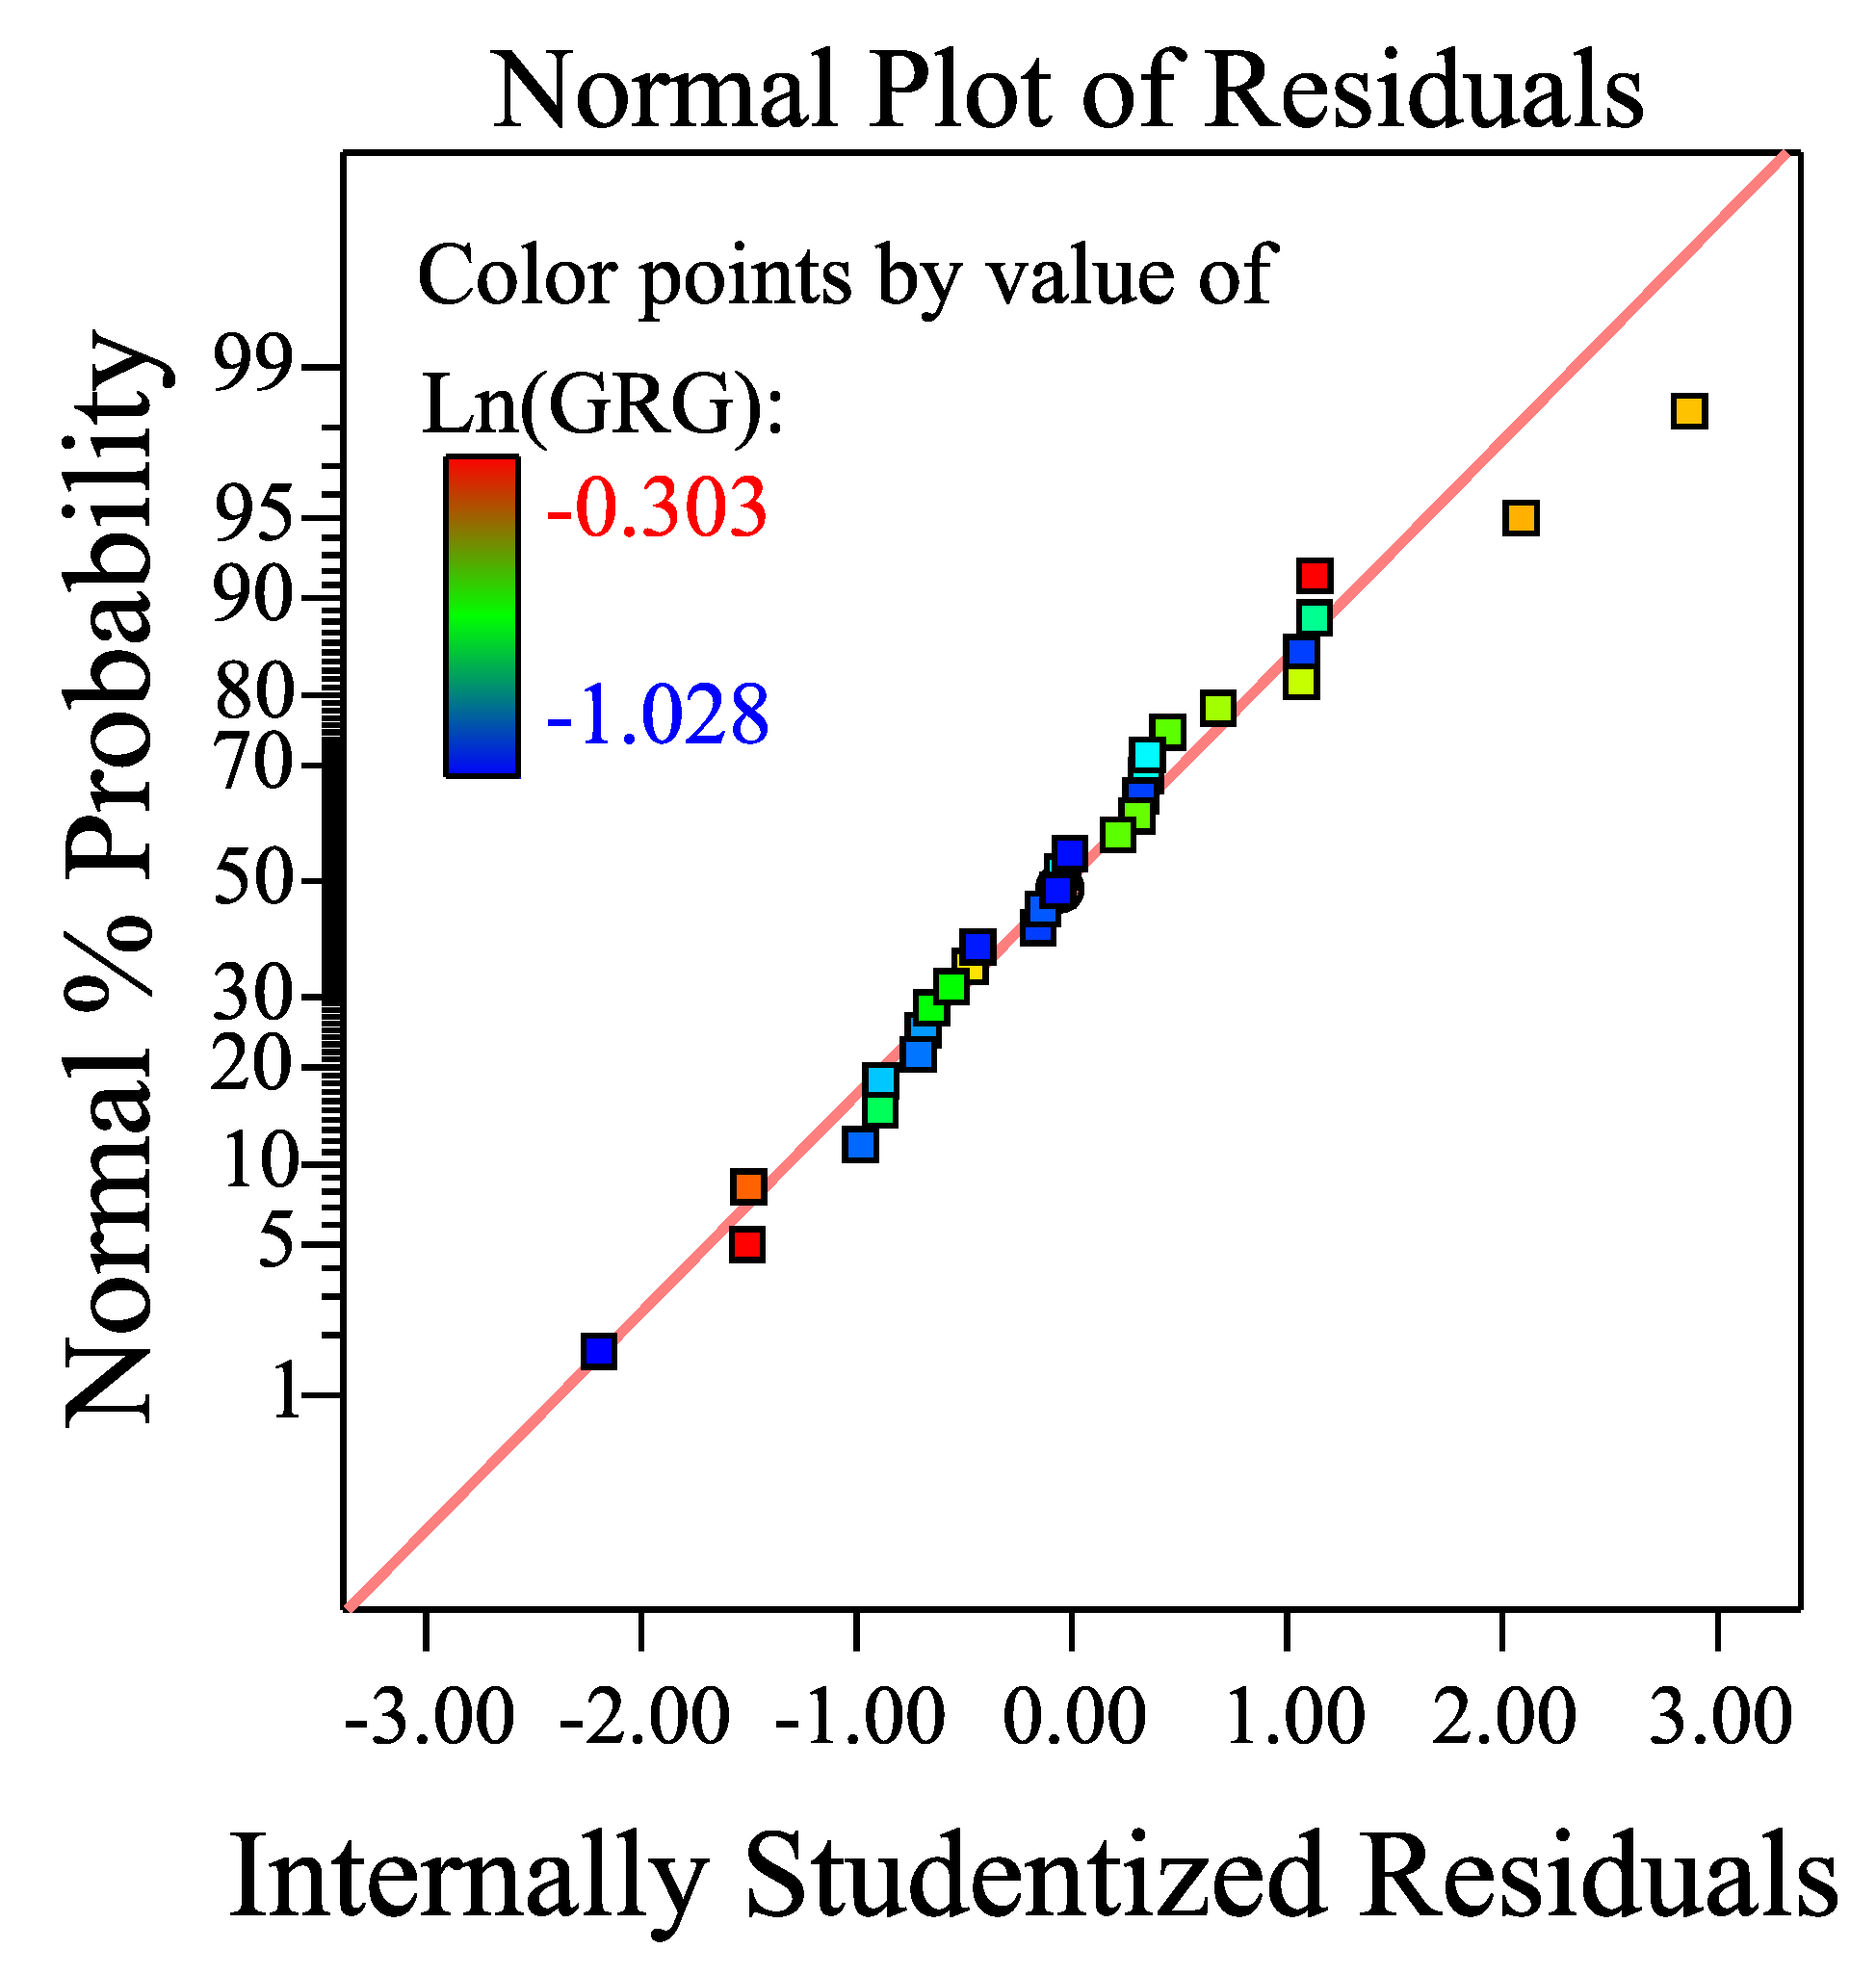
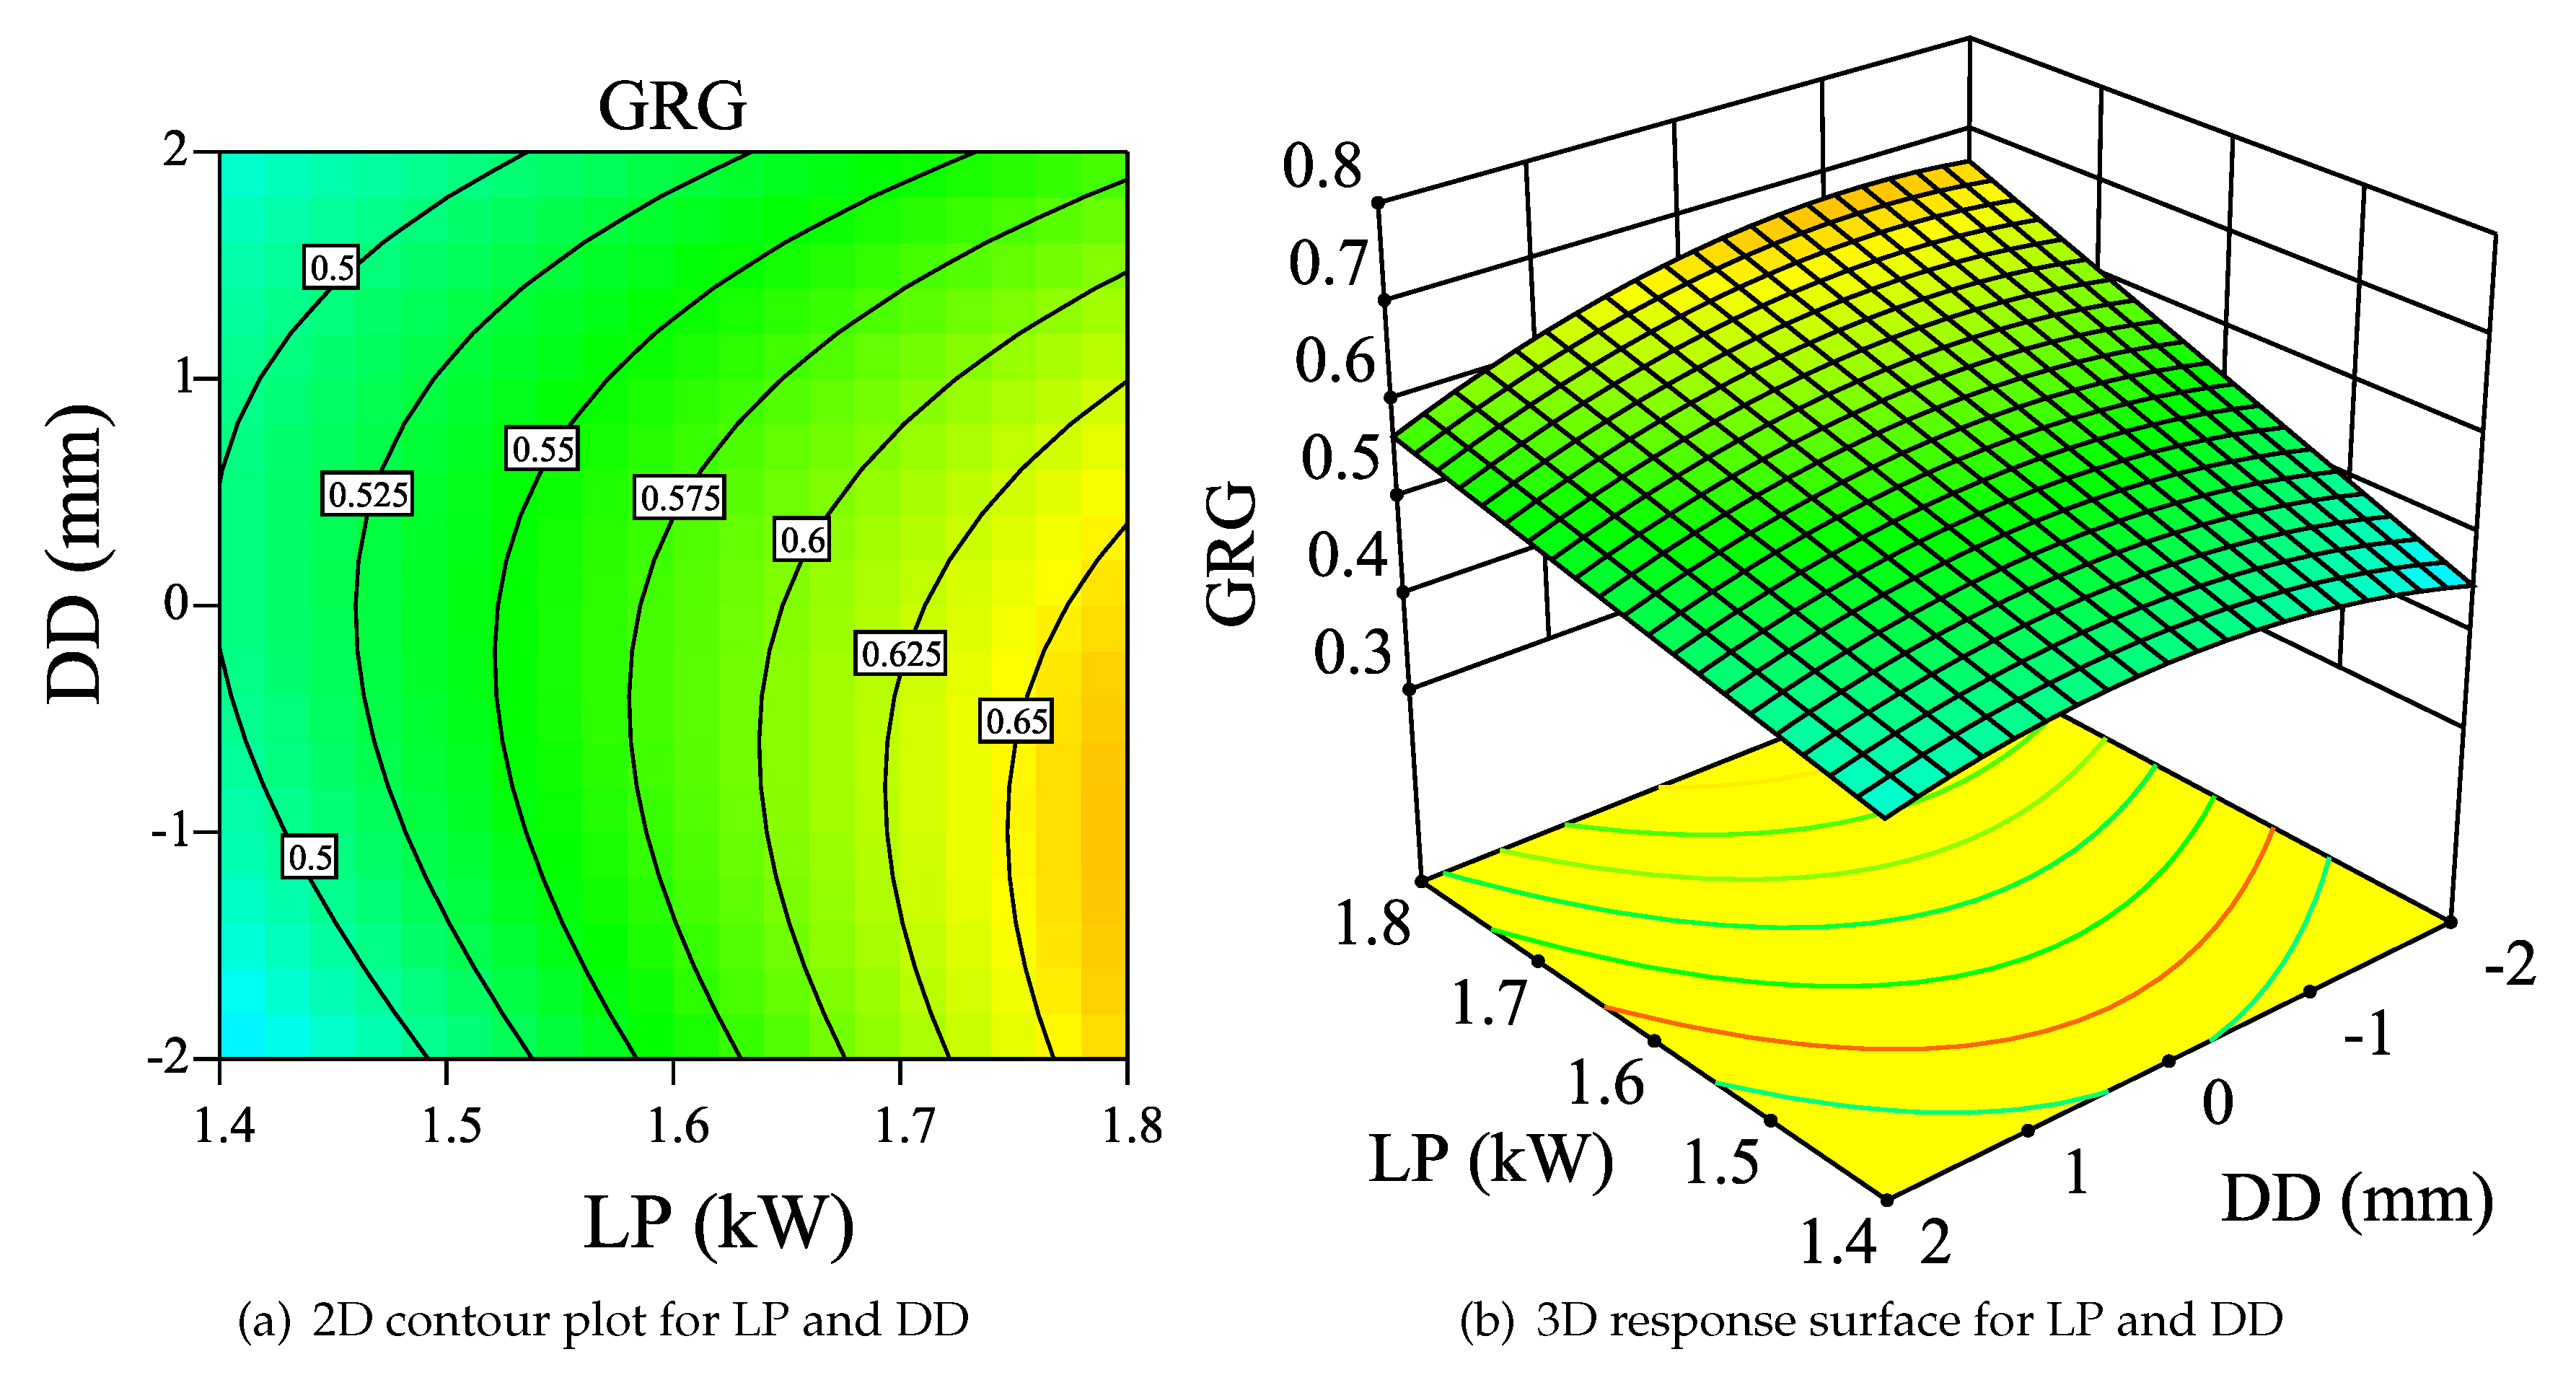
4.4. GRG Response Surface Model

To optimize the process parameters for multi-pass laser cladding, it was necessary to establish the correlation between the process parameters and the GRG values. Through significance analysis of GRG values, as depicted in Table 12, a natural logarithm transformation of GRG was well described as a quadratic model of the investigated parameters. By identifying the regression coefficients, the response surface model of GRG was obtained as shown in Equation (18).
ln ( GRG ) = 4.322 + 0.147 × PR + 2.296 × LP + 0.106 × DD + 7.692 × OR 10 3 0.047 × ( PR ) ( LP ) 0.073 × ( LP ) ( DD ) 1.044 × PR 2 10 3 0.011 × DD 2 1.973 × OR 2 10 4
Table 13 shows the results of the ANOVA for the response GRG using stepwise regression to eliminate the insignificant factors. The table shows that the p-value of model Prob(F) was less than 0.01% and lack-of-fit was greater than 73.78%, indicating that the correlation model has an existence probability of more than 99.99% and the lack of fit is caused by ambient random noise. Therefore, the selected model presented good fitting accuracy with respect to the studied factors. The value of adequate precision was 17.469, indicative of high model resolution. The coefficients of determination, R 2 , adjusted R 2 , and predicated R 2 were all approximate to one. The difference between the adjusted R 2 and predicted R 2 was less than 0.2. The geographical comparison between the predicted and experimentally obtained GRG values is illustrated in Figure 5. The closeness of data points to the line y = x also indicates their minimal divergence. Thus, the selected model for GRG is capable of explaining the process and has good prediction accuracy.
Figure 6 depicts the distribution of GRG residuals. In the figure, the residuals are relatively uniformly distributed along the straight line, which suggests that the residuals are in normal distribution and not caused by systematic errors. The GRG value, as further suggested by Table 13, is affected by all the factors: PR, LP, DD, and OR. GRG is also affected by the interactions of PR and LP, and LP and DD, and the second order terms of PR, DD ,and OR. The individual effects of each factor on the GRG value are depicted in Figure 7. The GRG is positively proportional to LP, but concave functions of PR, DD, and OR. GRG decreases with increasing weight fraction of TiC and/or overlapping ratio.
Figure 8 illustrates the effects of powder ratio and laser power on GRG. The figure shows that the GRG value decreased as the TiC weight fraction increased and laser power decreased. This occurred because more laser energy was required for melting the increased amount of TiC powder. Less powder was then cladded on the substrate, resulting in narrower cladding layers of equal passes. The addition of more TiC powder improved the viscosity of the melt liquid. Flattening of the melt cladding powder was thus prohibited with a rougher surface obtained. The interaction between PR and LP can be explained by the shadowing effect [32,33]. As more TiC is mixed in the cladding powder, a much larger amount of laser energy is required due to the absorption and shadowing by TiC particles. Less melted powder would, conversely, inhibit the energy circulation within the cladding powder.
The two-dimensional (2D) contour plot and 3D response surface of GRG with respect to laser power and defocusing distance are illustrated in Figure 9. The GRG value also increased with increasing of LP and decreasing absolute value of DD. This occurred because the increased laser energy melted much more cladding powder to produce wider cladding passes. In contrast, departure of the laser focus from the substrate also scattered the energy into a wider spot, which cladded less powder onto the substrate with resultingnarrow passes. The flatness of multi-pass cladding layer was not significantly affected by LP or DD.

4.5. Validation of GRG Model

In the previous section, the correlation between GRG values and processing parameters was established as a quadratic regression model. A further experiment was conducted to validate the feasibility and achievability of the optimal conditions. Table 14 shows the optimization criteria and parameter limits for the model optimization. The GRG was set to be a maximum objective and influencing factors ranged between –1 and 1.
The experimental and predicted results for the optimal condition are compared in Table 15. The table shows that the relative errors of the predicted GRG and sub-responses (W, F, and A nf ) were less than 6.8%, which indicates the effectiveness of the established GRG response model. Figure 10 demonstrates that little fluctuation occurred at the top surface of the corresponding cladding and a small amount of non-fused zone was detected for the third and fourth passes. Therefore, multi-pass laser cladding can be optimized to have a maximum GRG of 0.739 with desirable characteristics.

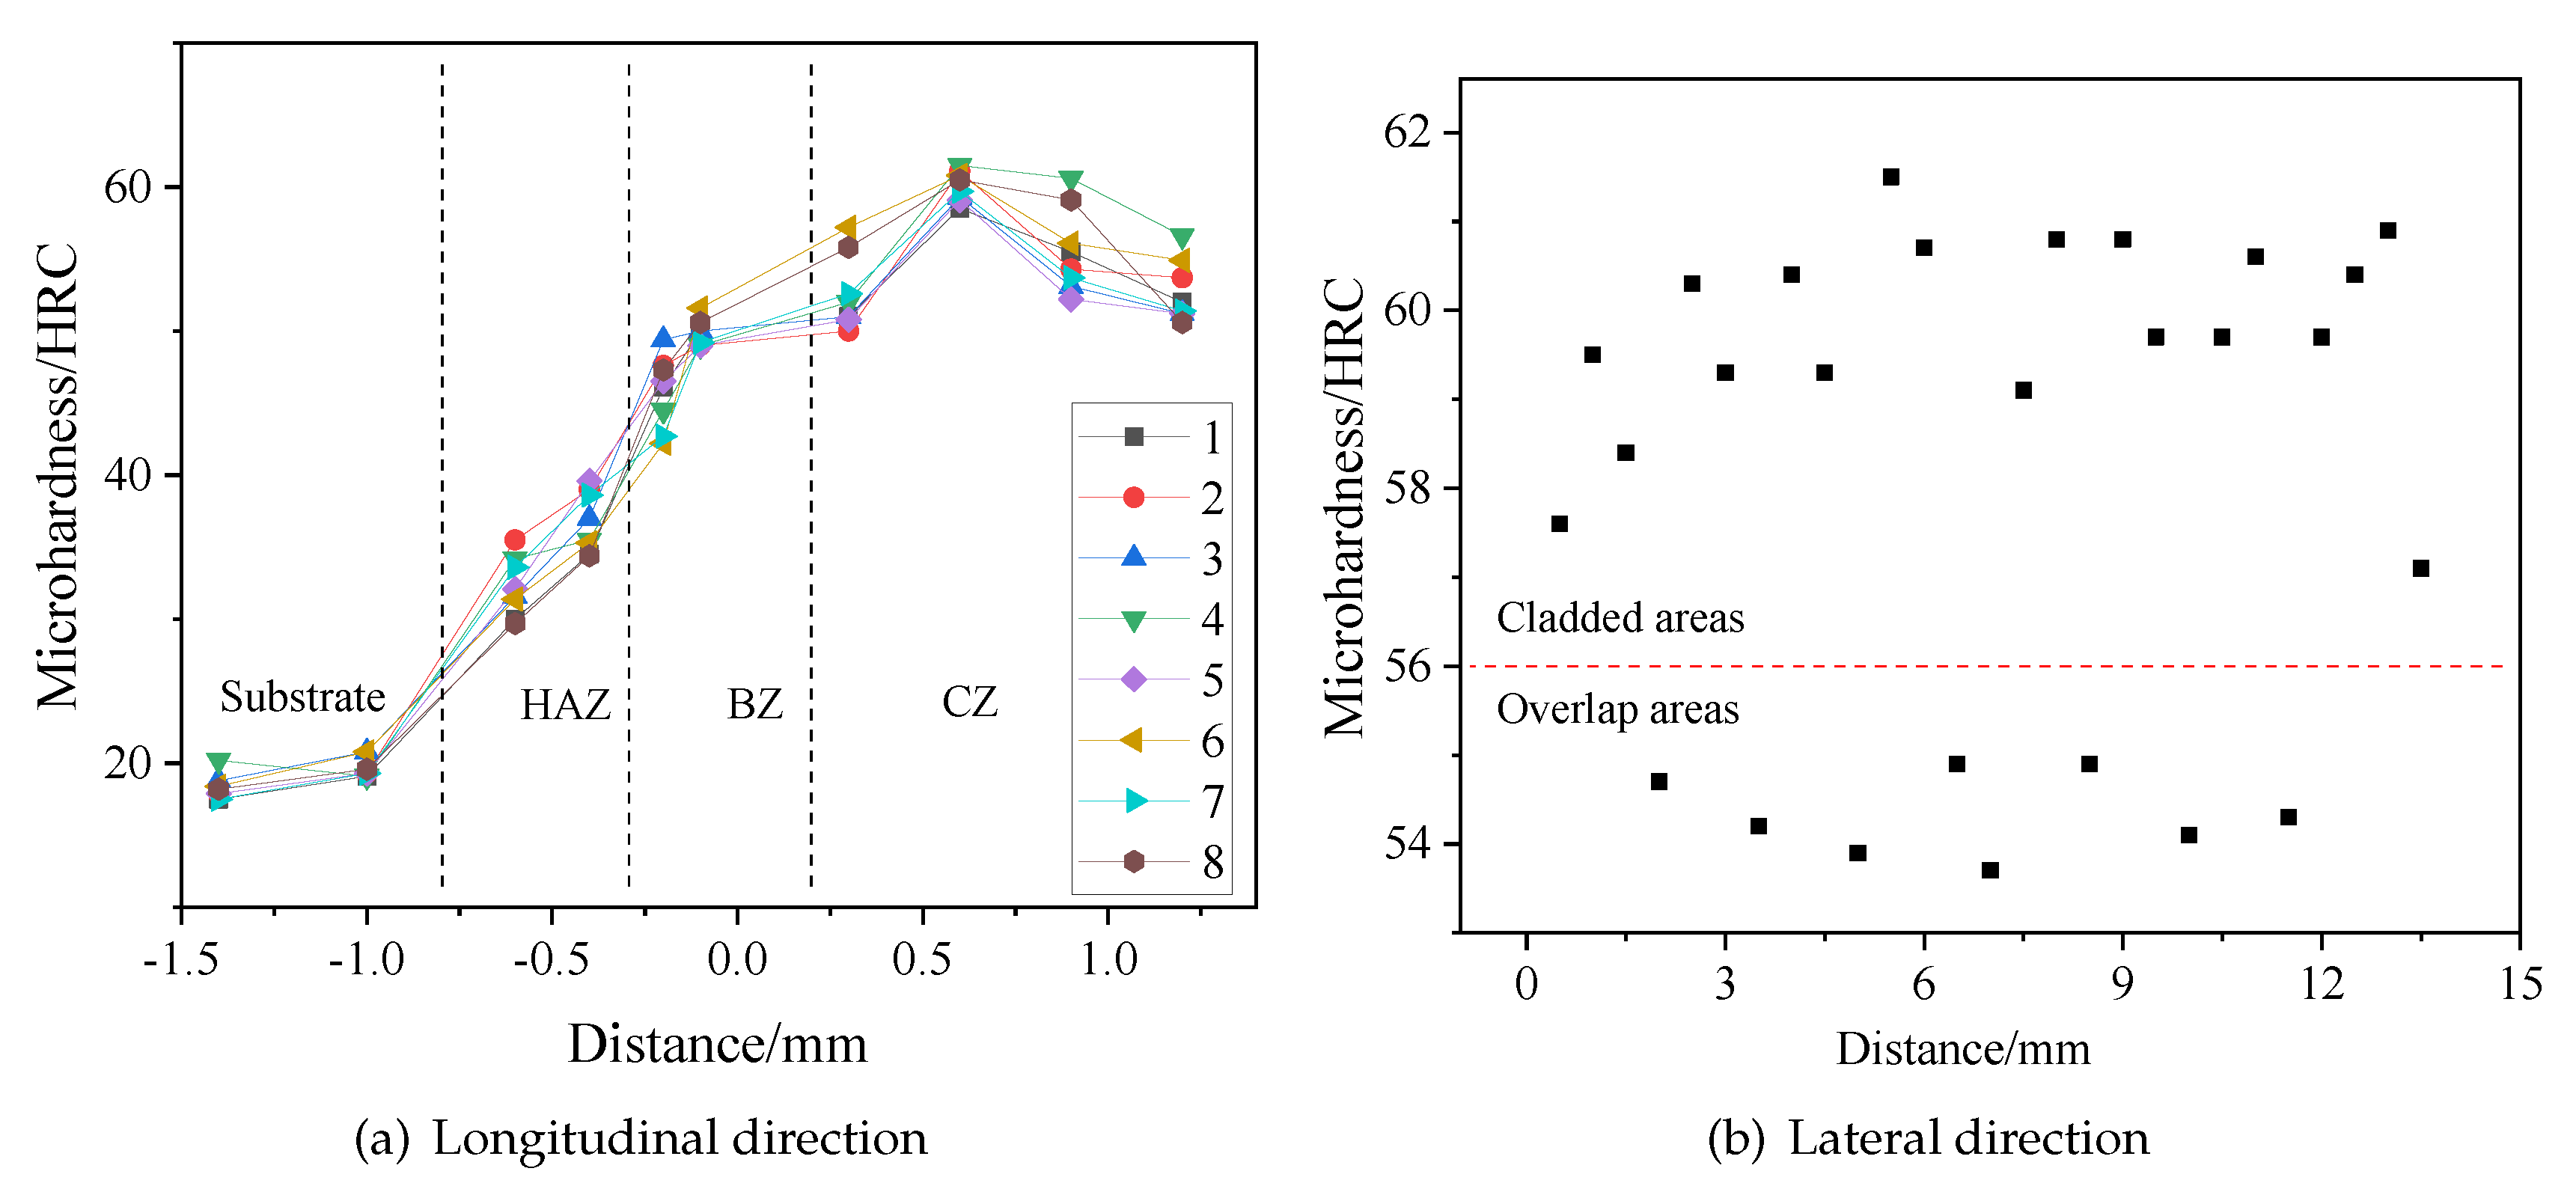
4.6. Mechanical Properties

In this section, the mechanical properties of the cladding layer produced under the optimized process conditions were investigated. Figure 11 illustrates the distribution of microhardness alongside the cladding layer, both longitudinally and laterally. Figure 11a shows that the microhardness decreases stepwise with increasing depth of clad layer. It is suggested that the hardest area occurs in the sub-surface zone of clad layer, probably due to the low temperature and large solidification rate, leading to refined grain size and increased hardness [34].
The microhardness in the lateral direction was measured every 0.5 mm at a distance of 0.6 mm outward from the substrate, as depicted in Figure 11b. The microhardness along clad passes fluctuated slightly about 60 HRC, except for two points at the clad edges. In addition, the overlapped area was softer than other areas in the cladding layer due to coarser grain produced due to the remelting effect [35].
Figure 12 shows the microstructure of the optimized clad layer. The microstructure of the clad area was mainly comprised of dendrite and cellular TiC, as demonstrated in Figure 12a, whereas petal shaped cellular grain was found in the overlapped area (Figure 12b). This occurred due to the heating effect of the former pass and remelting of the overlapped area, which facilitated grain growth. The EDS results at points A–D, as shown in Figure 13, suggest element dispersion during laser cladding compared with the chemical composition of cladding powder.
When conducting overlapping cladding, the overlapped area of the solidified pass participates in the following pass cladding. It deflects the energy input into the forming melt pool, thus affecting the thermal gradient distribution and heat transfer of the melt pool. The differences in composition, viscosity, and density between the deposited and solidifying pass also influence the convection of melt material, thereby leading to composition segregation in the cladding layer [36,37].
Figure 14 compares the wear resistance results of the substrate and cladding layer with the optimized process parameters in the test configuration as illustrated in Table 16. The coefficient of friction reduced from 0.72 to 0.38 by adding the cladding powder. The worn surfaces of the substrate and the optimized cladding layer are macroscopically compared in Figure 15. The worn surfaces of both samples had similar profiles with sloughing scratches parallel to the sliding direction. The profile width of the substrate was larger than that of the optimized clad laye, mainly due to the reinforcement addition of hard phase TiC, which has better wear resistance than the α -Fe. 3D profile of worn surfaces, as depicted in Figure 16, suggesting that the substrate was also deeper than that of the optimized clad layer. The wear volume of both samples were computed to be 4573.68×10 6 mm 3 and 562.13×10 6 mm 3 , respectively. Therefore, the wear resistance of the substrate can be improved by about 8.14 times by applying the clad layer under the optimal process conditions.

5. Conclusions

To produce multi-pass laser claddings with good surface quality under multiple evaluation criteria, a serial of experimental runs, proposed by composite central design (CCD), were conducted to establish the regression model of the grey relational grade (GRG) and process parameters. Grey relational analysis (GRA) was applied to combine three process responses—clad width, flatness, and non-fusion area—into one objective. These findings provide useful guidance for process optimization of laser cladding of complex parts with multiple objectives considered. Based on the results, the following conclusions were drawn:
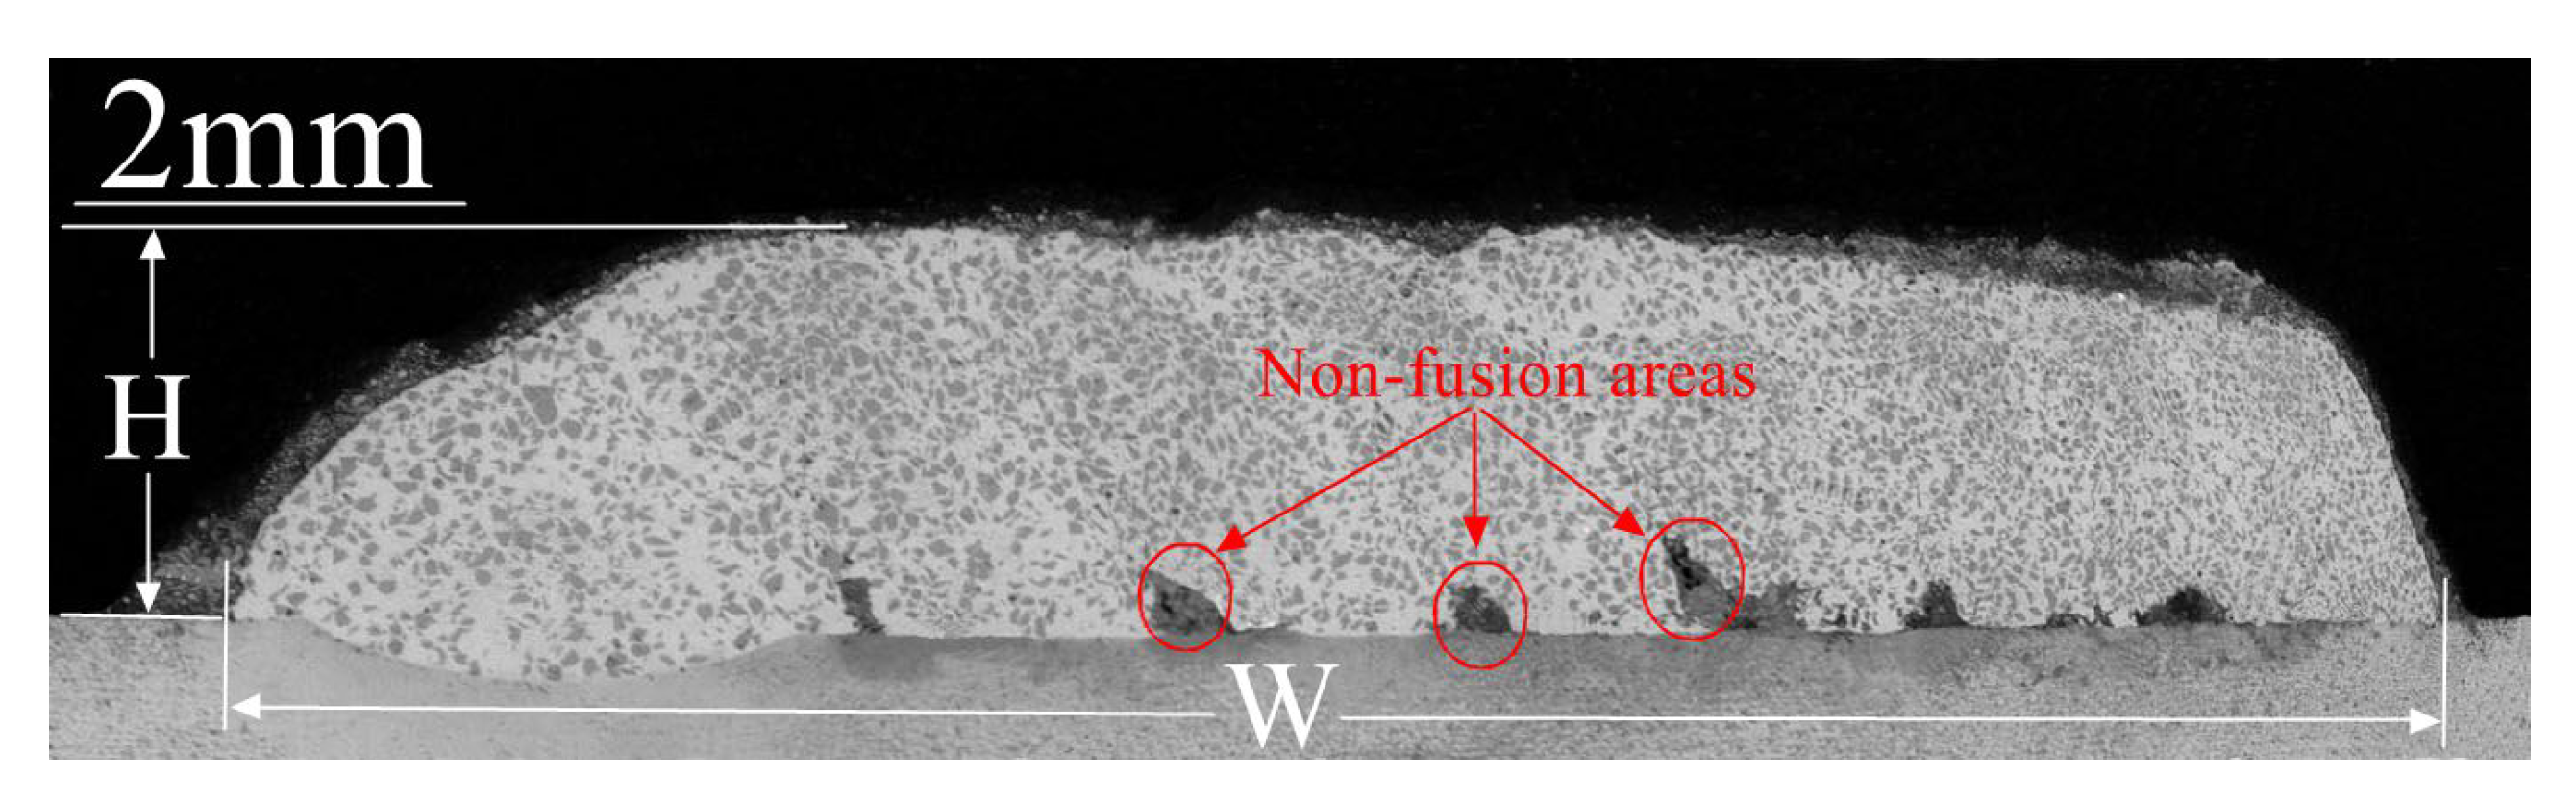
  • Principal component analysis is capable of objectively deciding the contribution of the three responses to the integrated GRG, i.e., 48.88%, 11.27%, and 39.85%, respectively. The GRG value is mainly affected by the clad width and non-fusion area.
  • The GRG value of the three variables (clad width, flatness, and non-fusion area) is exponentially determined by the second-order model of the process parameters. The GRG response model has excellent goodness of fit and predictive capacity.
  • The GRG value is relevant to all four investigated parameters. The surface quality of multi-pass laser claddings can be improved by increasing laser power, decreasing weight fraction of TiC and overlapping ratio, and/or focusing the laser spot on the surface.
  • By integrating SNRs with GRA, the multi-response laser cladding process can be transformed into single objective problem and thus viably optimized for individual optimum objectives (maximized clad width and flatness, and minimized non-fusion area).
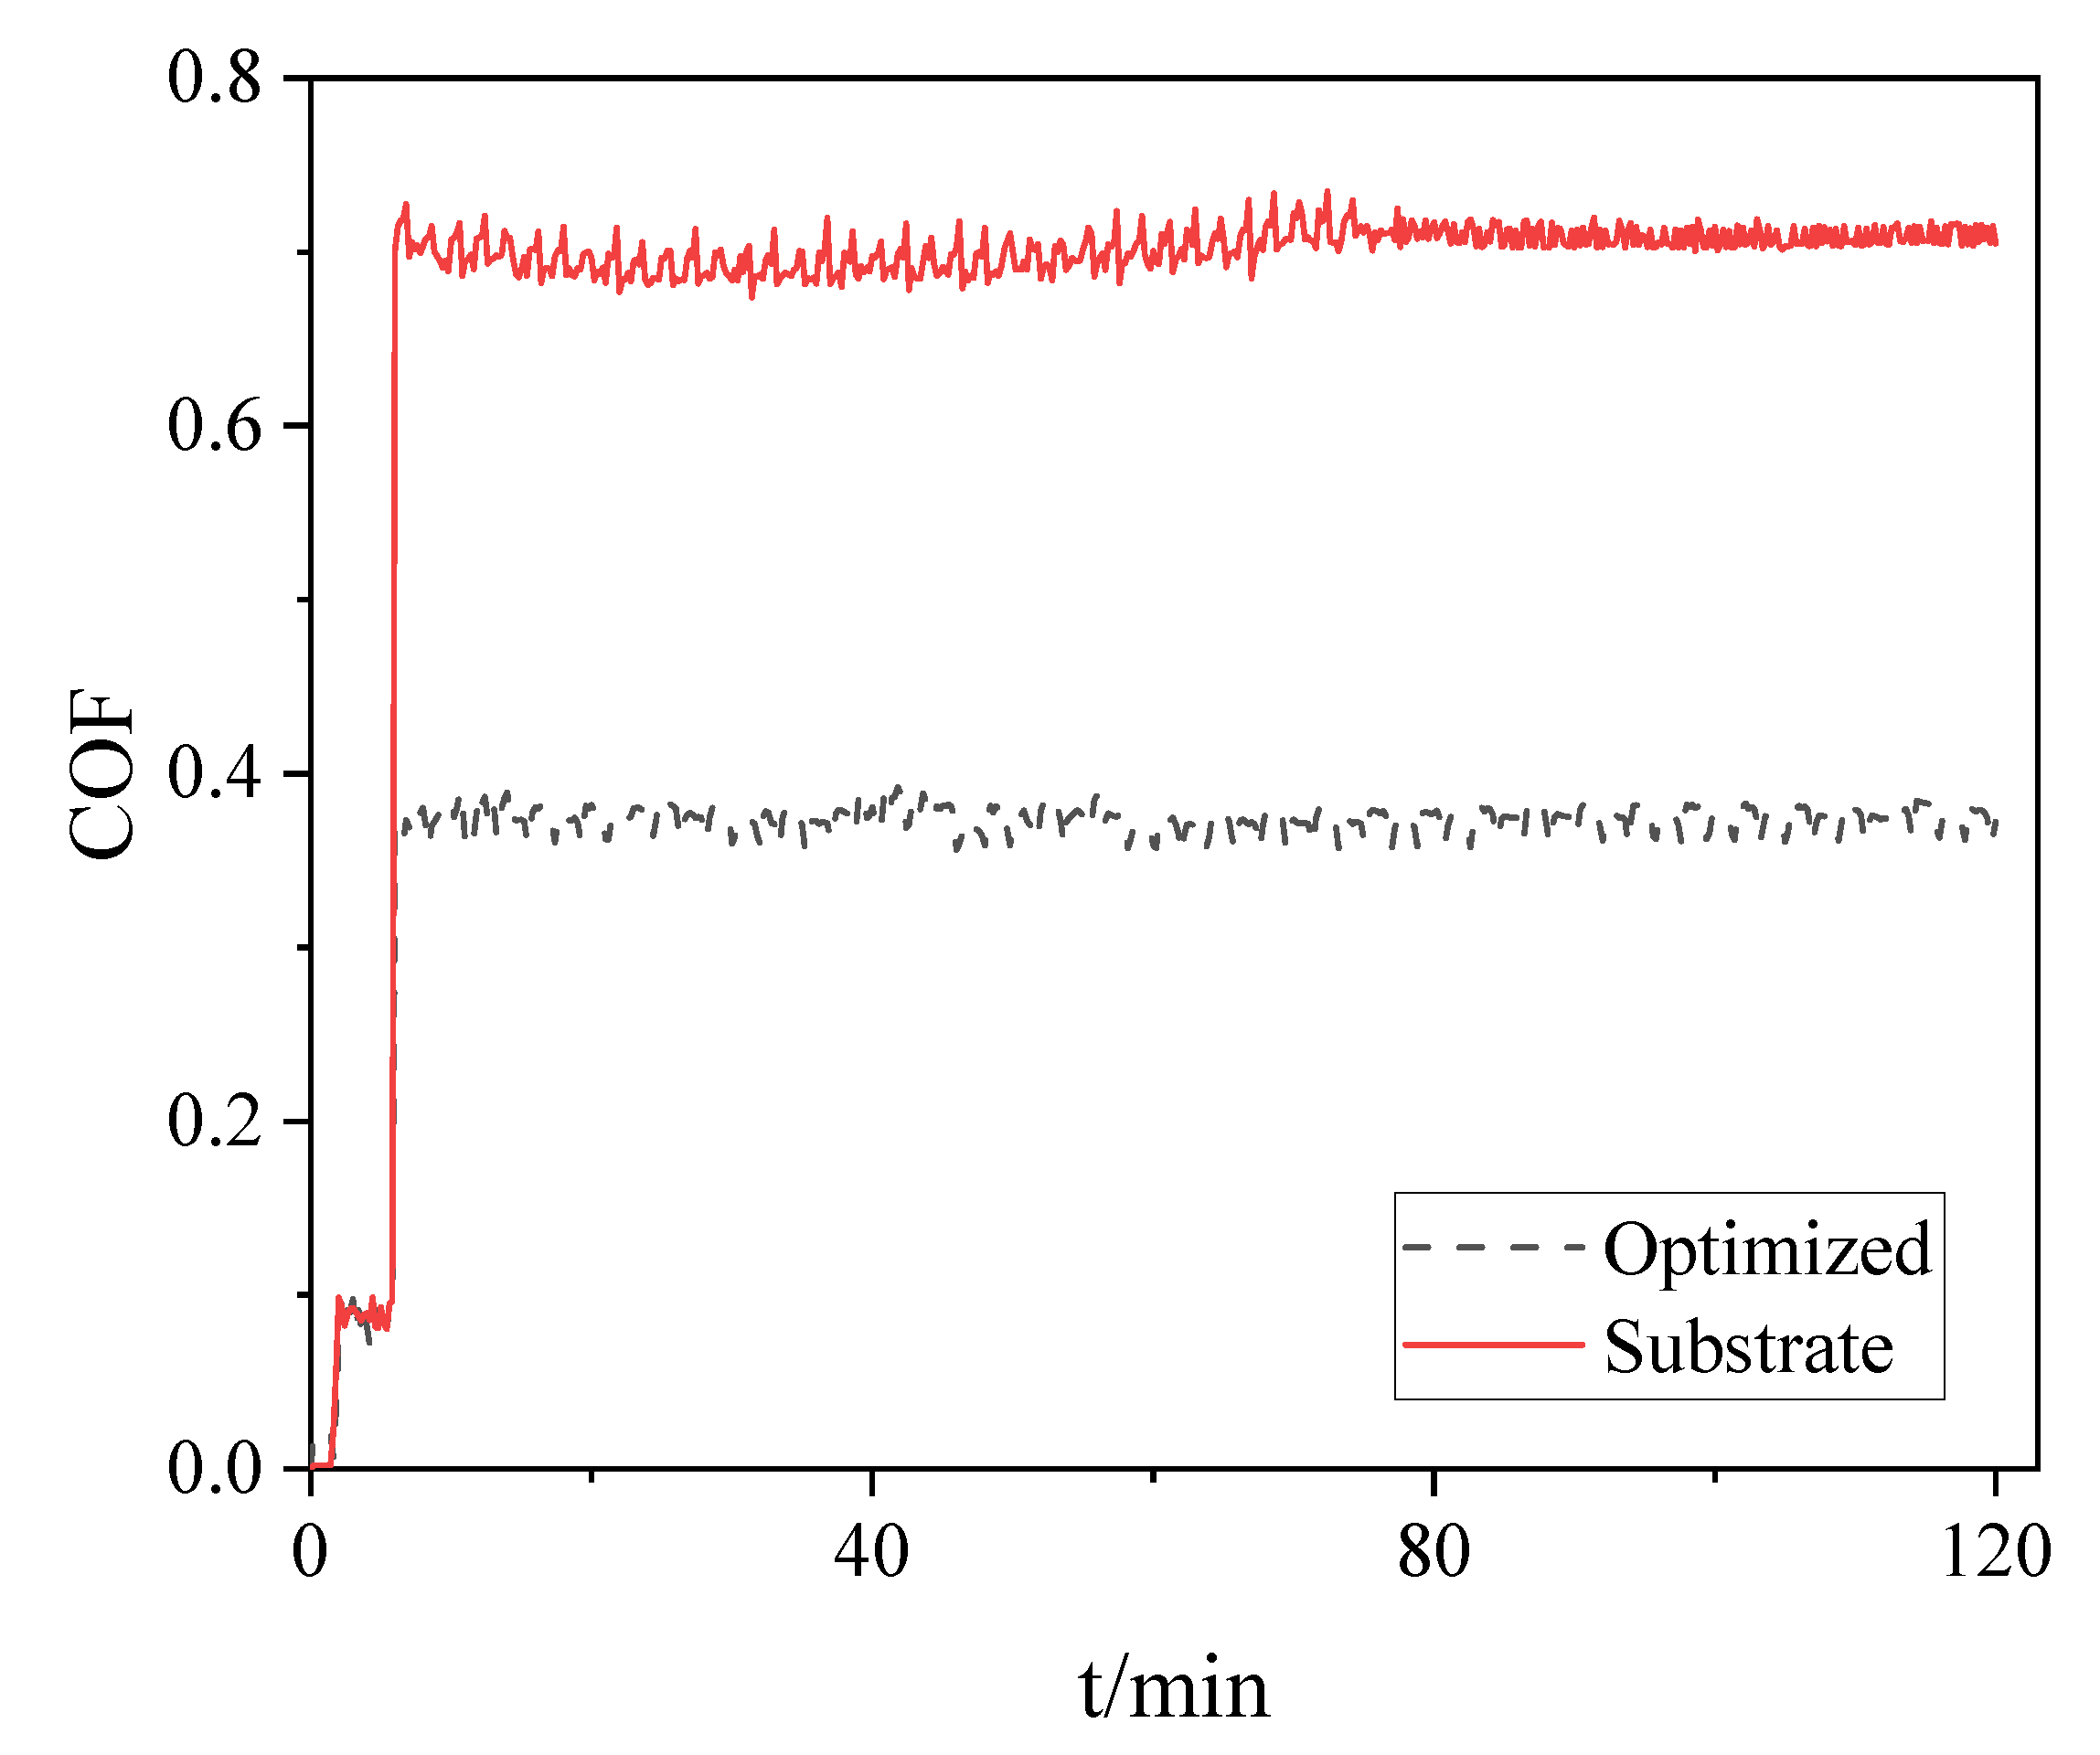
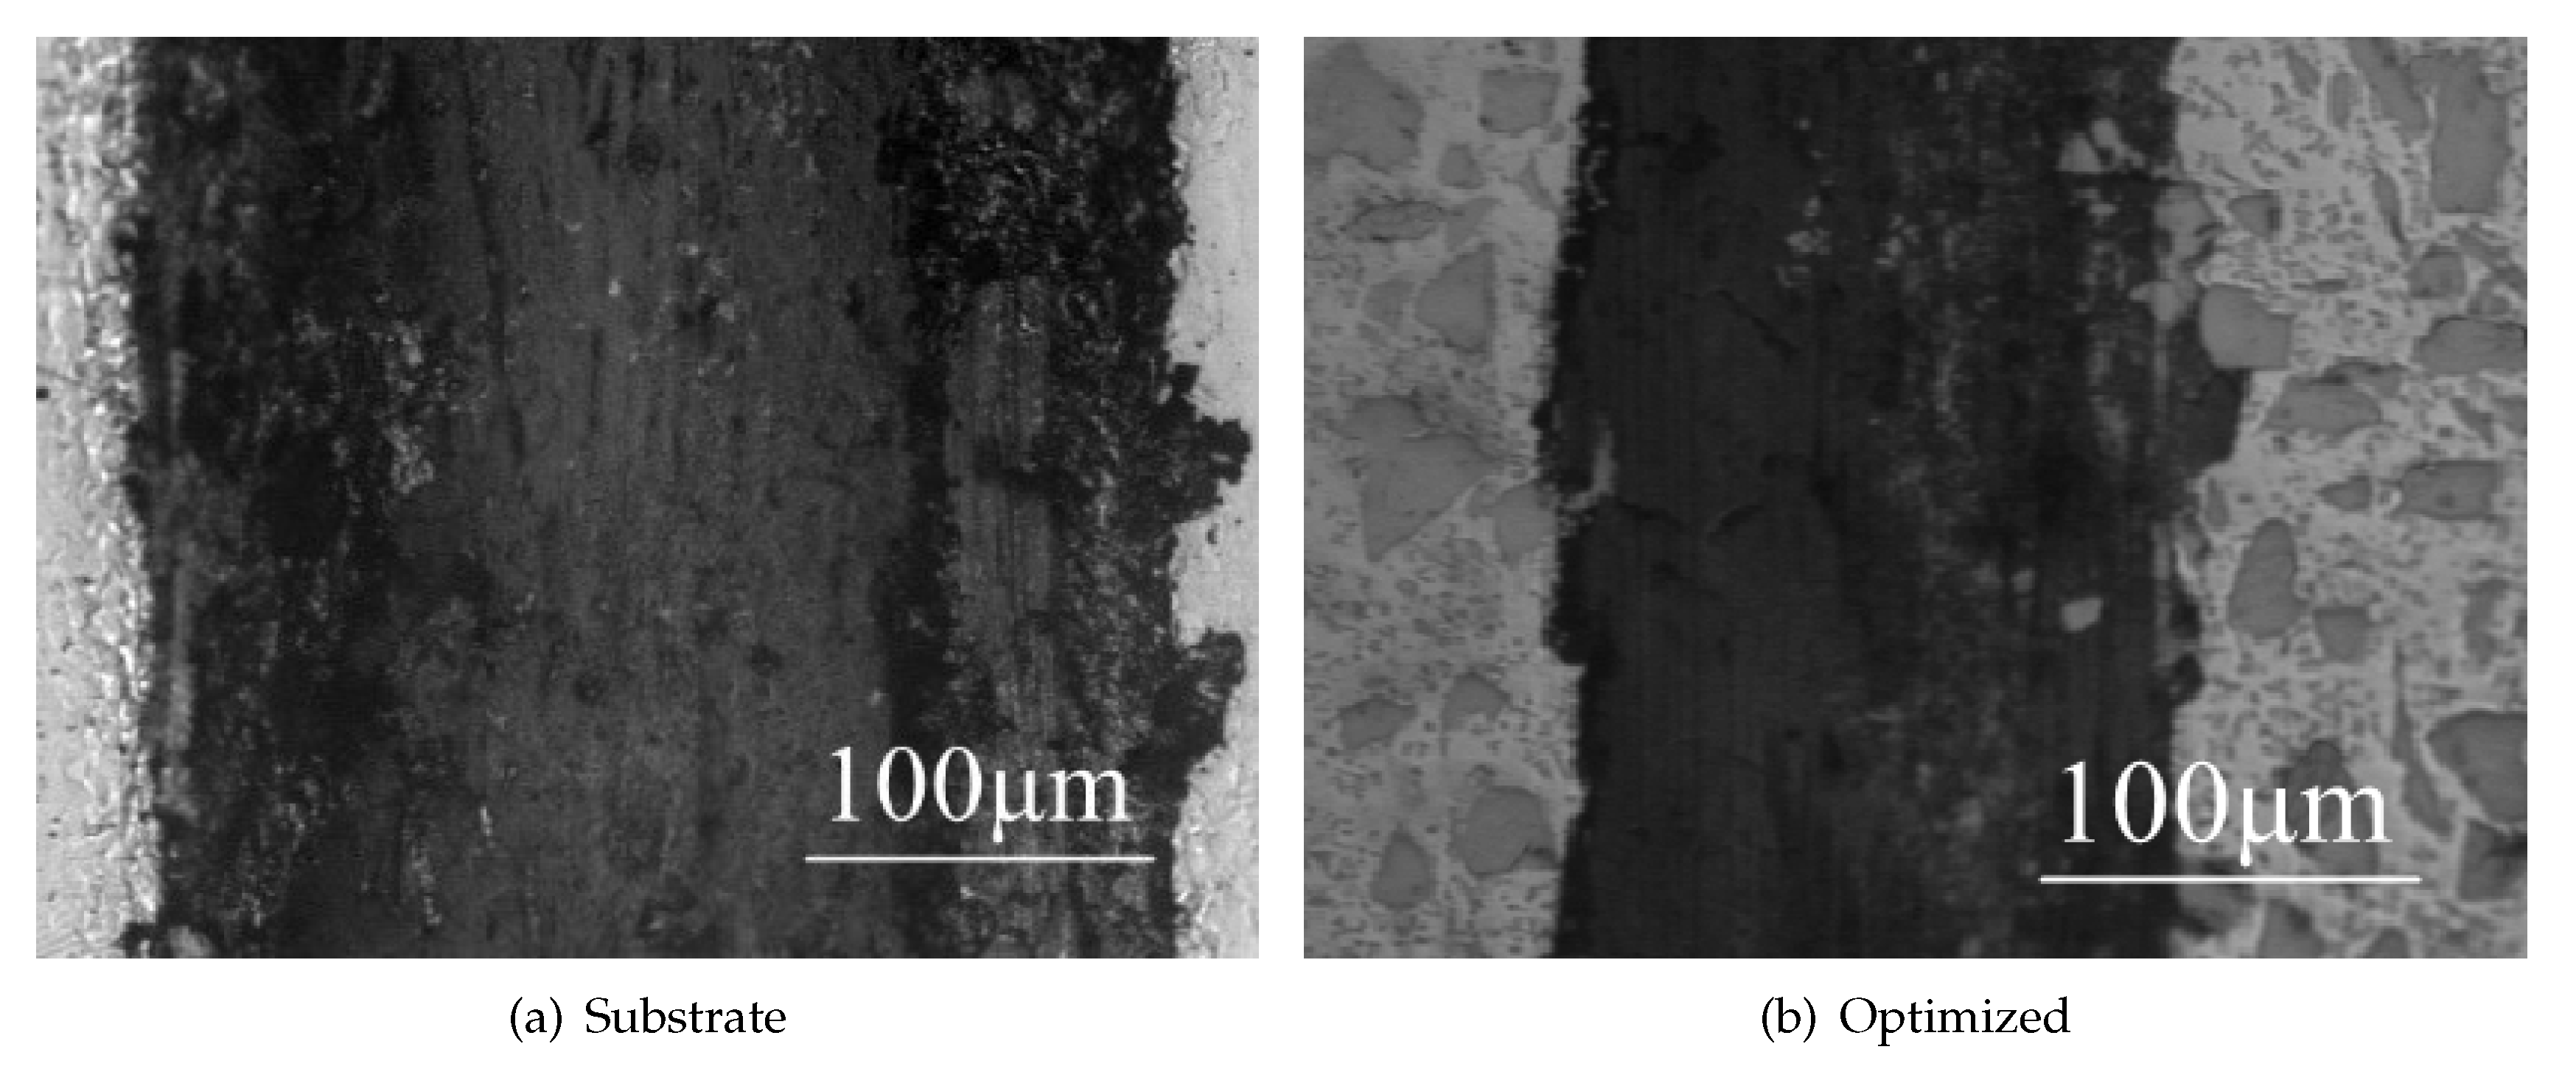
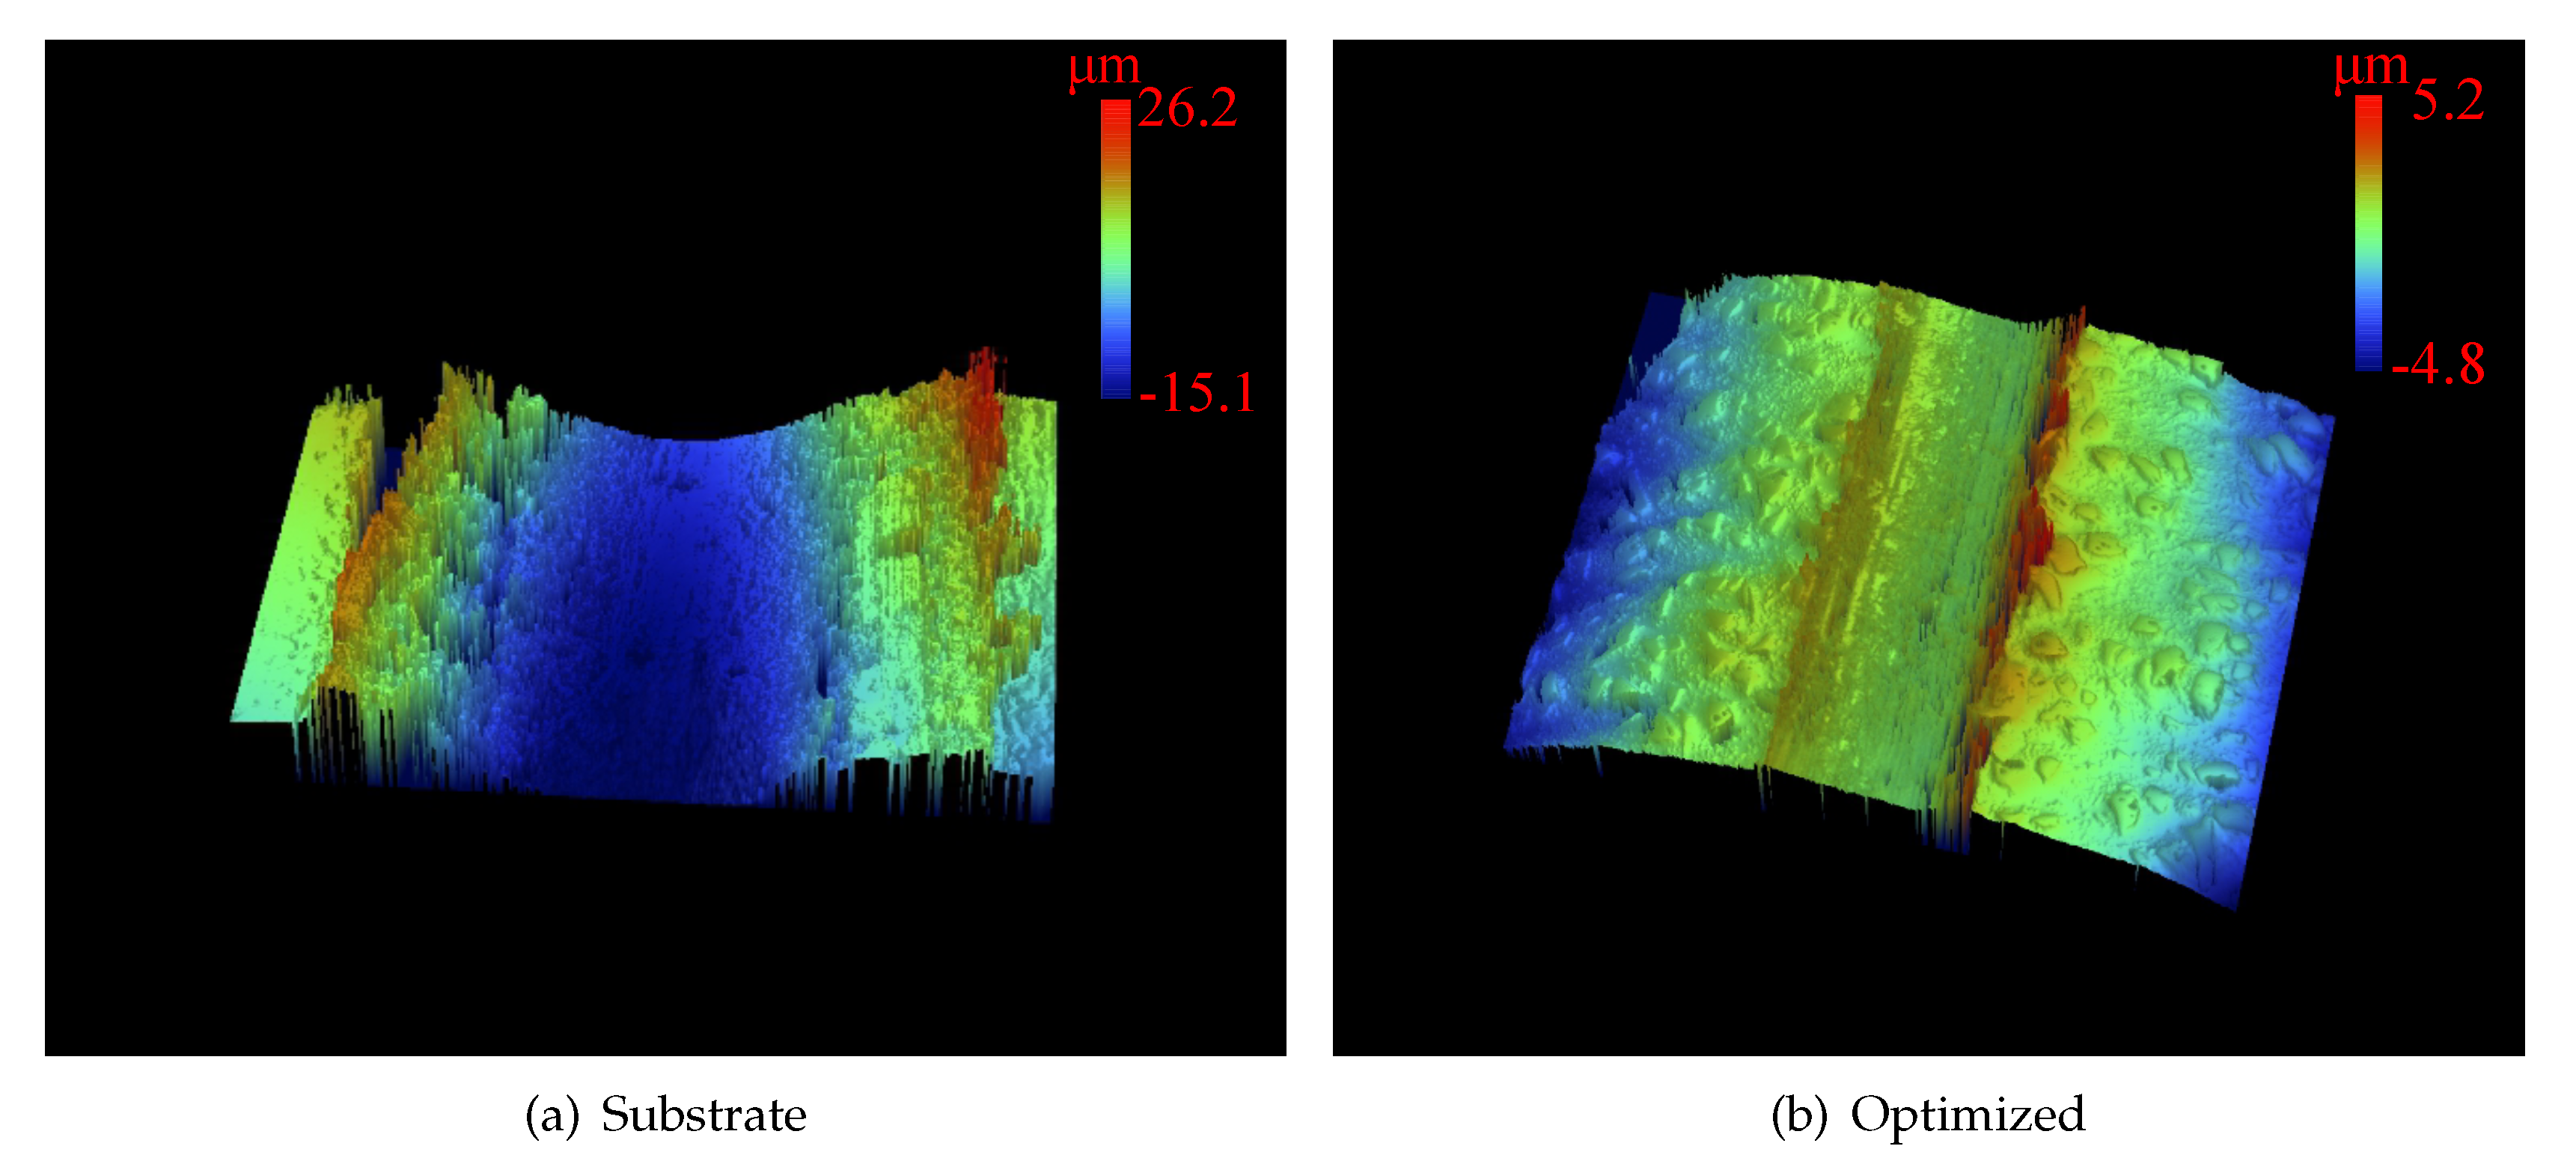
  • The hardness of AISI 1045 substrate can be improved from 20 to 60 HRC and the wear resistance becomes 8.14 times better (wear volume reduced by about 87.7%) by adding Fe50/TiC powder under the optimal process conditions.

Author Contributions

Conceptualization, C.C. and G.L.; methodology, X.H.; validation, C.C., G.L., and X.H.; formal analysis, X.Z.; investigation, X.Z.; resources, G.L.; data curation, X.Z.; writing–original draft preparation, X.Z.; writing–review and editing, Q.W., C.C., and G.L.; visualization, X.Z.; supervision, Q.W.; project administration, Q.W.; funding acquisition, Q.W., C.C., and G.L. All authors have read and agreed to the published version of the manuscript.

Funding

This research was funded by the National Natural Science Foundation of China (Grant No. 51575110), the Provincial Education and Research Program for Young and Middle-Aged Teachers (Grant No. JAT170376), the Central Government Research Programs to Guide the Local Scientific and Technological Development (Grant No. 2018L3001), and the Research Foundation of Fujian University of Technology (Grant No. E0600276).

Acknowledgments

The authors are grateful for the technical support from the Public Service Platform for Technical Innovation of Machine Tool Industry in Fujian Province.

Conflicts of Interest

The authors declare no conflict of interest. The funders had no role in the design of the study; in the collection, analyses, or interpretation of data; in the writing of the manuscript, or in the decision to publish the results.

Abbreviations

The following abbreviations are used in this manuscript:
CCDComposite Central Design
EDMElectrical Discharge Machining
EDSEnergy Dispersive Spectrometer
GRAGrey Relational Analysis
GRGGrey Relational Grade
PCAPrincipal Component Analysis
RSMResponse Surface Methodology

References

  1. Botes, A.; Bolokang, A.S.; Kortidis, I.; Matjeke, V. Structure-property relationship of the laser cladded medium carbon steel: The use of butter layer between the substrate and the top clad layer. Surf. Interf. 2019, 14, 296–304. [Google Scholar] [CrossRef]
  2. Li, C.; Yu, Z.; Gao, J.; Zhao, J.; Han, X. Numerical simulation and experimental study of cladding Fe60 on an ASTM 1045 substrate by laser cladding. Surf. Coat. Technol. 2019, 357, 965–977. [Google Scholar] [CrossRef]
  3. Arias-González, F.; del Val, J.; Comesaña, R.; Penide, J.; Lusquiños, F.; Quintero, F.; Riveiro, A.; Boutinguiza, M.; Pou, J. Laser cladding of phosphor bronze. Surf. Coat. Technol. 2017, 313, 248–254. [Google Scholar] [CrossRef]
  4. Lewis, S.R.; Fretwell-Smith, S.; Goodwin, P.S.; Smith, L.; Lewis, R.; Aslam, M.; Fletcher, D.I.; Murray, K.; Lambert, R. Improving rail wear and RCF performance using laser cladding. Wear 2016, 366–367, 268–278. [Google Scholar] [CrossRef]
  5. Ansari, M.; Shoja Razavi, R.; Barekat, M. An empirical-statistical model for coaxial laser cladding of NiCrAlY powder on Inconel 738 superalloy. Opt. Laser Technol. 2016, 86, 136–144. [Google Scholar] [CrossRef]
  6. Erfanmanesh, M.; Abdollah-Pour, H.; Mohammadian-Semnani, H.; Shoja-Razavi, R. An empirical-statistical model for laser cladding of WC-12Co powder on AISI 321 stainless steel. Opt. Laser Technol. 2017, 97, 180–186. [Google Scholar] [CrossRef]
  7. Nabhani, M.; Razavi, R.S.; Barekat, M. An empirical-statistical model for laser cladding of Ti-6Al-4V powder on Ti-6Al-4V substrate. Opt. Laser Technol. 2018, 100, 265–271. [Google Scholar] [CrossRef]
  8. Shi, J.; Zhu, P.; Fu, G.; Shi, S. Geometry characteristics modeling and process optimization in coaxial laser inside wire cladding. Opt. Laser Technol. 2018, 101, 341–348. [Google Scholar] [CrossRef]
  9. Udaya Prakash, J.; Ananth, S.; Sivakumar, G.; Moorthy, T.V. Multi-Objective Optimization of Wear Parameters for Aluminium Matrix Composites (413/B4C) using Grey Relational Analysis. Mater. Today: Proc. 2018, 5, 7207–7216. [Google Scholar] [CrossRef]
  10. Zhou, J.; Ren, J.; Yao, C. Multi-objective optimization of multi-axis ball-end milling Inconel 718 via grey relational analysis coupled with RBF neural network and PSO algorithm. Measurement 2017, 102, 271–285. [Google Scholar] [CrossRef]
  11. Mondal, S.; Paul, C.P.; Kukreja, L.M.; Bandyopadhyay, A.; Pal, P.K. Application of Taguchi-based gray relational analysis for evaluating the optimal laser cladding parameters for AISI1040 steel plane surface. Int. J. Adv. Manuf. Technol. 2013, 66, 91–96. [Google Scholar] [CrossRef]
  12. Zhang, Z.; Kovacevic, R. Multiresponse optimization of laser cladding steel+ VC using grey relational analysis in the taguchi method. JOM 2016, 68, 1762–1773. [Google Scholar] [CrossRef]
  13. Yu, T.; Yang, L.; Zhao, Y.; Sun, J.; Li, B. Experimental research and multi-response multi-parameter optimization of laser cladding Fe313. Opt. Laser Technol. 2018, 108, 321–332. [Google Scholar] [CrossRef]
  14. Manikandan, N.; Raju, R.; Palanisamy, D.; Arulkirubakaran; Kumar, S. Investigation on Ti6Al4V laser metal deposition using Taguchi based grey approach. Mater. Today: Proc. 2018, 5, 14375–14383. [Google Scholar] [CrossRef]
  15. Mondal, S.; Bandyopadhyay, A.; Pal, P.K. Application of artificial neural network for the prediction of laser cladding process characteristics at Taguchi-based optimized condition. Int. J. Adv. Manuf. Technol. 2014, 70, 2151–2158. [Google Scholar] [CrossRef]
  16. Liu, H.; Qin, X.; Huang, S.; Jin, L.; Wang, Y.; Lei, K. Geometry Characteristics Prediction of Single Track Cladding Deposited by High Power Diode Laser Based on Genetic Algorithm and Neural Network. Int. J. Prec. Eng. Manuf. 2018, 19, 1061–1070. [Google Scholar] [CrossRef]
  17. Sohrabpoor, H. Analysis of laser powder deposition parameters: ANFIS modeling and ICA optimization. Optik 2016, 127, 4031–4038. [Google Scholar] [CrossRef]
  18. Chen, T.; Wu, W.; Li, W.; Liu, D. Laser cladding of nanoparticle TiC ceramic powder: Effects of process parameters on the quality characteristics of the coatings and its prediction model. Opt. Laser Technol. 2019, 116, 345–355. [Google Scholar] [CrossRef]
  19. Olakanmi, E.; Nyadongo, S.; Malikongwa, K.; Lawal, S.; Botes, A.; Pityana, S. Multi-variable optimisation of the quality characteristics of fiber-laser cladded Inconel-625 composite coatings. Surf. Coat. Technol. 2019, 357, 289–303. [Google Scholar] [CrossRef]
  20. Khorram, A.; Jamaloei, A.D.; Paidar, M.; Cao, X. Laser cladding of Inconel 718 with 75Cr3C2 + 25(80Ni20Cr) powder: Statistical modeling and optimization. Surf. Coat. Technol. 2019, 378, 124933. [Google Scholar] [CrossRef]
  21. Wen, P.; Feng, Z.; Zheng, S. Formation quality optimization of laser hot wire cladding for repairing martensite precipitation hardening stainless steel. Opt. Laser Technol. 2015, 65, 180–188. [Google Scholar] [CrossRef]
  22. Deeying, J.; Asawarungsaengkul, K.; Chutima, P. Multi-objective optimization on laser solder jet bonding process in head gimbal assembly using the response surface methodology. Opt. Laser Technol. 2018, 98, 158–168. [Google Scholar] [CrossRef]
  23. Liu, Y.; Liu, C.; Liu, W.; Ma, Y.; Tang, S.; Liang, C.; Cai, Q.; Zhang, C. Optimization of parameters in laser powder deposition AlSi10Mg alloy using Taguchi method. Opt. Laser Technol. 2019, 111, 470–480. [Google Scholar] [CrossRef]
  24. Viumdal, H.; Mylvaganam, S. Enhancing signal to noise ratio by fine-tuning tapers of cladded/uncladded buffer rods in ultrasonic time domain reflectometry in smelters. Ultrasonics 2014, 54, 894–904. [Google Scholar] [CrossRef] [PubMed]
  25. Rajamani, D.; Ziout, A.; Balasubramanian, E.; Velu, R.; Sachin, S.; Mohamed, H. Prediction and analysis of surface roughness in selective inhibition sintered high-density polyethylene parts: A parametric approach using response surface methodology–grey relational analysis. Adv. Mech. Eng. 2018, 10, 1687814018820994. [Google Scholar] [CrossRef]
  26. Wojciechowski, S.; Maruda, R.W.; Krolczyk, G.; Niesłony, P. Application of signal to noise ratio and grey relational analysis to minimize forces and vibrations during precise ball end milling. Prec. Eng. 2018, 51, 582–596. [Google Scholar] [CrossRef]
  27. Maheswaran, C.B.; Jayendra Bharathi, R.; Paul joshua, S.; Kumar Srirangan, A. Optimisation of laser welding parameters for incoloy 800HT joints using Grey-fuzzy Taguchi approach. Mater. Today: Proc. 2018, 5, 14237–14243. [Google Scholar] [CrossRef]
  28. Naik, A.B.; Reddy, A.C. Optimization of tensile strength in TIG welding using the Taguchi method and analysis of variance (ANOVA). Thermal Sci. Eng. Progr. 2018, 8, 327–339. [Google Scholar] [CrossRef]
  29. Mishra, S.; Yadava, V. Modeling and optimization of laser beam percussion drilling of thin aluminum sheet. Opt. Laser Technol. 2013, 48, 461–474. [Google Scholar] [CrossRef]
  30. Marzban, J.; Ghaseminejad, P.; Ahmadzadeh, M.H.; Teimouri, R. Experimental investigation and statistical optimization of laser surface cladding parameters. Int. J. Adv. Manuf. Technol. 2015, 76, 1163–1172. [Google Scholar] [CrossRef]
  31. Zhang, H.; Li, C.; Wang, H.; Wang, J.; Fan, Y. Frequency line extraction on low SNR lofargram using principal component analysis. In Proceedings of the 2018 14th IEEE International Conference on Signal Processing (ICSP), Beijing, China, 12–16 August 2018; pp. 455–459. [Google Scholar]
  32. Lian, G.; Yao, M.; Zhang, Y.; Chen, C. Analysis and prediction on geometric characteristics of multi-track overlapping laser cladding. Int. J. Adv. Manuf. Technol. 2018, 97, 2397–2407. [Google Scholar] [CrossRef]
  33. Ochonogor, O.F.; Meacock, C.; Abdulwahab, M.; Pityana, S.; Popoola, A.P.I. Effects of Ti and TiC ceramic powder on laser-cladded Ti–6Al–4V in situ intermetallic composite. Appl. Surf. Sci. 2012, 263, 591–596. [Google Scholar] [CrossRef]
  34. Lu, J.; Cao, J.; Lu, H.; Zhang, L.; Luo, K. Wear properties and microstructural analyses of Fe-based coatings with various WC contents on H13 die steel by laser cladding. Surf. Coat. Technol. 2019, 369, 228–237. [Google Scholar] [CrossRef]
  35. Zhang, Y.; Xu, P.; Liu, C.; Ren, J.; Gong, H. The influence of carbides on the microstructure, grain growth, and oxidation resistance of nanostructured carbides-strengthened cobalt-based multi-track laser-cladding layers. Appl. Surf. Sci. 2019, 469, 495–504. [Google Scholar] [CrossRef]
  36. Hulka, I.; Utu, D.; Serban, V.; Negrea, P.; Lukáč, F.; Chráska, T. Effect of Ti addition on microstructure and corrosion properties of laser cladded WC-Co/NiCrBSi(Ti) coatings. Appl. Surf. Sci. 2020, 504, 144349. [Google Scholar] [CrossRef]
  37. Zhao, Y.; Yu, T.; Sun, J.; Jiang, S. Microstructure and properties of laser cladded B4C/TiC/Ni-based composite coating. Int. J. Refractory Metals Hard Mater. 2020, 86, 105112. [Google Scholar] [CrossRef]
Figure 1. SEM images of cladding powder.
Coatings 10 00151 g001
Figure 2. Laser cladding system.
Coatings 10 00151 g002
Figure 3. Schematic diagram of overlapped passes.
Coatings 10 00151 g003
Figure 4. Macrograph of cross-section multi-pass clad layer.
Coatings 10 00151 g004
Figure 5. Actual and predicted GRG values.
Coatings 10 00151 g005
Figure 6. Normal plot of GRG residuals.
Coatings 10 00151 g006
Figure 7. Effects of significant factors on GRG.
Coatings 10 00151 g007
Figure 8. Response of GRG to PR and LP.
Coatings 10 00151 g008
Figure 9. Response of GRG to LP and DD.
Coatings 10 00151 g009
Figure 10. Macrograph of optimized cross sectional multi-pass clad layer.
Coatings 10 00151 g010
Figure 11. Microhardness of cladding layer.
Coatings 10 00151 g011
Figure 12. Microstructure of cladding layer.
Coatings 10 00151 g012
Figure 13. EDSresults at interested points of clad layer.
Coatings 10 00151 g013
Figure 14. Coefficient of friction.
Coatings 10 00151 g014
Figure 15. Comparison of 2D worn morphologies of substrate and optimized clad layer.
Coatings 10 00151 g015
Figure 16. Comparison of 3D worn morphologies of substrate and optimized clad layer.
Coatings 10 00151 g016
Table 1. Chemical composition of AISI 1045 carbon steel (wt. %).
SteelCCrMnNiSiFe
AISI 10450.40∼0.50≤0.250.40∼0.50≤0.250.17∼0.37Bal.
Table 2. Chemical composition of Fe50 and TiC (wt.%).
PowderCrCMoSiONiFeNT.CF.C
Fe5016.150.151.580.77<0.11.75Bal.---
TiC----0.50.08-0.5>18.8<0.5
Table 3. Purity information about shielding argon gas.
Impurity NameO 2 N 2 H 2 OPurity
Content≤5 ppm≤30 ppm≤10 ppm≥99.99%
Table 4. Laser cladding process variables and their levels.
VariablesNotationUnitLevels
Powder ratio of TiCPRwt. %3035404550
Laser powerLPkW1.21.41.61.82
Defocusing distanceDDmm 4 2 024
Overlapping ratioOR%1020304050
Table 5. Central composite design and results.
No.PR (%)LP (kW)DD (mm)OR (%)W(mm)F A nf (mm 2 )
1401.603012.960.90080.242
2451.822012.100.87800.620
3351.42409.820.90150.714
4501.60309.570.86440.756
5401.60509.640.86020.834
6401.603012.990.90300.421
740203012.230.93890.180
8351.4 2 2011.440.88040.664
9301.603012.610.91070.246
10451.4 2 409.490.89010.648
11401.603012.160.91080.176
12401.603012.740.90360.281
13401.603012.310.89030.306
14451.4 2 2011.20.84190.821
15401.6 4 3010.10.89430.358
16451.8 2 4011.120.92060.390
17401.603012.940.90520.312
18451.42409.580.87510.810
19351.422012.630.88040.820
20401.203010.740.89220.842
21351.8 2 2014.670.90870.256
22351.4 2 409.530.90450.786
23451.82409.320.90070.881
24451.8 2 2012.850.88630.514
25351.822013.450.9030.240
26401.601015.40.80970.780
27451.422011.610.85810.844
28351.8 2 4012.350.91110.152
29351.824012.310.90460.256
30401.64309.520.89000.654
Table 6. Signal-to-noise ratios (SNRs) of response targets.
No.S/N W (dB)S/N F (dB)S/N A nf (dB)
122.2521−0.907412.3237
221.6557−1.13014.1522
319.8422−0.90072.926
419.6182−1.26572.4296
519.6815−1.3081.5767
622.2722−0.88627.5144
721.7485−0.547614.8945
821.1685−1.10643.5566
922.0143−0.812512.1813
1019.5453−1.01123.7685
1121.6987−0.811515.0897
1222.1034−0.880511.0259
1321.8052−1.009310.2856
1420.9844−1.49481.7131
1520.0864−0.97038.9223
1620.9221−0.71868.1787
1722.2387−0.865110.1169
1819.6273−1.15881.8303
1922.0281−1.10641.7237
2020.6201−0.99081.4938
2123.3286−0.831611.8352
2219.5819−0.87182.0915
2319.3883−0.90841.1005
2422.1781−1.04845.7807
2522.5744−0.886212.3958
2623.7504−1.83352.1581
2721.2966−1.32921.4732
2821.8333−0.808716.3631
2921.8052−0.870911.8352
3019.5727−1.01223.6884
Table 7. Eigenvalues and contribution of responses.
Principal ComponentEigenvalueContribution (%)
First1.84761.561
Second1.00133.365
Third0.1525.074
Total 100
Table 8. Results of principal component load coefficients.
4]*ResponsePrincipal Component
FirstSecond
W0.6120.771
F0.741−0.637
A nf 0.9610.001
Table 9. Linear combination coefficients.
ResponseFirst ValuesSecond Values
W0.45030.7706
F0.5452−0.6367
A nf 0.70710.001
Table 10. Results of comprehensive score model coefficient and response weight.
ResponseCoefficient of Comprehensive Score ModelResponse Weight
W0.56290.4888
F0.12980.1127
A nf 0.45890.3985
Table 11. Grey relational analysis (GRA) results.
No.Deviation SequenceGRCGRGRank
Δ O i ( W ) Δ O i ( F ) Δ O i ( A nf ) GRC(W)GRC(F)GRC( A nf )
10.65650.72020.73530.59280.64120.65390.62267
20.51980.5470.19990.51010.52470.38460.461717
30.10410.72540.11960.35820.64550.36220.392223
40.05270.44160.08710.34550.47240.35390.363129
50.06720.40870.03120.3490.45820.34040.357930
60.66110.73670.42020.5960.6550.46310.549712
70.541110.90380.521410.83860.70183
80.40810.56550.16090.45790.5350.37340.432919
90.6020.7940.7260.55680.70820.6460.60948
100.0360.63950.17480.34150.5810.37730.382825
110.52960.79480.91660.51530.7090.8570.67334
120.62240.74110.65030.56980.65890.58840.58729
130.55410.6410.60180.52860.58210.55670.545813
140.36590.26340.04010.44090.40430.34250.397622
150.160.67130.51250.37310.60330.50630.452218
160.35160.8670.46380.43540.78990.48250.494115
170.65340.75310.59080.59060.66940.54990.583311
180.05480.52470.04780.3460.51260.34430.364128
190.60520.56550.04080.55880.5350.34270.4716
200.28240.65540.02580.41060.5920.33920.402621
210.90330.77920.70330.83790.69360.62760.73792
220.04440.74790.06490.34350.66480.34840.381726
2300.719400.33330.64060.33330.36827
240.63950.61060.30660.58110.56220.4190.514414
250.73040.73670.74010.64970.6550.65790.65366
26100.069310.33330.34950.66565
270.43750.39220.02440.47060.45130.33880.415920
280.56050.79710.53220.711210.73881
290.55410.74860.70330.52860.66540.62760.583510
300.04230.63870.16960.3430.58050.37580.382924
Table 12. Sequential model sum of squares [GRG].
SourceSum of SquaresdfMean SquareF Valuep-Value Prob>F
Mean vs. Total7.7917.79
Linear vs. Mean0.340.07412.05<0.0001
2FI vs. Linear0.05268.720×10 3 1.630.1924
Quadratic vs. 2FI0.07240.0189.280.0006Suggested
Residual0.01271.670×10 3
Total8.24300.27
Table 13. ANOVA for GRG.
SourceSum of SquaresdfMean SquareF Valuep-Value Prob>F
Model0.4190.04626.05<0.0001significant
PR0.09210.09251.91<0.0001
LP0.1510.15086.22<0.0001
DD0.01110.0116.120.0224
OR0.04110.04123.290.0001
(PR)(LP)0.03610.03620.360.0002
(LP)(DD)0.01410.0147.660.0119
PR 2 0.01910.01910.780.0037
DD 2 0.05210.05229.66<0.0001
OR 2 0.01110.0116.160.0221
Residual0.035201.769×10 3
Lack of Fit0.024151.589×10 3 0.690.7378not sig.
Pure Error0.01252.310×10 3
Cor Total0.4529
R 2 0.9214 Predicted R 2 0.7750
Adjusted R 2 0.8860 Adequate Precision17.469
Table 14. Objectives and constraints for response surface models.
NamePRLPDDORGRG
Goalin rangein rangein rangein rangemaximize
Lower Limit351.4−2200.358
Upper Limit451.82400.739
Table 15. Verification results of proposed response surface models.
ResultPR (%)LP (kW)DD (mm)OR (%)W (mm)F A nf (mm 2 )GRG
Optimal35.281.77−0.4424.0614.370.9090.1040.7470
Actual35.301.77024.1013.550.8820.1110.7834
Error 5.73%2.97%6.73%4.87%
Table 16. Friction and wear test parameters.
ParameterUnitValue
Abrasive pairmmTungsten steel- ϕ 6
Loading forceN30
Sliding speedmm/s5
Distance per strokemm4
Wear timemin120
Sliding mode-Reciprocating
Wear temperature-Room temperature

