Investigation of Barkhausen Noise Emission in Steel Wires Subjected to Different Surface Treatments

 , and
, and
Abstract
:1. Introduction
2. Experimental Details
- -
- the conventional one (quenched and high temperature tempered),
- -
- phosphated (Zn phosphated after quenching + high-temperature tempering),
- -
- galvanized (galvanized after quenching + high-temperature tempering),
- -
- compacted (galvanized and subsequently plastically deformed by drawing in a die).
3. Results of Experiments and Their Discussion
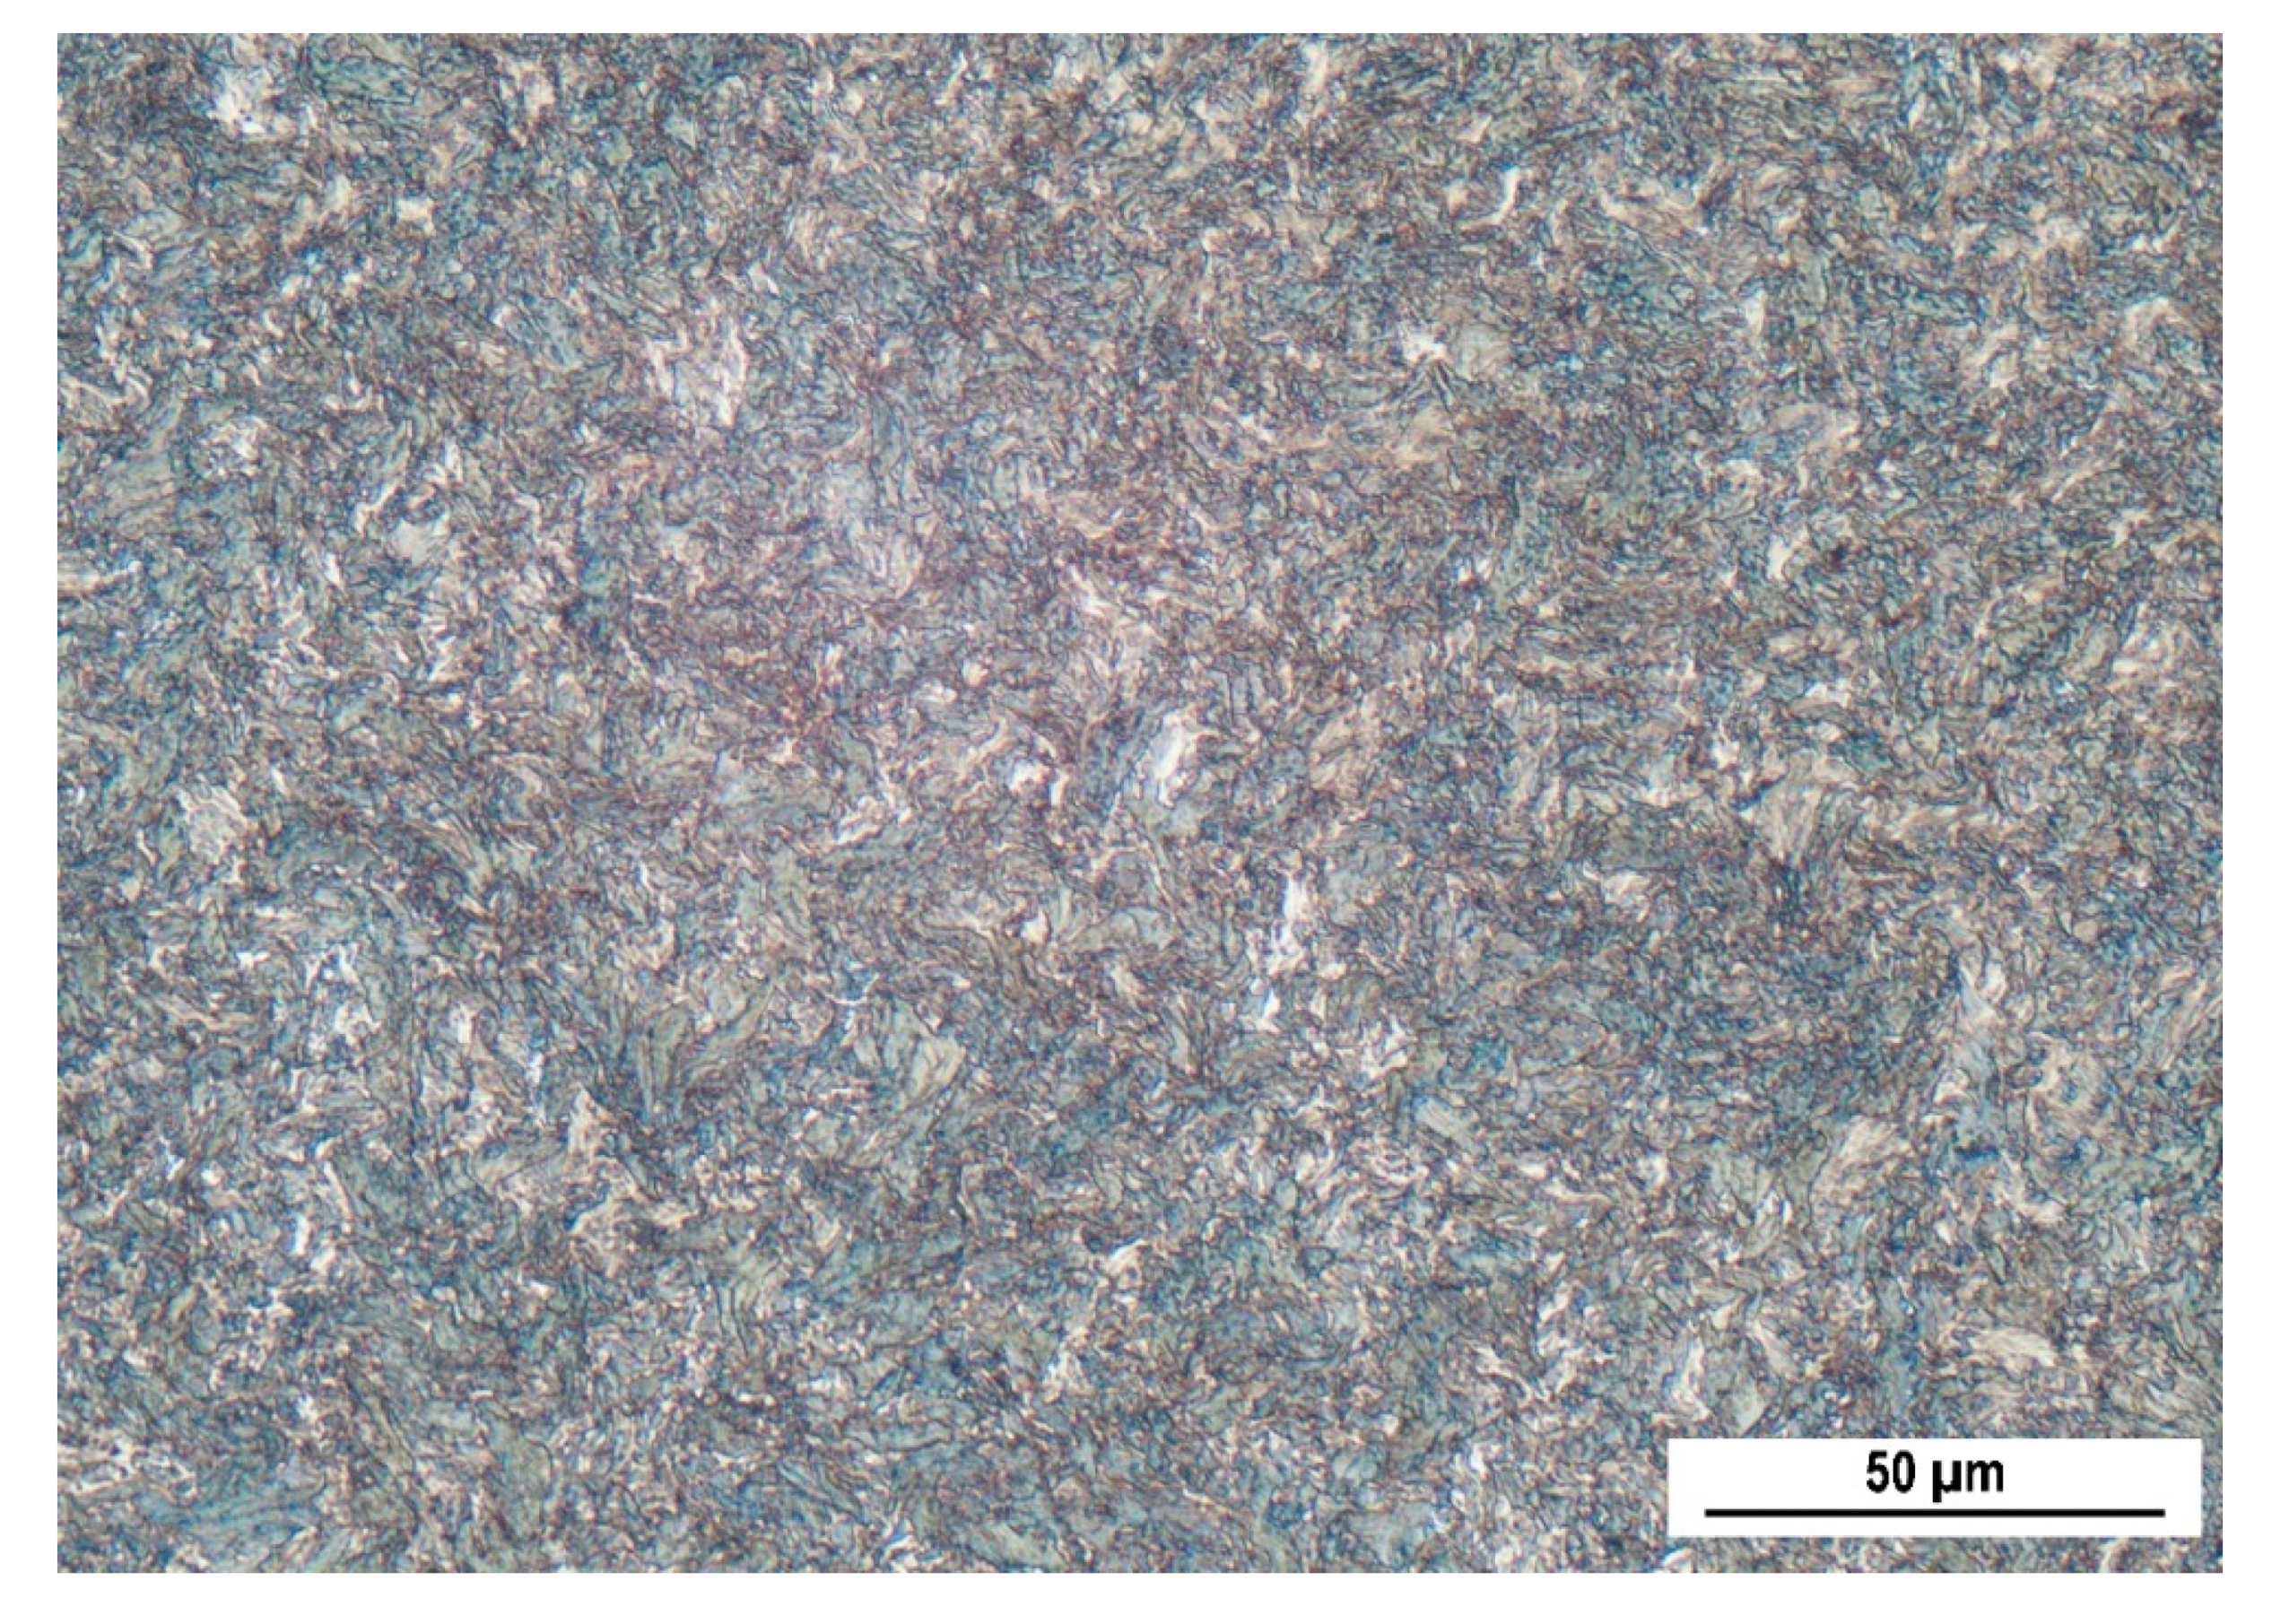
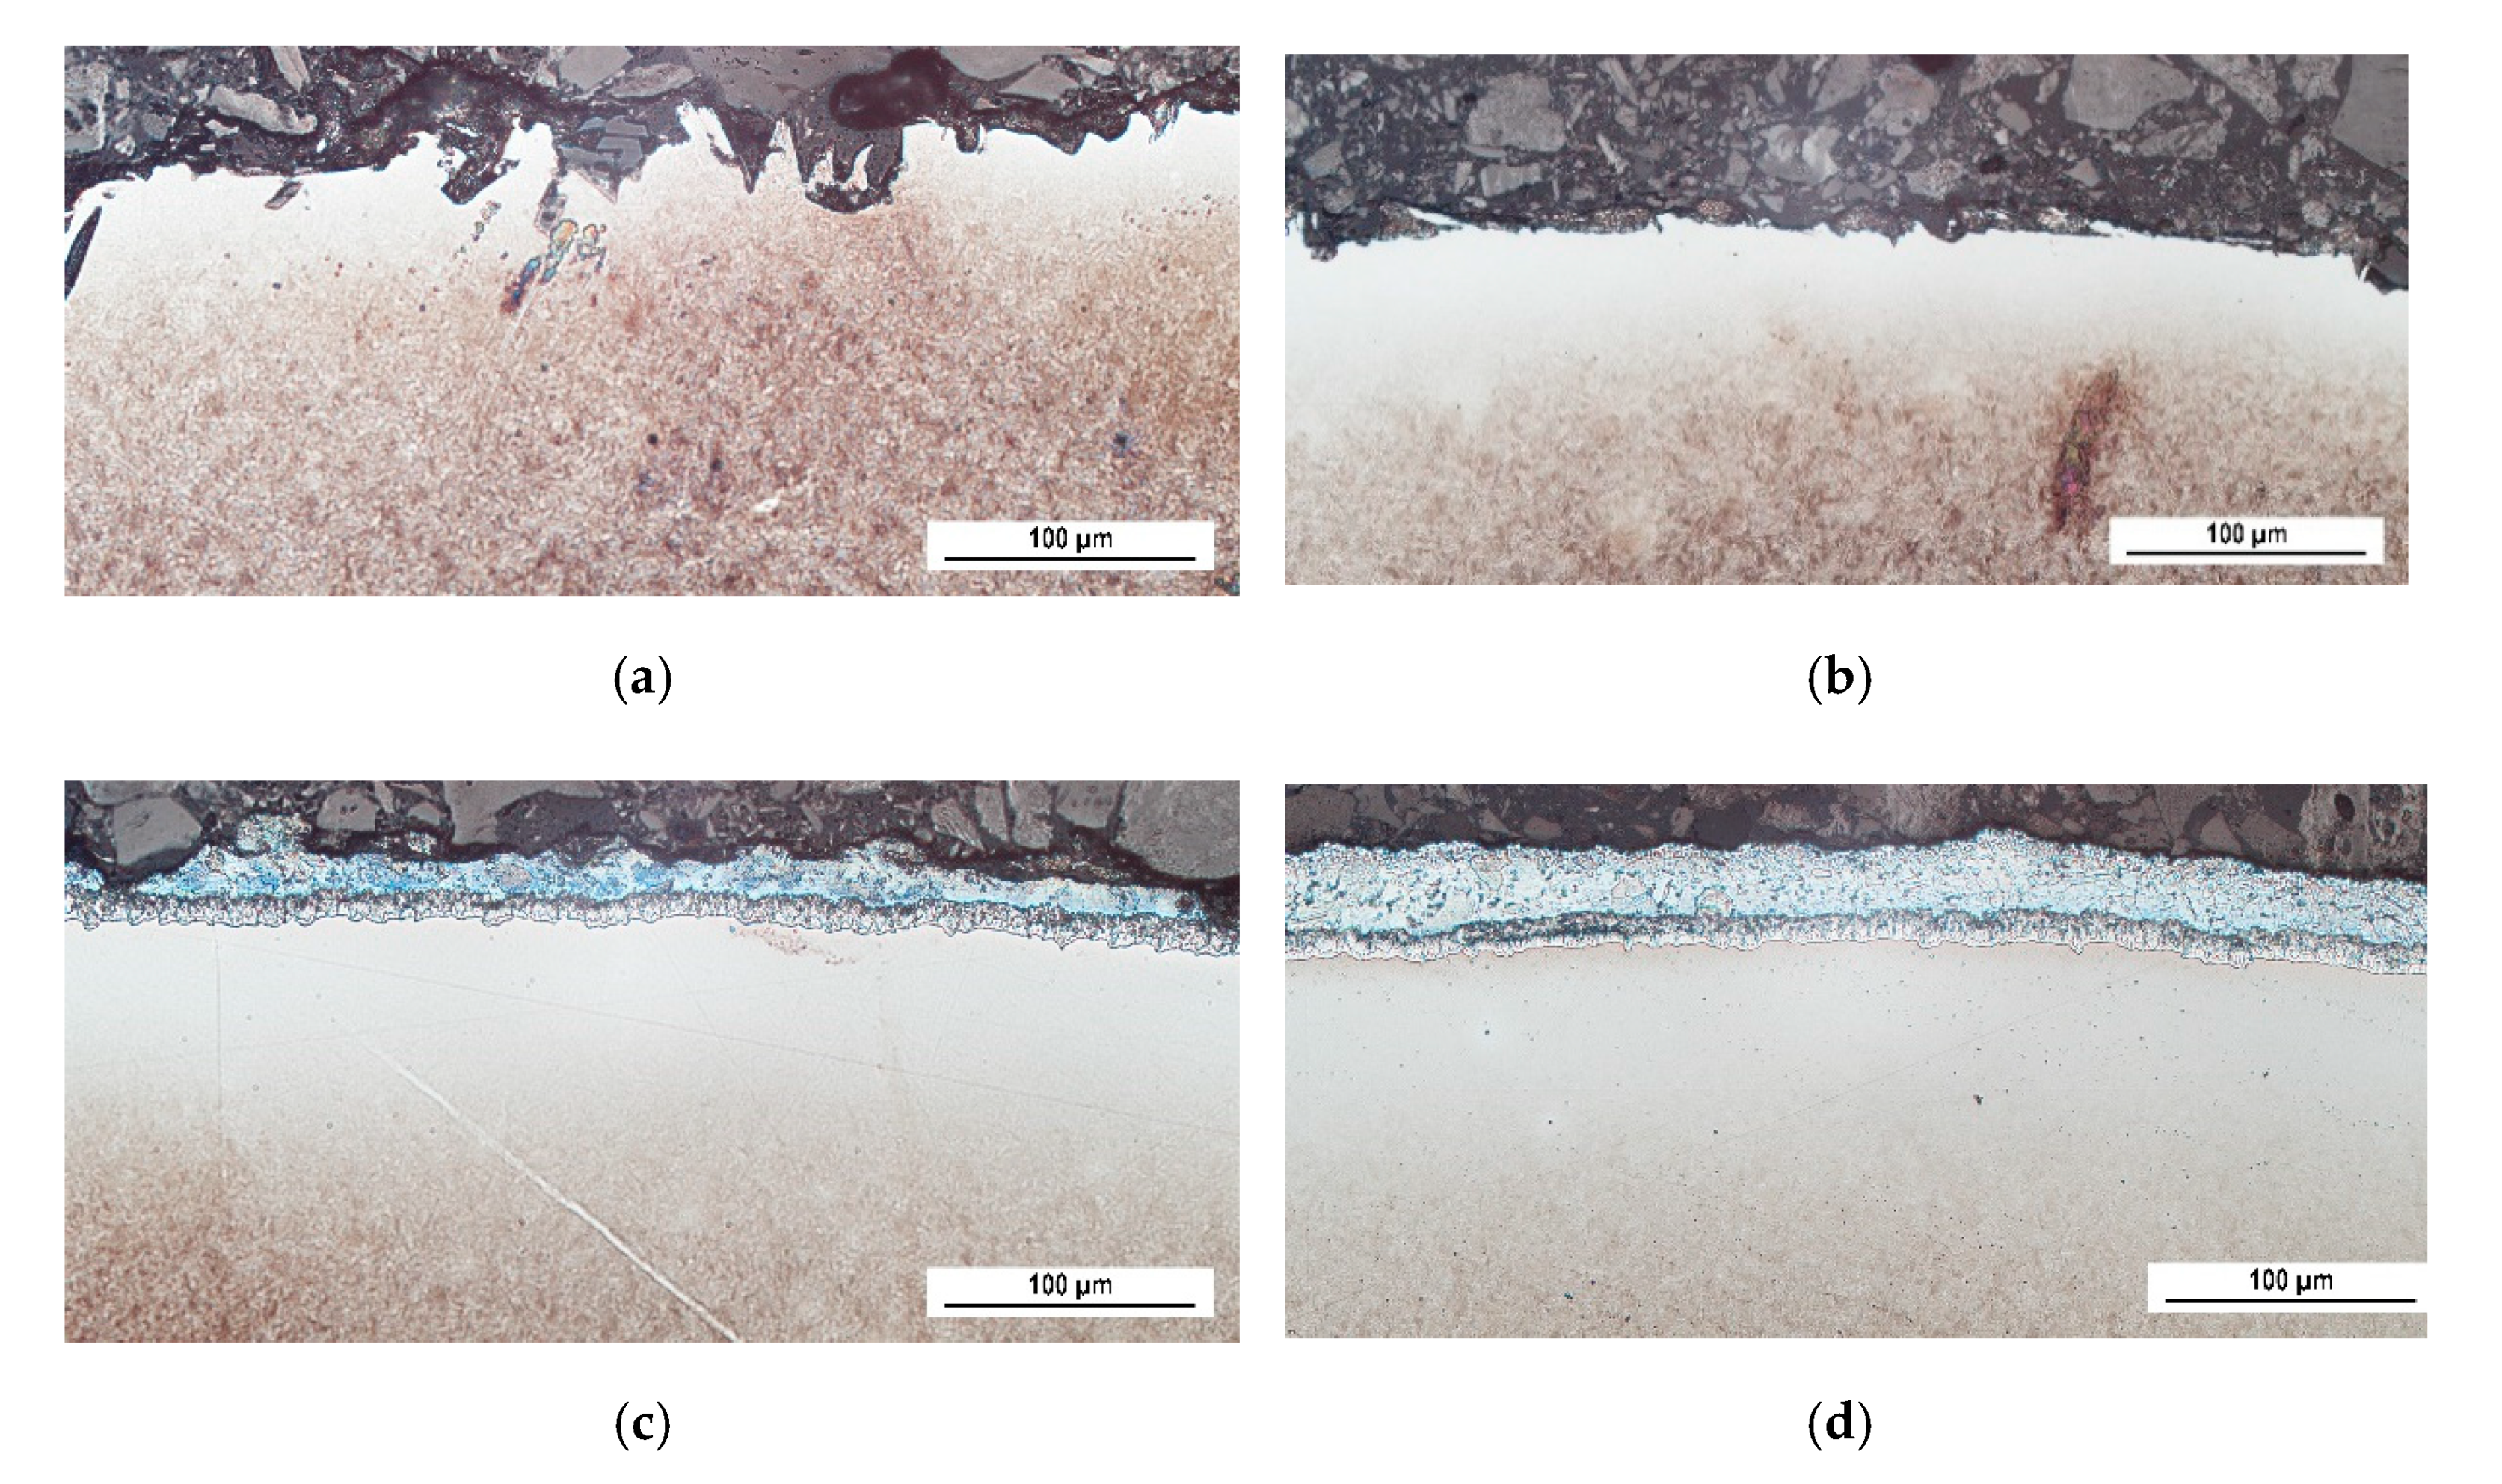
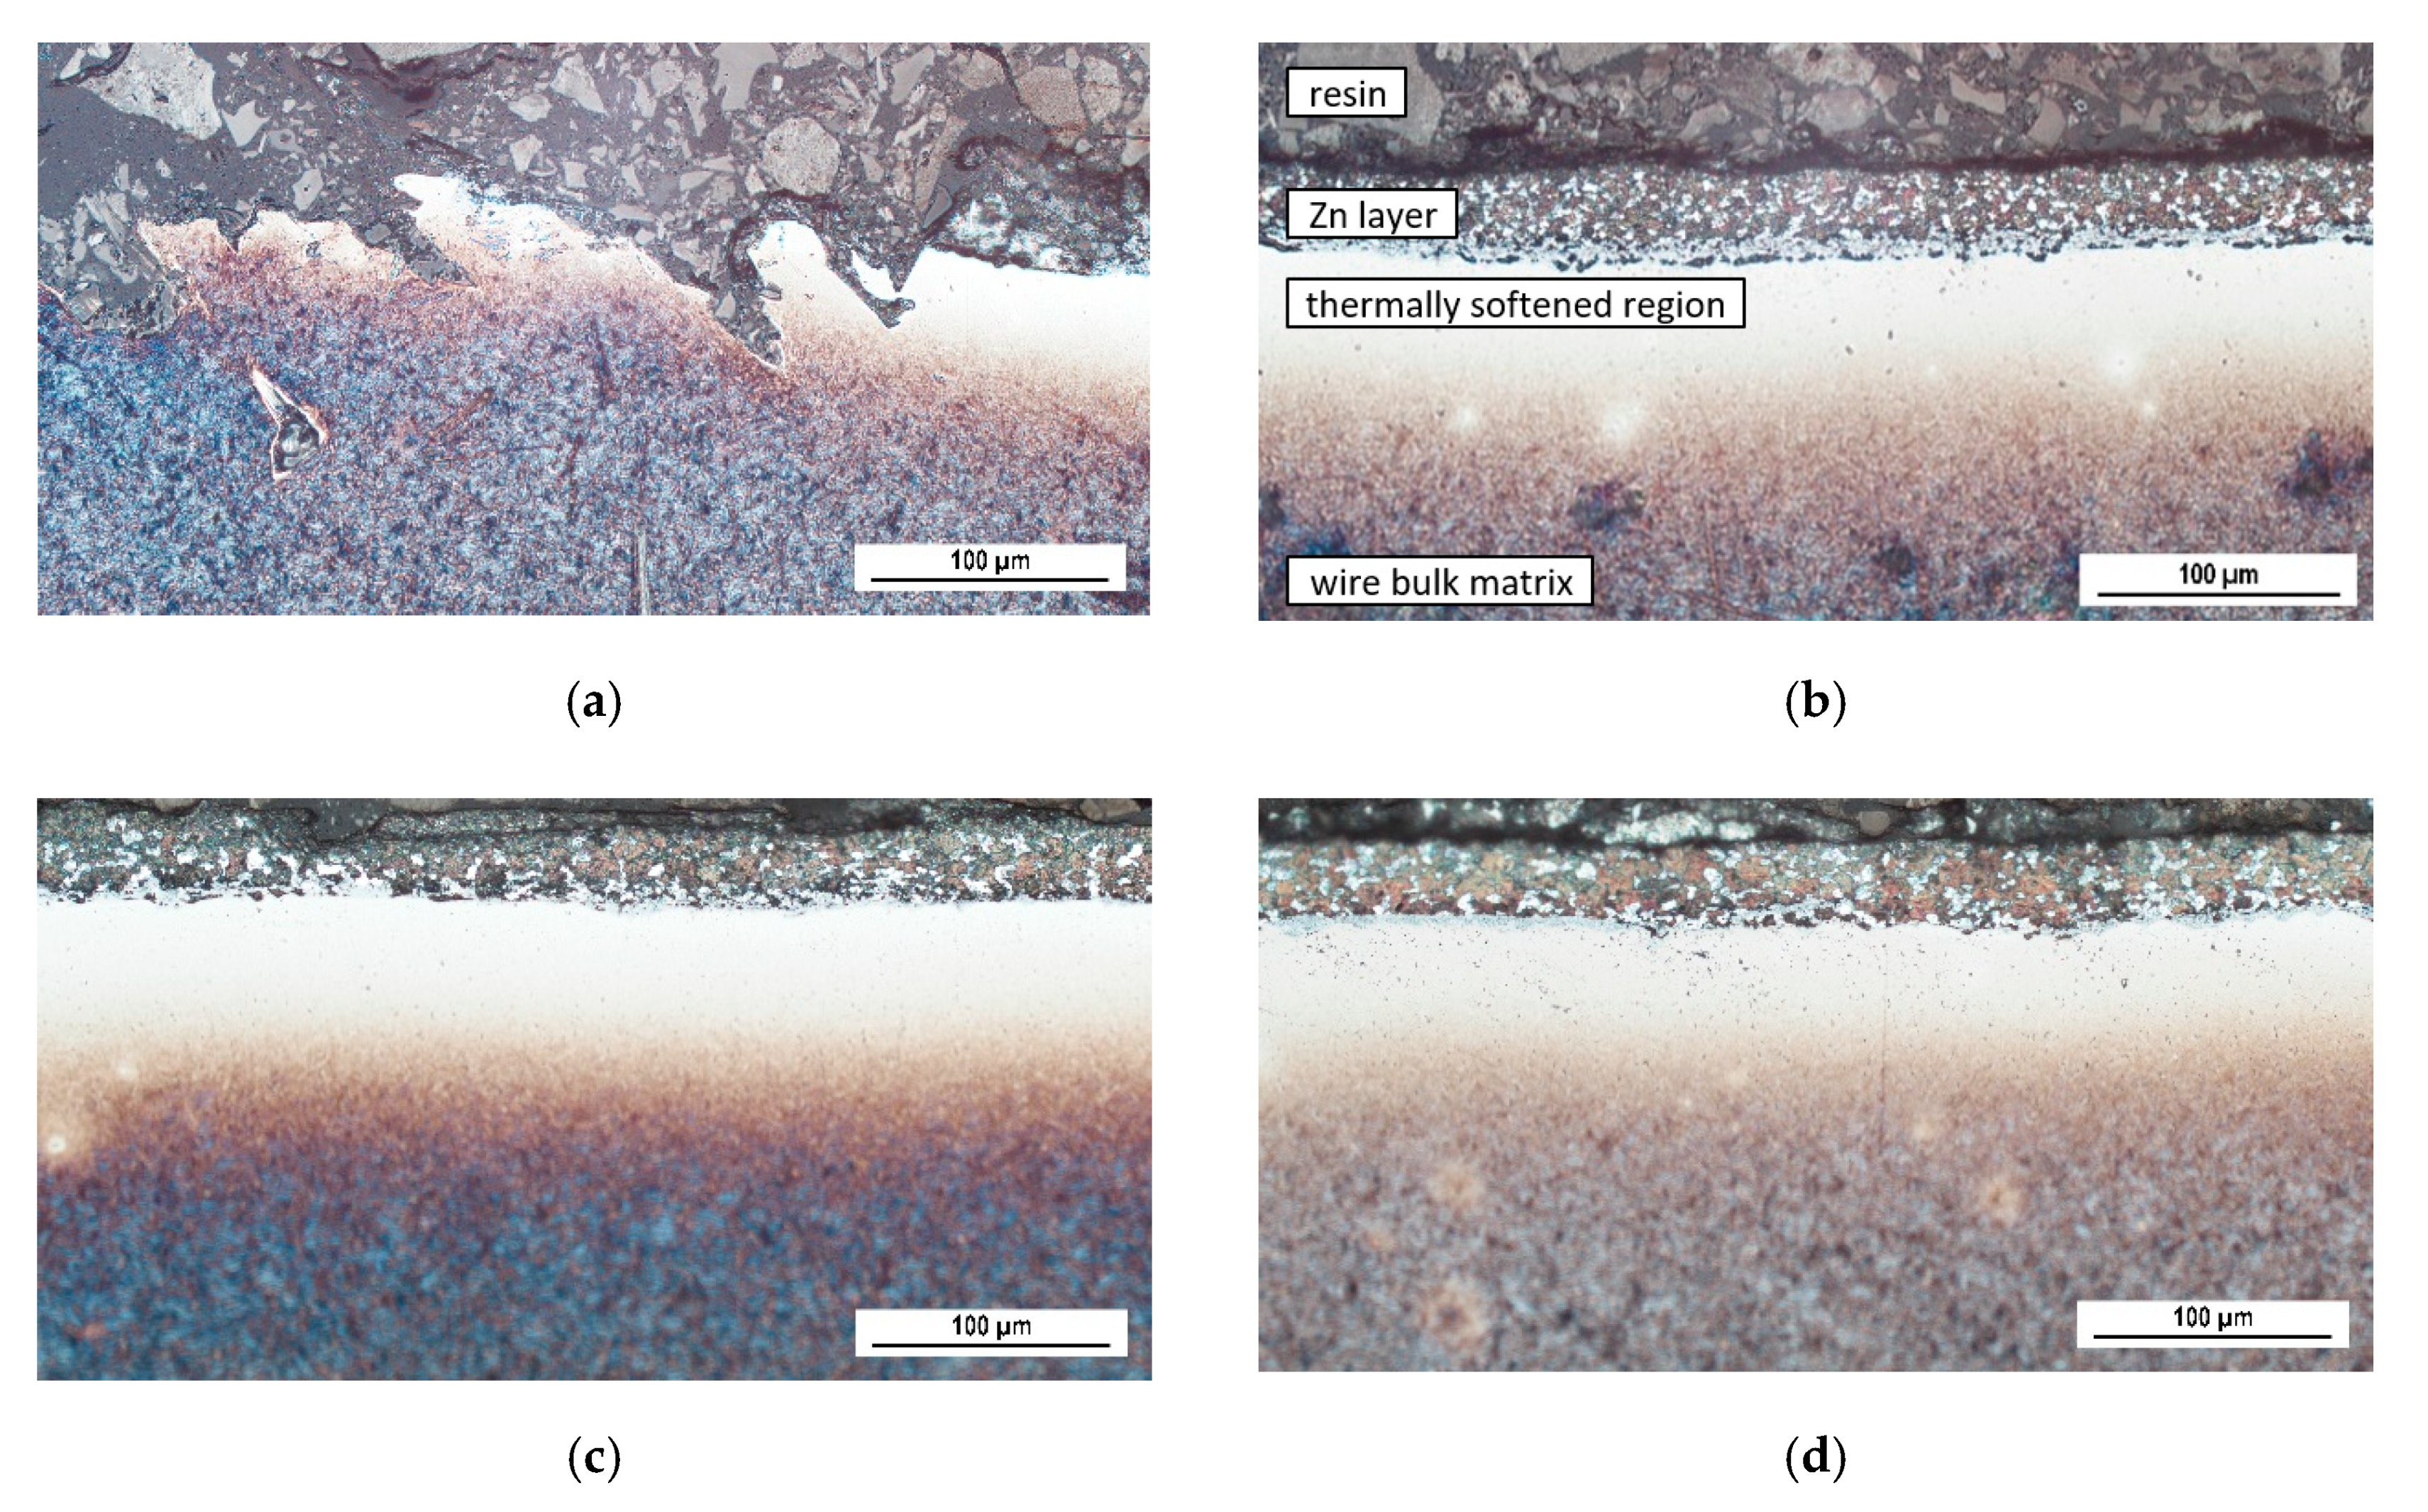
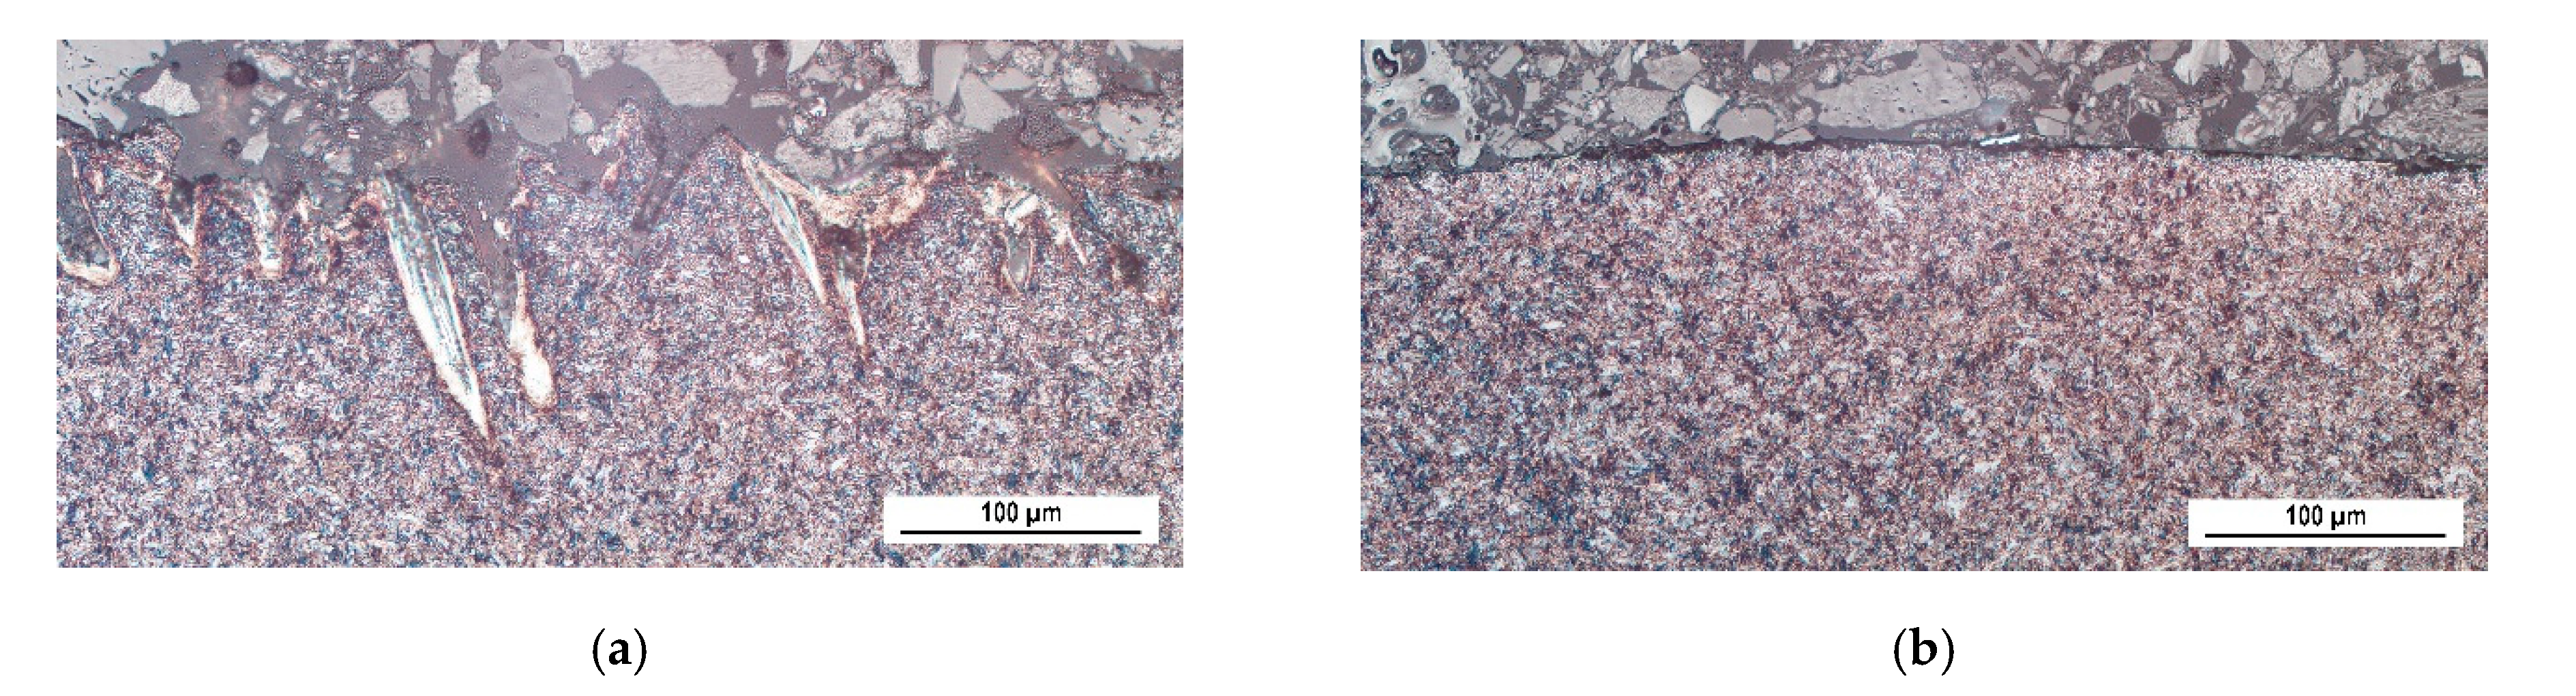
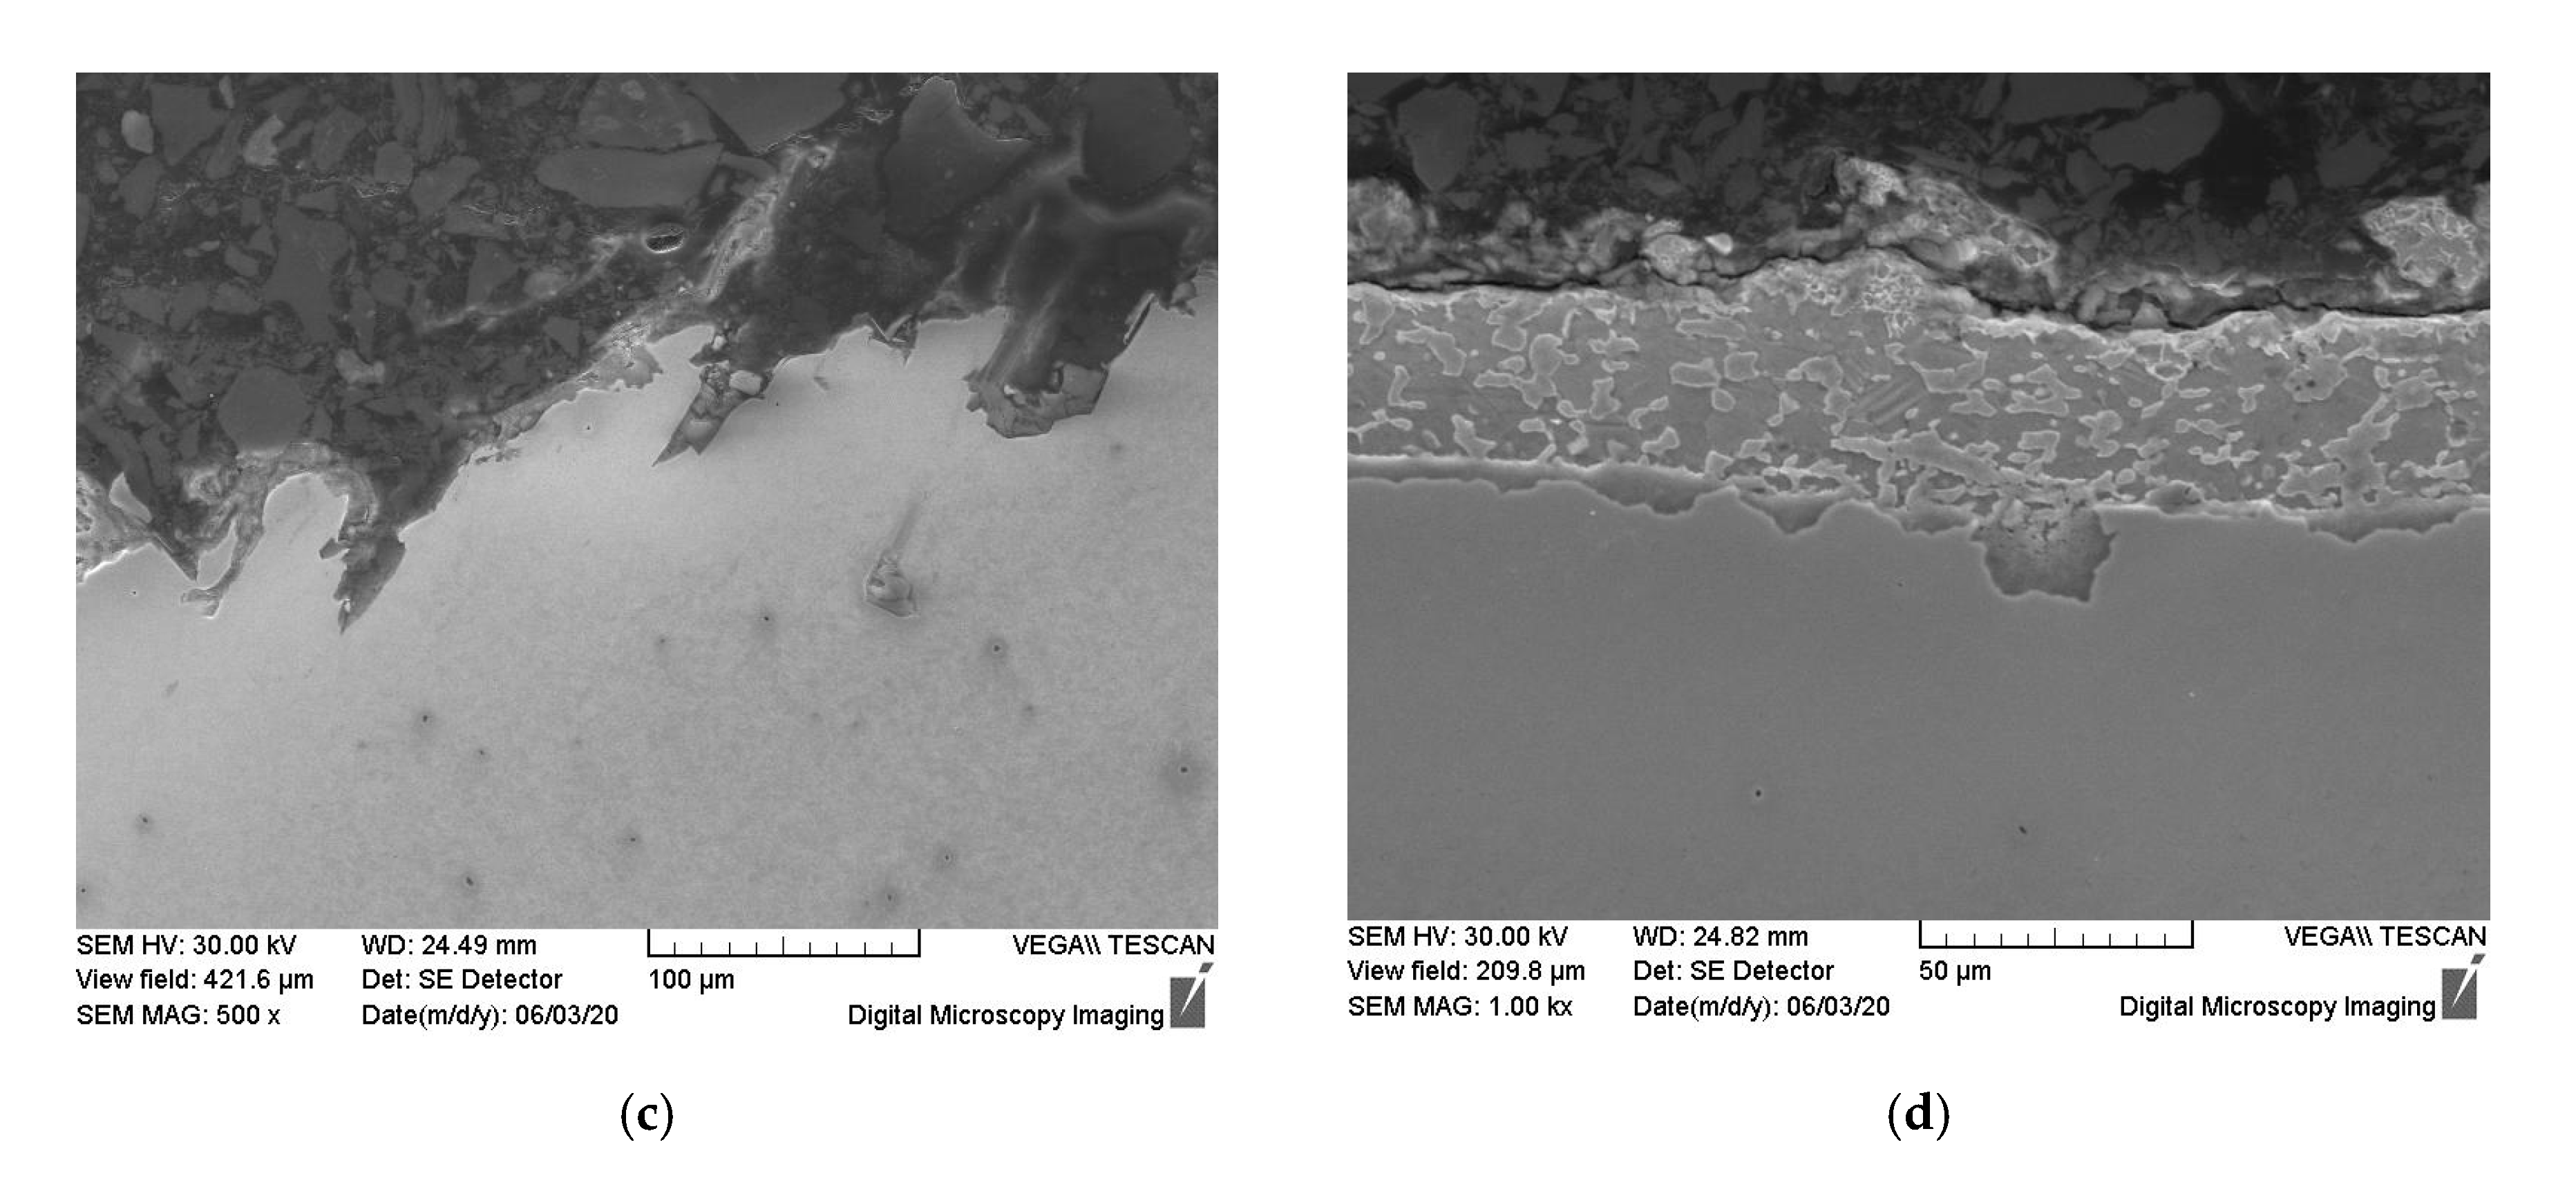
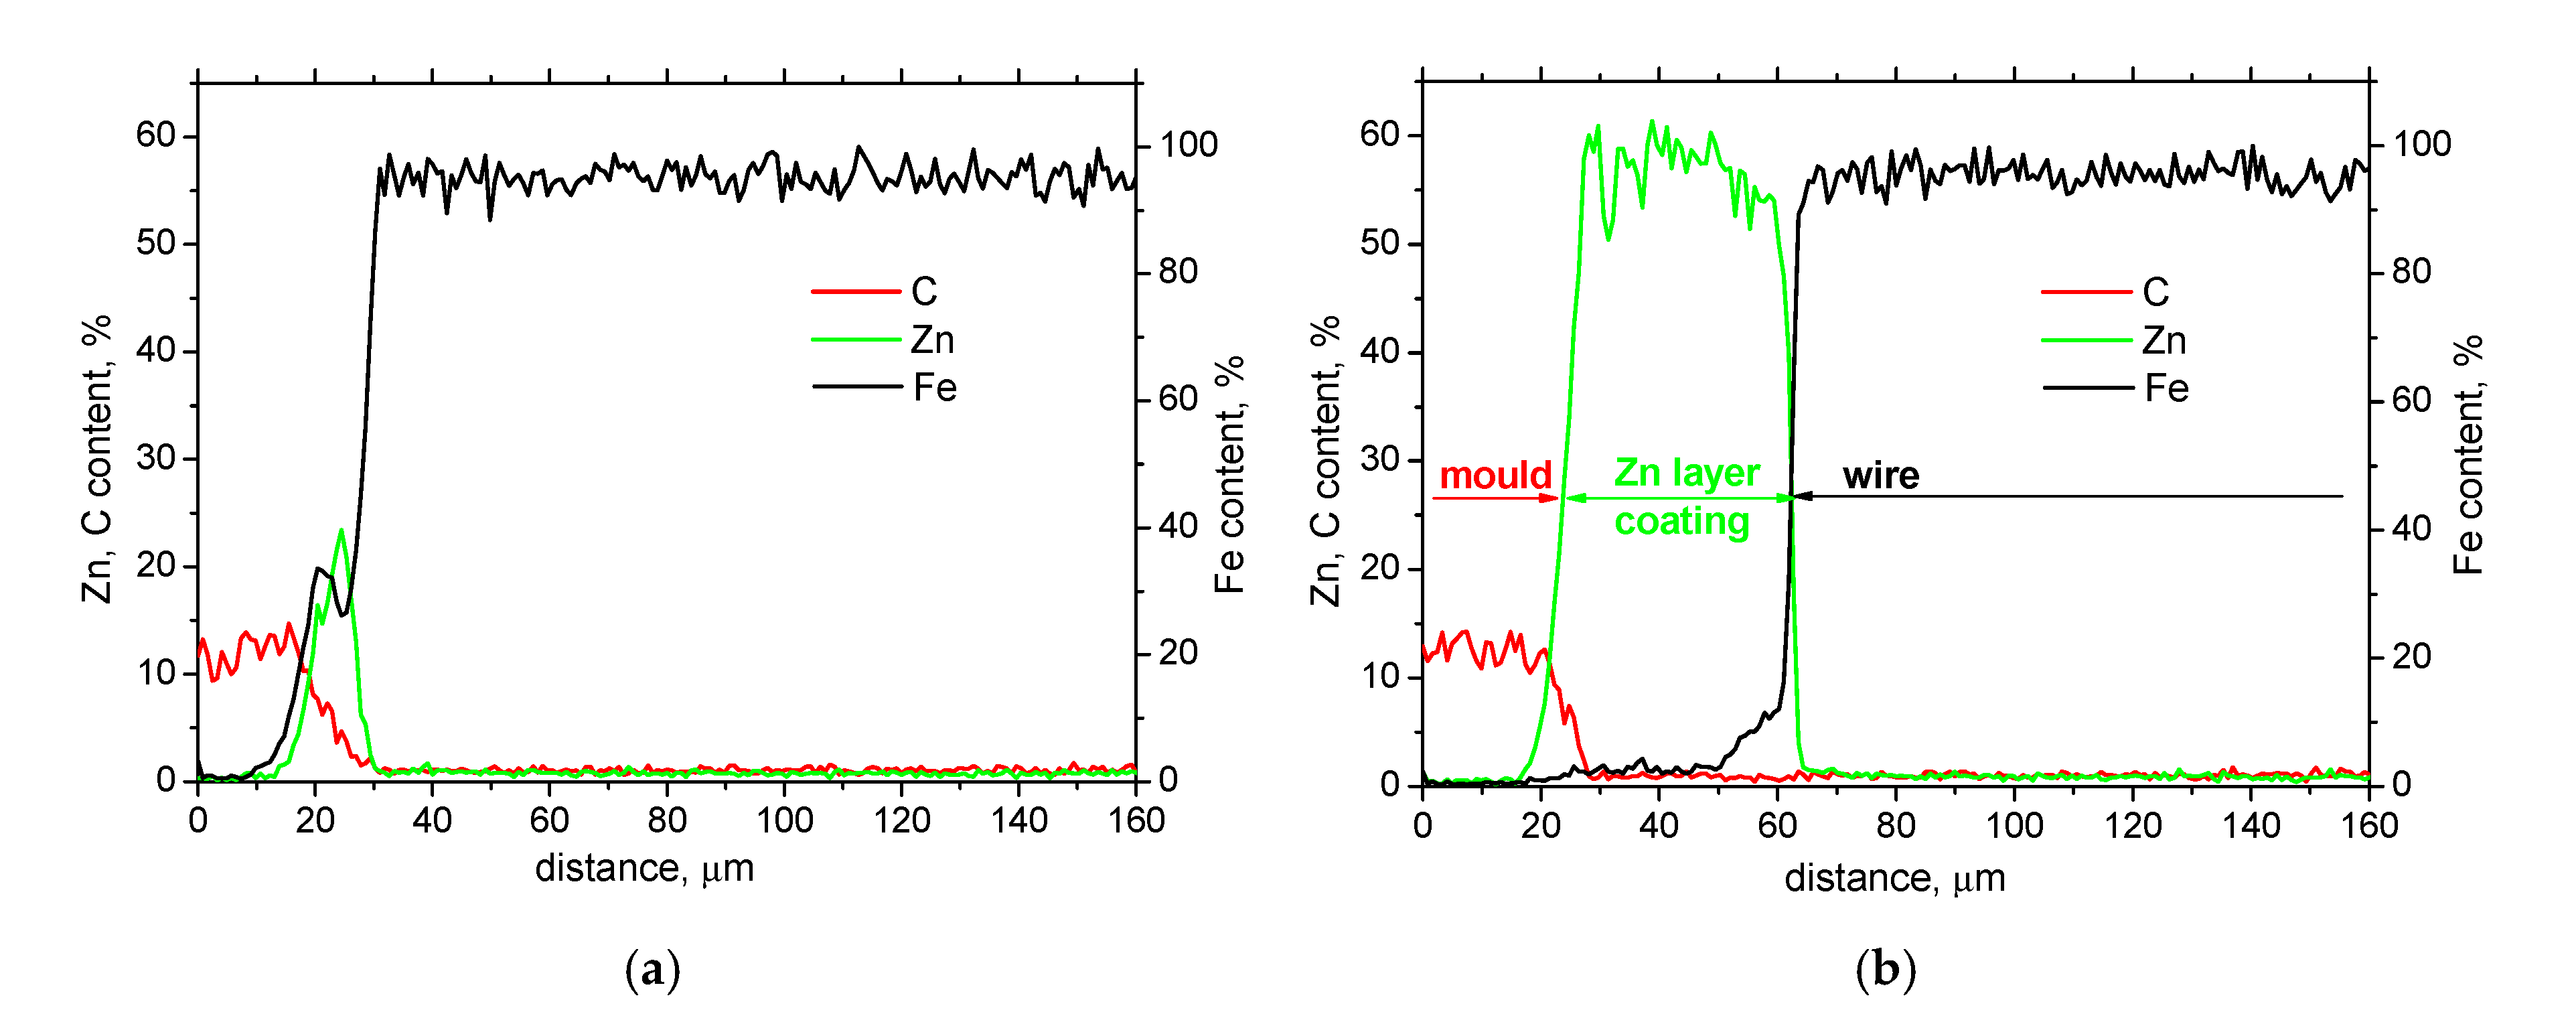
3.1. Microhardness, LM, and SEM Observation
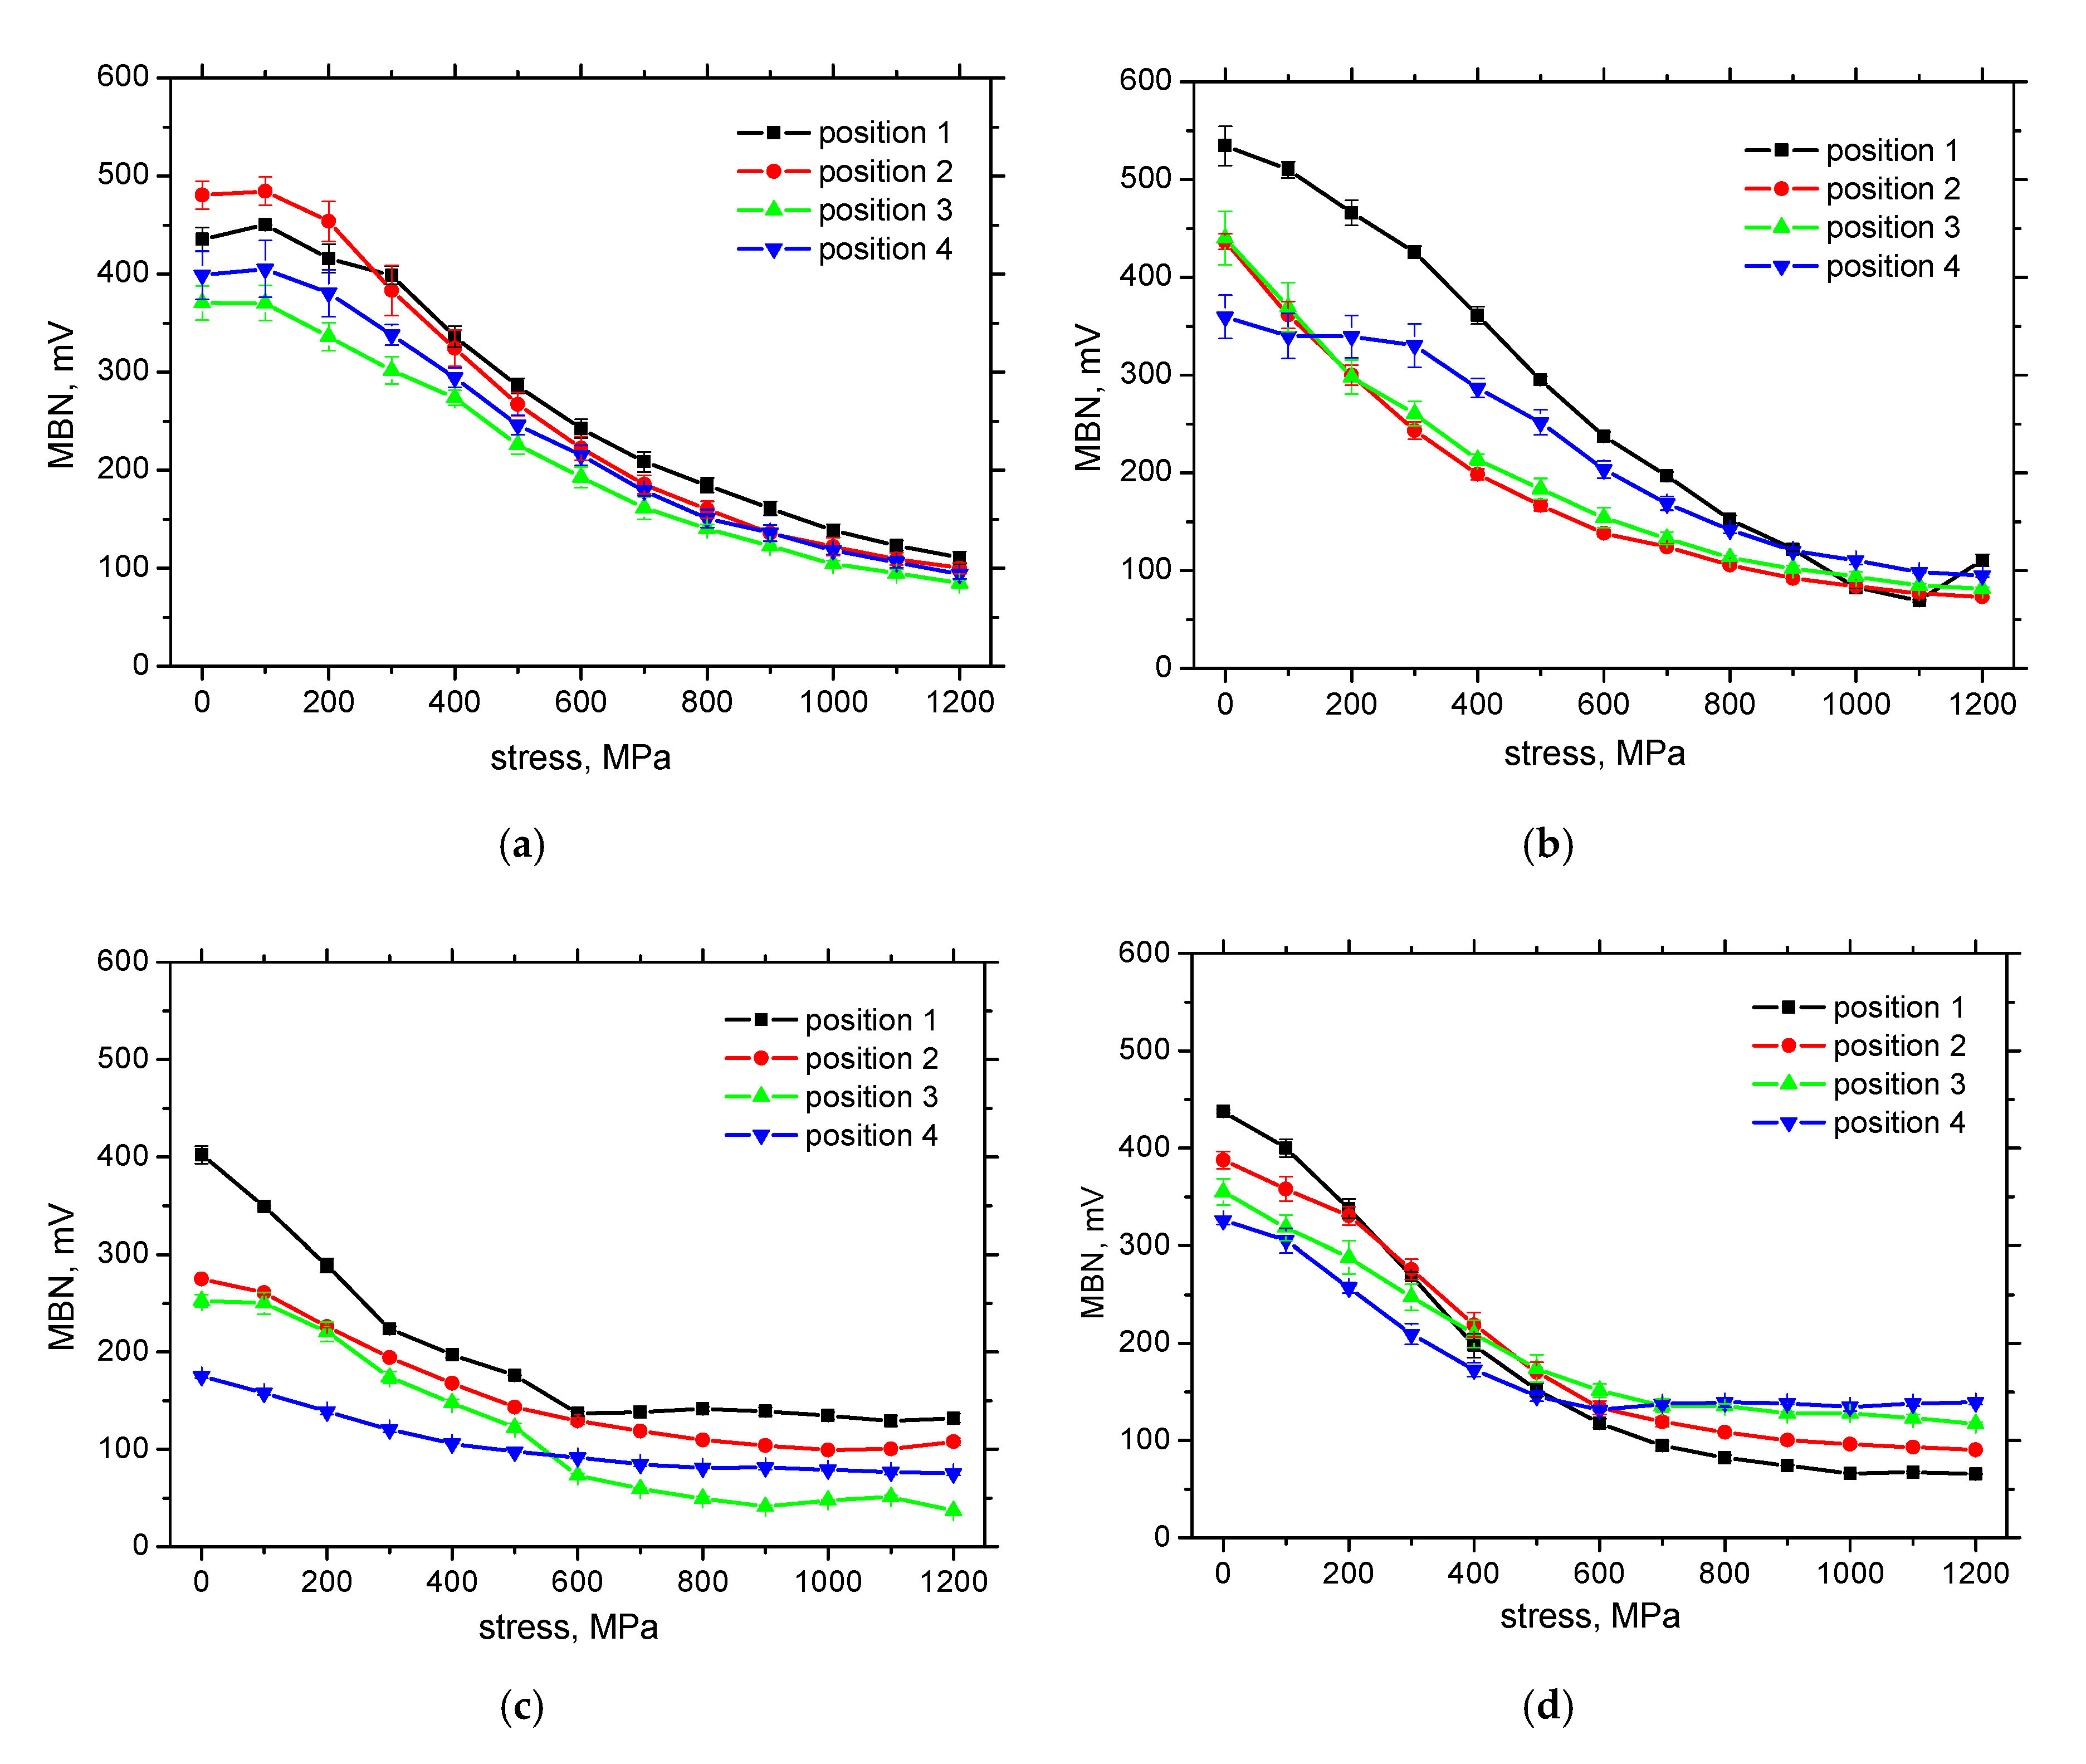
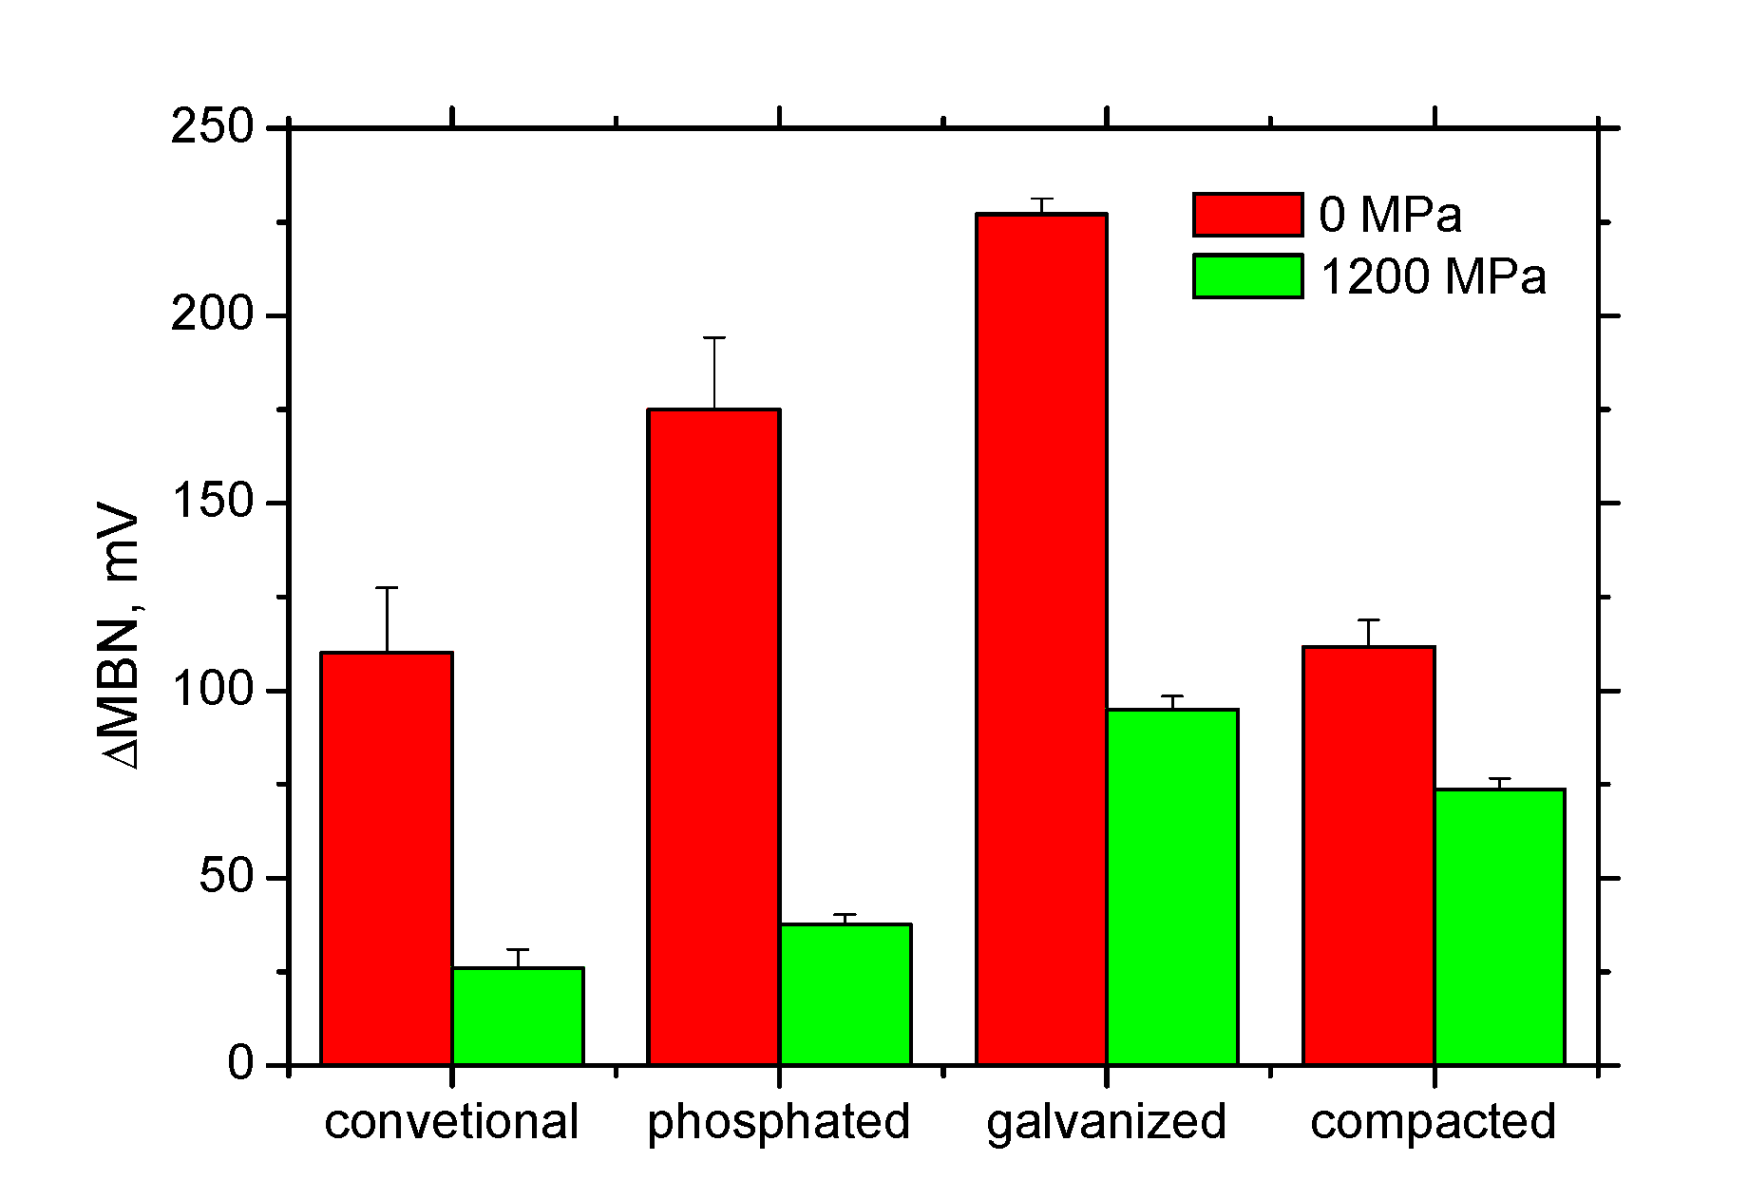
3.2. MBN Measurements
4. Conclusions
Author Contributions
Funding
Conflicts of Interest
References
- Liu, J.; Tian, G.Y.; Gao, B.; Zeng, K.; Zheng, Y.; Chen, J. Micro-macro characteristics between domain wall motion and magnetic Barkhausen noise under tensile stress. J. Magn. Magn. Mater. 2020, 493, 165719. [Google Scholar] [CrossRef]
- Kypris, O.; Nlebedim, I.C.; Jiles, D.C. Measuring stress variation with depth using Barkhausen signals. J. Magn. Magn. Mater. 2016, 407, 377–395. [Google Scholar] [CrossRef]
- Karpuschewski, B.; Bleicher, O.; Beutner, M. Surface integrity inspection on gears using Barkhausen noise analysis. Proc. Eng. 2011, 19, 162–171. [Google Scholar] [CrossRef] [Green Version]
- Jiles, D. Introduction to Magnetism and Magnetic Materials, 3rd ed.; Taylor & Francis Group: New York, NY, USA, 2016. [Google Scholar]
- Chikazumi, S. Physics of Ferromagnetism, 2nd ed.; Oxford University Press: Oxford, UK, 2005. [Google Scholar]
- Sorsa, A.; Santa-Aho, S.; Wartiainen, J.; Souminen, L.; Vippola, M.; Leviskä, K. Effect of shot peening parameters to residual stress profiles and Barkhausen noise. J. Non-Destruct. Eval. 2018, 37, 10. [Google Scholar] [CrossRef] [Green Version]
- Gatelier-Rothea, C.; Chicois, J.; Fougeres, R.; Fleischmann, P. Characterization of pure iron and (130 p.p.m.) carbon-iron binary alloy by Barkhausen noise measurements: Study of the influence of stress and microstructure. Acta Metal. 1998, 46, 4873–4882. [Google Scholar] [CrossRef]
- Neslušan, M.; Bahleda, F.; Moravčík, M.; Zgútová, K.; Pastorek, F. Assessment of tendons prestressing after long-term service via the Barkhausen noise technique. Materials 2019, 12, 3450. [Google Scholar] [CrossRef] [PubMed] [Green Version]
- Neslušan, M.; Bahleda, F.; Minárik, P.; Zgútová, K.; Jambor, M. Non-destructive monitoring of corrosion extent in steel rope wires via Barkhausen noise emission. J. Magn. Magn. Mater. 2019, 484, 179–187. [Google Scholar] [CrossRef]
- Neslušan, M.; Bahleda, F.; Trojan, K.; Pitoňák, M.; Zgútová, K. Barkhausen noise in over-stressed wires. J. Magn. Magn. Mater. 2020, 513, 167134. [Google Scholar] [CrossRef]
- Anania, L.; Badala, A.; D’Agata, G. Damage and collapse mode of existing post tensioned precast concrete bridge: The case of Petrulla viaduct. Eng. Struct. 2018, 162, 226–244. [Google Scholar] [CrossRef]
- Xu, J.; Sun, H.; Cai, S. Effect of symmetrical broken wires damage on mechanical characteristics of stay cable. J. Sound Vib. 2019, 461, 114920. [Google Scholar] [CrossRef]
- Neslušan, M.; Čížek, J.; Kolařík, K.; Minárik, P.; Čilliková, M.; Melikhová, O. Monitoring of grinding burn via Barkhausen noise emission in case-hardened steel in large-bearing production. J. Mater. Process. Technol. 2017, 240, 104–117. [Google Scholar] [CrossRef]
- Čížek, J.; Neslušan, M.; Čilliková, M.; Mičietová, A.; Melikhova, O. Modification of steel surfaces induced by turning: Non-destructive characterization using Barkhausen noise and positron annihilation. J. Phys. D Appl. Phys. 2014, 47, 445301. [Google Scholar] [CrossRef]
- Santa-aho, S.; Vippola, M.; Sorsa, A.; Leiviskä, K.; Lindgren, M.; Lepistö, T. Utilization of Barkhausen noise magnetizing sweeps for case-depth detection from hardened steel. NDTE Int. 2012, 52, 95–102. [Google Scholar] [CrossRef]
- Stupakov, A.; Perevertov, O.; Tomáš, I.; Skrbek, B. Evaluation of surface decarburization depth by magnetic Barkhausen noise technique. J. Magn. Magn. Mater. 2011, 323, 1692–1697. [Google Scholar] [CrossRef]
- Sorsa, A.; Santa-aho, S.; Aylott, C.; Shaw, B.A.; Vipplola, M.; Leviskä, K. Case depth prediction of nitride samples with Barkhausen noise measurement. Metals 2019, 9, 325. [Google Scholar] [CrossRef] [Green Version]
- Čilliková, M.; Uríček, J.; Neslušan, M.; Ballo, V.; Mičietová, A. Monitoring of thermal damage after deposition of coatings via Barkhausen noise technique. Acta Phys. Pol. A 2020, 137, 637–640. [Google Scholar] [CrossRef]
- Seemuang, N.; Slatter, T. Using Barkhausen noise to measure coating depth of coated high-speed steel. Int. J. Adv. Manuf. Technol. 2017, 92, 247–258. [Google Scholar] [CrossRef] [Green Version]
- Deng, Y.; Li, Z.; Chen, J.; Qi, X. The effect of the structure characteristics on Magnetic Barkhausen noise in commercial steels. J. Magn. Magn. Mater. 2018, 451, 276–282. [Google Scholar] [CrossRef]
- Varga, R. Domain Walls and Their Dynamics, 1st ed.; Pavol Jozef Šafárik University: Košice, Slovakia, 2014. [Google Scholar]
- Amiri, M.S.; Thielen, M.; Rabung, M.; Marx, M.; Szielasko, K.; Boller, C. On the role of crystal and stress anisotropy in magnetic Barkhausen noise. J. Magn. Magn. Mater. 2014, 372, 16–22. [Google Scholar] [CrossRef]
- Cullity, B.D.; Graham, C.D. Introduction to the Magnetic Materials, 2nd ed.; IEEE Press: Piscataway, NJ, USA, 2009. [Google Scholar]
- Hilzinger, R.; Rodewald, W. Magnetic Materials: Fundamentals, Products, Properties, Applications, 1st ed.; Vacuumschmelze GmbH & Co. KG: Hanau, Germany, 2013. [Google Scholar]


| Fe | C | Mn | Si | P | S | Cr | Ni | Cu | V | Mo |
|---|---|---|---|---|---|---|---|---|---|---|
| Balance | 1.060 | 0.361 | 0.408 | 0.029 | 0.068 | 0.128 | 0.048 | 0.184 | 0.005 | <0.001 |
| Wire | Position 1 | Position 2 | Position 3 | Position 4 |
|---|---|---|---|---|
| Conventional | 497 ± 8 | 489 ± 7 | 503 ± 10 | 495 ± 10 |
| Phosphated | 455 ± 9 | 468 ± 8 | 461 ± 12 | 455 ± 9 |
| Galvanized | 522 ± 11 | 512 ± 12 | 505 ± 8 | 489 ± 13 |
| Compacted | 539 ± 13 | 498 ± 8 | 514 ± 4 | 489 ± 6 |
| Wire | Position 1 | Position 2 | Position 3 | Position 4 |
|---|---|---|---|---|
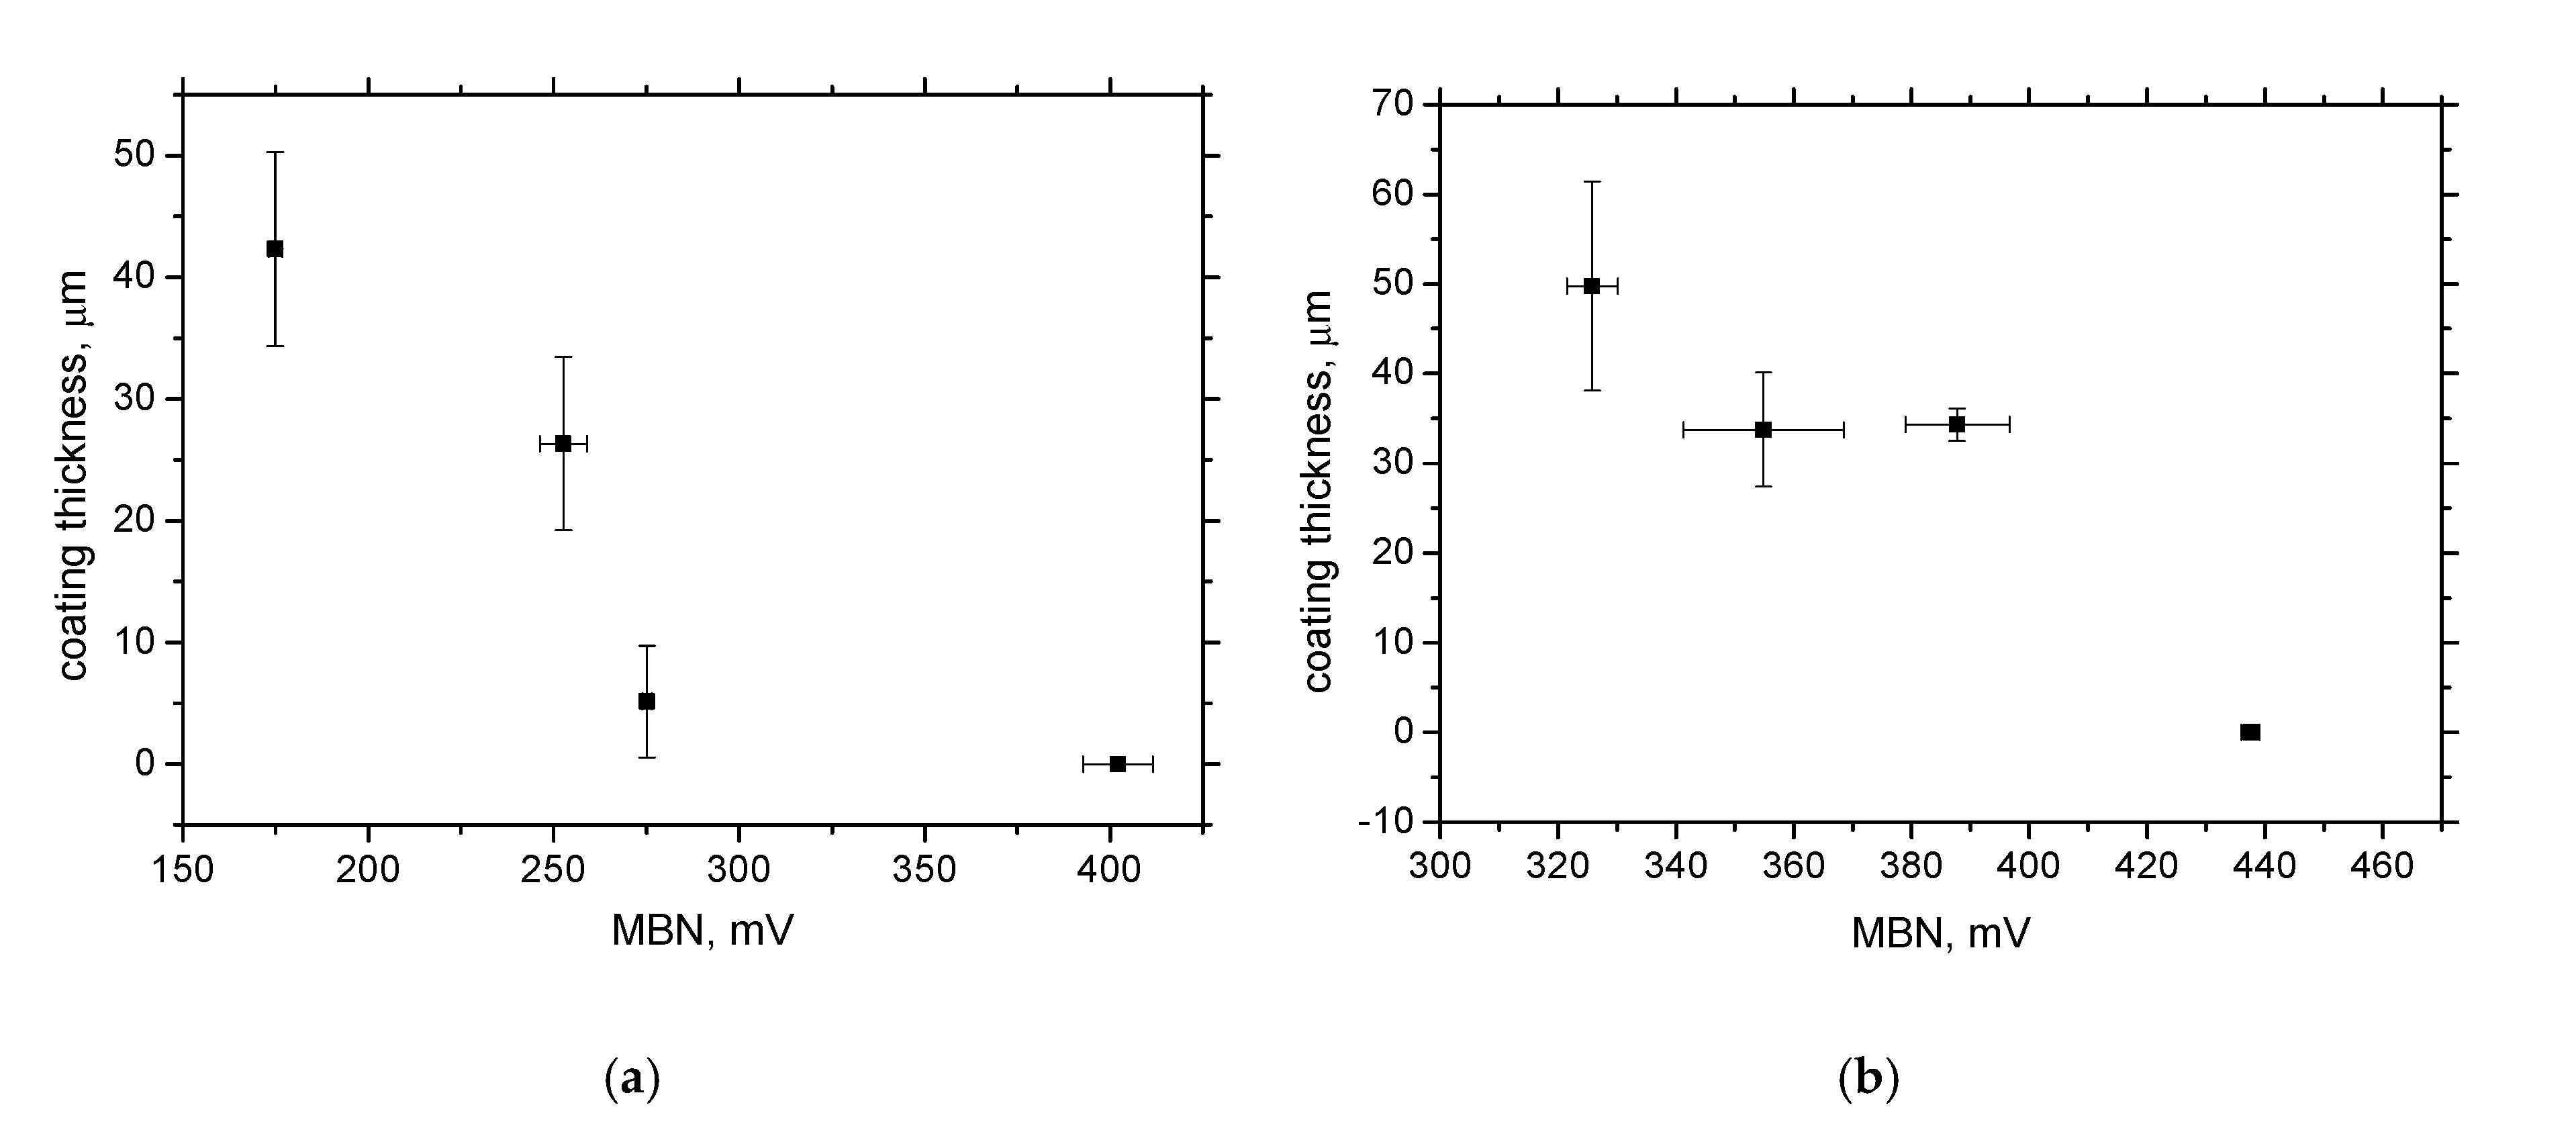
| Galvanized | 0 ± 0 | 5.8 ± 3.5 | 26.3 ± 7.0 | 42.3 ± 7.9 |
| Compacted | 0 ± 0 | 35.3 ± 1.2 | 33.7 ± 6.3 | 49.7 ± 11.6 |
© 2020 by the authors. Licensee MDPI, Basel, Switzerland. This article is an open access article distributed under the terms and conditions of the Creative Commons Attribution (CC BY) license (http://creativecommons.org/licenses/by/4.0/).
Share and Cite
Krkoška, L.; Moravčík, M.; Zgútová, K.; Neslušan, M.; Uhričík, M.; Bahleda, F.; Pitoňák, M. Investigation of Barkhausen Noise Emission in Steel Wires Subjected to Different Surface Treatments. Coatings 2020, 10, 912. https://doi.org/10.3390/coatings10100912
Krkoška L, Moravčík M, Zgútová K, Neslušan M, Uhričík M, Bahleda F, Pitoňák M. Investigation of Barkhausen Noise Emission in Steel Wires Subjected to Different Surface Treatments. Coatings. 2020; 10(10):912. https://doi.org/10.3390/coatings10100912
Chicago/Turabian StyleKrkoška, Lukáš, Martin Moravčík, Katarína Zgútová, Miroslav Neslušan, Milan Uhričík, František Bahleda, and Martin Pitoňák. 2020. "Investigation of Barkhausen Noise Emission in Steel Wires Subjected to Different Surface Treatments" Coatings 10, no. 10: 912. https://doi.org/10.3390/coatings10100912
APA StyleKrkoška, L., Moravčík, M., Zgútová, K., Neslušan, M., Uhričík, M., Bahleda, F., & Pitoňák, M. (2020). Investigation of Barkhausen Noise Emission in Steel Wires Subjected to Different Surface Treatments. Coatings, 10(10), 912. https://doi.org/10.3390/coatings10100912