Article

Investigation of Photoelastic Property and Stress Analysis for Optical Polyimide Membrane through Stress Birefringence Method

1
Institute of Optics and Electronics, Chinese Academy of Sciences, Chengdu 610209, China
2
University of Chinese Academy of Sciences, Beijing 100049, China
*
Author to whom correspondence should be addressed.
Coatings 2020, 10(1), 56; https://doi.org/10.3390/coatings10010056
Submission received: 18 November 2019 / Revised: 2 January 2020 / Accepted: 7 January 2020 / Published: 9 January 2020

Abstract

:
Optical polyimide (PI) membranes have been increasingly attractive in optoelectronic substrate and optical element material applications. Controlled stress distribution is very important to optical PI membrane-based optics. However, nondestructive absolute stress measurement inside optical PI membranes remains challenging. In this letter, we adopted the stress birefringence method to experimentally investigate the correlation between stress and retardation in uniaxially, biaxially, and circularly stretched PI membranes. The calculated value of the photoelastic coefficient was found to be around 400 nm/Mpa·cm. A theoretical model was established where the retardation angle is the negative arctan of the principal stress ratio in the biaxially stretched membrane. We also found that the average retardation angle is an important parameter for evaluating the uniformity of stretching force in the circularly stretched membrane. This work provides a better understanding of the stress birefringence measurement of membrane materials.

1. Introduction

Polyimide (PI) membranes have been increasingly attractive in optoelectronic substrate and optical element material applications due to their light weight, good mechanical and chemical stability, and optical transparency [1,2,3,4]. Due to its flexible nature, PI membranes need to be stretched and fixed to have good surface flatness, which is crucial in optical applications. The stress and its distribution in such PI membrane-based devices play an important role in affecting surface figure and device performance [5,6,7,8,9,10]. The optical PI membrane is a promising isotropic material for large-aperture-membrane diffractive lenses applied in next-generation space telescopes [11]. Recent research on transmissive diffractive membrane optics for large lightweight optical telescopes showed that the PI membrane easily deformed in-plane, resulting in failure of accurate light focusing [12,13]. The deformation of the PI membrane is accompanied by stress distribution variation, but it is difficult to quantitatively investigate how stress distribution changes during this process without inflicting damage [14,15,16]. Birefringence, or the double refraction of light, is a natural phenomenon of many crystals and anisotropic materials such as calcite and mica. Isotropic materials such as fused silica and optical polyimide have a uniform index of refraction in all directions and do not exhibit native birefringence. However, when mechanical stress is applied to isotropic materials, residual birefringence is generated. This birefringence is linearly proportional to the stress inside the material. If the material thickness and photoelastic coefficient of the material are known, the birefringence can be used to calculate the residual stress. It is important to notice that the birefringence value is proportional to the primary stress difference and, thus, the birefringence value corresponds to the anisotropy of inner stress. Stress birefringence measurement is an effective method to reflect the inner stress of a transparent isotropic material, and many researchers have investigated stress distribution based on the method [17,18,19,20]. Birefringence can be observed and measured in many ways. Extremely high levels of birefringence can be observed with the naked eye. A polariscope is used to qualitatively observe a large magnitude of birefringence by observing the color shifts and understanding its relationship with birefringence. This technique is generally subjective and relies on the trained observation skills of the individual operator. The photoelastic-modulator (PEM)-based stress birefringence measurement system is one of the quantitative techniques to measure birefringence magnitude and slow axis orientation. Kemp reviewed the PEM-based methodology on a theoretical level [21,22]. The method has been applied to study anisotropic polymers, and the retardation angle determination method was mentioned [23]. However, existing methods of stress birefringence measurement only work out the difference of principal stresses, not the absolute values of each principal stress. In this letter, we adopted the birefringence method to investigate the photoelastic property of optical PI membranes and put forward a novel method to determine the absolute value of individual principal stresses in a biaxially stretched PI membrane. We also found a way to evaluate the uniformity of the stretching force in a circularly stretched membrane. This work provides reference to the non-destructive stress measurement of optical membrane materials and provides a better understanding of optical PI membranes.

2. Materials and Methods

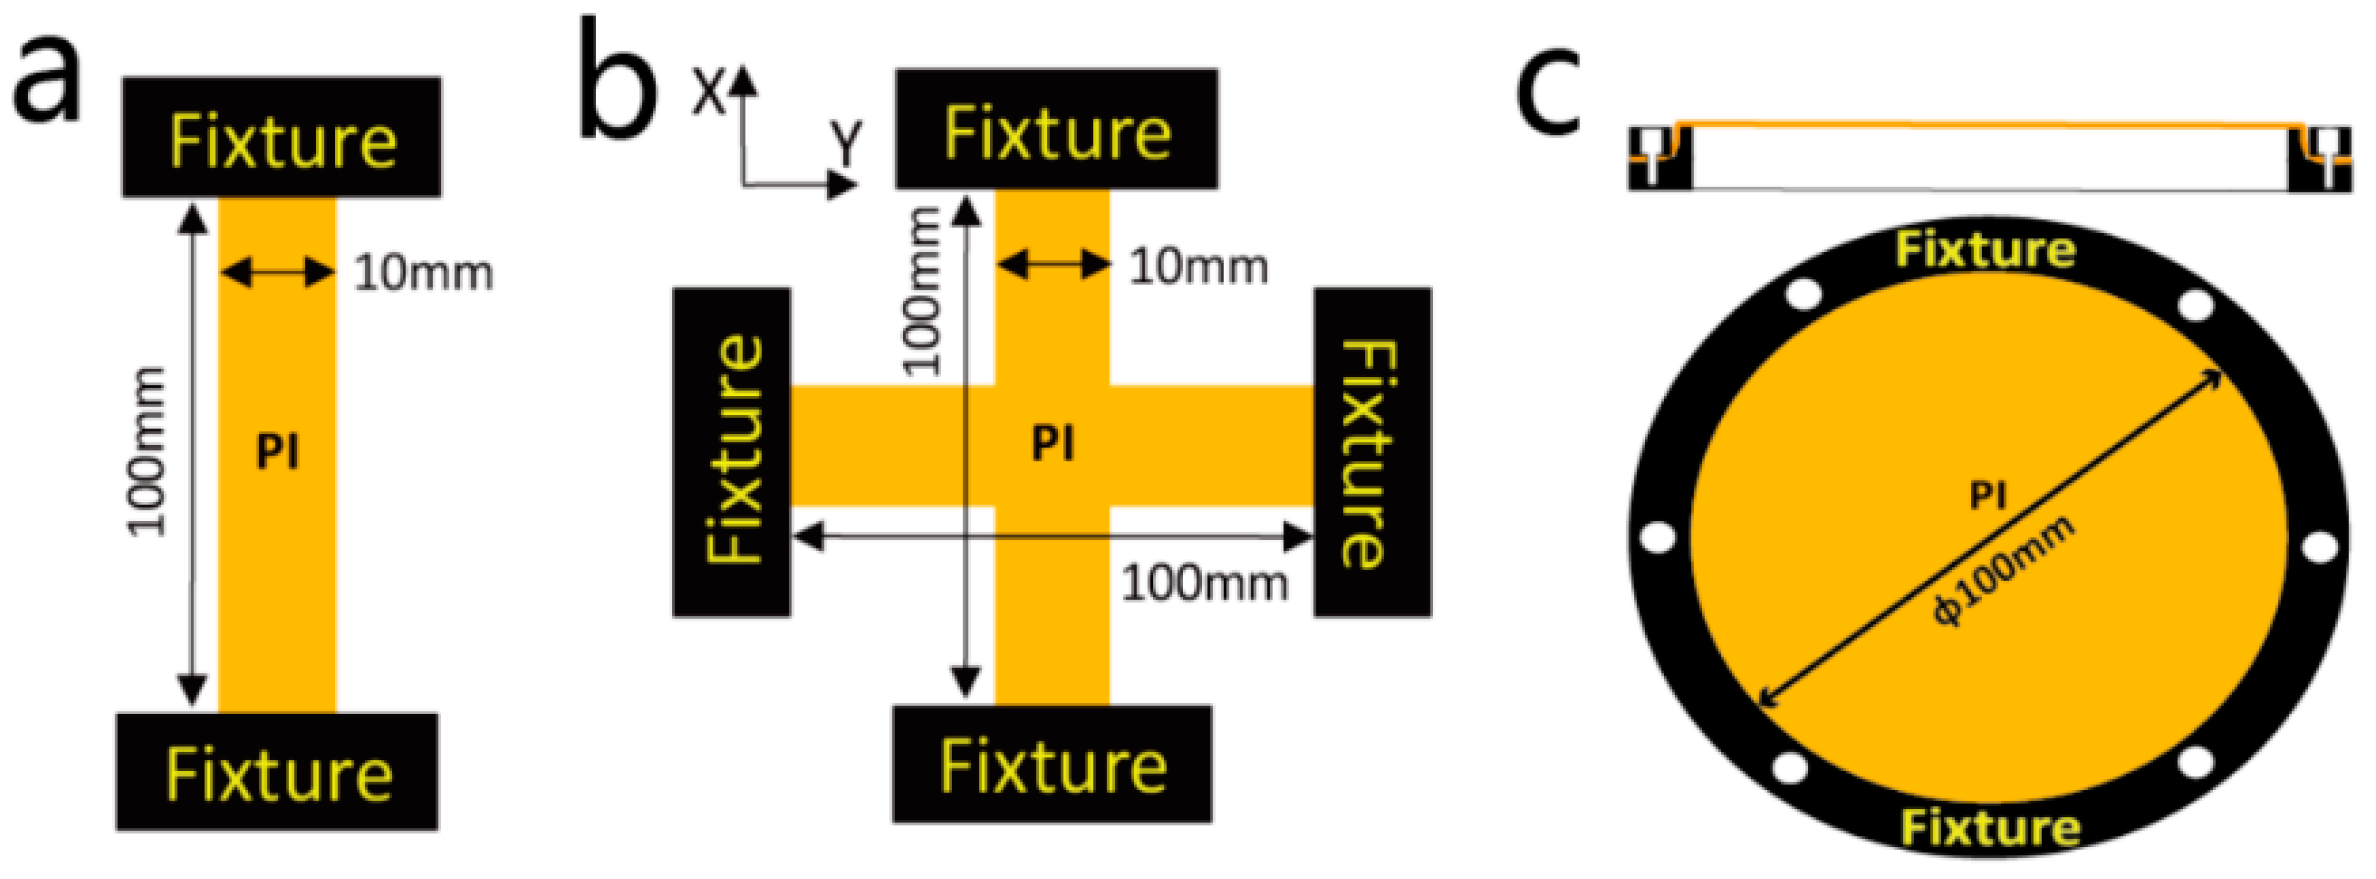
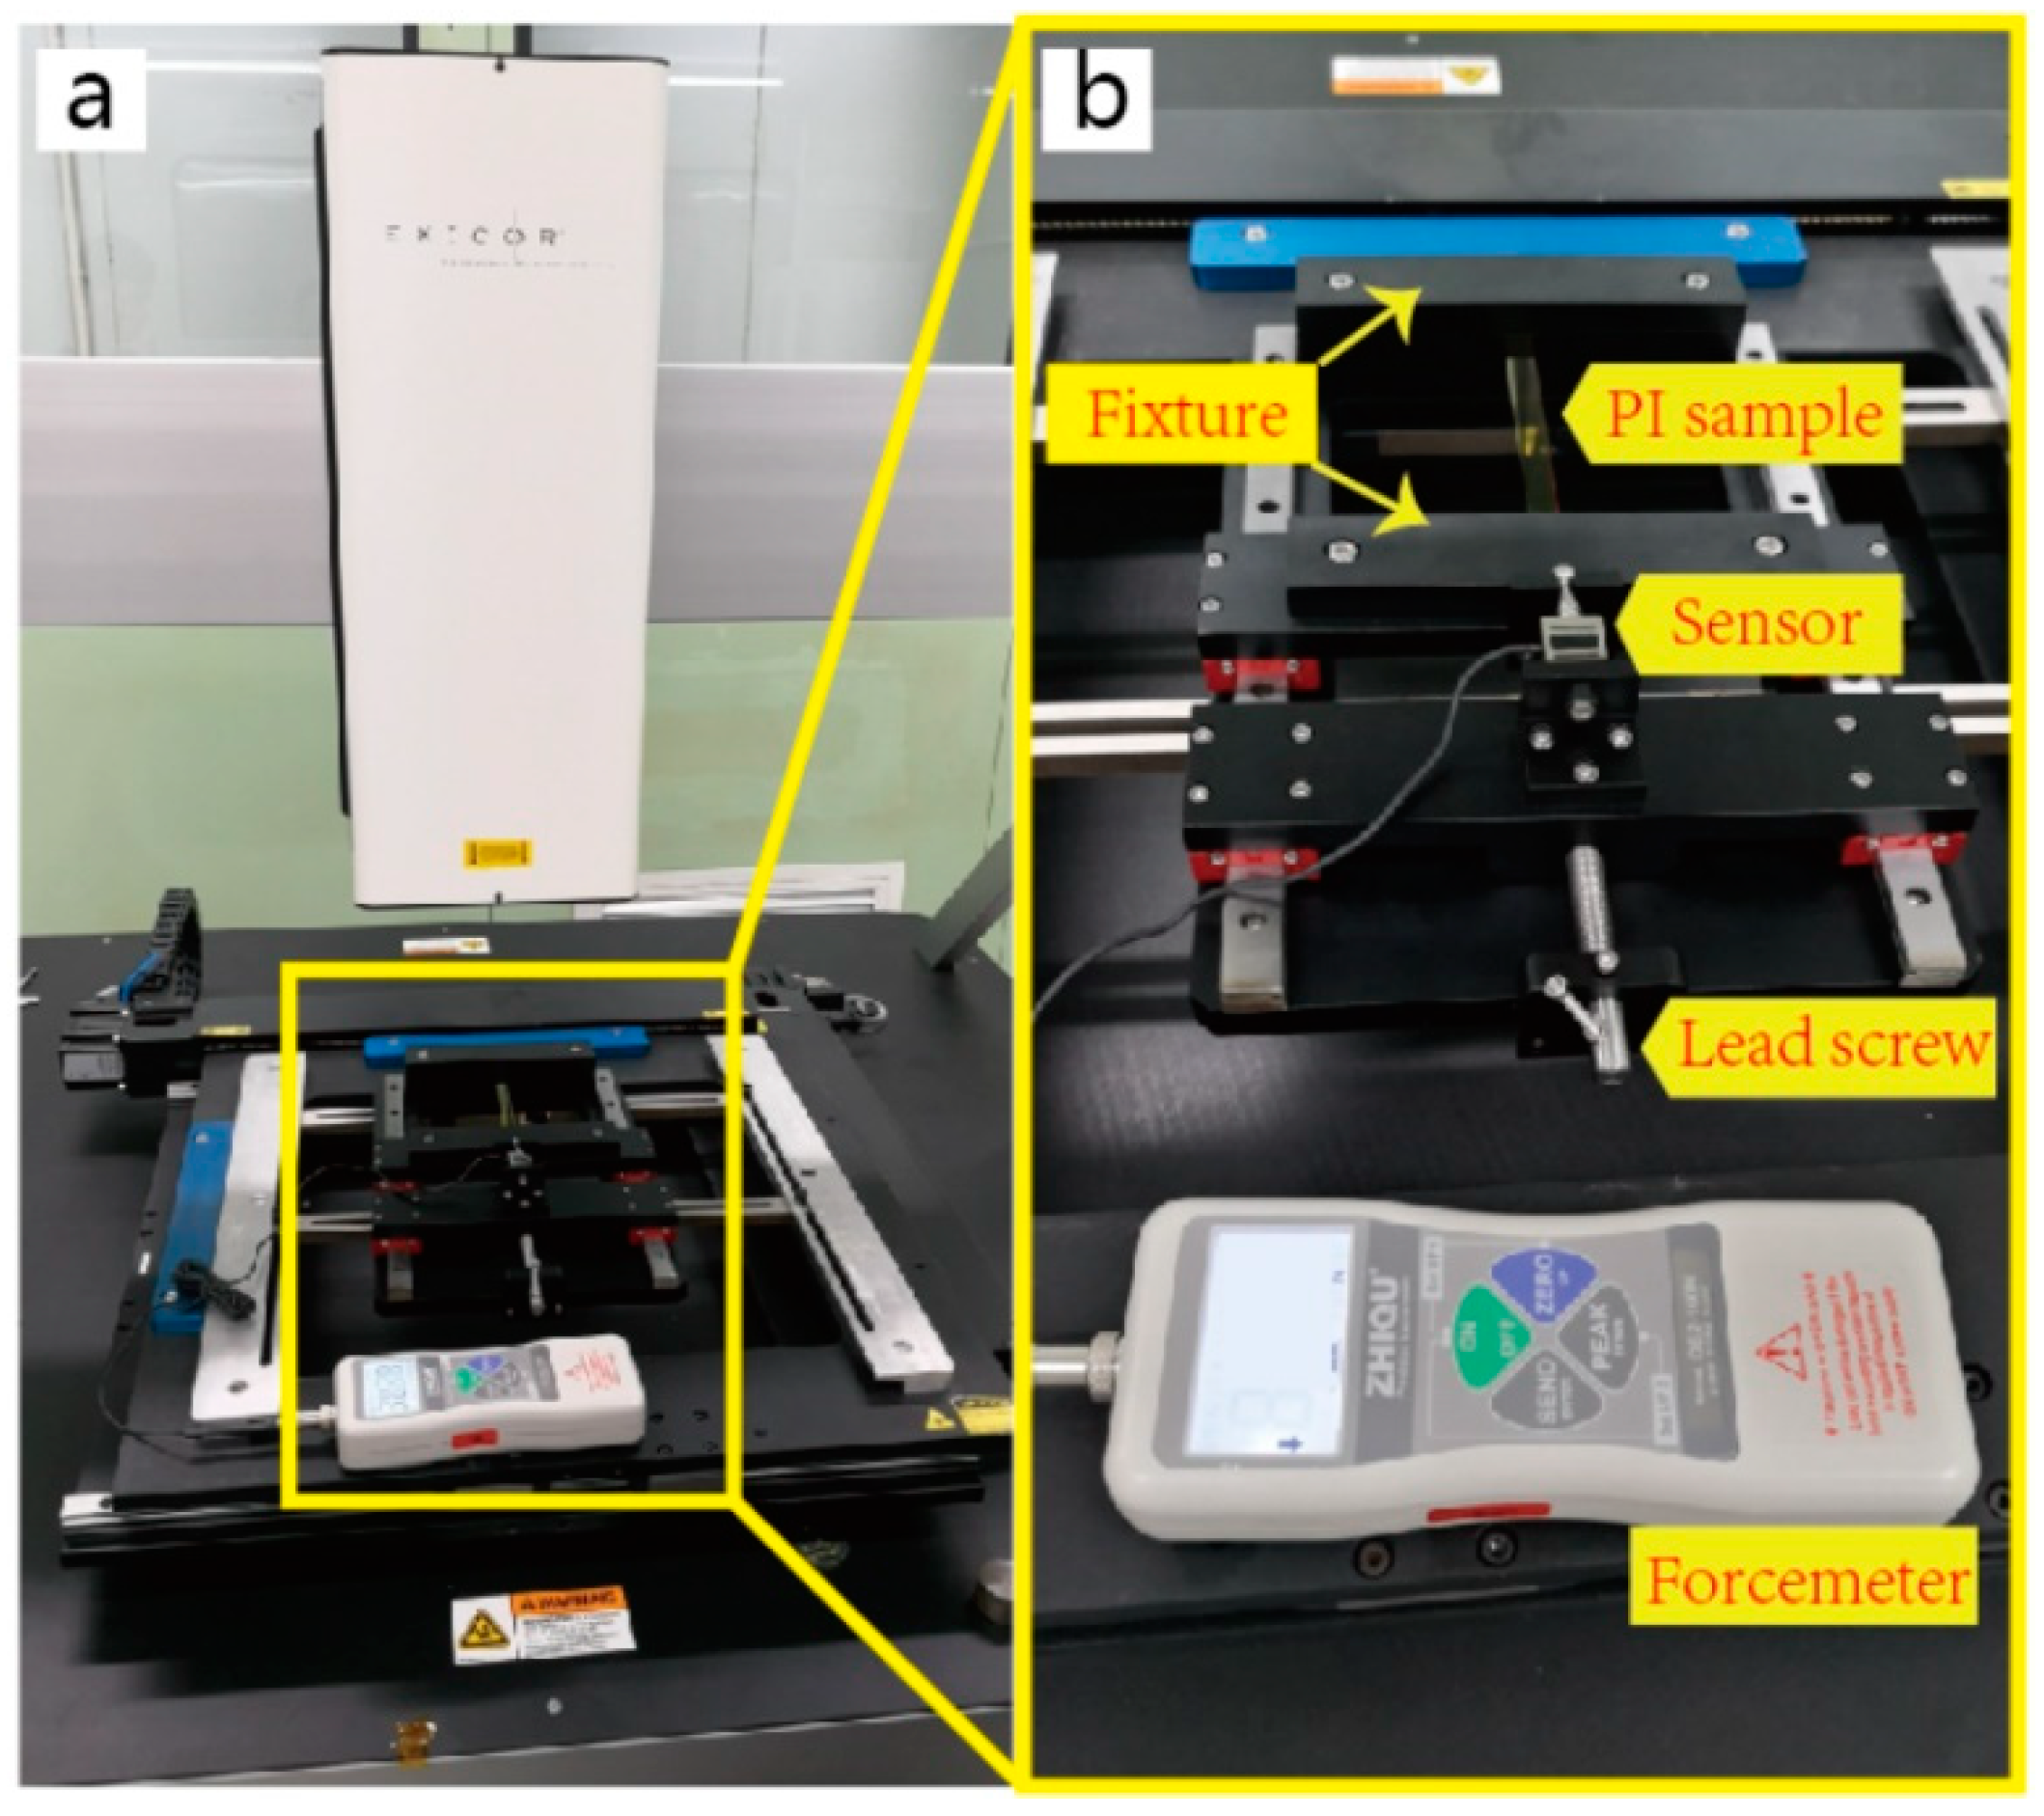
2.1. PI Membrane Sample Preparation

The monomers pyromellitic dianhydride (PMDA, 99.0%, purchased from Aladdin Reagent, Shanghai, China) and 2,2’-bis(trifluromethyl)benzidine (TFBZ, 98.0%, purchased from Aladdin Reagent, Shanghai, China) were used as received. Solvent dimethylacetamide (DMAc, AR, purchased from Southwest Chemical Reagents, Chengdu, China) was dehydrated and refined before use. The precursor polyamic acid (PAA) solution was synthesized by PMDA and TFBZ in DMAc with 10 wt.% solid concentration. Then, PAA thin films were spin-coated on a 15.24 cm (6 inch) fused silica substrate using a AC300-CTM spin coater (Lebo Scientific Instrument, Wuxi, China) at 2000 rpm for 2 min. Subsequent pre-curing was carried out on a HP-500 hot plate (Lebo Scientific Instrument, Wuxi, China) at 90 °C for 15 min; then, final curing was performed in a DP23C vacuum oven (Yamato, Chongqing, China) at 350 °C for 1 h. The PI membrane samples were peeled off from the substrate after 4 rounds of spin coating, pre-curing, and the final curing process. The thickness of the resulting PI film was measured by an F20 thin-film analyzer (Filmetrics, Inc., San Diego, CA, USA). The PI sample for the uniaxial stretching test was 100 mm long and 10 mm wide, as shown in Figure 1a. The PI sample for the biaxial stretching test was cross-shaped with the geometric parameters, as shown in Figure 1b. The PI sample for the circular stretching test was circular with a 100 mm-diameter clear aperture, as shown in Figure 1c. All samples were about 25 microns in thickness.
In the uniaxial stretching test, the sample is fixed by two compression fixtures at both ends, and the stretching force is controlled through adjusting the distance between the two fixtures. In the biaxial stretching test, the sample is fixed by four compression fixtures in X and Y directions and each stretching force is controlled in the same way as the uniaxial stretching test. In the circular stretching test, the sample is clamped between an upper ring fixture and lower ring fixture, and the stretching force is controlled by the distance between the two fixtures. When the upper fixture is removed, the stretching force is believed to be zero and the sample is in the free state. When the upper fixture is placed on the surface of the sample, the stretching force is assumed to be the gravity of the upper fixture. When the upper fixture is pushed down to the lower fixture, the stretching force is increased to some extent. There are six circularly symmetric distributed screw holes on the fixtures, and screw connections can be applied to further increase the stretching force and assure firmness.

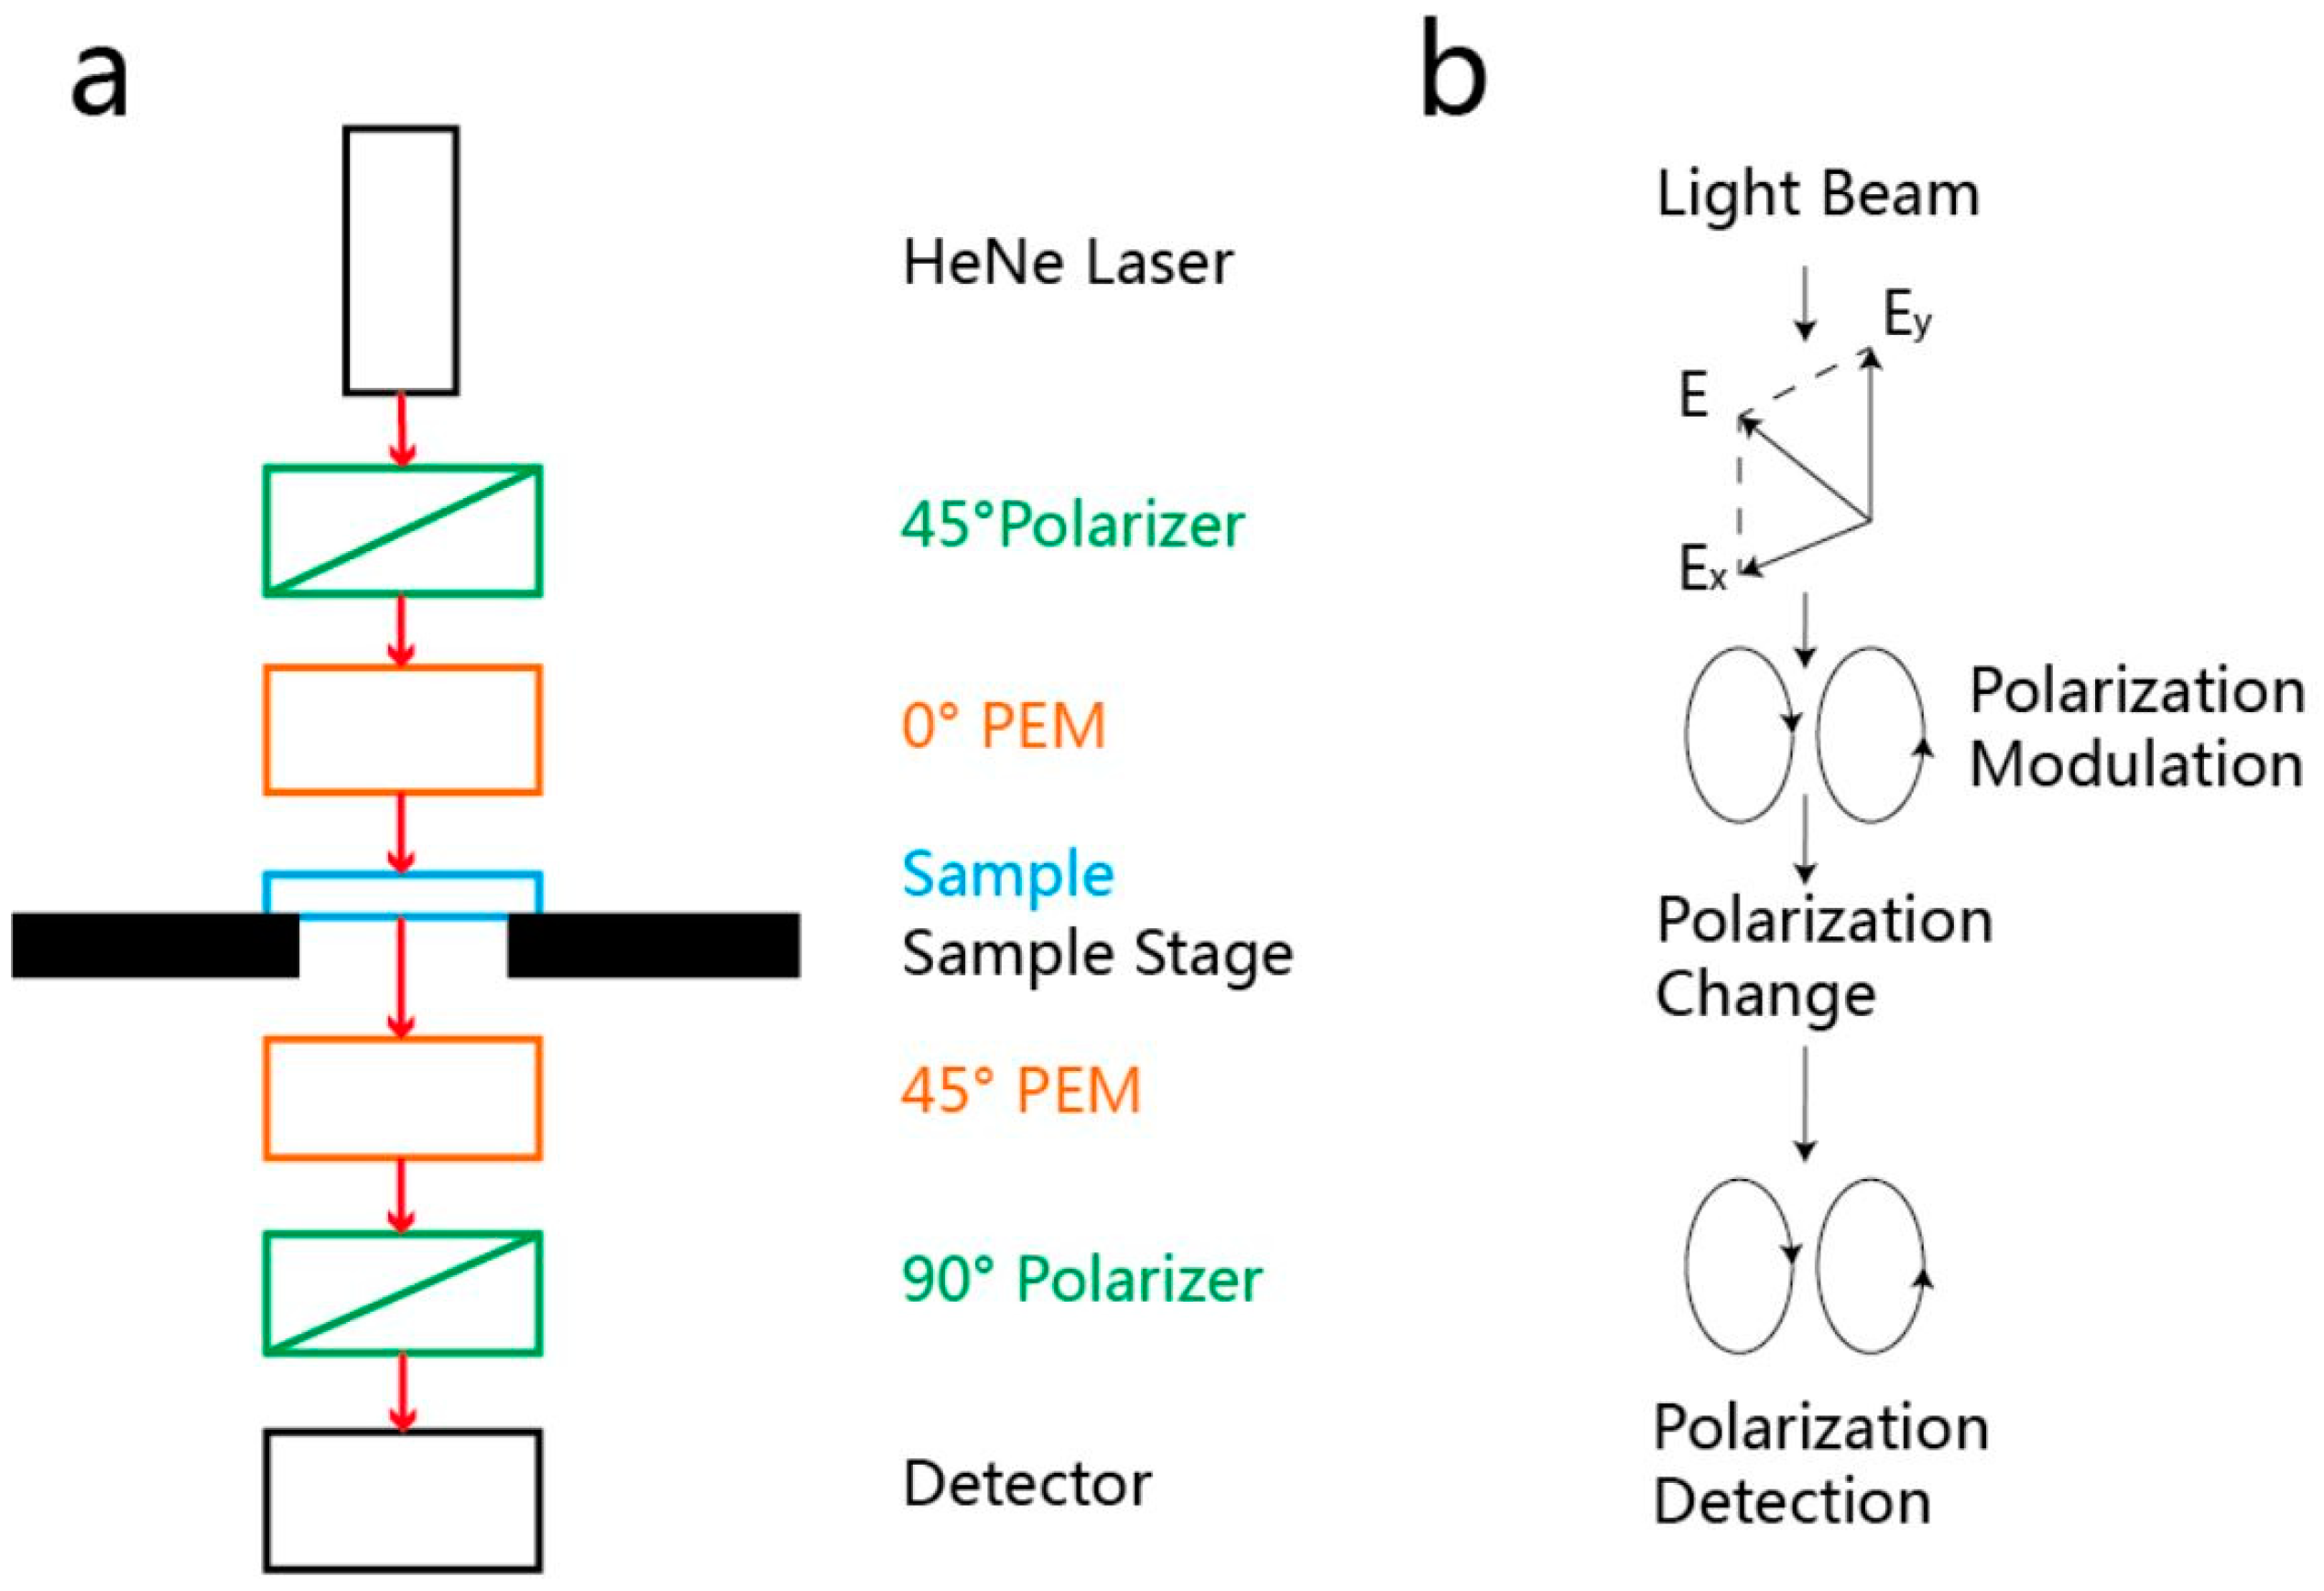
2.2. Birefringence Measurement

In the experiment, we adopted an Exicor 300AT (Hinds Instrument, Portland, OR, USA) as the fundamental platform, shown in Figure 2a, and a customized membrane stretching device, shown in Figure 2b, to apply a controlled stretching force. The membrane stretching device consists of five parts including fixtures, lead screws, the PI sample, force-meter, and sensor. One fixture is immobile at the far end and the other is mobile on the guideways. The force-sensor is connected to the mobile fixture, and the signal is collected in the force-meter through a data cable. We adjust the position and angle of the PI sample so that the membrane length direction (X direction) is in line with the lead screw; thus, the stretching force is applied in the X-direction. Then, we rotate the lead screw to increase the stretching force, with the real-time force displayed on the force meter, and measure the stress birefringence of the sample under various stretching forces.
The optical system of the Exicor 300AT for birefringence measurement is shown in Figure 3a, and the light polarization in each step is shown in Figure 3b. During the measurement, light with the wavelength of 632.8 nm generated by a He–Ne laser passes vertically through a 45° polarizer and 0° photoelastic modulator (PEM) and is incident on the sample. After transmission by the sample, the light beam passes through a 45° PEM and 90° polarizer, and is finally received by the detector. The 300AT system utilizes PEMs to modulate the polarization state of a light beam and advanced detection and demodulation electronics to measure how a sample has changed the polarization state. This results in the measurement of optical retardation. Birefringence and slow axis orientation can be evaluated from these data. The measurement area is set to cover the sample, and the scanning resolution is set to be 1 mm in diameter. Stress birefringence at each scanning point is recorded and the distribution of the retardation value and angle is displayed as a color map on the system software. The retardation measurement ranges from 0 to 300 nm with an accuracy better than 0.2 nm. The angle measurement accuracy is better than 0.5° ranging from −90° to 90°.

3. Results and Discussion

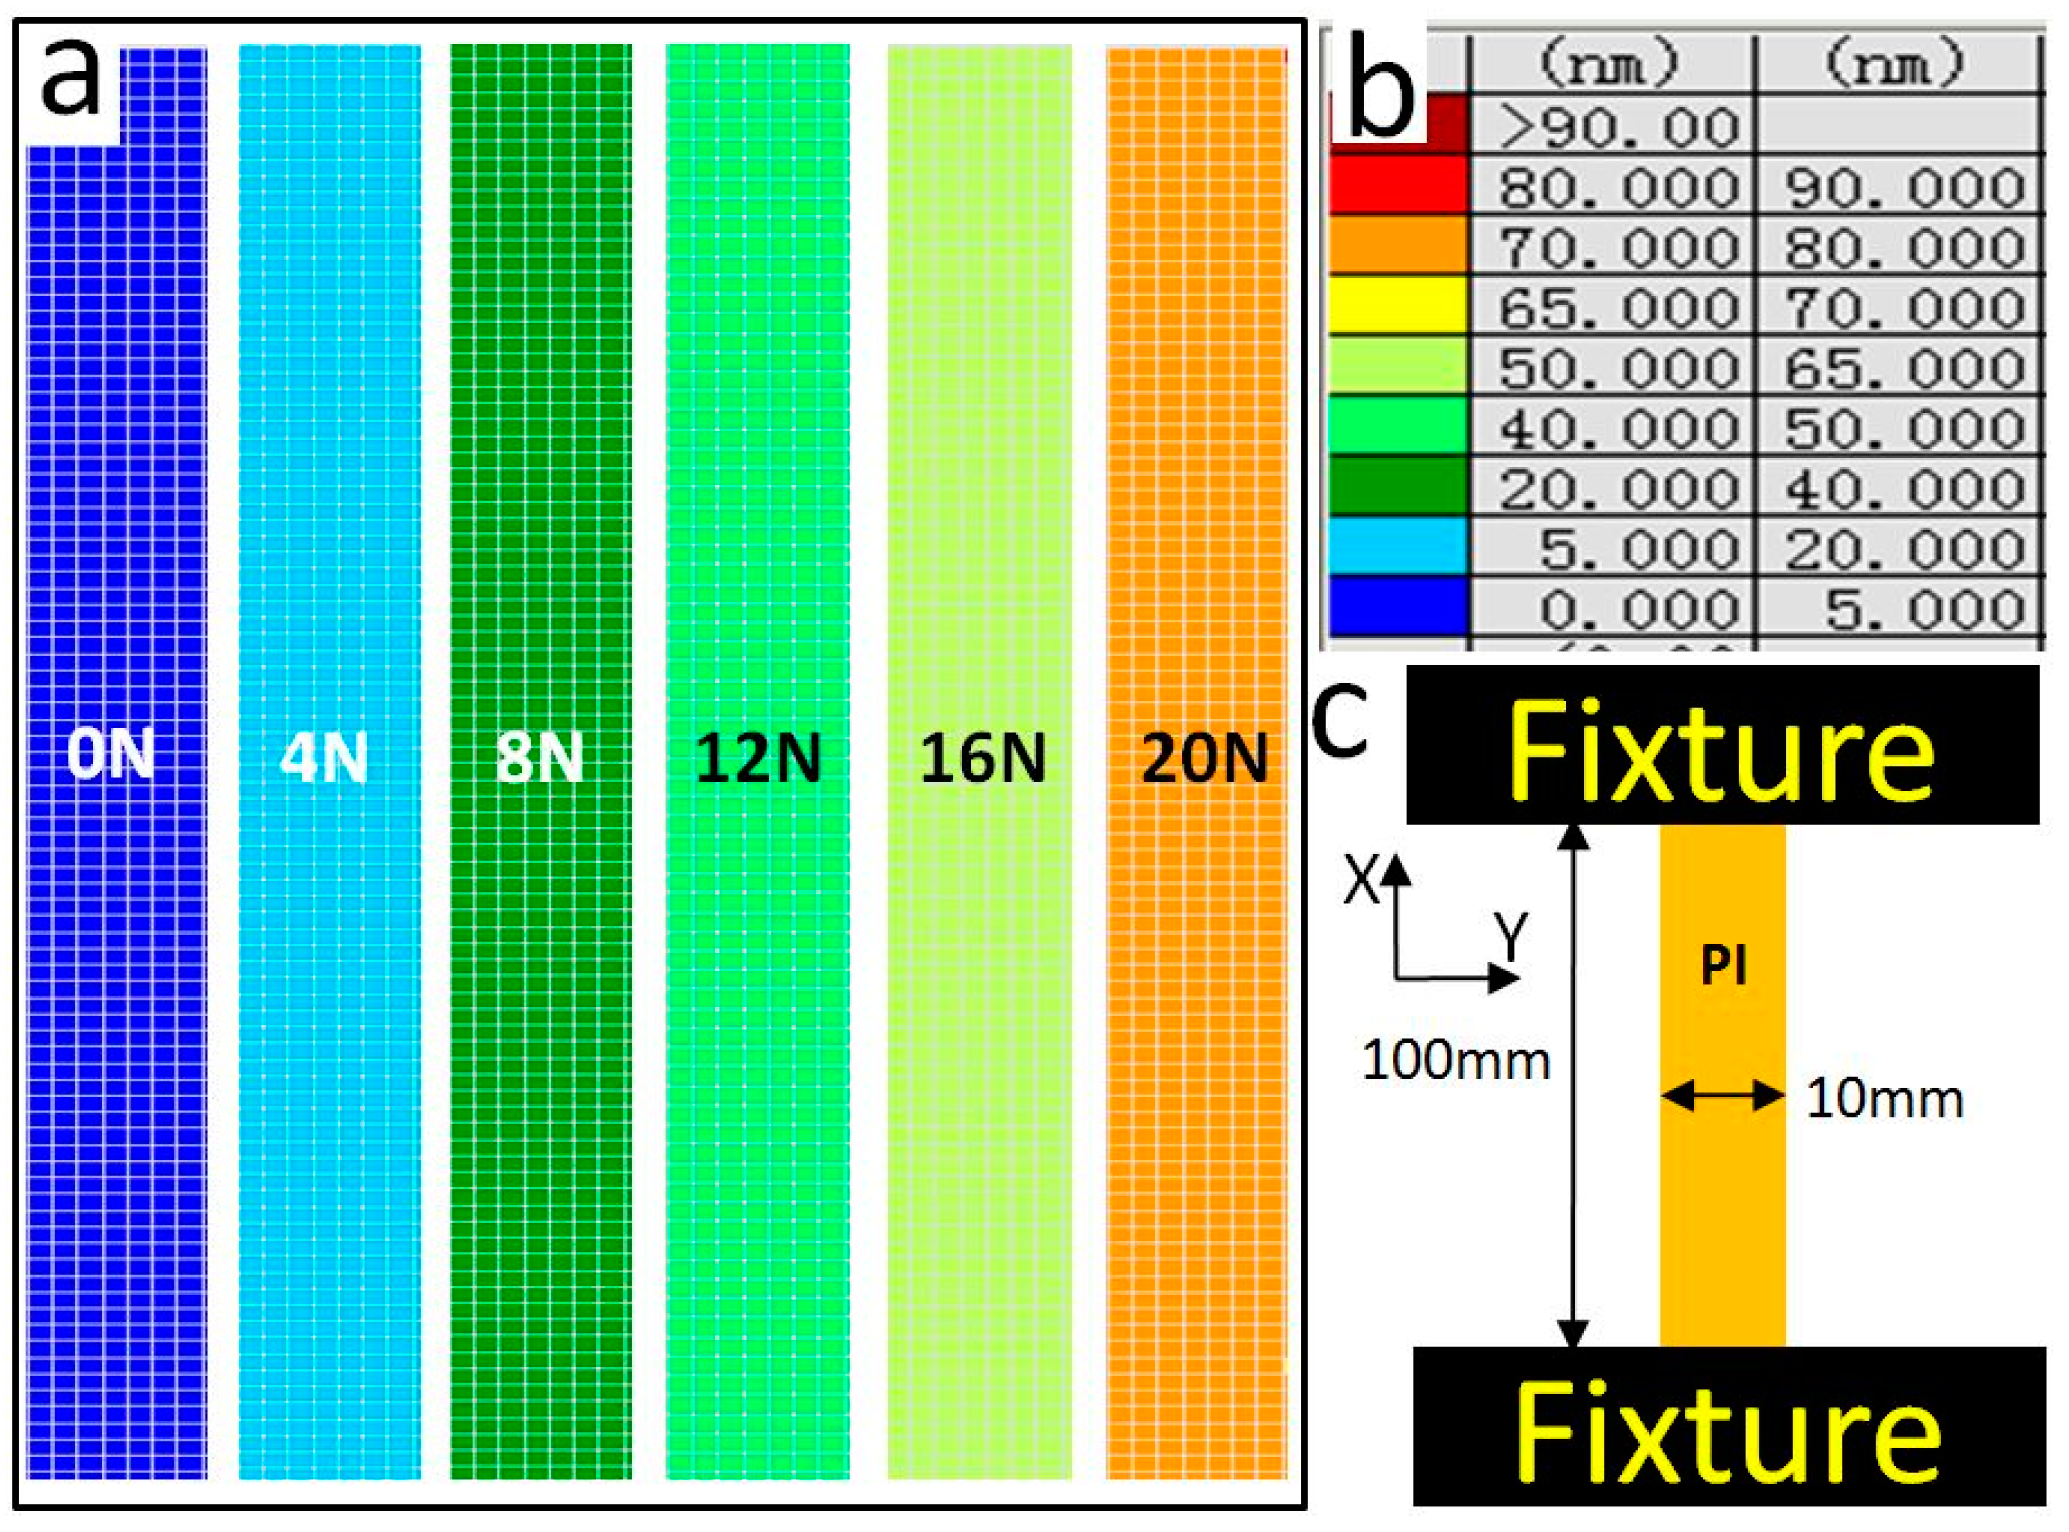
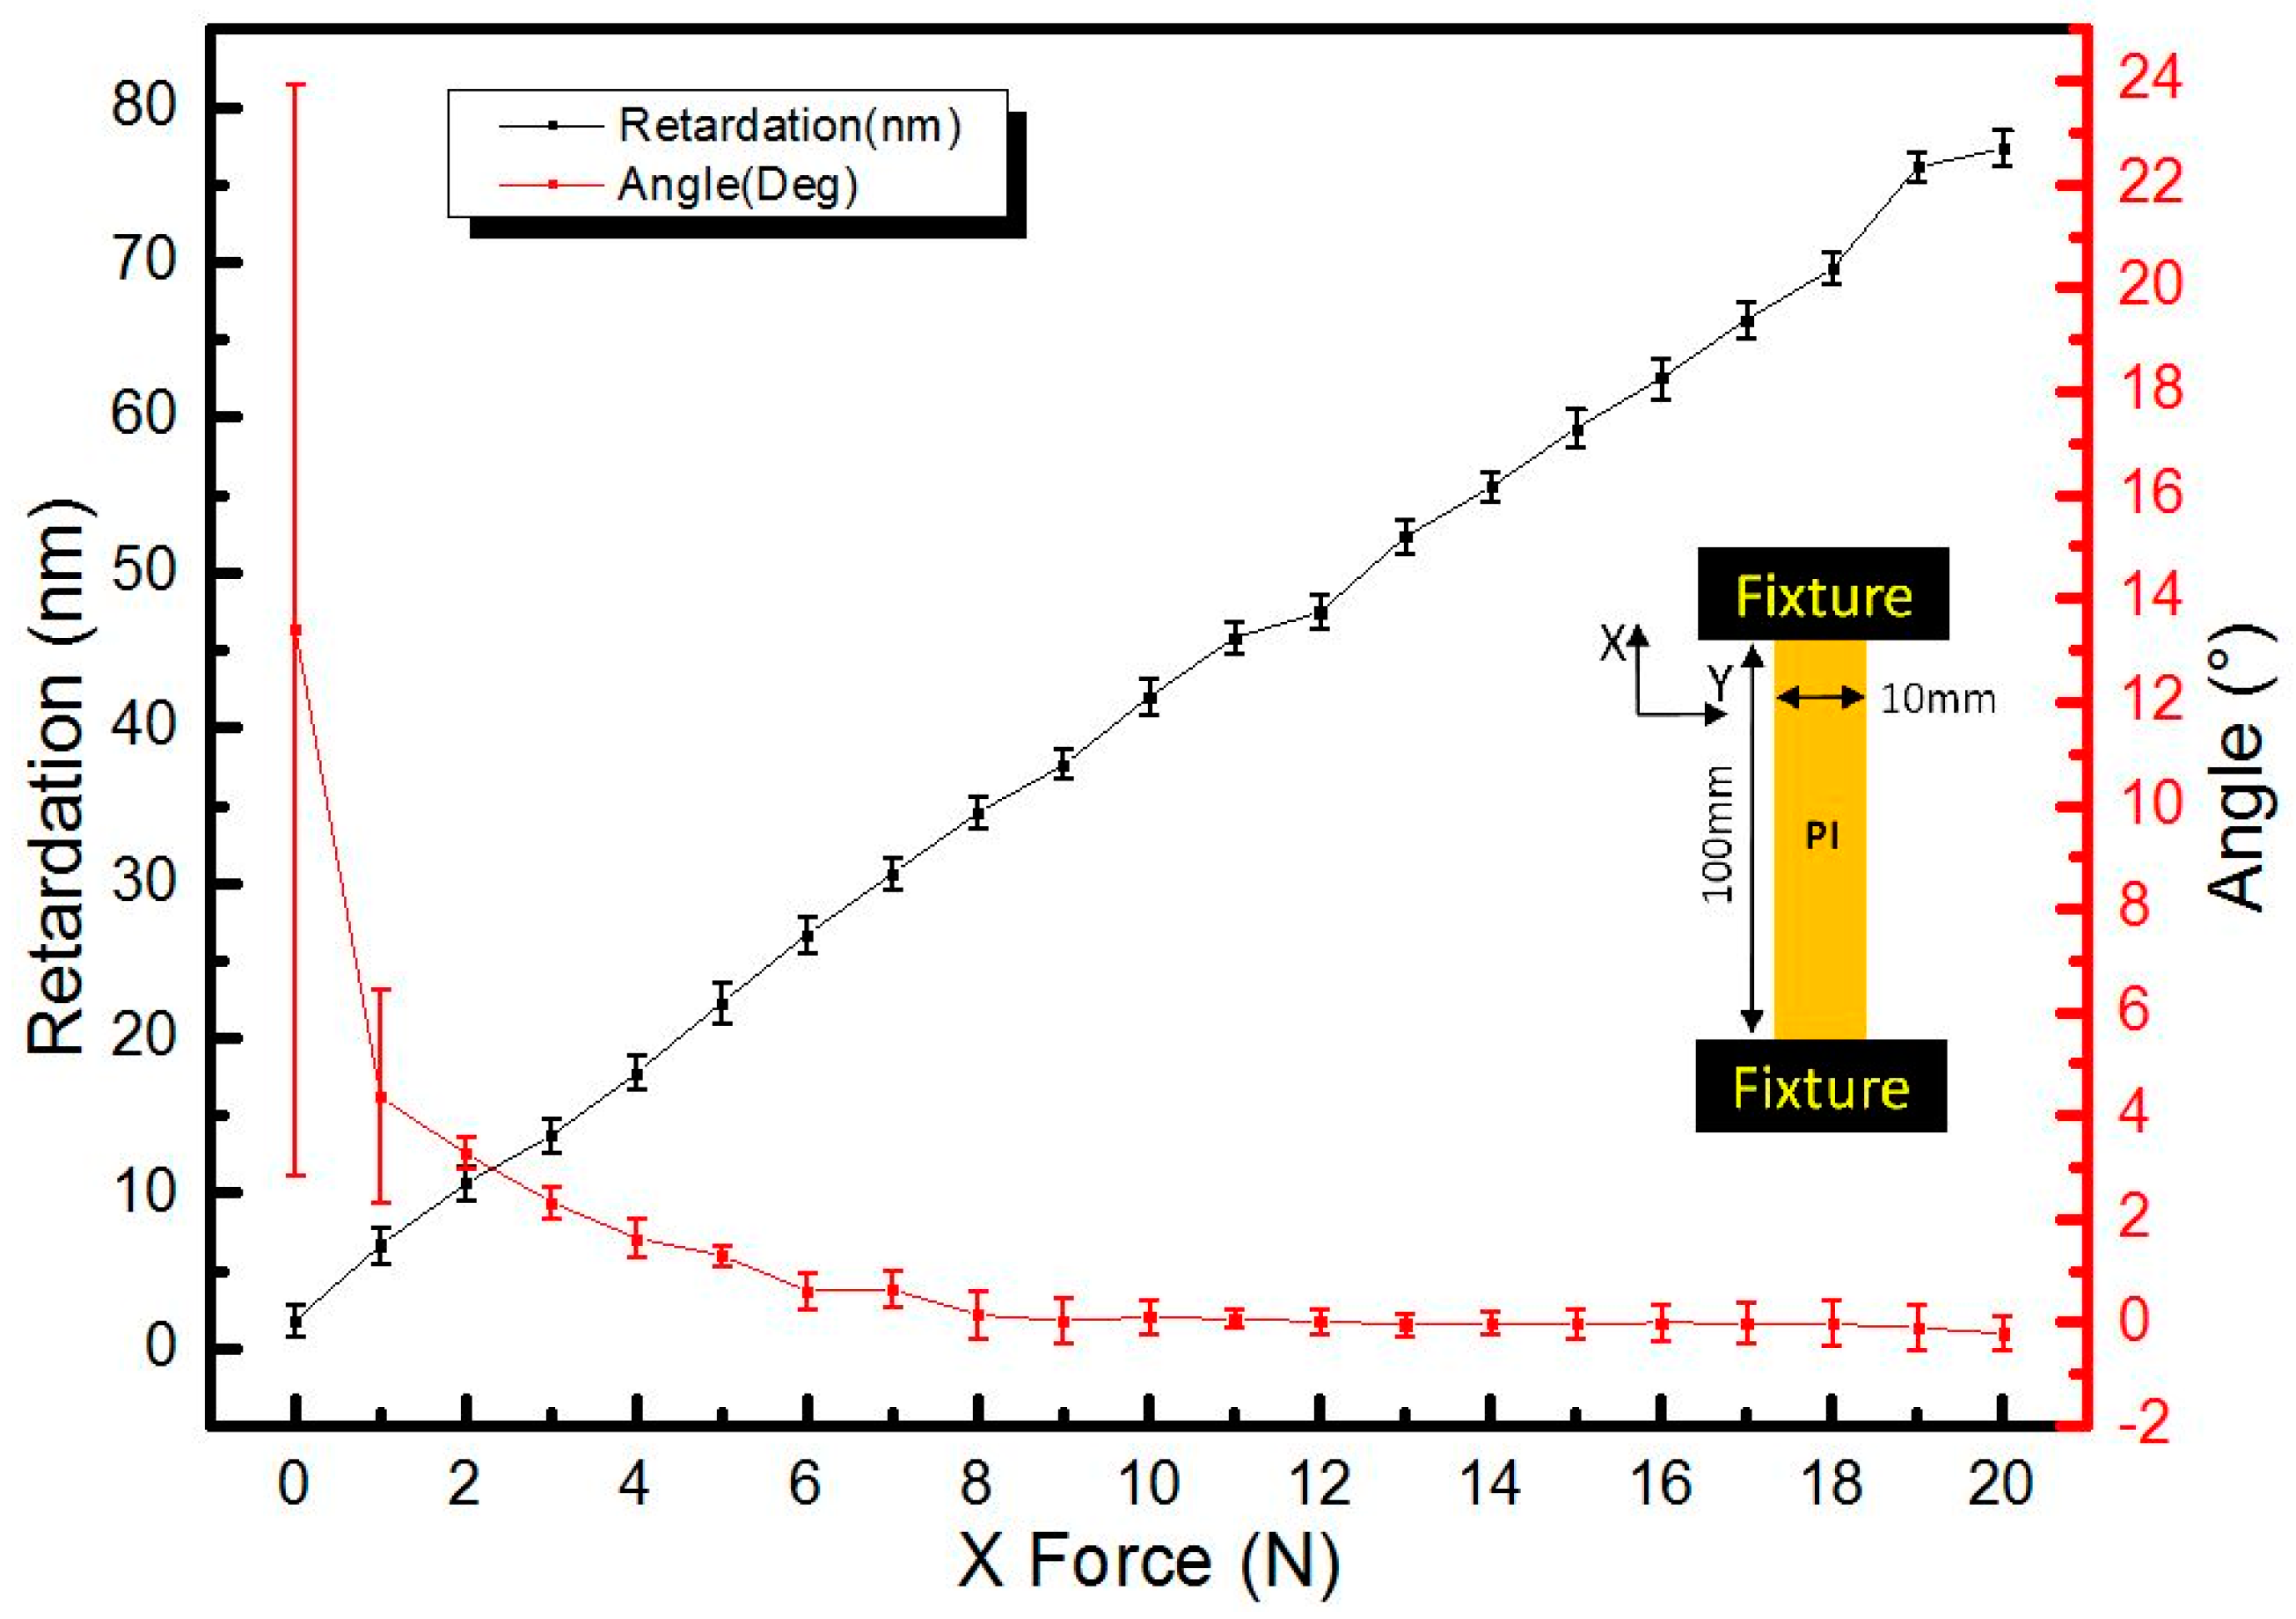
3.1. Uniaxial Stretching Test

In the uniaxial stretching test, results of stress birefringence in PI samples under various stretching forces are shown in Figure 4. Color maps of the retardation value distribution are shown in Figure 4a where the stretching force values are 0, 4, 8, 1, 16, and 20 N. The legend description of the color map is shown in Figure 4b where the first column shows different colors displayed in the color map, and the second and third column refer to the lower limit and upper limit of the retardation value, corresponding to each color. It is found that the retardation value increases with the stretching force.
The uniform color distribution also indicates a uniform retardation value distribution inside the PI sample. To accurately study how the retardation value and angle vary against stretching force, we recorded retardation values and angles of the same spot at different stretching forces, and the results are shown in Figure 5. The black line refers to the retardation value against the stretching force, and the red line stands for the retardation angle against the stretching force. It is found that the retardation value linearly increases with the stretching force, and retardation angle rapidly decreases initially and gradually approaches zero at higher stretching force. The retardation value equals the optical path difference between ordinary light and extraordinary light expressed in Equation (1), where R stands for the retardation value, no and ne refer to the refractive index of the sample passed by ordinary light and
R = | n o n e | × d
extraordinary light, respectively, and d represents the thickness of the sample. The birefringence (B) value is the retardation value per cm and is proportional to the principal stress difference expressed in Equation (2). B stands for the birefringence value, and σx and σy refer to the principal stresses in the X- and
B = | σ x σ y | × K
Y-directions, respectively. K represents the photoelastic coefficient. Due to the uniaxial stretching mode, the X- and Y-direction coincide with the stretching direction and perpendicular direction, respectively. The cross-sectional area of the PI sample is 2.5 × 10⁻⁷ m2; when the stretching force is 1 N, σx equals 4 MPa and σy equals 0 MPa.
It is found that the slope of the black line approximately equals 4 nm/N; thus, the photoelastic coefficient of the PI membrane (K) is calculated to be 400 nm/Mpa·cm. Besides, the retardation angle, namely, the angle between the slow axis and Y-direction, decreases sharply to less than 5° at a stretching force of 1 N and gradually approaches 0° at higher stretching force. The result indicates that light with the electric field (E) vector in the stretching direction transmits faster than its counterpart perpendicular to the stretching direction. The faster transmission of light with the E vector in the stretching direction corresponds to a lowered refractive index, and this is due to molecular orientation in the PI membrane and the decrease in linear density in the stretching direction. The retardation angle can be defined as the angle between the slow axis and Y-direction. The retardation angle varies from −90° to 90°. We will sufficiently investigate how retardation angle is determined in the biaxial stretching experiment.
Then, we focused on one spot at the initial stretching force of 28.6 N (stress is around 114 MPa) and monitored the variation against time. The result is plotted in Figure 6 in which the black line refers to the force variation and the red line represents the retardation value variation. It seems that the stress relaxation speed of the uniaxially stretched PI membrane reaches 0.5 MPa/s. We also notice that the black line almost overlaps with the red line, which indicates that the photoelastic coefficient of the PI membrane does not change with stretching force in the tested range.

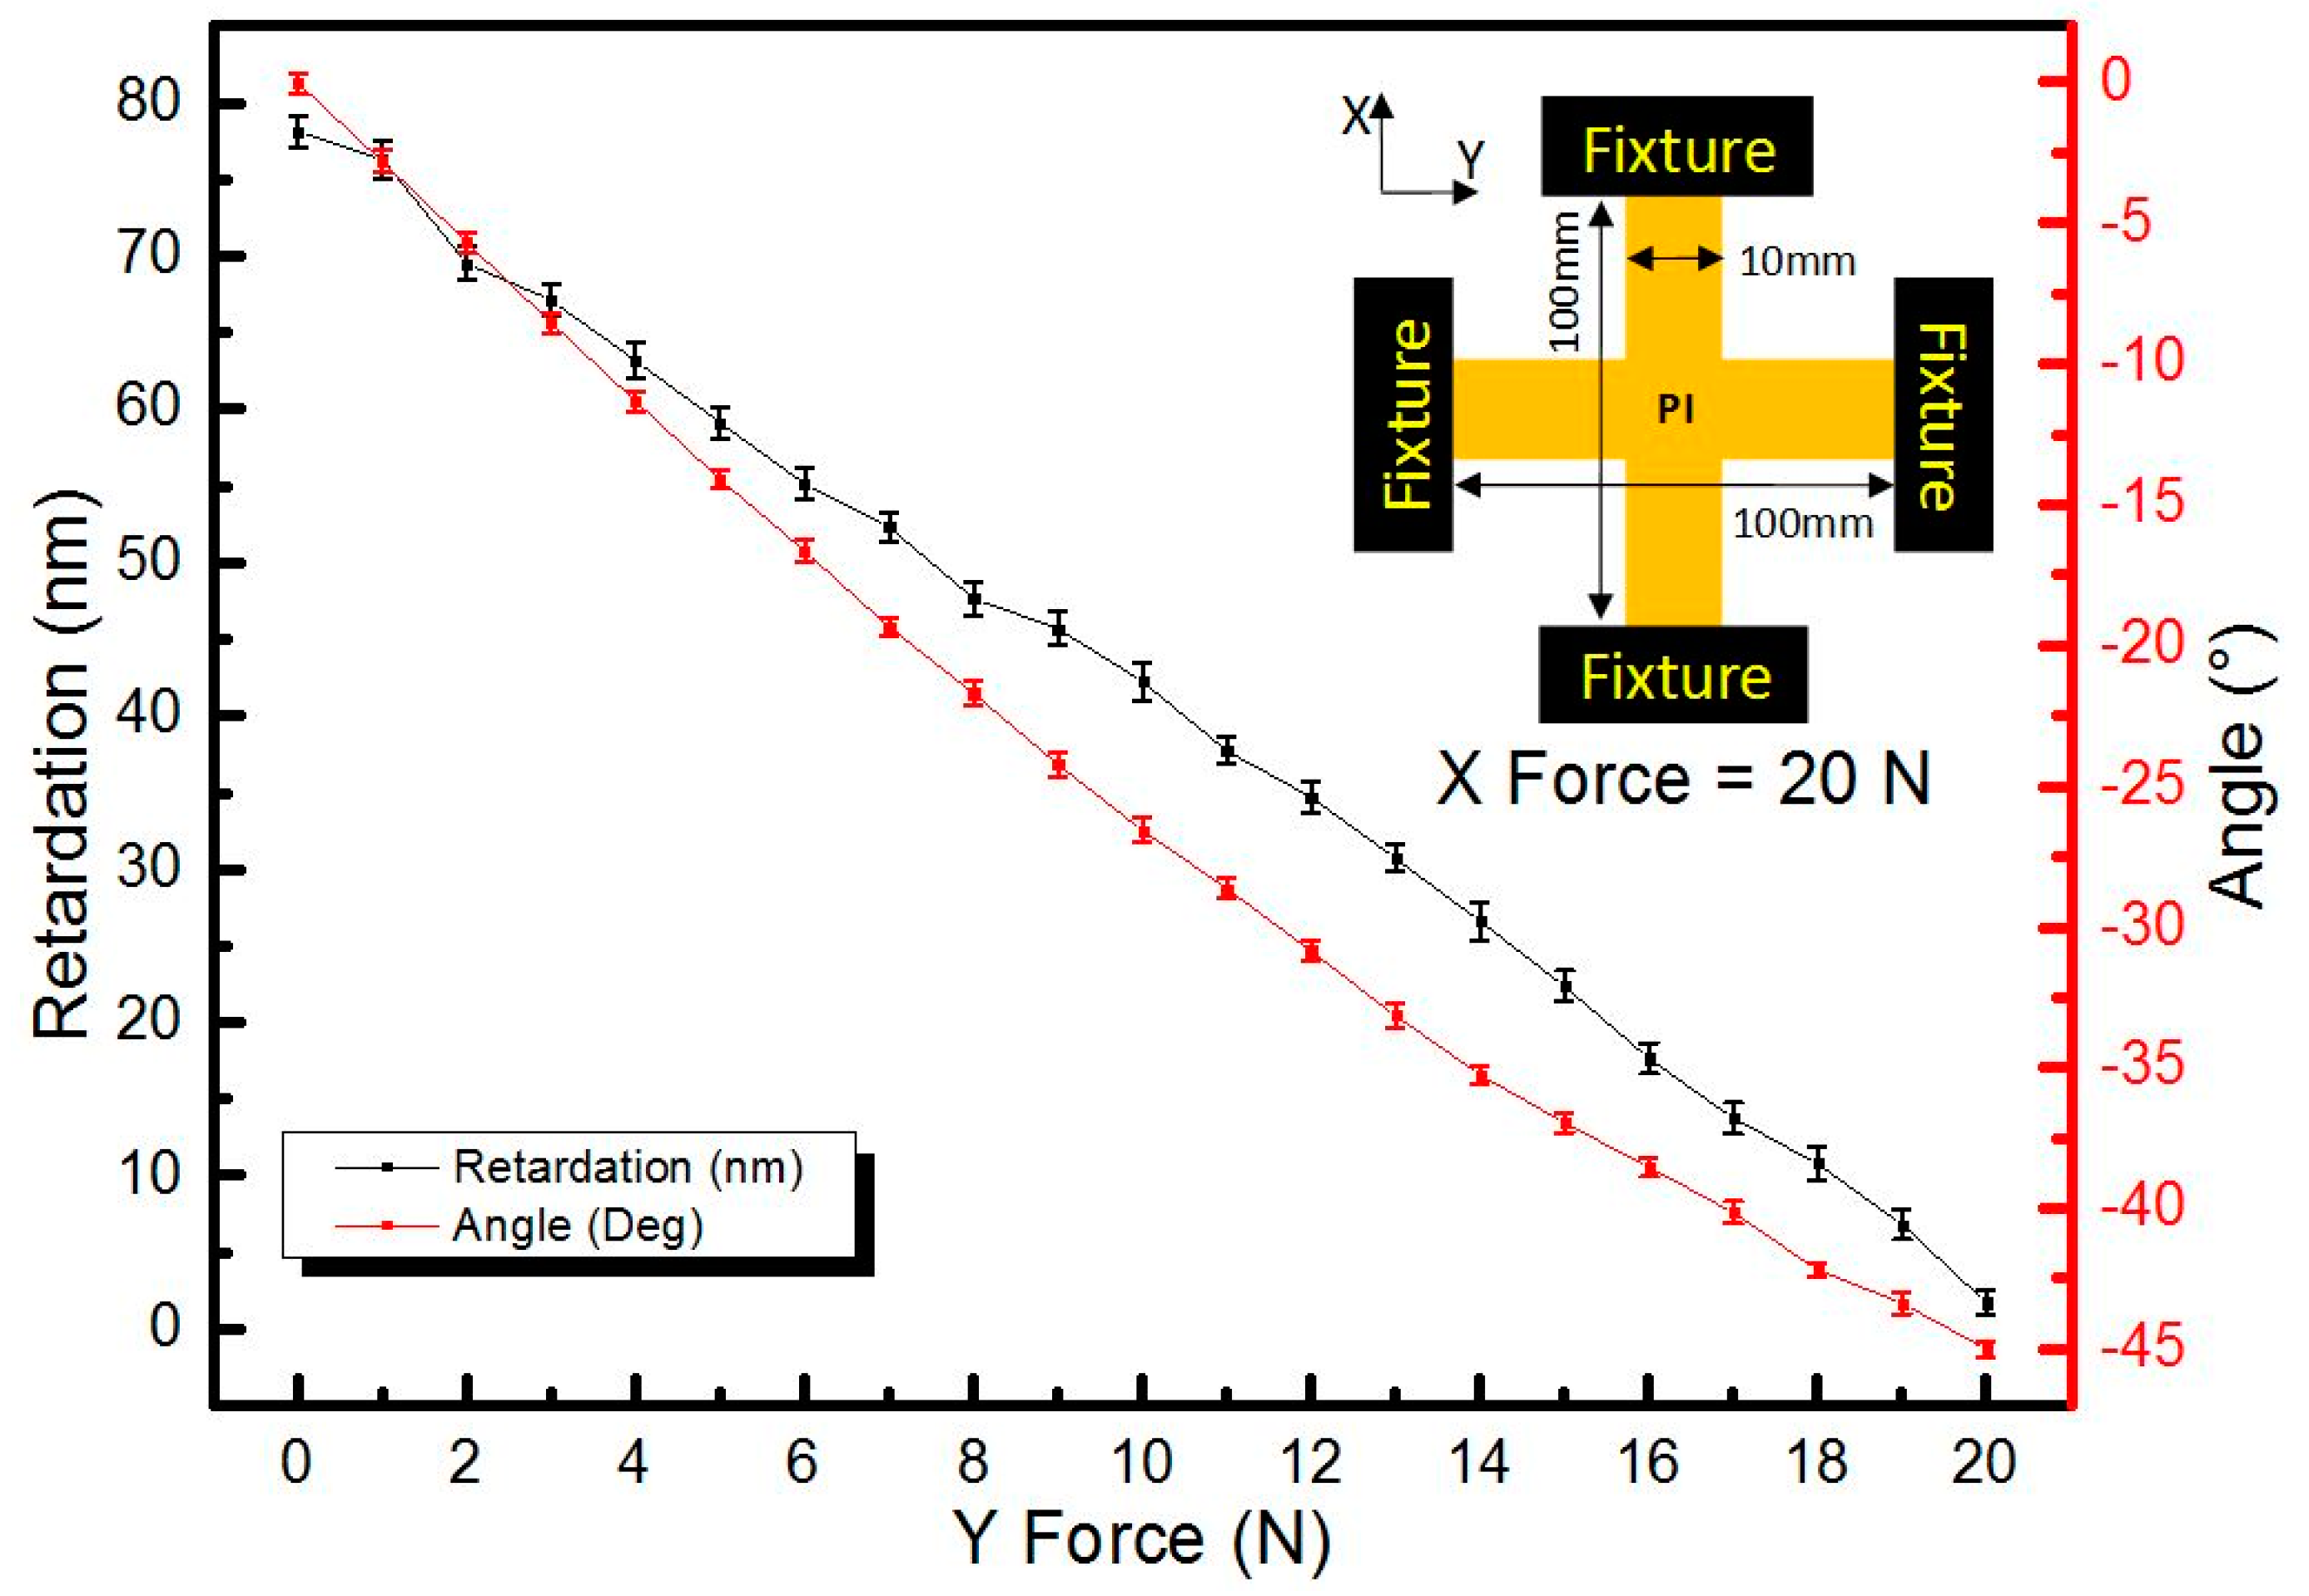
3.2. Biaxial Stretching Test

The biaxial stretching test is helpful for understanding how retardation angle is determined. In the experiment, we prepared the sample shown in Figure 1b and obtained retardation data at the same central point of the sample. The result is shown in Figure 7 where the black and red line stand for the retardation value and angle against the Y-direction stretching force, respectively. The retardation value decreases almost linearly with the Y force and the slope is in accordance with Equation (2). Besides, the retardation angle is found to decrease with the Y force and approach −45° when the Y force is equal to the X force at 20 N.
Next, we put forward a model shown in Figure 8 to explain how the retardation angle is determined. In the biaxial stretching experiment, two principal stresses are explicit in the X- and Y-directions and are marked as σx and σy, respectively. When the Y force is smaller than 20 N, σy < σx is established, illustrated in Figure 8a, and we can draw a circumscribed rectangle to stress the ellipse of the PI membrane. Then, we draw a diagonal from the upper right to lower left and its perpendicular line with the α angle to the Y-direction. Assuming that the retardation angle is drawn, the α angle and corresponding numerical relationship is expressed in Equation (3).
α = arctan ( σ y σ x )
When the Y force is 20 N, same with the X force, the calculated retardation angle is −45°, which is coincident with the measured value in Figure 7. After careful calculation and comparing data in Figure 7 and Equation (3), the retardation angle is in good accordance with Equation (3). In this way, it is possible to conduct absolute principal stress values based on the model if we know the principal stress direction, as well as retardation value and angle. Moreover, if one of the principal stresses is compressive stress, the dashed diagonal line should be drawn from the upper left to lower right and result in an opposite α angle. In this way, the angular variation in the uniaxial test results could also be explained by the model. First, in the uniaxial test, the σy is possibly not absolute zero, due to sample preparation and fixture influence; thus, the sample is actually in a quasi-biaxial condition, but we can handle it as an approximate uniaxial condition. The higher the stretching force, the closer it becomes to the uniaxial condition. Due to the existence of the sample placement angular deviation from the perfect X–Y direction, it is possible that the σx direction is anticlockwise-shifted a little bit from the X-direction; thus, the σy direction is a little bit above zero. However, if the principal stress direction is unknown, it is hard to determine the principal stress value because the number of variables is larger than the number of equations.

3.3. Circular Stretching Test

Then, we investigated the stress birefringence distribution of a circularly stretched membrane, as shown in Figure 9. The structure of the sample is illustrated in Figure 1c and a real photo of the sample is shown in Figure 9a. The legend description is shown in Figure 9b where the first column shows different colors displayed in Figure 9c–f, and the second and third columns show the lower limit and upper limit of retardation values corresponding to each color, respectively.
It is found that in Figure 9c, the retardation values are less than 2 nm in the majority of tested areas and are between 2 and 3 nm in the upper left and bottom area. In Figure 9d, the retardation values are less than 1 nm in the majority of tested areas, and local abnormal points are larger than 3 nm. These abnormal points are probably caused by local small wrinkles because the deviation from the flat surface shape leads to failure of the laser normal incidence, thus increasing the optical path. It is unlikely that the abnormal points are due to defects, because the size of invisible defects, if they exist, is much smaller than that of each measured spot. In fact, we would observe an altered retardation value if the sample was tilted by several degrees. In this way, it is a potential method to detect surface wrinkles by detecting abnormal points in a uniform membrane material in applications where a visual check is unavailable. There is no big difference between the sample stretched by the upper ring fixture gravity and the sample fully stretched by upper ring fixture shown in Figure 9d,e. It demonstrates that the circular fixture applies a relatively isotropic stretching force to the PI membrane. However, when the sample is fixed with screws shown in Figure 9f, the retardation values increase a lot and display a fringe pattern. It seems that fixing with screws introduces a non-uniform birefringence distribution. In theory, in a uniformly circularly stretched sample, the retardation values should be near-zero because stress values in any direction are the same, and retardation angles should be randomly distributed between −90° and 90°. The statistical data of retardation values and retardation angles in Figure 9e,f are shown in Table 1 below. Sample 1 refers to the sample shown in Figure 9e, and sample 2 refers to sample shown in Figure 9f.
It is found that both samples have a similar retardation value range with a minimum value lower than 0.1 nm and maximum value close to 20 nm, but the average retardation value in sample 2 is almost three times that in sample 1. We also found that the average retardation angle in sample 1 is near-zero and that in sample 2 is near −8°. If the retardation angle is randomly distributed between −90° and 90°, it is reasonable that the average retardation angle is near zero; thus, we can say that the stretching force in sample 1 is likely isotropic. Moreover, the standard deviation of retardation angle also reveals the uniformity from another perspective. Theoretically, if the retardation angle is randomly distributed from −90° to 90°, the standard deviation should be around 52 and the gap between the actual standard deviation and 52 represents the existence of orientation. The fact that the average retardation angle in sample 2 is away from zero indicates that the stretching force in sample 2 is less likely to be isotropic. Note that there are six circularly symmetric distributed screw connections on the sample 2 fixture, and the difference in tightness may cause additional non-uniformity to the stretching force. In this way, we can adjust the tightness of each screw connection depending on the average retardation angle. This experiment helps establish a better understanding of the stress birefringence measurement of the polymer membrane in the uniaxially, biaxially, and circularly stretched state, and provides a possible method to evaluate the uniformity of the stretching force in a polymer membrane without contact.

4. Conclusions

In this letter, we adopted a stress birefringence method to investigate the correlation between stress and retardation in a uniaxially stretched PI membrane, and experimentally obtained a photoelastic coefficient around 400 nm/Mpa·cm. The stress relaxation speed of the uniaxially stretched PI membrane reached 0.5 MPa/s at an initial stress over 114 MPa. Then, we studied how retardation angle varied with the stretching forces in the biaxial stretching test and established a model to explain how the retardation angle is determined. It was found that the retardation angle is the negative arctan of the principal stress ratio. Finally, we measured the stress birefringence of a circularly stretched sample and found that the average retardation angle is an important parameter for evaluating the uniformity of the stretching force. This work provides a better understanding of stress birefringence measurement of the membrane material and provides a possible method to evaluate the uniformity of the stretching force in a polymer membrane without contact.

Author Contributions

Conceptualization, G.G.; methodology, D.M.; formal analysis, R.J.; investigation, J.B.; resources, Z.L.; data curation, X.L.; writing—original draft preparation, G.G.; writing—review and editing, B.L.; supervision, B.F. and S.W. All authors have read and agreed to the published version of the manuscript.

Funding

This work was supported by the National Key R&D Program of China (No. 2016YFB0500200) and the Key Program of Chinese Academy of Sciences (No. YA16K010).

Conflicts of Interest

The authors declare no conflict of interest.

References

  1. Liaw, D.; Ha, C.; Lai, J.; Lee, K.; Laic, J.; Ha, C. Advanced polyimide materials: Synthese, physical properties and applications. Prog. Polym. Sci. 2012, 37, 907–974. [Google Scholar] [CrossRef]
  2. Hasegawa, M.; Horie, K. Photophysics, photochemistry, and optical properties of polyimides. Prog. Polym. Sci. 2001, 26, 259–335. [Google Scholar] [CrossRef]
  3. Han, K.; Jang, W.; Rhee, T.H. Synthesis of fluorinated polyimides and their application to passive optical waveguides. J. Appl. Polym. Sci. 2015, 77, 2172–2177. [Google Scholar] [CrossRef]
  4. Lei, X.F.; Chen, Y.; Zhang, H.P.; Li, X.J.; Yao, P.; Zhang, Q.Y. Space survivable polyimides with excellent optical transparency and self-healing properties derived from hyperbranchedpolysiloxane. ACS Appl. Mater. Interfaces 2013, 5, 10207–10220. [Google Scholar] [CrossRef] [PubMed]
  5. Nam, K.H.; Kim, H.; Choi, H.K.; Yeo, H.; Goh, M.; Yu, J.; Ryang Hahn, J.; Han, H.; Ku, B.; You, N. Thermomechanical and optical properties of molecularly controlled polyimides derived from ester derivatives. Polymer 2017, 108, 502–512. [Google Scholar] [CrossRef]
  6. Liu, Y.J.; Si, G.Y.; Leong, E.S.P.; Wang, B.; Danner, A.J.; Yuan, X.C.; Teng, J.H. Optically tunable plasmonic color filters. Appl. Phys. A 2012, 107, 49–54. [Google Scholar] [CrossRef]
  7. Danbo, M.; Lv, G.; Gao, G.; Fan, B. Fabrication of polyimide films with imaging quality using a spin-coating method for potential optical applications. J. Polym. Eng. 2019, 39, 917–925. [Google Scholar]
  8. Smirnova, V.Y.; Bessonov, M.I.; Sklizkova, V.P. Properties of oriented polyimide films prepared by different methods. Polym. Sci. USSR 1990, 32, 267–271. [Google Scholar] [CrossRef]
  9. Poe, G.D.; Patrick, B.G. Zero CTE polyimides for athermal optical membranes. In Proceedings of the SPIE 7061, Novel Optical Systems Design and Optimization XI, 706114, San Diego, CA, USA, 11 September 2008. [Google Scholar]
  10. Xu, C.N.; Watanabe, T.; Akiyama, M.; Zheng, X.G. Direct view of stress distribution in solid by mechanoluminescence. Appl. Phys. Lett. 1999, 74, 2414–2416. [Google Scholar] [CrossRef]
  11. Britten, J.A.; Dixit, S.N.; DeBruyckere, M.; Steadfast, D.; Hackett, J.; Farmer, B.; Poe, G.; Patrick, B.; Atcheson, P.D.; Domber, J.L.; et al. Large-aperture fast multilevel Fresnel zone lenses in glass and ultrathin polymer films for visible and near-infrared imaging applications. Appl. Opt. 2014, 53, 2312–2316. [Google Scholar] [CrossRef] [PubMed]
  12. Atcheson, P.D.; Stewart, C.; Domber, J.; Whiteaker, K.; Cole, J.; Spuhler, P.; Seltzer, A.; Britten, J.A.; Dixit, S.N.; Farmer, B.; et al. MOIRE: Initial demonstration of a transmisive diffractive membrane optic for large lightweight optical telescopes. In Proceedings of the SPIE—The International Society for Optical Engineering, Amsterdam, The Netherlands, 21 September 2012; Volume 8442, p. 844221. [Google Scholar] [CrossRef]
  13. Gao, G.; Mao, D.; Fan, B.; Guan, C. Effect of wet expansion behavior on polyimide membrane diffractive lens. Coatings 2019, 9, 559. [Google Scholar] [CrossRef] [Green Version]
  14. Zhao, B.; Chen, W.; Hu, J.; Chen, J.; Qiu, Z.; Zhou, J.; Gao, C. An innovative methodology for measurement of stress distribution of inflatable membrane structures. Meas. Sci. Technol. 2016, 27, 025002. [Google Scholar] [CrossRef]
  15. Mori, D.; David, G.; Humphrey, J.D.; Moore, J.E., Jr. Stress distribution in a circular membrane with a central fixation. J. Biomech. Eng. 2005, 127, 549. [Google Scholar] [CrossRef] [PubMed]
  16. Yang, A.C.-M. Measurements of equi-biaxial stress in adhered polyimide films by tilted beam polarized light microscopy. Mater. Chem. Phys. 1995, 41, 150–153. [Google Scholar] [CrossRef]
  17. Ando, S.; Sawada, T.; Sasaki, S. In-plane birefringence and elongation behavior of uniaxially drawn aromatic polyimide films. Polym. Adv. Technol. 2001, 12, 319–331. [Google Scholar] [CrossRef]
  18. Kozanecka-Szmigiel, A.; Switkowski, K.; Schab-Balcerzak, E.; Grabiec, E. Two-photon-induced birefringence in azo-dye bearing polyimide; the birefringence changes versus the writing power. Appl. Phys. B 2011, 105, 851–855. [Google Scholar] [CrossRef] [Green Version]
  19. King, J.S.; Lee, W.C.; Chang, L.M.; Whang, W.T. Structural effect on stretch-induced birefringence in polyimide films. Jpn. J. Appl. Phys. 2007, 46, 6801–6806. [Google Scholar] [CrossRef]
  20. Eguchi, Y.; Unsal, E.; Cakmak, M. Critical phenomenon during drying of semiaromatic, transparent and soluble polyimide cast films: Real-time observation of birefringence and other integrated parameters. Macromolecules 2013, 46, 7488–7501. [Google Scholar] [CrossRef]
  21. Kemp, J.C. Polarized Light and Its Interaction with Modulating Devices: A Methodology Review; Hinds International, Inc.: Hillsboro, OR, USA, 1987. [Google Scholar]
  22. Kemp, J.C. Piezo-optical birefringence modulators: New use for a long-known effect, A basic description of the PEM. J. Opt. Soc. Am. 1969, 59, 950. [Google Scholar] [CrossRef]
  23. Haward, S.; McKinley, G.; Shen, A. Elastic instabilities in planar elongational flow of monodisperse polymer solutions. Sci. Rep. 2016, 6, 33029. [Google Scholar] [CrossRef] [PubMed] [Green Version]
Figure 1. Schematic of polyimide (PI) membrane samples. Sample for uniaxial stretching test (a), sample for biaxial stretching test (b), and sample for circular stretching test (c).
Coatings 10 00056 g001
Figure 2. Experimental setup (a), uniaxially stretched PI membrane sample placed at center of Exicor 300AT instrument, and PI membrane stretching device (b), which consists of fixture, lead screw, force-meter, and sensor.
Coatings 10 00056 g002
Figure 3. Optical system of Exicor 300AT for birefringence measurement (a) and light polarization in each step (b).
Coatings 10 00056 g003
Figure 4. Distribution of uniaxially stretched PI membrane sample under different values of tensile force. Values of tensile force are 0, 4, 8, 12, 16, and 20 N (a). Different colors correspond to different retardation value ranges (b). Schematic of uniaxially stretched PI membrane with 100 mm length, 10 mm width, and 25 μm thickness (c).
Coatings 10 00056 g004
Figure 5. Stress birefringence of PI membrane in uniaxial tension mode, where the black line stands for the retardation value against the axial stretching force and the red line represents the retardation angle against the axial stretching force.
Coatings 10 00056 g005
Figure 6. Stress relaxation of PI membrane in uniaxial tension mode, where the black line stands for the force value against time and the red line represents the retardation value against time.
Coatings 10 00056 g006
Figure 7. Stress birefringence of PI membrane in biaxial tension mode with a constant 20 N stretching force in X-direction and an increasing stretching force in Y-direction. The black line stands for the retardation value against the Y-direction stretching force and the red line represents the retardation angle against the Y-direction stretching force.
Coatings 10 00056 g007
Figure 8. Stress ellipse of biaxially stretched PI membrane when the principal stress in the Y-direction is smaller than that in the X-direction (a) and when they are equal to each other (b).
Coatings 10 00056 g008
Figure 9. Stress birefringence distribution of circularly stretched PI membrane. Photo of sample (a), legend description of color map (b), color map of sample with no stretching force (c), color map of sample stretched by upper ring fixture gravity (d), color map of sample fully stretched by upper ring fixture (e), and color map of sample fixed with screws (f).
Coatings 10 00056 g009
Table 1. Statistical data of retardation values and retardation angles in Figure 9e,f.
Statistical DataMinMaxMeanStandard D
Retardation Value (nm)Sample 10.03318.7860.8370.587
Sample 20.04119.7262.2821.202
Retardation Angle (°)Sample 1−89.9789.950.90846.67
Sample 2−89.9089.99−7.94627.19

