The Long-Term Persistence of Borrelia burgdorferi Antigens and DNA in the Tissues of a Patient with Lyme Disease


Abstract
1. Introduction
2.1. Clinical History
3. Results
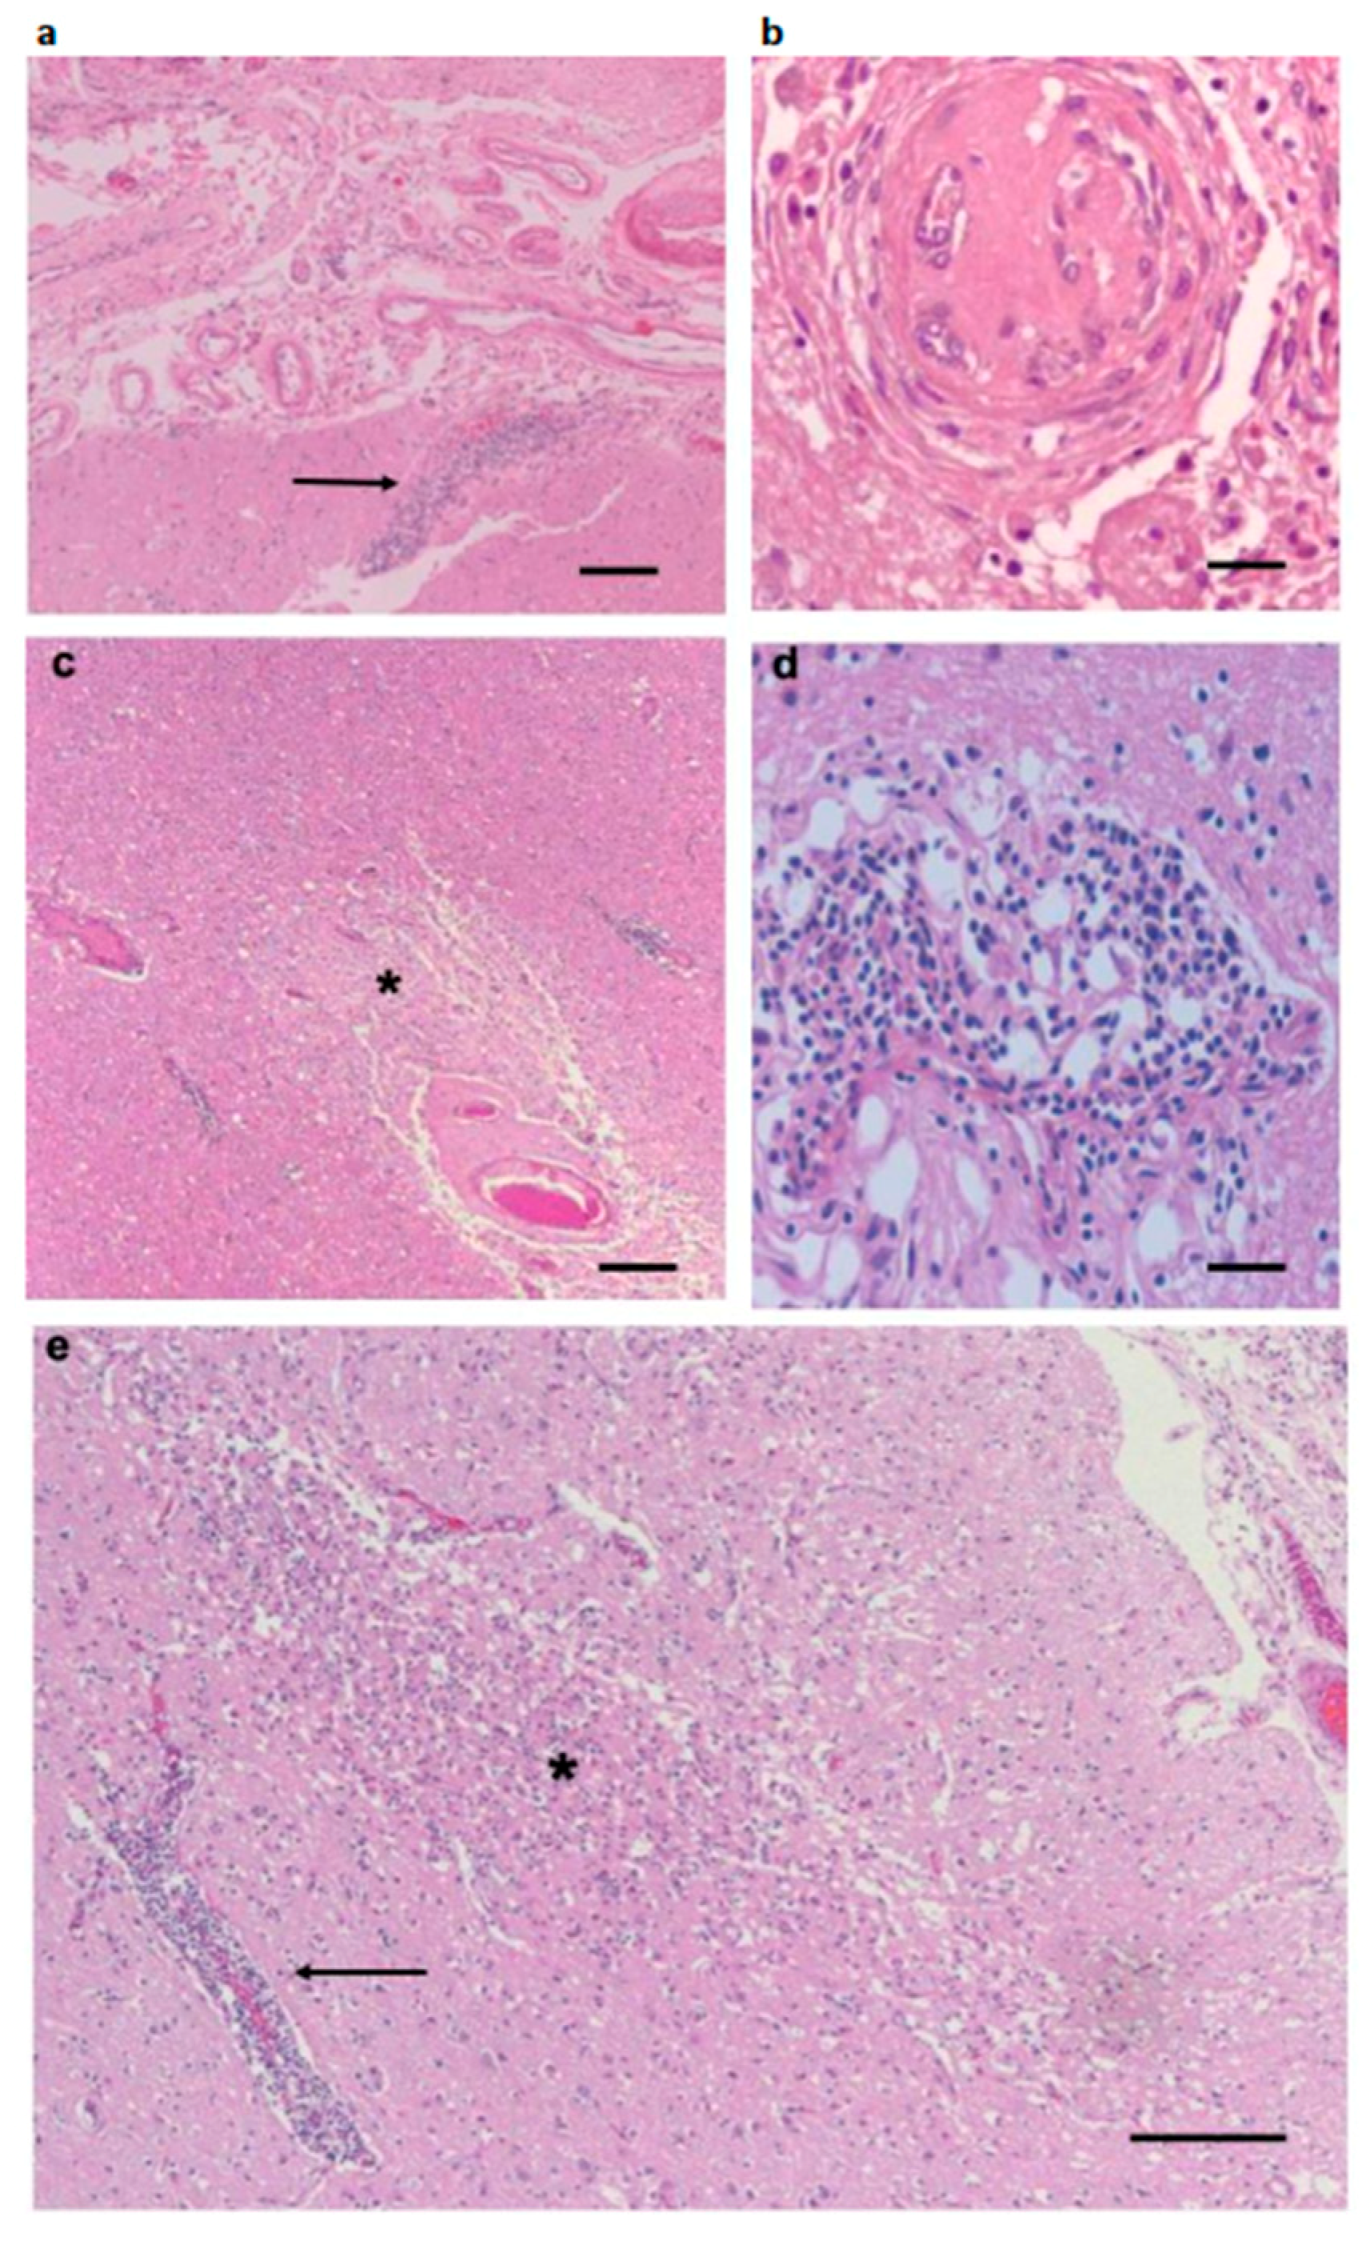
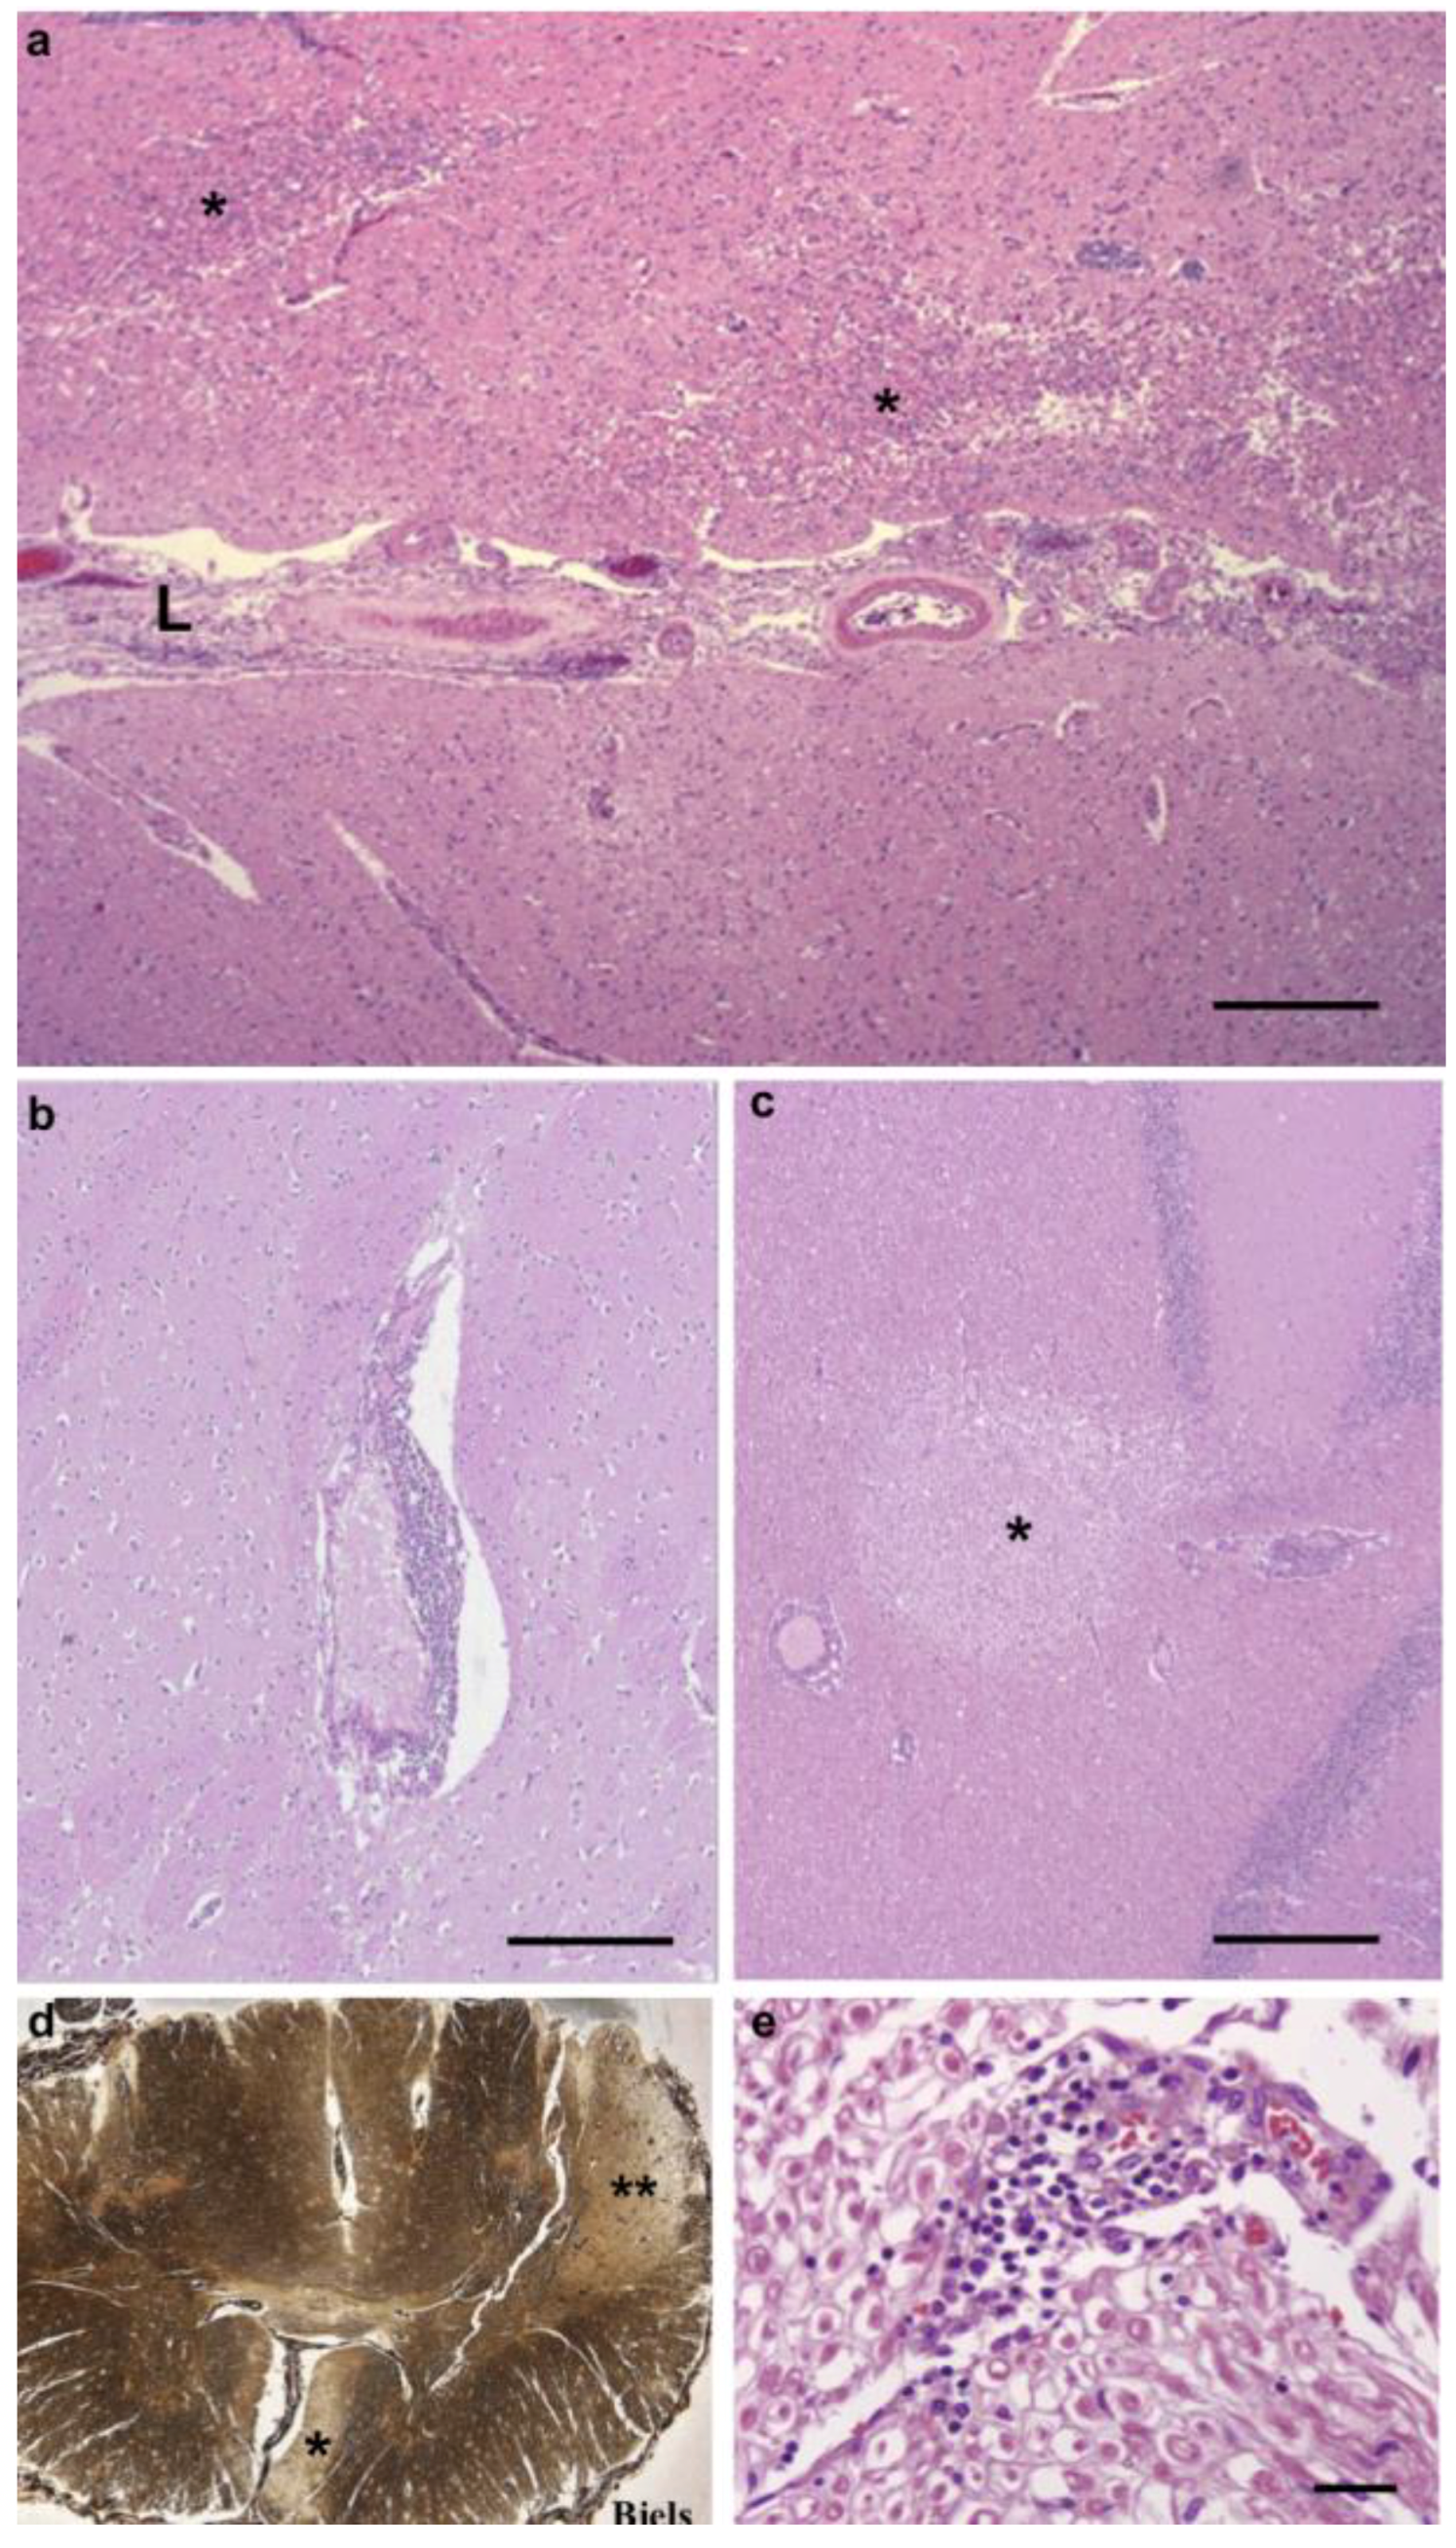
3.1. Pathological Findings—CNS and PNS
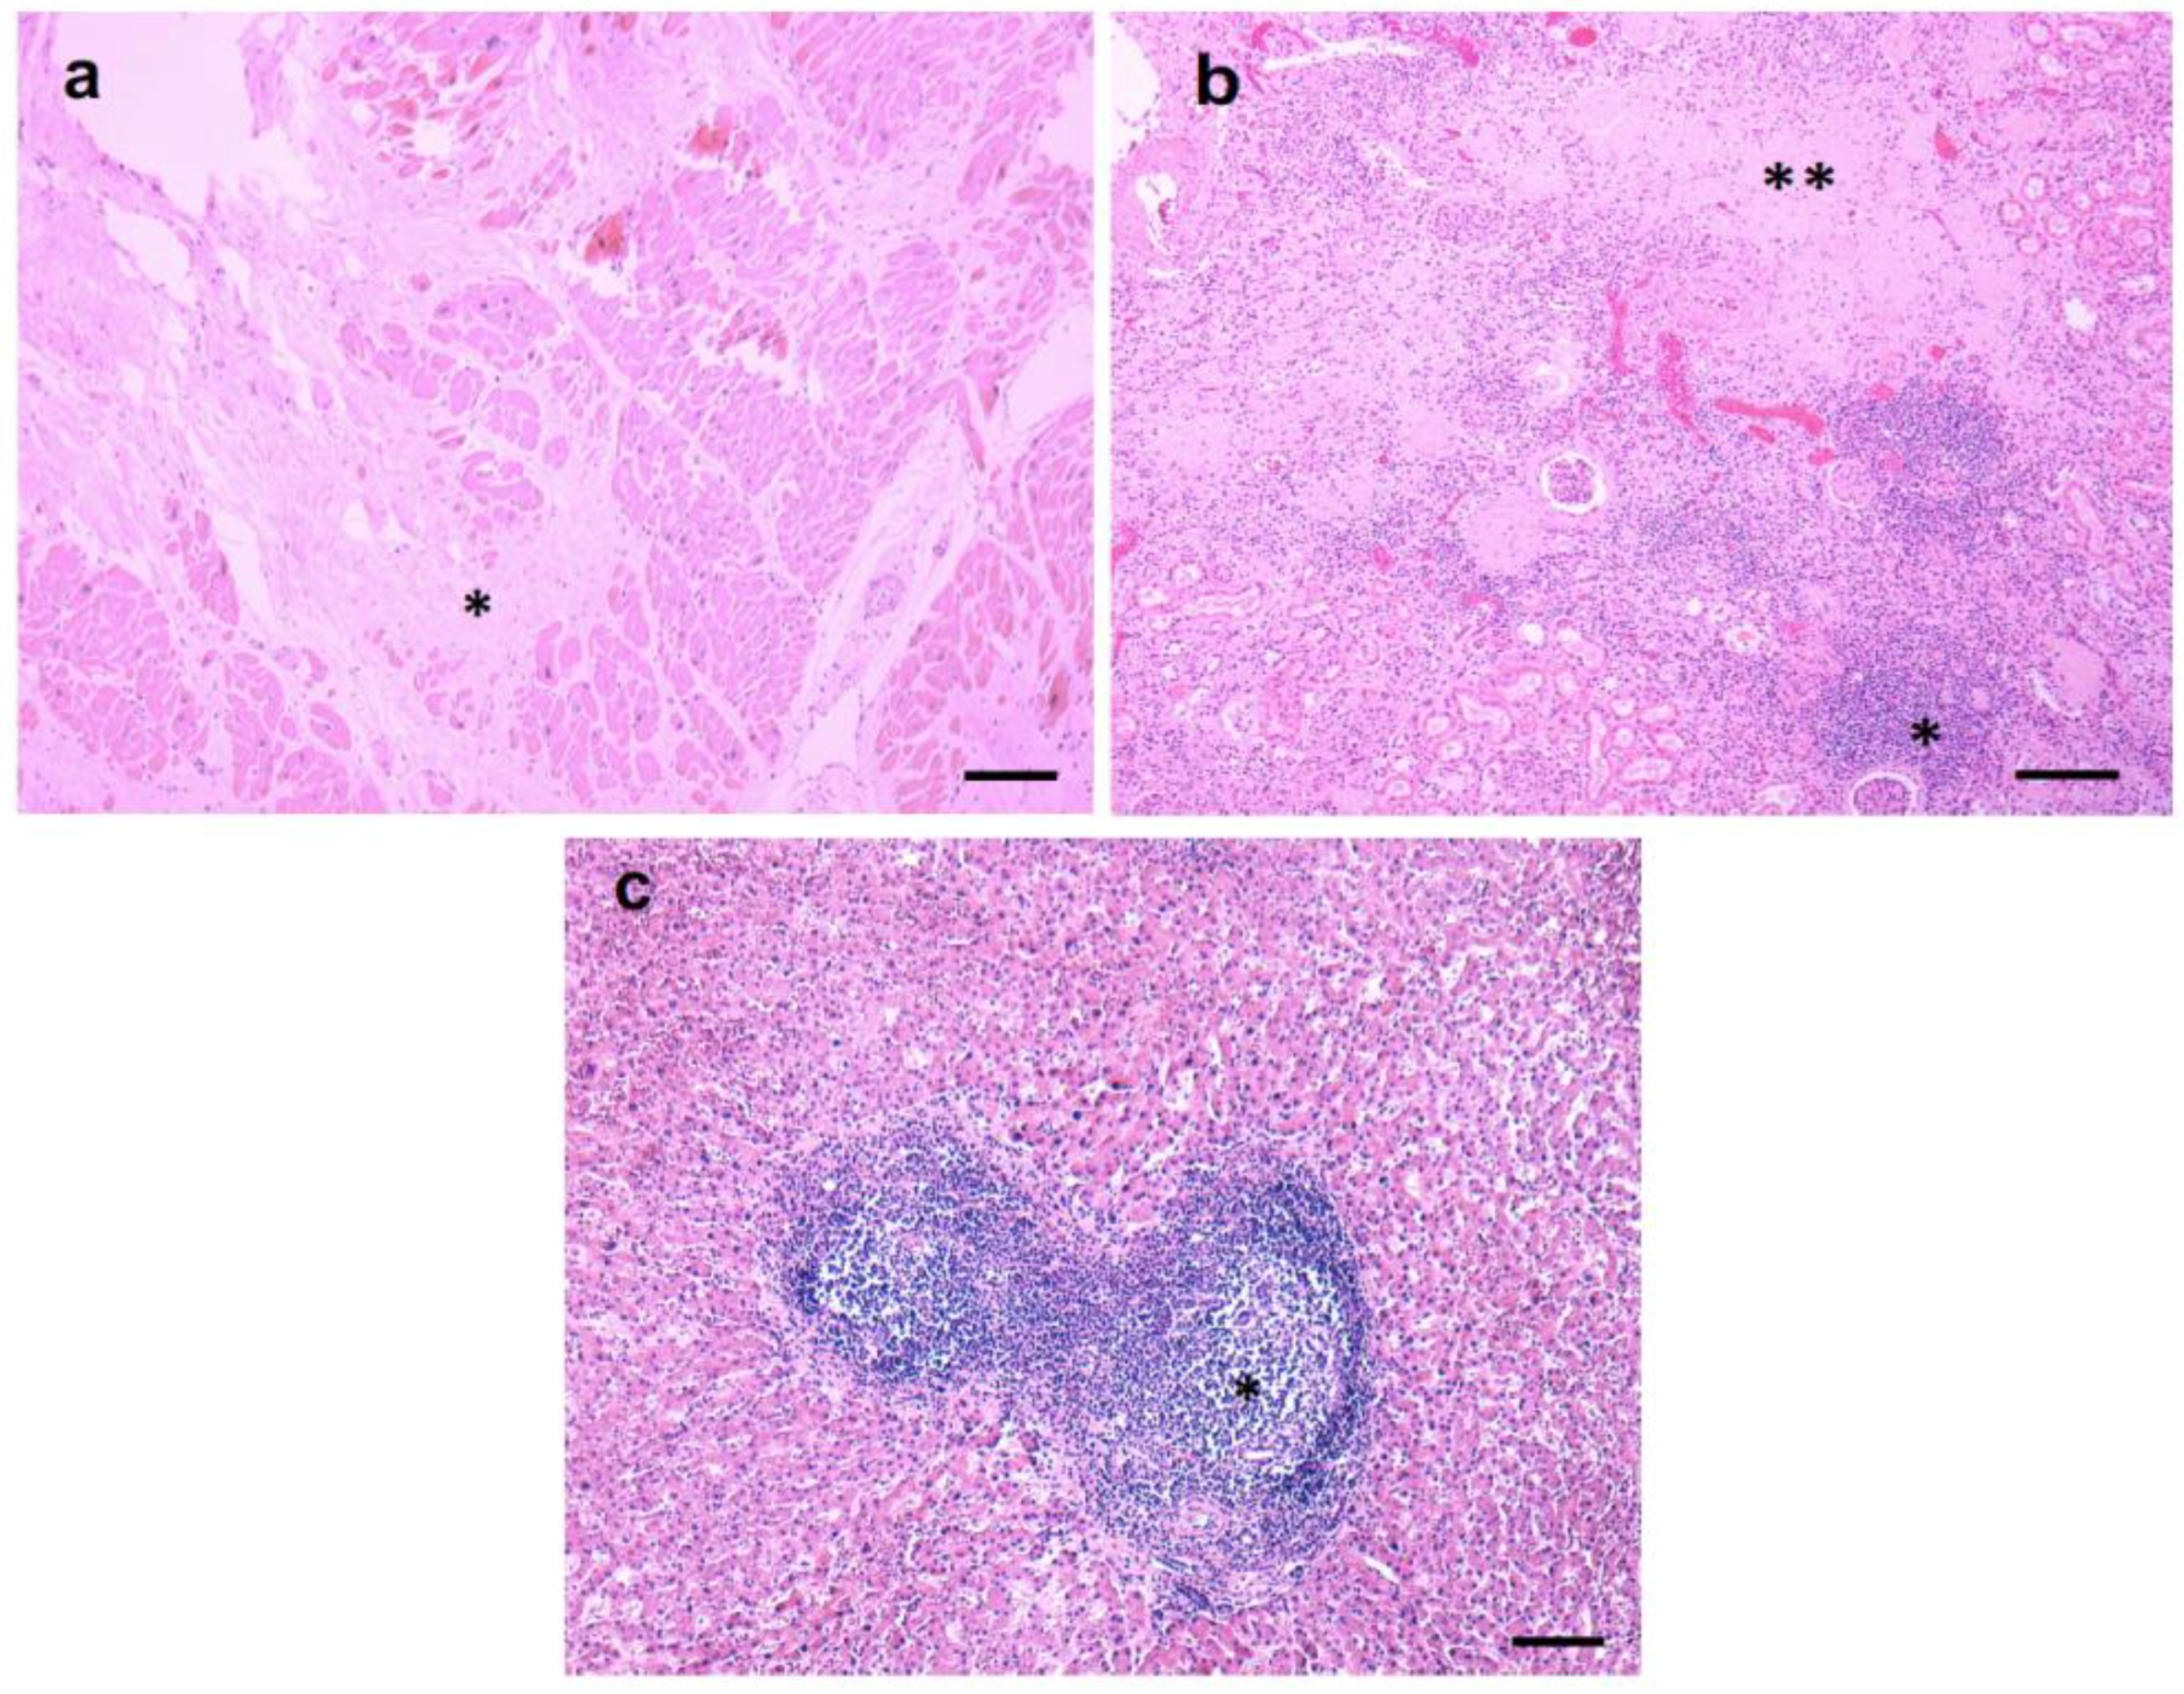
3.2. Pathological Findings—Kidney/Heart/Liver
3.3. Inflammatory Infiltrates
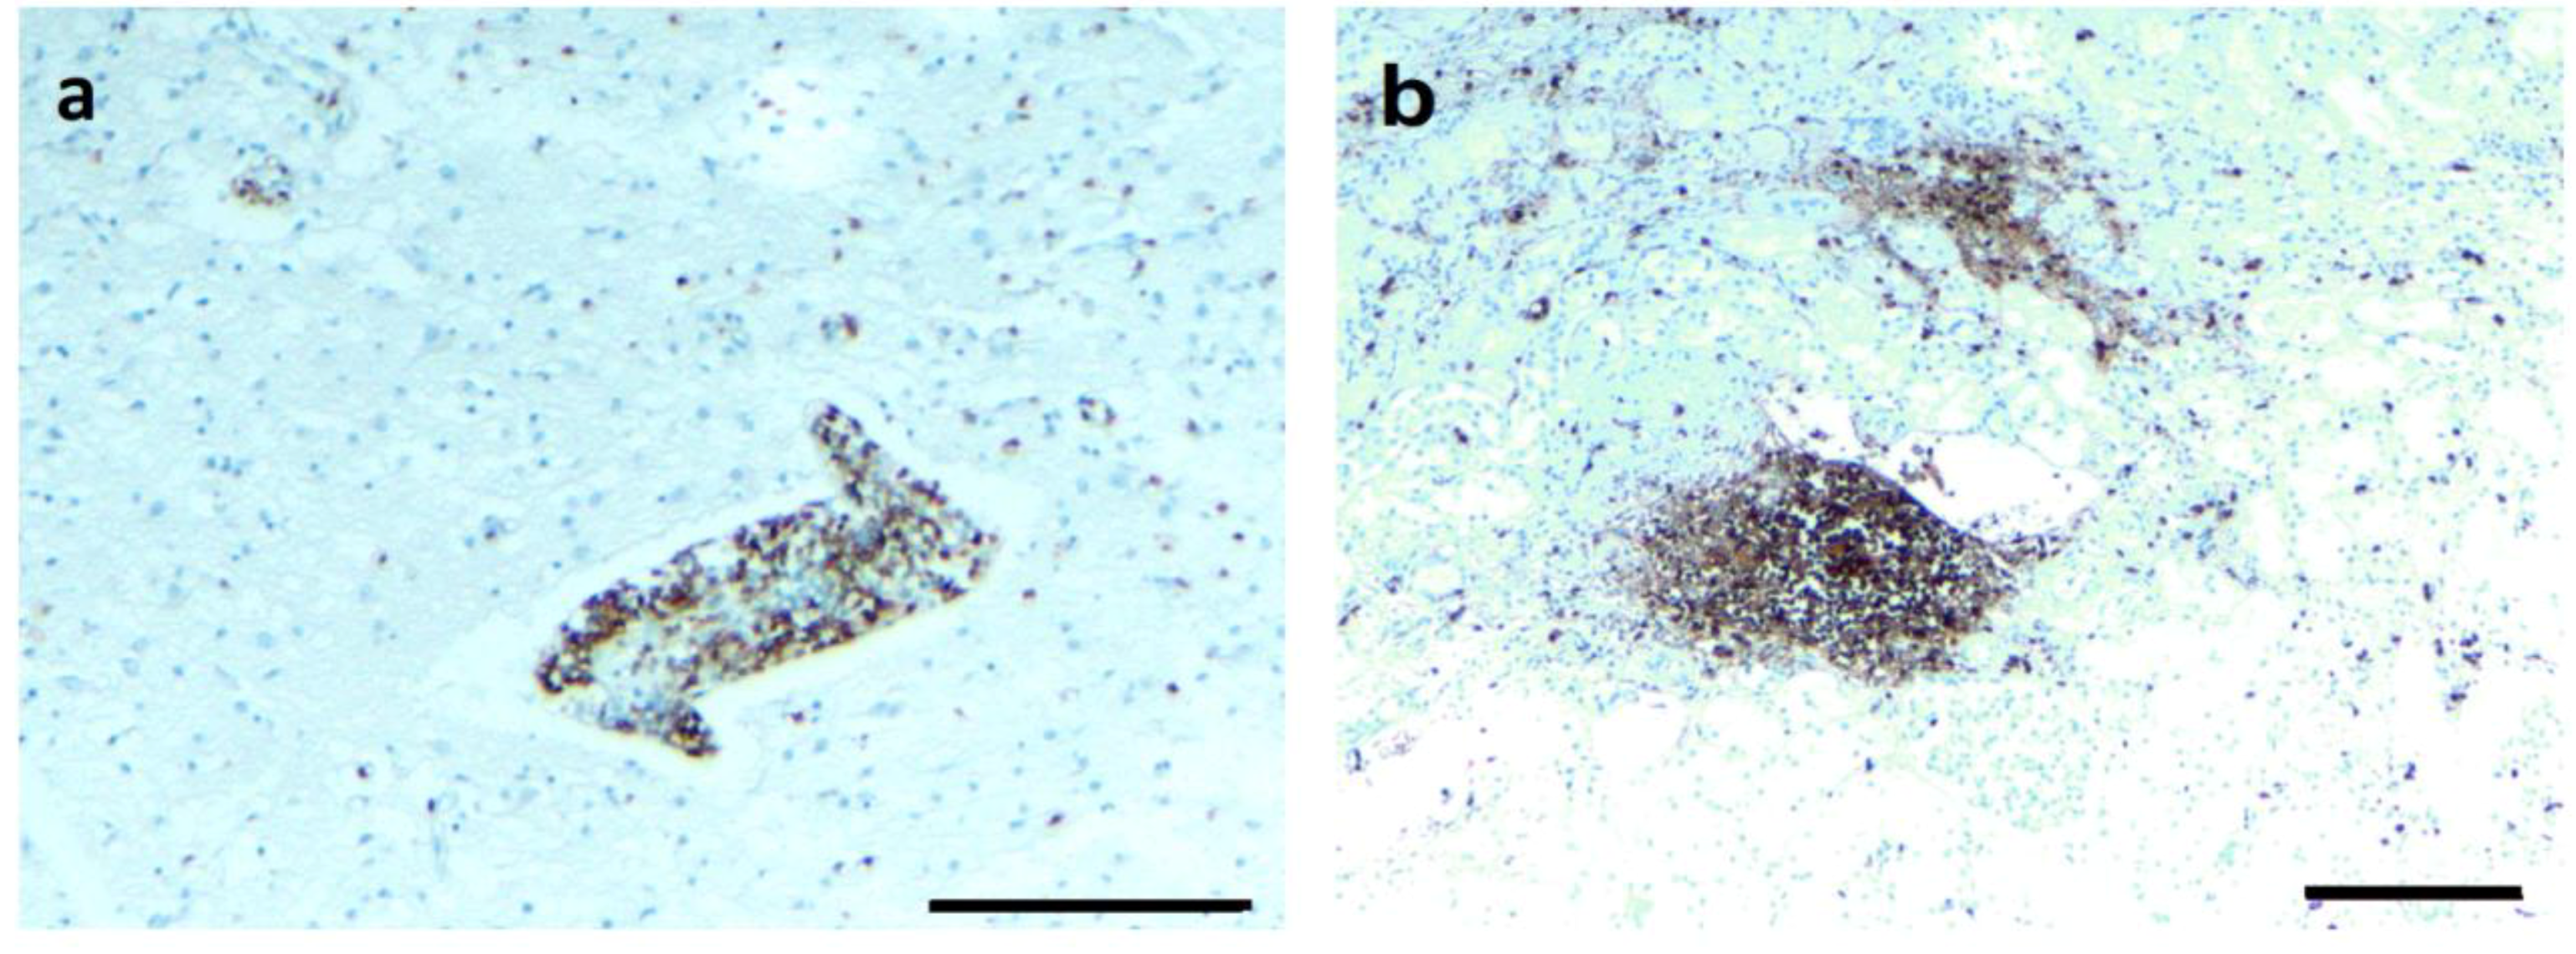
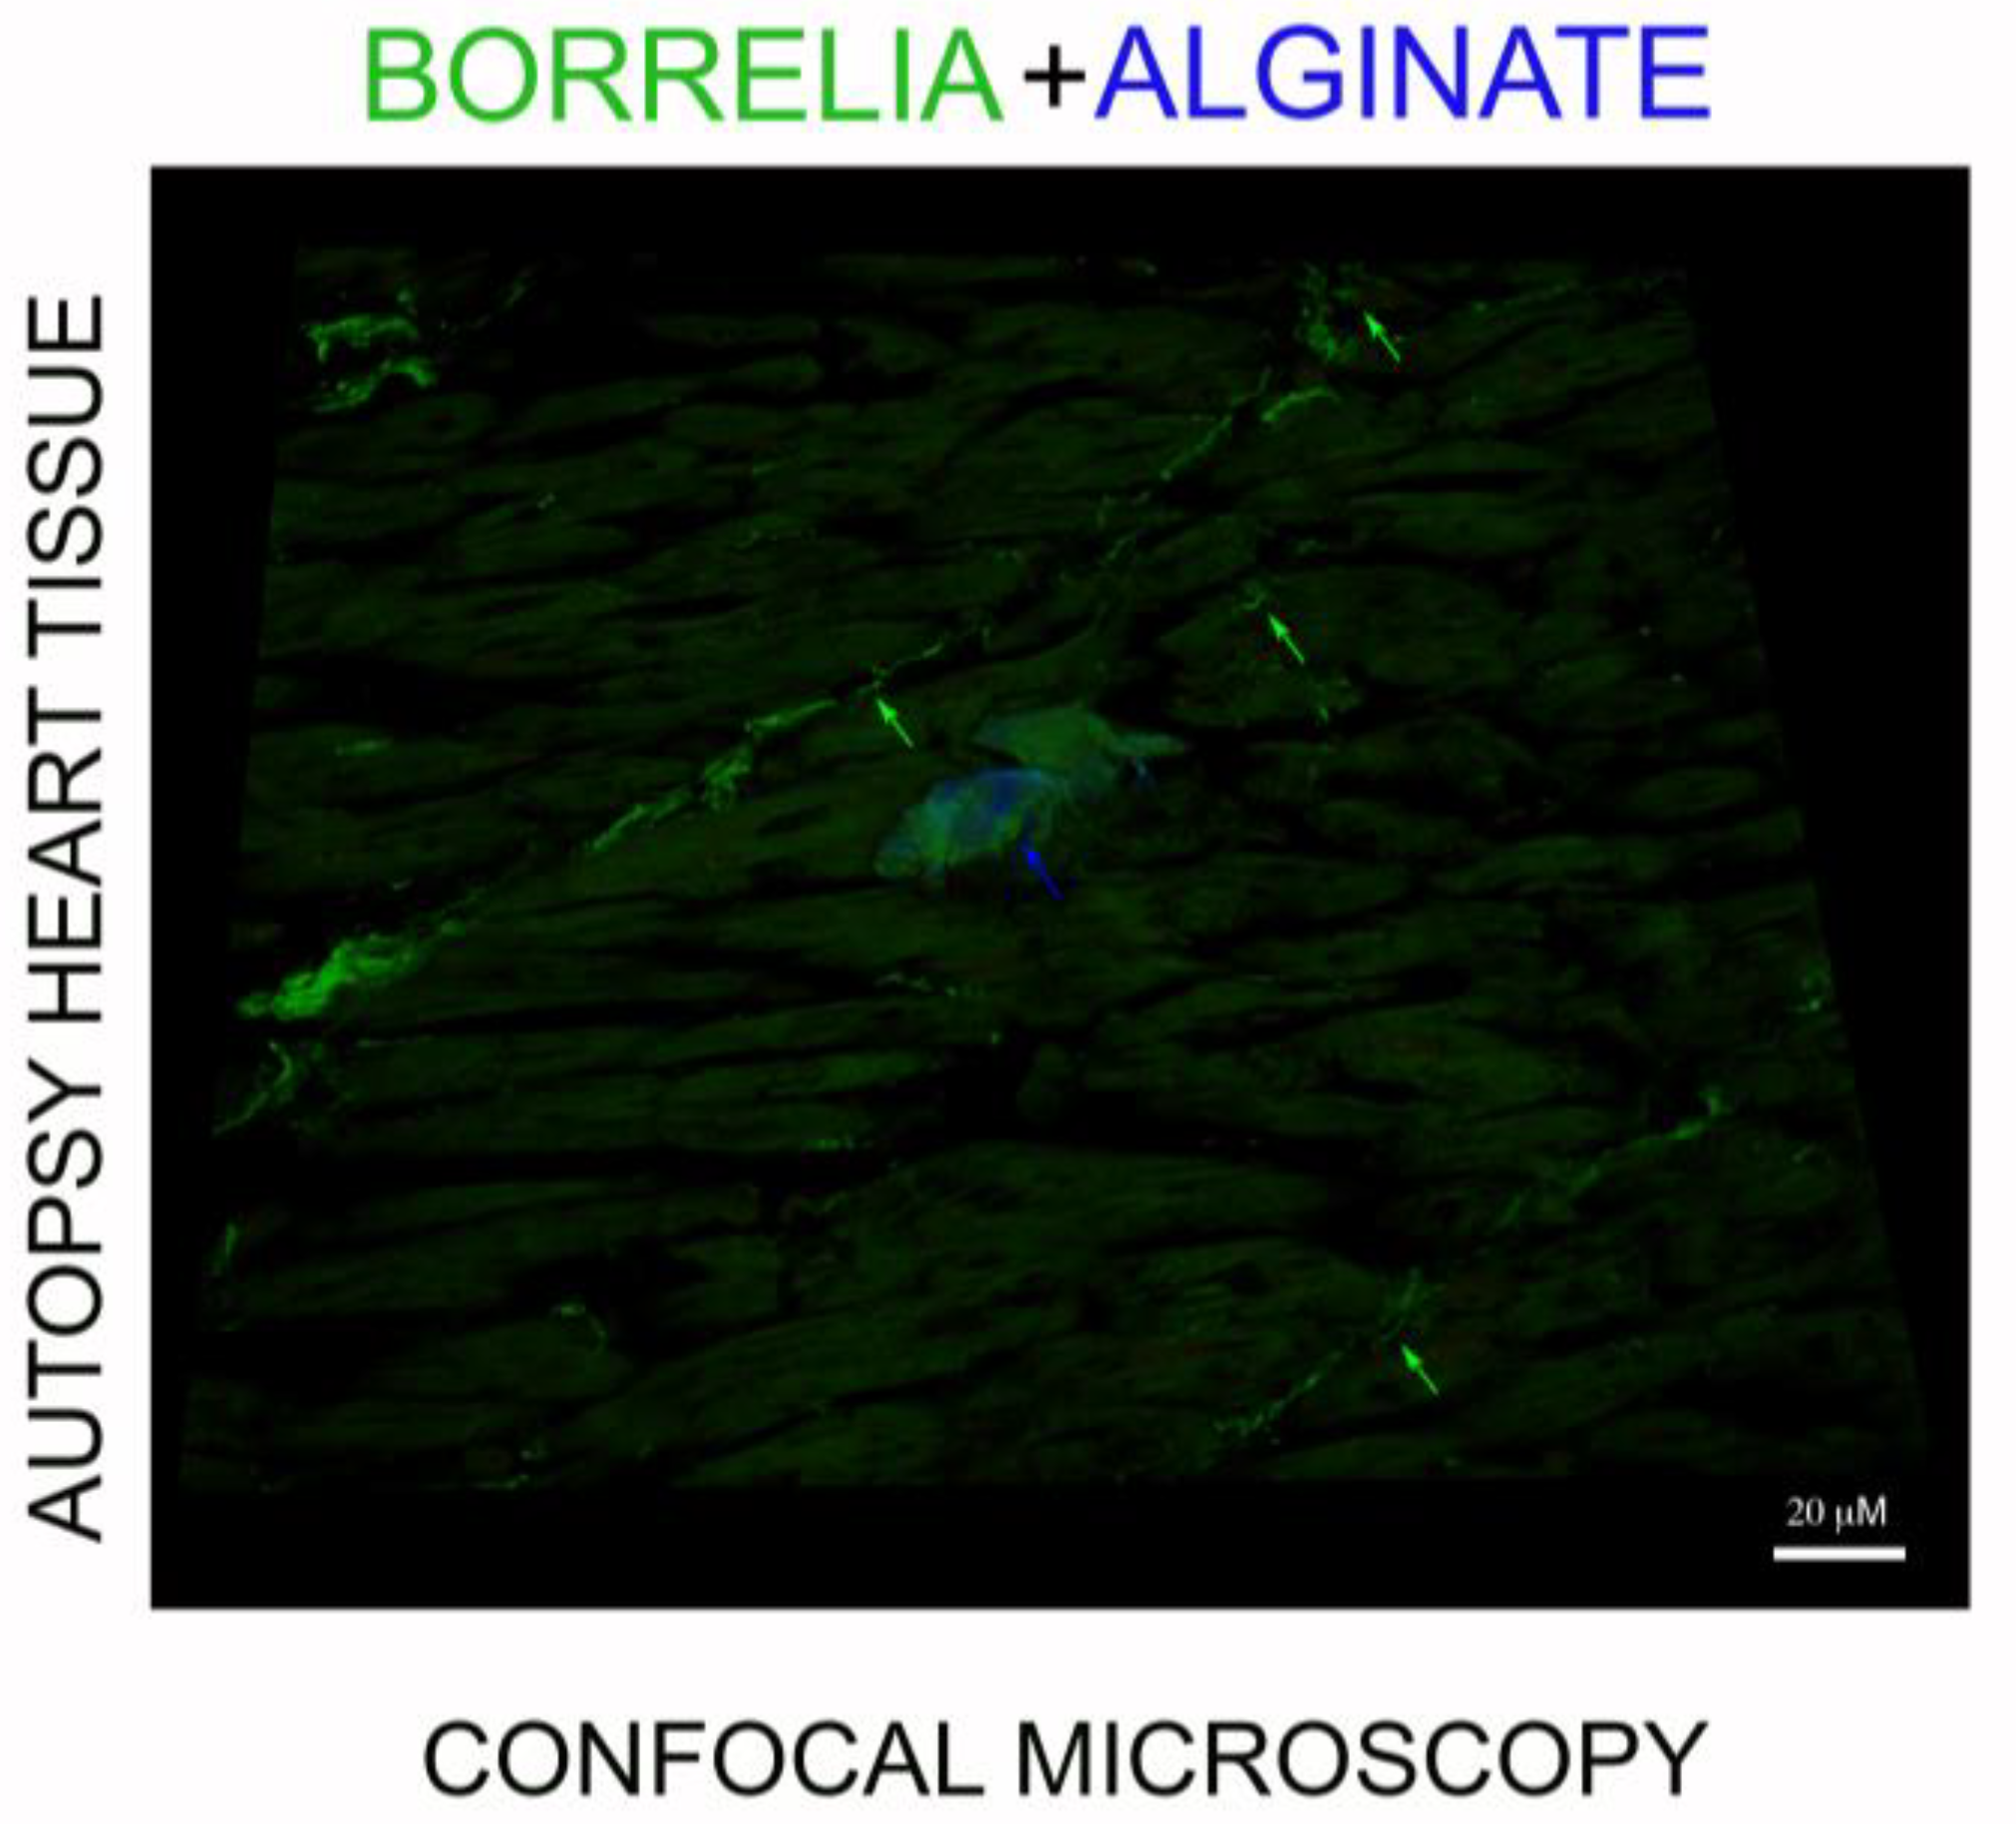
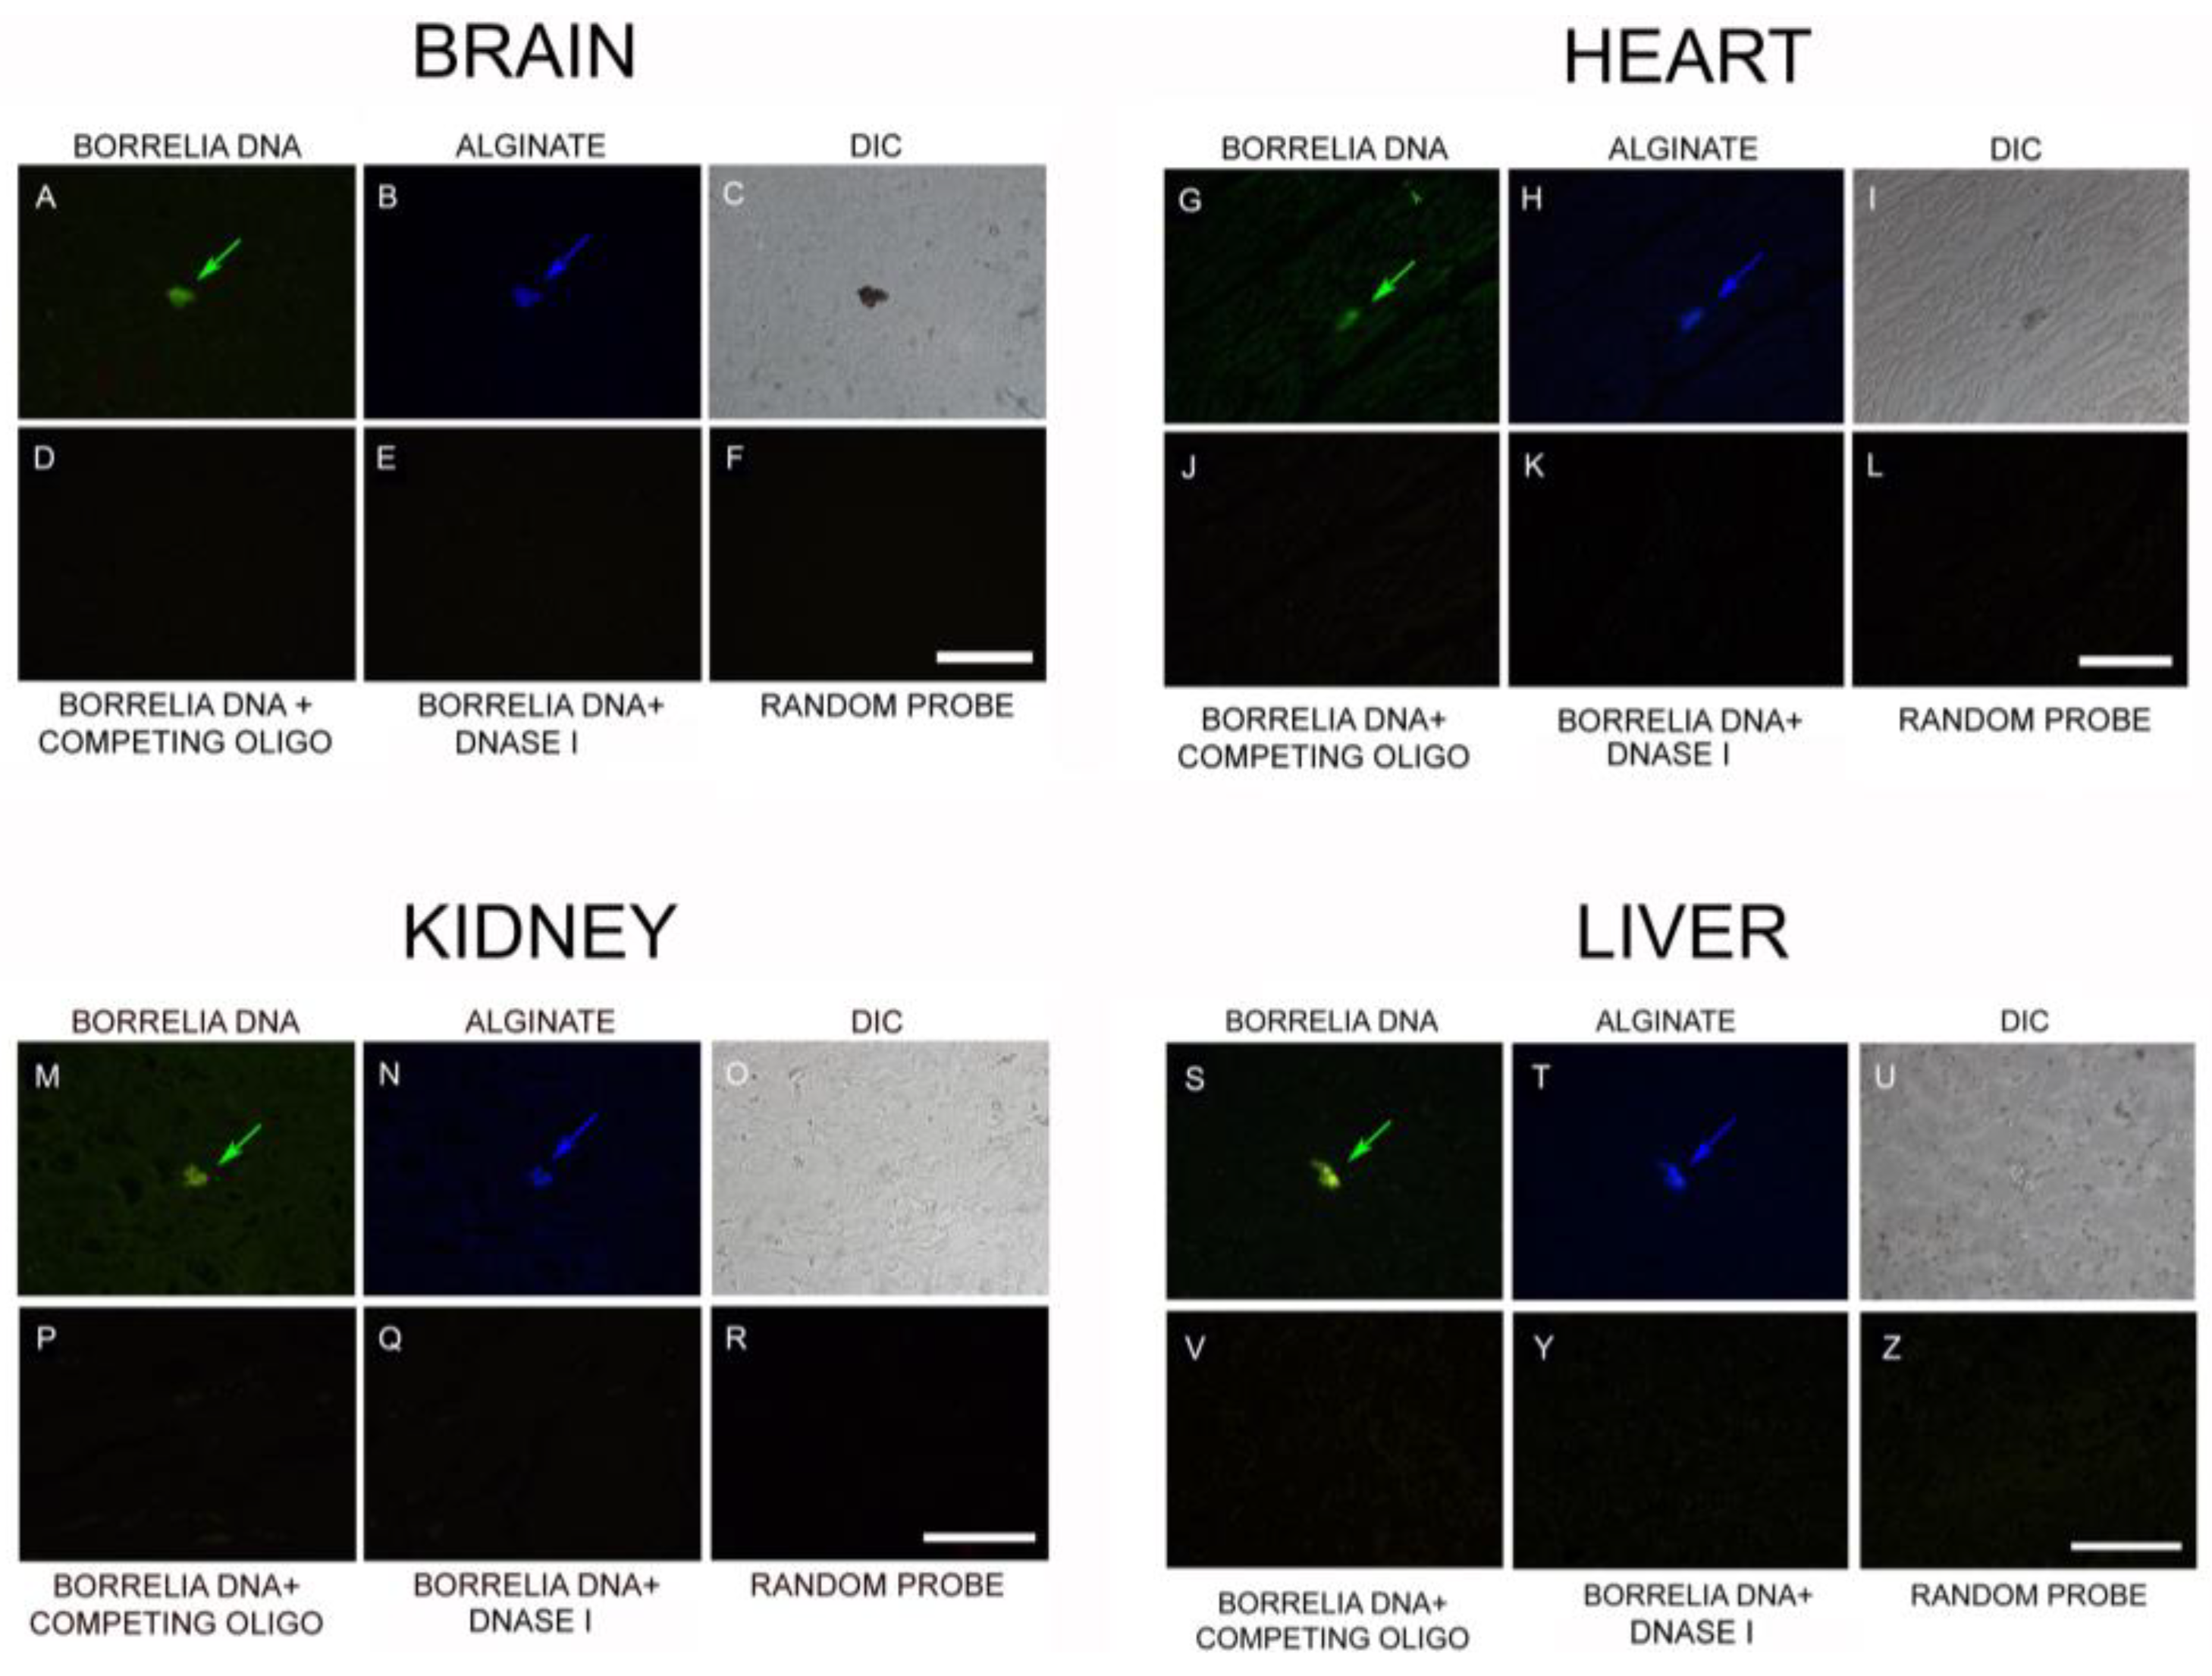
3.4. IHC/FISH/Confocal Microscopy Results
3.5. PCR/Whole-Genome Sequencing/Metagenomics Data
3.6. Infiltrating CD3+ T Lymphocytes
4. Discussion
4.1. Long-Term Persistence of Borrelia Antigens and DNA
4.2. Borrelia Antigens and DNA Are Associated with Biofilms
4.3. Borrelia DNA Persists in the Long Term
4.4. Long-Term Infection Is Associated with Multi-Organ Pathology
4.5. T-Cell Inflammation Is Associated with Biofilm
5. Materials and Methods
5.1. Autopsy Tissue Procurement and Processing
5.2. Immunohistochemistry (IHC)
5.3. Combined IHC and Fluorescent In Situ Hybridization (FISH)
5.4. DNA Extraction/PCR
5.5. Whole-Genome Sequencing/Metagenomic Analyses
5.6. Confocal Microscopy
5.7. Statistical Analysis
6. Conclusions
Supplementary Materials
Author Contributions
Funding
Conflicts of Interest
References
- Cook, M.J. Lyme borreliosis: A review of data on transmission time after tick attachment. Int. J. Gen. Med. 2014, 8, 1–8. [Google Scholar] [CrossRef]
- Kugeler, K.J.; Farley, G.M.; Forrester, J.D.; Mead, P.S. Geographic distribution and expansion of human Lyme disease, United States. Emerg. Infect. Dis. 2015, 21, 1455–1457. [Google Scholar] [CrossRef] [PubMed]
- Center of Disease Control and Prevention. Lyme Disease. 2018. Available online: https://www.cdc.gov/lyme/stats/humancases.html (accessed on 1 October 2019).
- Rosenberg, R. Vital Signs: Trends in reported vectorborne disease cases—United States and Territories, 2004–2016. MMWR Morb. Mortal. Wkly. Rep. 2018, 67. [Google Scholar] [CrossRef] [PubMed]
- Mac, S.; da Silva, S.R.; Sander, B. The economic burden of Lyme disease and the cost-effectiveness of Lyme disease interventions: A scoping review. PLoS ONE 2019, 14, e0210280. [Google Scholar] [CrossRef] [PubMed]
- Wormser, G.P.; Nadelman, R.B.; Dattwyler, R.J.; Dennis, D.T.; Shapiro, E.D.; Rush, T.J.; Rahn, D.W.; Coyle, P.K.; Persing, D.H.; Fish, D.; et al. Practice guidelines for the treatment of Lyme disease. Clin. Infect. Dis. 2000, 31, S1–S14. [Google Scholar] [CrossRef] [PubMed]
- Dattwyler, R.J.; Wormser, G.P.; Rush, T.J.; Finkel, M.F.; Schoen, R.T.; Grunwaldt, E.; Franklin, M.; Hilton, E.; Bryant, G.L.; Agger, W.A.; et al. A comparison of two treatment regimens of ceftriaxone in late Lyme disease. Wien. Klin. Wochenschr. 2005, 117, 393–397. [Google Scholar] [CrossRef] [PubMed]
- Donta, S.T. Tetracycline therapy for chronic Lyme disease. Clin. Infect. Dis. 1997, 25, S52–S56. [Google Scholar] [CrossRef]
- Eppes, S.C.; Childs, J.A. Comparative study of cefuroxime axetil versus amoxicillin in children with early Lyme disease. Pediatrics 2002, 109, 1173–1177. [Google Scholar] [CrossRef]
- Preac-Mursic, V.; Weber, K.; Pfister, H.W.; Wilske, B.; Gross, B.; Baumann, A.; Prokop, J. Survival of Borrelia burgdorferi in antibiotically treated patients with Lyme borreliosis. Infection 1989, 17, 355–359. [Google Scholar] [CrossRef]
- Liegner, K.B.; Rosenkilde, C.E.; Campbell, G.L.; Quan, T.J.; Dennis, D.T. Culture-confirmed treatment failure of cefotaxime and minocycline in a case of Lyme meningoencephalomyelitis in the United States. In Proceedings of the Program and Abstracts of the Fifth International Conference on Lyme Borreliosis, Arlington, VA, USA, 30 May–2 June 1992; Federation of American Societies for Experimental Biology: Bethesda, MD, USA, 1992; Volume A11. [Google Scholar]
- Liegner, K.B.; Shapiro, J.R.; Ramsay, D.; Halperin, A.J.; Hogrefe, W.; Kong, L. Recurrent erythema migrans despite extended antibiotic treatment with minocycline in a patient with persisting Borrelia burgdorferi infection. J. Am. Acad. Dermatol. 1993, 28, 312–314. [Google Scholar] [CrossRef]
- Steere, A.C.; Angelis, S.M. Therapy for Lyme arthritis: Strategies for the treatment of antibiotic-refractory arthritis. Arthritis Rheum. 2006, 54, 3079–3086. [Google Scholar] [CrossRef] [PubMed]
- Klempner, M.S.; Baker, P.J.; Shapiro, E.D.; Marques, A.; Dattwyler, R.J.; Halperin, J.J.; Wormser, G.P. Treatment trials for post-lyme disease symptoms revisited. Am. J. Med. 2013, 126, 665–669. [Google Scholar] [CrossRef] [PubMed]
- Post-Treatment Lyme Disease Syndrome. Centre of Disease Control and Prevention. Lyme Disease. 2019. Available online: https://www.cdc.gov/lyme/postlds/index.html (accessed on 25 September 2019).
- Hodzic, E.; Feng, S.; Holden, K.; Freet, K.J.; Barthold, S.W. Persistence of Borrelia burgdorferi following antibiotic treatment in mice. Antimicrob. Agents Chemother. 2008, 52, 1728–1736. [Google Scholar] [CrossRef] [PubMed]
- Hodzic, E.; Imai, D.; Feng, S.; Barthold, S.W. Resurgence of persisting non-cultivable Borrelia burgdorferi following antibiotic treatment in mice. PLoS ONE 2014, 9, e86907. [Google Scholar] [CrossRef] [PubMed]
- Straubinger, R.K.; Summers, B.A.; Chang, Y.F.; Appel, M.J. Persistence of Borrelia burgdorferi in experimentally infected dogs after antibiotic treatment. J. Clin. Microbiol. 1997, 35, 111–116. [Google Scholar] [PubMed]
- Berndtson, K. Review of evidence for immune evasion and persistent infection in Lyme disease. Int. J. Gen. Med. 2013, 6, 291–306. [Google Scholar] [CrossRef] [PubMed]
- Embers, M.E.; Barthold, S.W.; Borda, J.T.; Bowers, L.; Doyle, L.; Hodžić, E.; Jacobs, M.B.; Hasenkampf, N.R.; Martin, D.S.; Narasimhan, S.; et al. Persistence of Borrelia burgdorferi in Rhesus Macaques following antibiotic treatment of disseminated infection. PLoS ONE 2012, 7, e29914. [Google Scholar] [CrossRef]
- Embers, M.E.; Hasenkampf, N.R.; Jacobs, M.B.; Tardo, A.C.; Doyle-Meyers, L.A.; Philipp, M.T.; Hodzic, E. Variable manifestations, diverse seroreactivity and post-treatment persistence in non-human primates exposed to Borrelia burgdorferi by tick feeding. PLoS ONE 2017, 12, e0189071. [Google Scholar] [CrossRef]
- Crossland, N.A.; Alvarez, X.; Embers, M.E. Late disseminated Lyme disease: Associated pathology and spirochete persistence posttreatment in Rhesus Macaques. Am. J. Pathol. 2018, 188, 672–682. [Google Scholar] [CrossRef]
- Hodzic, E.; Imai, D.M.; Escobar, E. The generality of post-antimicrobial treatment persistence of Borrelia burgdorferi strains N40 and B31 in genetically susceptible and resistant mouse strains. Infect. Immun. 2019, IAI.00442-19. [Google Scholar] [CrossRef]
- Feng, J.; Li, T.; Yuan, Y.; Yee, R.; Zhang, Y. Biofilm/persister/stationary phase bacteria cause more severe disease than log phase bacteria—Biofilm Borrelia burgdorferi not only display more tolerance to Lyme antibiotics but also cause more severe pathology in a mouse arthritis model: Implications for understanding persistence, PTLDS and treatment failure. Discov. Med. 2019, 148, 125–138. [Google Scholar]
- Schmidli, J.; Hunziker, T.; Moesli, P.; Schaad, U.B. Cultivation of Borrelia burgdorferi from joint fluid three months after treatment of facial palsy due to Lyme borreliosis. J. Infect. Dis. 1988, 158, 905–906. [Google Scholar] [CrossRef] [PubMed]
- Häupl, T.; Hahn, G.; Rittig, M.; Krause, A.; Schoerner, C.; Schönherr, U.; Kalden, J.R.; Burmester, G.R. Persistence of Borrelia burgdorferi in ligamentous tissue from a patient with chronic Lyme borreliosis. Arthritis. Rheum. 1993, 36, 1621–1626. [Google Scholar] [CrossRef] [PubMed]
- Battafarano, D.F.; Combs, J.A.; Enzenauer, R.J.; Fitzpatrick, J.E. Chronic septic arthritis caused by Borrelia burgdorferi. Clin. Orthop. Relat. Res. 1993, 297, 238–241. [Google Scholar]
- Middelveen, M.J.; Sapi, E.; Burke, J.; Filush, K.R.; Franco, A.; Fesler, M.C.; Stricker, R.B. Persistent Borrelia infection in patients with ongoing symptoms of Lyme disease. Healthcare 2018, 6, 33. [Google Scholar] [CrossRef]
- Brorson, O.; Brorson, S.H. Transformation of cystic forms of Borrelia burgdorferi to normal, mobile spirochetes. Infection 1997, 25, 240–246. [Google Scholar] [CrossRef]
- MacDonald, A.B. Spirochetal cyst forms in neurodegenerative disorders, ... hiding in plain sight. J. Med. Hypotheses 2006, 67, 819–832. [Google Scholar] [CrossRef]
- Brorson, Ø.; Brorson, S.H.; Scythes, J.; MacAllister, J.; Wier, A.; Margulis, L. Destruction of spirochete Borrelia burgdorferi round-body propagules (RBs) by the antibiotic tigecycline. Proc. Natl. Acad. Sci. USA 2009, 106, 18656–18661. [Google Scholar] [CrossRef]
- Barthold, S.W.; Hodzic, E.; Imai, D.M.; Feng, S.; Yang, X.; Luft, B.J. Ineffectiveness of tigecycline against persistent Borrelia burgdorferi. Antimicrob. Agents. Chemother. 2010, 54, 643–651. [Google Scholar] [CrossRef]
- Costerton, J.W.; Stewart, P.S.; Greenberg, E.P. Bacterial biofilms: A common cause of persistent infections. Science 1999, 284, 1318–1322. [Google Scholar] [CrossRef]
- Sutherland, I. Biofilm exopolysaccharides: A strong and sticky framework. Microbiology 2001, 147, 3–9. [Google Scholar] [CrossRef] [PubMed]
- Lopes, S.P.; Ceri, H.; Azevedo, N.F.; Pereira, M.O. Antibiotic resistance of mixed biofilms in cystic fibrosis: Impact of emerging microorganisms on treatment of infection. Int. J. Antimicrob. Agents 2012, 40, 260–263. [Google Scholar] [CrossRef] [PubMed]
- Römling, U.; Balsalobre, C. Biofilm infections, their resilience to therapy and innovative treatment strategies. J. Intern. Med. 2012, 272, 541–561. [Google Scholar] [CrossRef] [PubMed]
- Sun, F.; Qu, F.; Ling, Y.; Mao, P.; Xia, P.; Chen, H.; Zhou, D. Biofilm-associated infections: Antibiotic resistance and novel therapeutic strategies. Future Microbiol. 2013, 8, 877–886. [Google Scholar] [CrossRef] [PubMed]
- Hall, C.W.; Mah, T.F. Molecular mechanisms of biofilm-based antibiotic resistance and tolerance in pathogenic bacteria. FEMS Microbiol. Rev. 2017, 41, 276–301. [Google Scholar] [CrossRef]
- Algburi, A.; Comito, N.; Kashtanov, D.; Leon, M.T.; Dicks, L.M.T.; Chikindas, M.L. Control of biofilm formation: Antibiotics and beyond. App. Environ. Microbiol. 2017, 83, e02508-16. [Google Scholar] [CrossRef]
- Ciofu, O.; Tolker-Nielsen, T. Tolerance and resistance of Pseudomonas aeruginosa biofilms to antimicrobial agents—How P. aeruginosa can escape antibiotics. Front. Microbiol. 2019, 10, 913. [Google Scholar] [CrossRef] [PubMed]
- Sapi, E.; Bastian, S.L.; Mpoy, C.M.; Scott, S.; Rattelle, A.; Pabbati, N.; Poruri, A.; Burugu, D.; Theophilus, P.A.S.; Pham, T.V.; et al. Characterization of biofilm formation by Borrelia burgdorferi in vitro. PLoS ONE 2012, 7, e48277. [Google Scholar] [CrossRef] [PubMed]
- Timmaraju, V.A.; Theophilus, P.A.S.; Balasubramanian, K.; Shakih, S.; Luecke, D.F.; Sapi, E. Biofilm formation by Borrelia sensu lato. FEMS Microbiol. Lett. 2015, 362, fnv120. [Google Scholar] [CrossRef][Green Version]
- Sapi, E.; Balasubramanian, K.; Poruri, A.; Maghsoudlou, J.S.; Socarras, K.M.; Timmaraju, A.V.; Filush, K.R.; Gupta, K.; Shaikh, S.; Theophilus, P.A.S.; et al. Evidence of in vivo existence of Borrelia biofilm in Borrelial lymphocytomas. Eur. J. Microbiol. Immunol. 2016, 6, 9–24. [Google Scholar] [CrossRef]
- Sapi, E.; Kaur, N.; Anyanwu, S.; Datar, A.; Patel, S.; Rossi, J.M.; Stricker, R.B. Evaluation of in vitro antibiotic susceptibility of different morphological forms of Borrelia burgdorferi. Infect. Drug. Resist. 2011, 4, 97–113. [Google Scholar] [PubMed]
- Theophilus, P.A.S.; Victoria, M.J.; Socarras, K.M.; Filush, K.R.; Gupta, K.; Luecke, D.F.; Sapi, E. Effectiveness of Stevia rebaudiana whole leaf extract against the various morphological forms of Borrelia burgdorferi in vitro. Eur. J. Microbiol. Immunol. 2015, 5, 268–280. [Google Scholar] [CrossRef] [PubMed]
- Soccaras, K.M.; Theophilus, P.A.S.; Torres, J.P.; Gupta, K.; Sapi, E. Antimicrobial activity of bee venom and mellittin against Borrelia. Antibiotics 2017, 6, 31. [Google Scholar] [CrossRef] [PubMed]
- Liegner, K.B. Lyme Disease: The sensible pursuit of answers. (Guest commentary). J. Clin. Microbiol. 1993, 31, 1961–1963. [Google Scholar] [PubMed]
- Liegner, K.B.; Duray, P.; Agricola, M.; Rosenkilde, C.; Yannuzzi, L.; Ziska, M.; Tilton, R.; Hulinska, D.; Hubbard, J.; Fallon, B. Lyme disease and the clinical spectrum of antibiotic-responsive chronic meningoencephalomyelitides. J. Spirochetal Tick-Borne Dis. 1997, 4, 61–73. [Google Scholar]
- Liegner, K.B. In the Crucible of Chronic Lyme Disease. Collected Writings & Associated Materials; Library of Congress Control Number: 2015911615; Xlibris: Bloomington, IN, USA, 2015. [Google Scholar]
- Eisendle, K.; Grabner, T.; Zelger, B. Focus floating microscopy: “Gold Standard” for cutaneous Borreliosis? Am. J. Clin. Pathol. 2007, 127, 213–222. [Google Scholar] [CrossRef] [PubMed]
- Marques, A.R. Laboratory diagnosis of Lyme disease: Advances and challenges. Infect. Dis. Clin. N. Am. 2015, 29, 295–307. [Google Scholar] [CrossRef] [PubMed]
- Bispo, P.J.; Haas, W.; Gilmore, M.S. Biofilms in infections of the eye. Pathogens 2015, 4, 111–136. [Google Scholar] [CrossRef]
- González, M.J.; Robino, L.; Iribarnegaray, V.; Zunino, P.; Paola Scavone, P. Effect of different antibiotics on biofilm produced by uropathogenic Escherichia coli isolated from children with urinary tract infection. Pathog. Dis. 2017, 75, ftx053. [Google Scholar] [CrossRef]
- Junka, A.; Szymczyk, P.; Ziółkowski, G.; Karuga-Kuzniewska, E.; Smutnicka, D.; Bil-Lula, I.; Bartoszewicz, M.; Mahabady, S.; Sedghizadeh, P.P. Bad to the bone: On in vitro and ex vivo microbial biofilm ability to directly destroy colonized bone surfaces without participation of host immunity or osteoclastogenesis. PLoS ONE 2017, 12, e0169565. [Google Scholar] [CrossRef]
- Guerrero, M.L.F.; López, J.J.G.; Goyenechea, A.; Fraile, J.; de Górgolas, M. Endocarditis caused by Staphylococcus aureus. A reappraisal of the epidemiologic, clinical, and pathologic manifestations with analysis of factors determining outcome. Medicine 2009, 88, 1–22. [Google Scholar] [CrossRef] [PubMed]
- Chao, Y.; Marks, L.R.; Pettigrew, M.M.; Hakansson, A.P. Streptococcus pneumoniae biofilm formation and dispersion during colonization and disease. Front. Cell Infect. Microbiol. 2015, 4, 194. [Google Scholar] [CrossRef] [PubMed]
- Moser, C.; Pedersen, H.T.; Lerche, C.J.; Kolpen, M.; Line, L.; Thomsen, K.; Høiby, N.; Jensen, P.Ø. Biofilms and host response—Helpful or harmful. Apmis 2017, 125, 320–338. [Google Scholar] [CrossRef] [PubMed]
- Ciofu, O.; Rojo-Molinero, E.; Macià, M.D.; Oliver, A. Antibiotic treatment of biofilm infections. Apmis 2017, 125, 304–319. [Google Scholar] [CrossRef] [PubMed]
- Bockenstedt, L.K.; Gonzalez, D.G.; Haberman, A.M.; Belperron, A.A. Spirochete antigens persist near cartilage after murine Lyme borreliosis therapy. J. Clin. Investig. 2012, 122, 2652–2660. [Google Scholar] [CrossRef] [PubMed]
- Jutras, B.L.; Lochhead, R.B.; Kloos, Z.A.; Biboy, J.; Strle, K.; Booth, C.J.; Govers, S.K.; Gray, J.; Schumann, P.; Vollmer, W.; et al. Borrelia burgdorferi peptidoglycan is a persistent antigen in patients with Lyme arthritis. Proc. Natl. Acad. Sci. USA 2019, 116, 13498–13507. [Google Scholar] [CrossRef] [PubMed]
- Dalldorf, F.G.; Cromartie, W.J.; Anderle, S.K.; Clark, R.L.; Schwab, J.H. The relation of experimental arthritis to the distribution of streptococcal cell wall fragments. Am. J. Pathol. 1980, 100, 383–402. [Google Scholar] [PubMed]
- Lo, Y.M.; Zhang, J.; Leung, T.N.; Lau, T.K.; Chang, A.M.; Hjelm, N.M. Rapid clearance of fetal DNA from maternal plasma. Am. J. Hum. Genet. 1999, 64, 218–224. [Google Scholar] [CrossRef] [PubMed]
- Malawista, S.E.; Barthold, S.W.; Persing, D.H. Fate of Borrelia burgdorferi DNA in tissues of infected 537 mice after antibiotic treatment. J. Infect. Dis. 1994, 170, 1312–1316. [Google Scholar] [CrossRef] [PubMed]
- Lazarus, J.J.; McCarter, A.L.; Neifer-Sadhwani, K.; Wooten, R.M. ELISA-based measurement of antibody responses and PCR-based detection profiles can distinguish between active infection and early clearance of Borrelia burgdorferi. Clin. Dev. Immunol. 2012, 2012, 138069. [Google Scholar] [CrossRef]
- Meurers, B.; Kohlhepp, W.; Gold, R.; Rohrbach, E.; Mertens, H.G. Histopathological findings in the central and peripheral nervous systems in neuroborreliosis. A report of three cases. J. Neurol. 1990, 237, 113–116. [Google Scholar] [CrossRef] [PubMed]
- Miklossy, J.; Kuntzer, T.; Bogousslavky, J.; Regli, F.; Janzer, R.C. Meningovascular form of neuroborreliosis: Similarities between neuropathological findings in a case of Lyme disease and those occurring in tertiary neurosyphilis. Acta Neuropathol. 1990, 80, 568–572. [Google Scholar] [CrossRef] [PubMed]
- Oksi, J.; Kalimo, H.; Marttila, R.J.; Marjamaki, M.; Sonninen, P.; Nikoskelainen, J.; Viljanen, M.K. Inflammatory brain changes in Lyme borreliosis: A report on three patients and review of literature. Brain 1996, 119, 2143–2154. [Google Scholar] [CrossRef] [PubMed]
- Uldry, P.A.; Regli, F.; Bogousslavsky, J. Cerebral angiopathy and recurrent strokes following Borrelia burgdorferi infection. J. Neurol. Neurosurg Psychiatry 1987, 50, 1703–1704. [Google Scholar] [CrossRef] [PubMed]
- Olsson, J.; Zbornikova, V. Neuroborreliosis simulating a progressive stroke. Acta. Neurol. Scand. 1990, 81, 471–474. [Google Scholar] [CrossRef] [PubMed]
- Miklossy, J. Biology and neuropathology of dementia in syphilis and Lyme disease. Handb. Clin. Neurol. 2008, 89, 825–844. [Google Scholar] [CrossRef] [PubMed]
- Tracy, K.E.; Baumgarth, N. Borrelia burgdorferi manipulates innate and adaptive immunity to establish persistence in rodent reservoir hosts. Front. Immunol. 2017, 8, 116. [Google Scholar] [CrossRef] [PubMed]
- González, J.F.; Hahn, M.M.; Gunn, J.S. Chronic biofilm-based infections: Skewing of the immune response. Pathog. Dis. 2018, 76, fty023. [Google Scholar] [CrossRef]
- Cai, S.; Li, Y.; Wang, K.; Cen, Y.; Lu, H.; Dong, B.; Chen, Y.; Kong, J. Pathogenic effects of biofilm on Pseudomonas aeruginosa pulmonary infection and its relationship to cytokines. Med. Sci. Monit. 2016, 4869–4874. [Google Scholar] [CrossRef]
- Gurjala, A.N.; Geringer, M.R.; Seth, A.K.; Hong, S.J.; Smeltzer, M.S.; Galiano, R.D.; Leung, K.P.; Mustoe, T.A. Development of a novel, highly quantitative in vivo model for the study of biofilm-impaired cutaneous wound healing. Wound Repair Regen. 2011, 19, 400–410. [Google Scholar] [CrossRef]
- Seth, A.; Geringer, M.; Gurjala, A.; Hong, S.; Galiano, R.; Leung, K.; Mustoe, T. Treatment of Pseudomonas aeruginosa biofilm- Infected wounds with clinical wound strategies: A quantitative study using an in vivo rabbit ear model. Plast. Reconstr. Surg. 2014, 129, 262e–274e. [Google Scholar] [CrossRef] [PubMed]
- Hu, H.; Jacombs, A.; Vickery, K.; Merten, S.L.; Pennington, D.G.; Deva, A.K. Chronic biofilm infection in breast implants is associated with an increased T-cell lymphocytic infiltrate: Implications for breast implant-associated lymphoma. Plast. Reconst. Surg. 2015, 135, 319–329. [Google Scholar] [CrossRef] [PubMed]


| Organ | Number of IHC Stained Slides | Number of Biofilms per Slide ± SD | Size of the Biofilm (µm) |
|---|---|---|---|
| Brain | 250 | 0–4 ± 1.2 | 20–150 |
| Heart | 155 | 0–6 ± 1.5 | 20–100 |
| Kidney | 165 | 0–4 ± 1.1 | 20–200 |
| Liver | 180 | 0–7 ± 1.6 | 20–300 |
| Organ | Number of IHC Stained Slides | Number of Biofilms per Slide ± SD | Size of the Biofilm (µm) |
|---|---|---|---|
| Brain | 210 | 0–3 ± 1.1 | 20–150 |
| Heart | 130 | 0–4 ± 1.2 | 20–100 |
| Kidney | 145 | 0–4 ± 1.1 | 20–100 |
| Liver | 150 | 0–6 ± 1.5 | 20–300 |
| Whole Genome Sequencing Reads For Borrelia Burgdorferi Sensu Stricto Strains | Gene/Region | Coverage | Identity | E value |
|---|---|---|---|---|
| AGCTTTGCTATCTCAAATGTCAAAGACTCTATCTCTTCTTGAGAAAGATACTTAAACACTTTAGAAGAGATTTCAGAACCTATTGAAACCAACAAAATAG | Flagella switch protein (fliG) | 100% | 100% | 3e−42 |
| AAAACTATTAAAATTACCCTTAACAATTGCAATGTAAACTTTATTTGTTCTTTTATCTTTAAACTGCTGAGCTAAAAATCTTAAGGTGCTAATGTTTTTT | Helicase protein(Yfi) | 100% | 99% | 1e−40 |
| AAGGTCTTATGCCAATAAAAATCCAATCACAGAATACAAAGAAGAGGGATTTTCAATATTTAGCGAGCTTATTAAAGATATTAAAGTTTCTACCATAAGG | SecA protein | 100% | 100% | 3e−42 |
| AAGAAAAGATTTTCCTATTTTAAATAAAAAATTTGACAATAAGTATATAATTTACTTTGATAATGCAGCAACCTCTCAAAAGCCCAAAAACGTAATTTAT | M11p aminotransferase (nifS) | 100% | 100% | 3e−35 |
| ATTACAGCGTTACTGTTTTAATGAAGCAATTGCCATACTATCAAAACCAATTAGCATTTATCATGAAAGATGTGCTTAGTCGATATAAAGTTGATAGTTC | Left subtelomeric chromosomal region | 100% | 100% | 3e−42 |
| TCATTTCAAAAACATGTATTTCTGAAAGCAAAAAATACAACAGCAAAAAAACTACTACCAAACTGCTTGTAAATCCAATAATTTCATTATAAGCTCTTGT | Left subtelomeric chromosomal region | 100% | 100% | 3e−42 |
| TTGAATATTTTGAAATAACTTATGAGGCTTATGCTCCTTATGGAGTGGCTCTAATGATTAAATGCTTAACGGATAATAAAAACAGAACCTCTAGCGATGT | Intergenic region | 100% | 100% | 3e−42 |
| AAGAAGAATTAGAAGTTTGCGAGCTAAATGGAAAAGATTGGACATTAAAATTTAAAAAACCGCTAAAAGCATATAAATTCTTAAAATCCGTAGGAAG | Intergenic region | 99% | 100% | 1e−40 |
| TTACTAAAACTTCAGAAGAGCCCCTAATGCTTGTTTTAATGATAGGCATTATTTCTTTGGCCTGTTGATAGTCTATGTTTGTGTATGTATTGTTATTCAT | Intergenic region | 100% | 99% | 1e−40 |
| AATCTTAAAATTAAAAGATAACGACAAATTTAAATTTGGTATTCTTGGAGAAAAAAACATTTACCACTGCATTTACAAAAAAGATAAAAAACTATTTTTC | Intergenic region | 100% | 100% | 3e−42 |
| TAAGTTATAATTGAGGAATAATAGCAAATATTTTAACTTTTTGGTATAAATTACTACTAGATTTATATGTTAAGTTTTGCGAGGTATTTAAATGGCAGTA | Intergenic region | 100% | 99% | 1e−40 |
| CAAGAGTTAGTATTGGCCTTAAAAAACGATAAAGTTGATTATATATATGGTGATTGCAAGACTTTACATTATATTGCAAATAACTTTTTAAGTGA | Intergenic region | 100% | 100% | 1e−39 |
| CTTGAGGGATTTAAAGAAGTTAAGCCTGTAGTATTCTCTTCAGTTTATCCGTTGATGCTAATCAATATGATGATCTTTTAAGGGCAATGGATAGATTAA | Intergenic region | 100% | 99% | 1e−40 |
| TTTATACTAATAAACTTTCAATTTCTTTTGTGAAGATATTGAAAGAAATCCATGTCTGTTGAGAAAATTTTTCTTTTATCTTTTAATACTGCTTTATAGC | Intergenic region | 100% | 100% | 3e−42 |
© 2019 by the authors. Licensee MDPI, Basel, Switzerland. This article is an open access article distributed under the terms and conditions of the Creative Commons Attribution (CC BY) license (http://creativecommons.org/licenses/by/4.0/).
Share and Cite
Sapi, E.; Kasliwala, R.S.; Ismail, H.; Torres, J.P.; Oldakowski, M.; Markland, S.; Gaur, G.; Melillo, A.; Eisendle, K.; Liegner, K.B.; et al. The Long-Term Persistence of Borrelia burgdorferi Antigens and DNA in the Tissues of a Patient with Lyme Disease. Antibiotics 2019, 8, 183. https://doi.org/10.3390/antibiotics8040183
Sapi E, Kasliwala RS, Ismail H, Torres JP, Oldakowski M, Markland S, Gaur G, Melillo A, Eisendle K, Liegner KB, et al. The Long-Term Persistence of Borrelia burgdorferi Antigens and DNA in the Tissues of a Patient with Lyme Disease. Antibiotics. 2019; 8(4):183. https://doi.org/10.3390/antibiotics8040183
Chicago/Turabian StyleSapi, Eva, Rumanah S. Kasliwala, Hebo Ismail, Jason P. Torres, Michael Oldakowski, Sarah Markland, Gauri Gaur, Anthony Melillo, Klaus Eisendle, Kenneth B. Liegner, and et al. 2019. "The Long-Term Persistence of Borrelia burgdorferi Antigens and DNA in the Tissues of a Patient with Lyme Disease" Antibiotics 8, no. 4: 183. https://doi.org/10.3390/antibiotics8040183
APA StyleSapi, E., Kasliwala, R. S., Ismail, H., Torres, J. P., Oldakowski, M., Markland, S., Gaur, G., Melillo, A., Eisendle, K., Liegner, K. B., Libien, J., & Goldman, J. E. (2019). The Long-Term Persistence of Borrelia burgdorferi Antigens and DNA in the Tissues of a Patient with Lyme Disease. Antibiotics, 8(4), 183. https://doi.org/10.3390/antibiotics8040183