Fragment-Based Discovery of Inhibitors of the Bacterial DnaG-SSB Interaction


 , and
, and 
Abstract
1. Introduction
2. Results and Discussion
2.1. Screening of Fragment Libraries
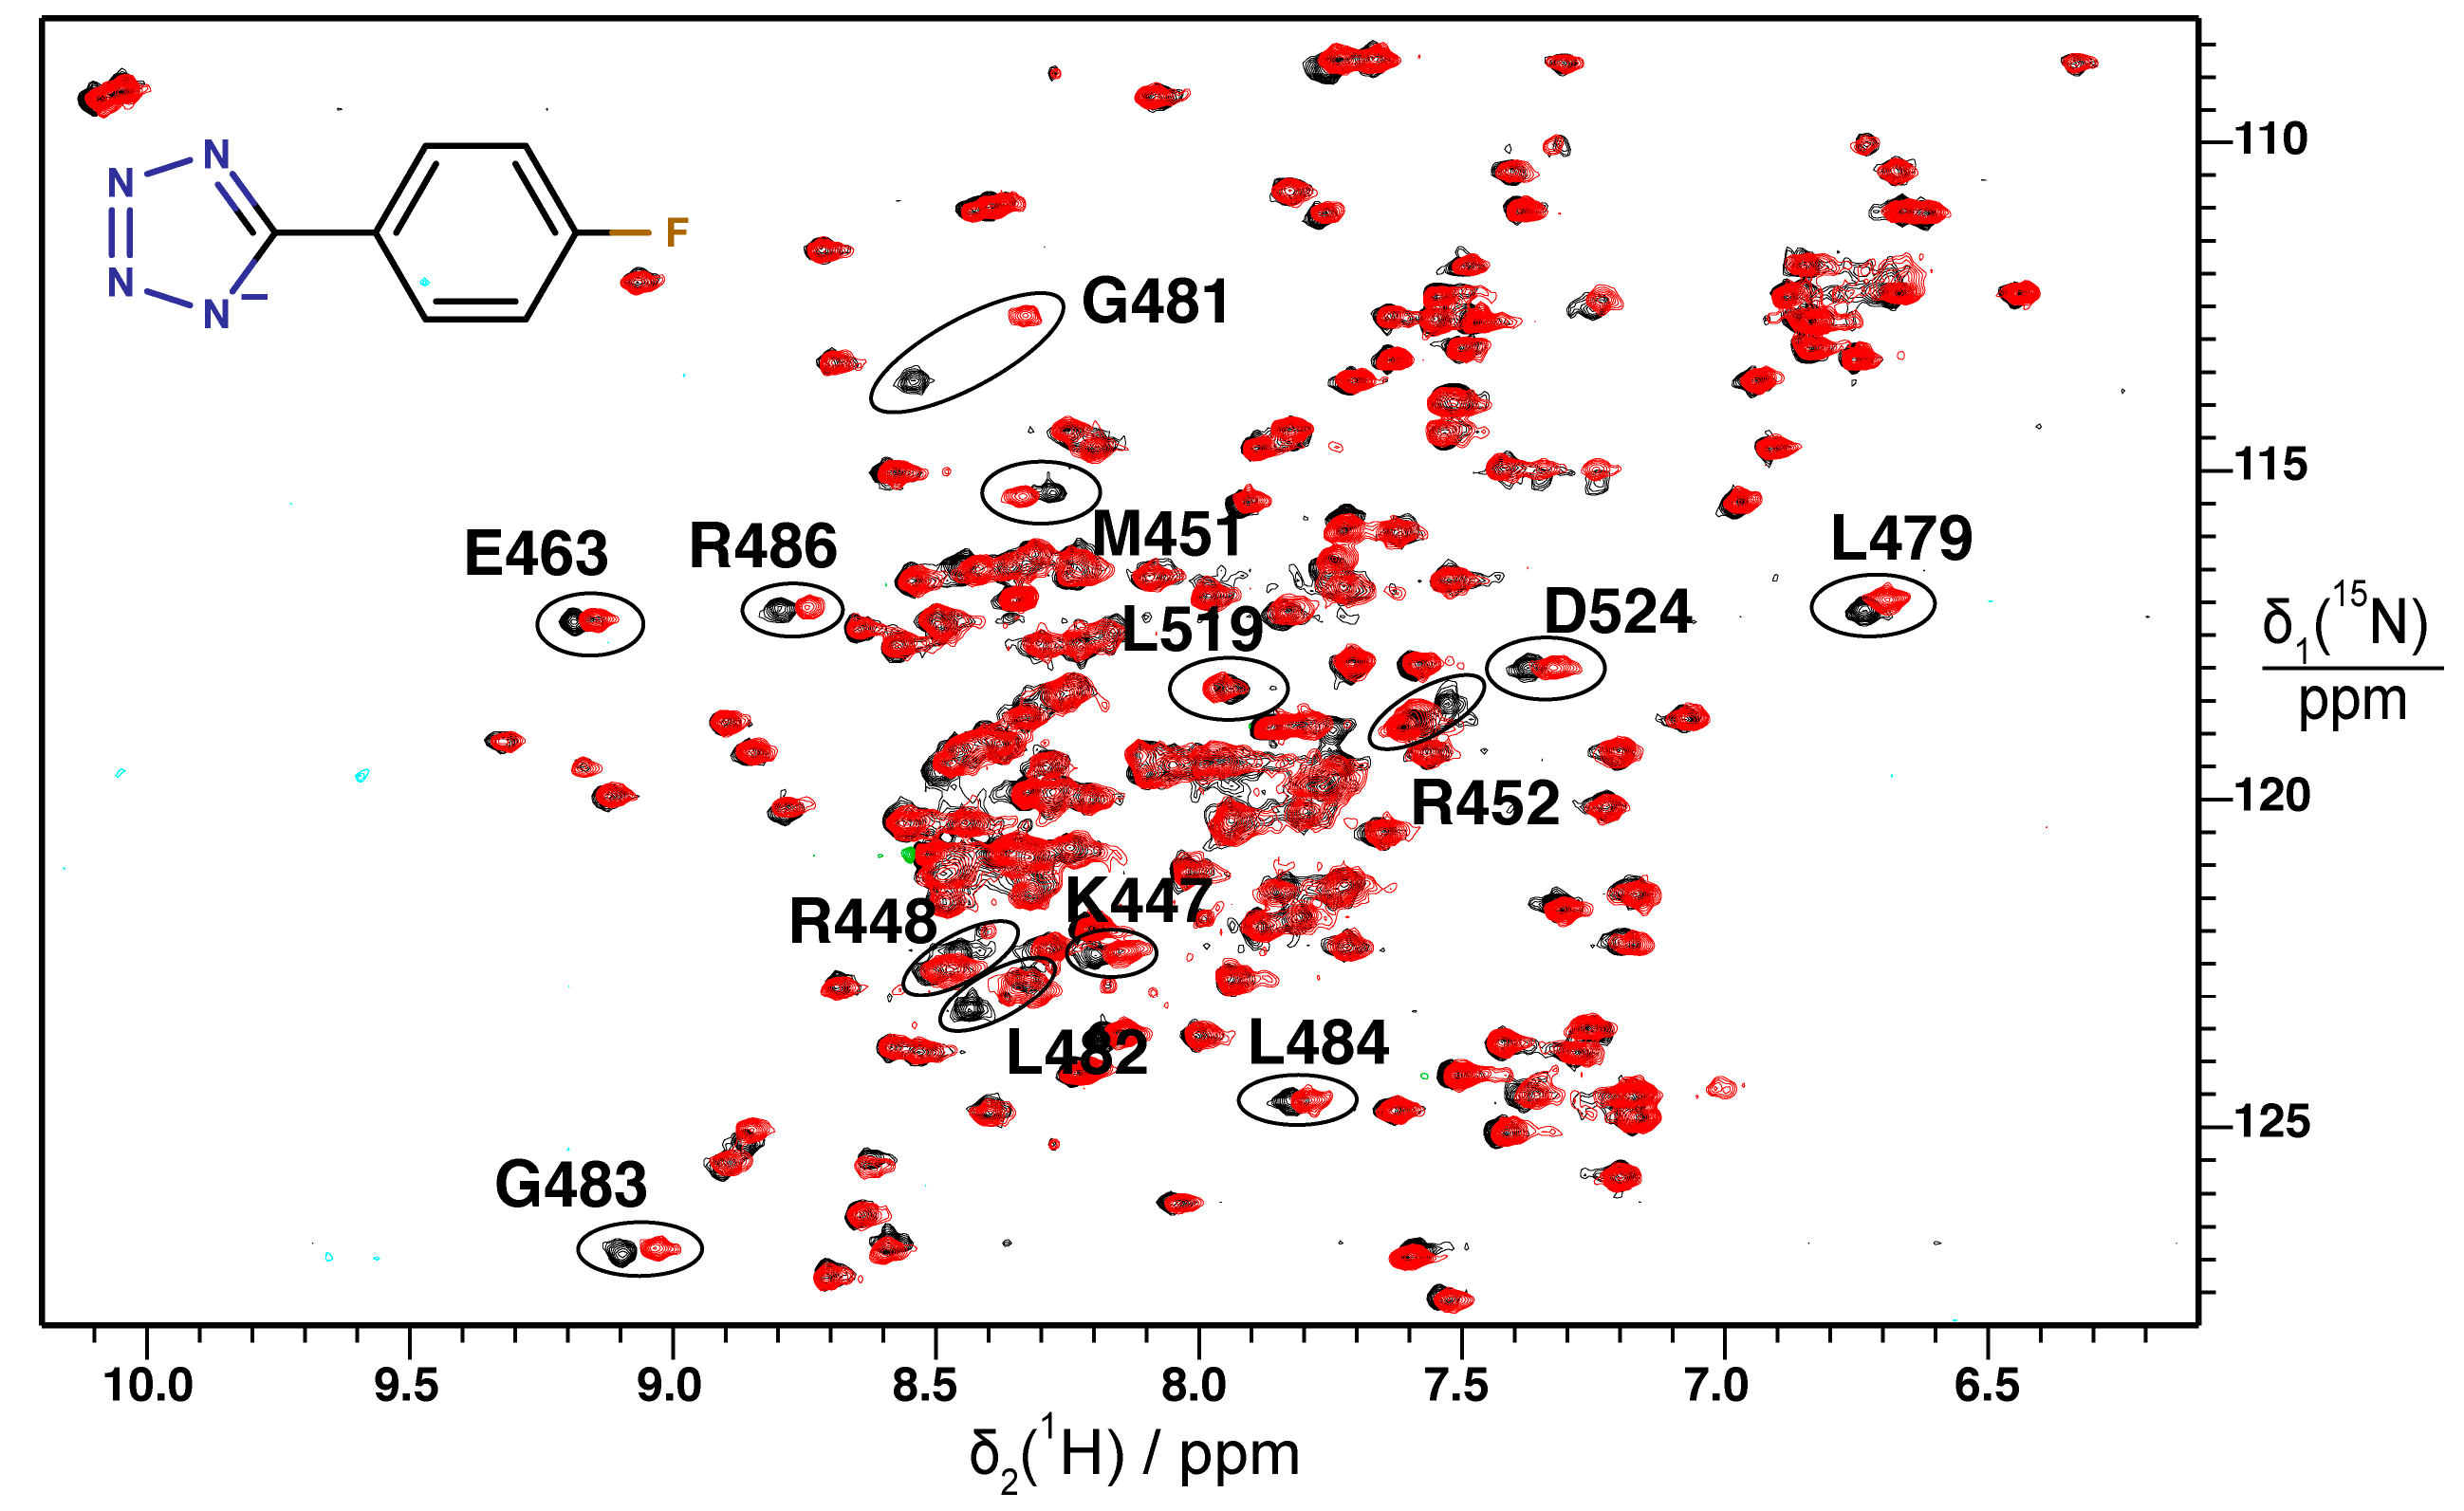
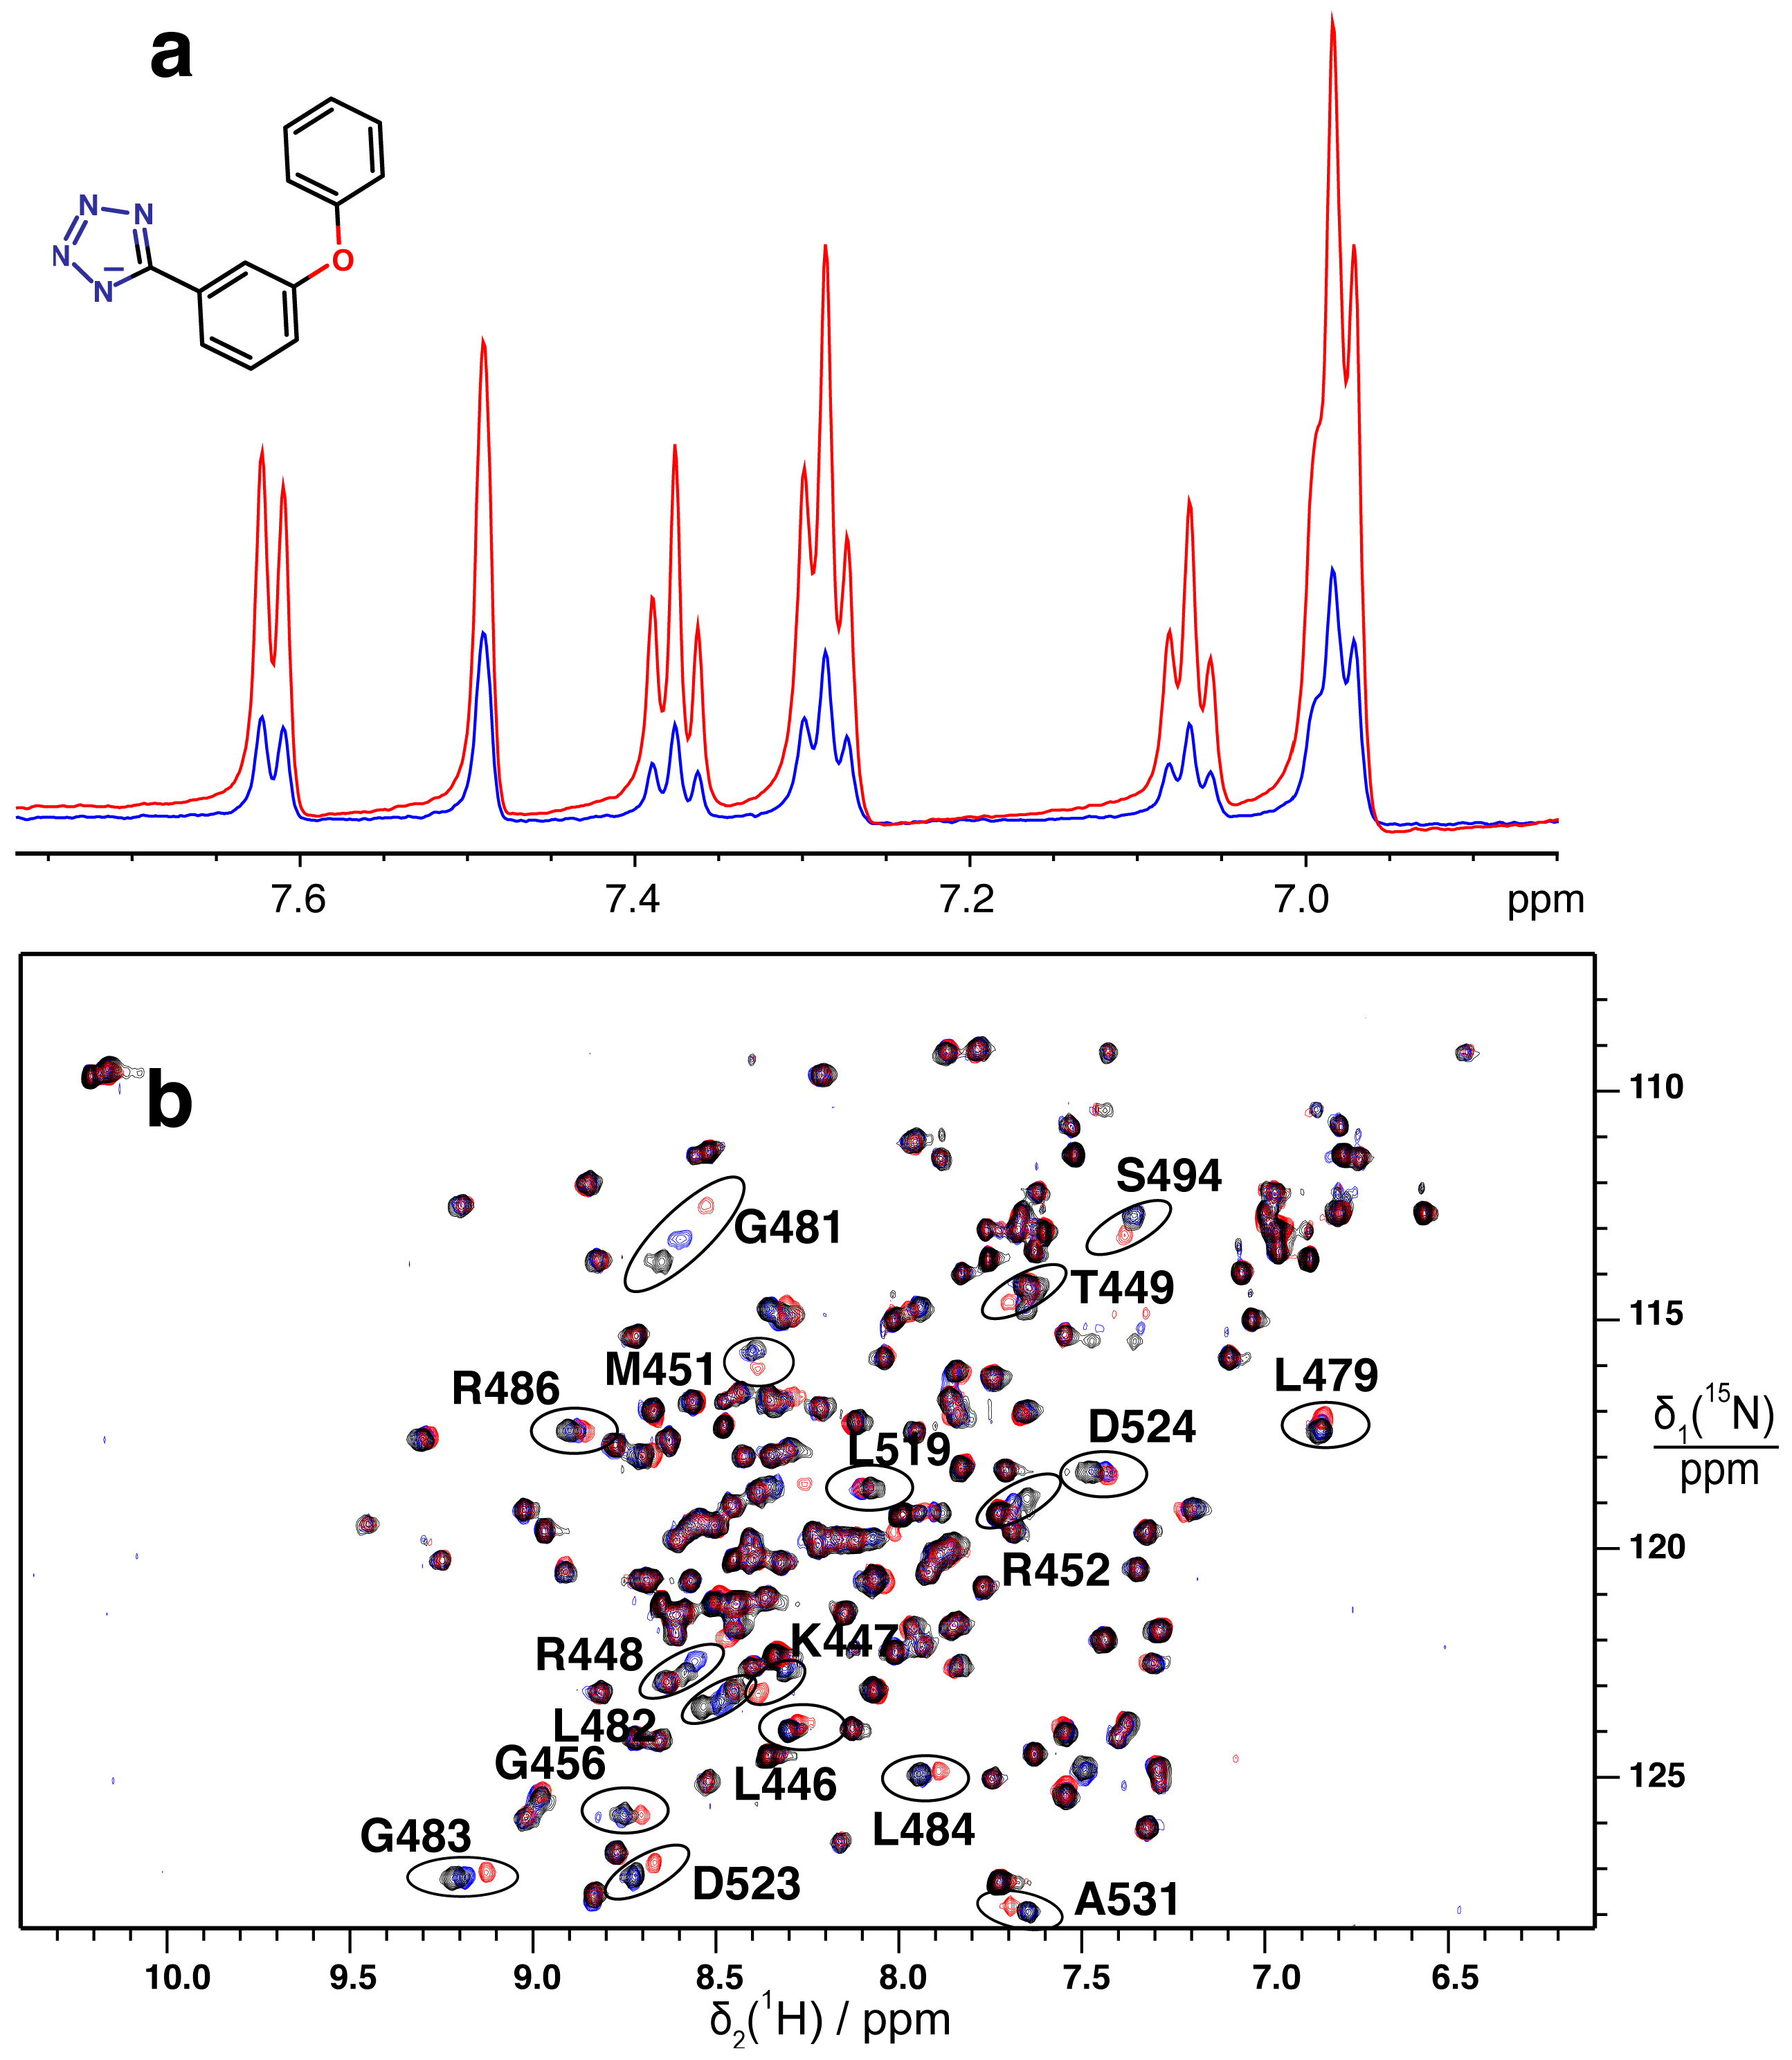
2.2. Validation of Fragment Binding by 2D NMR
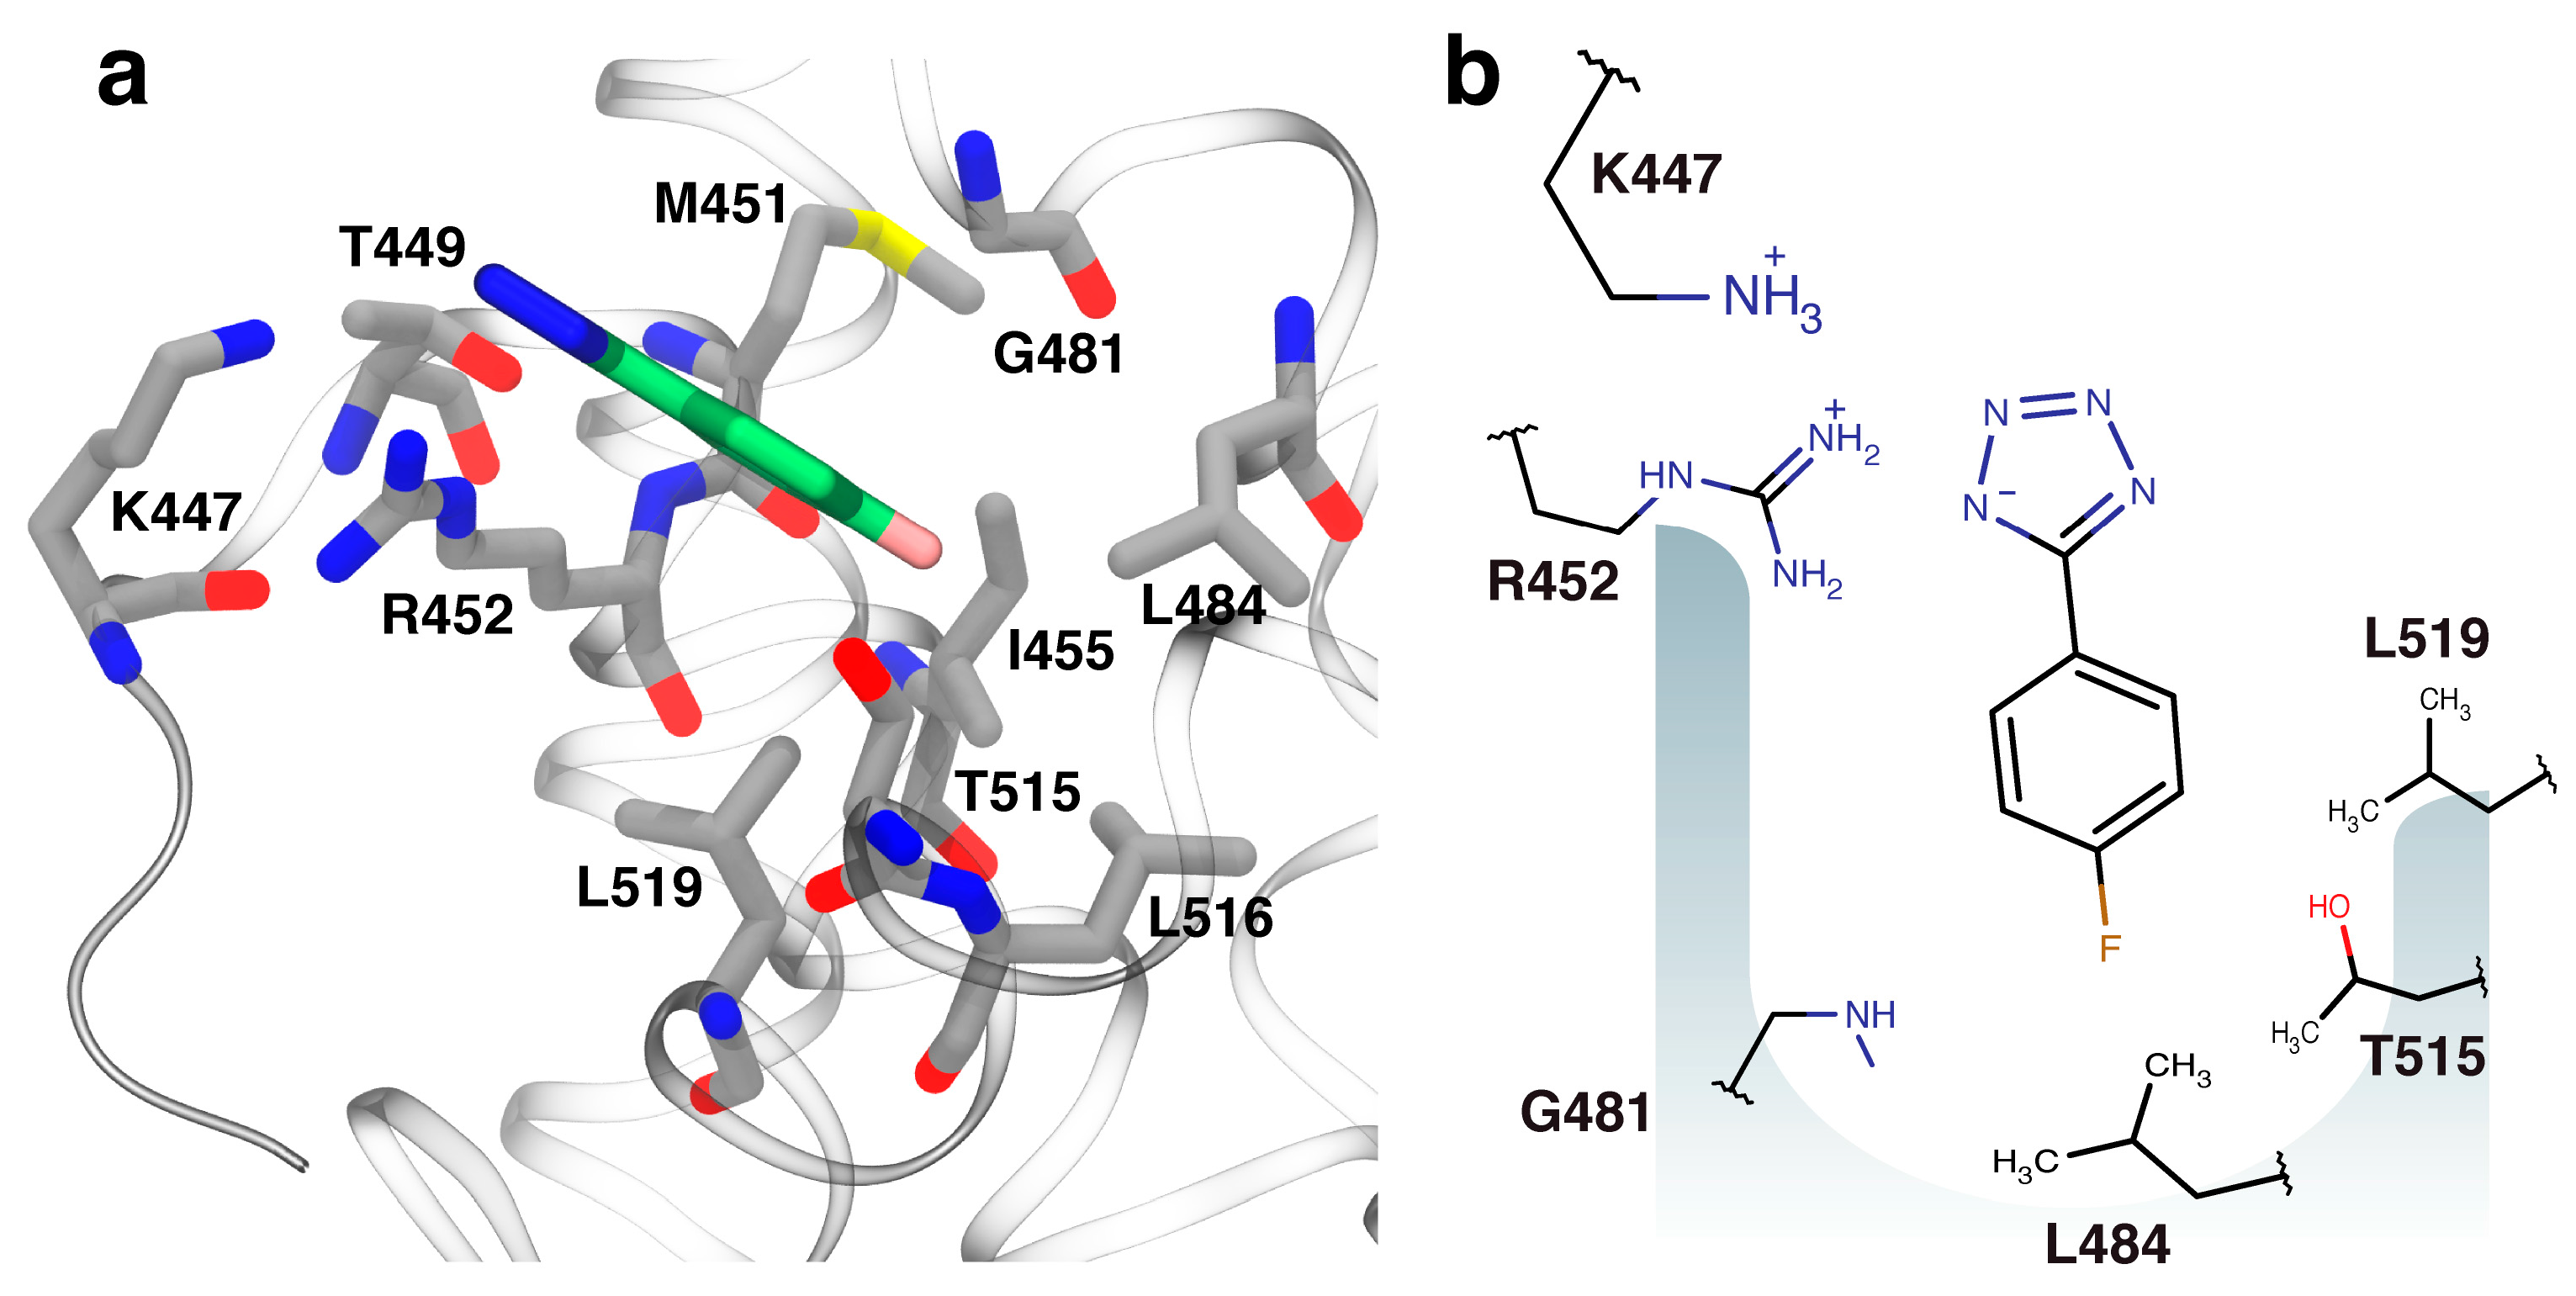
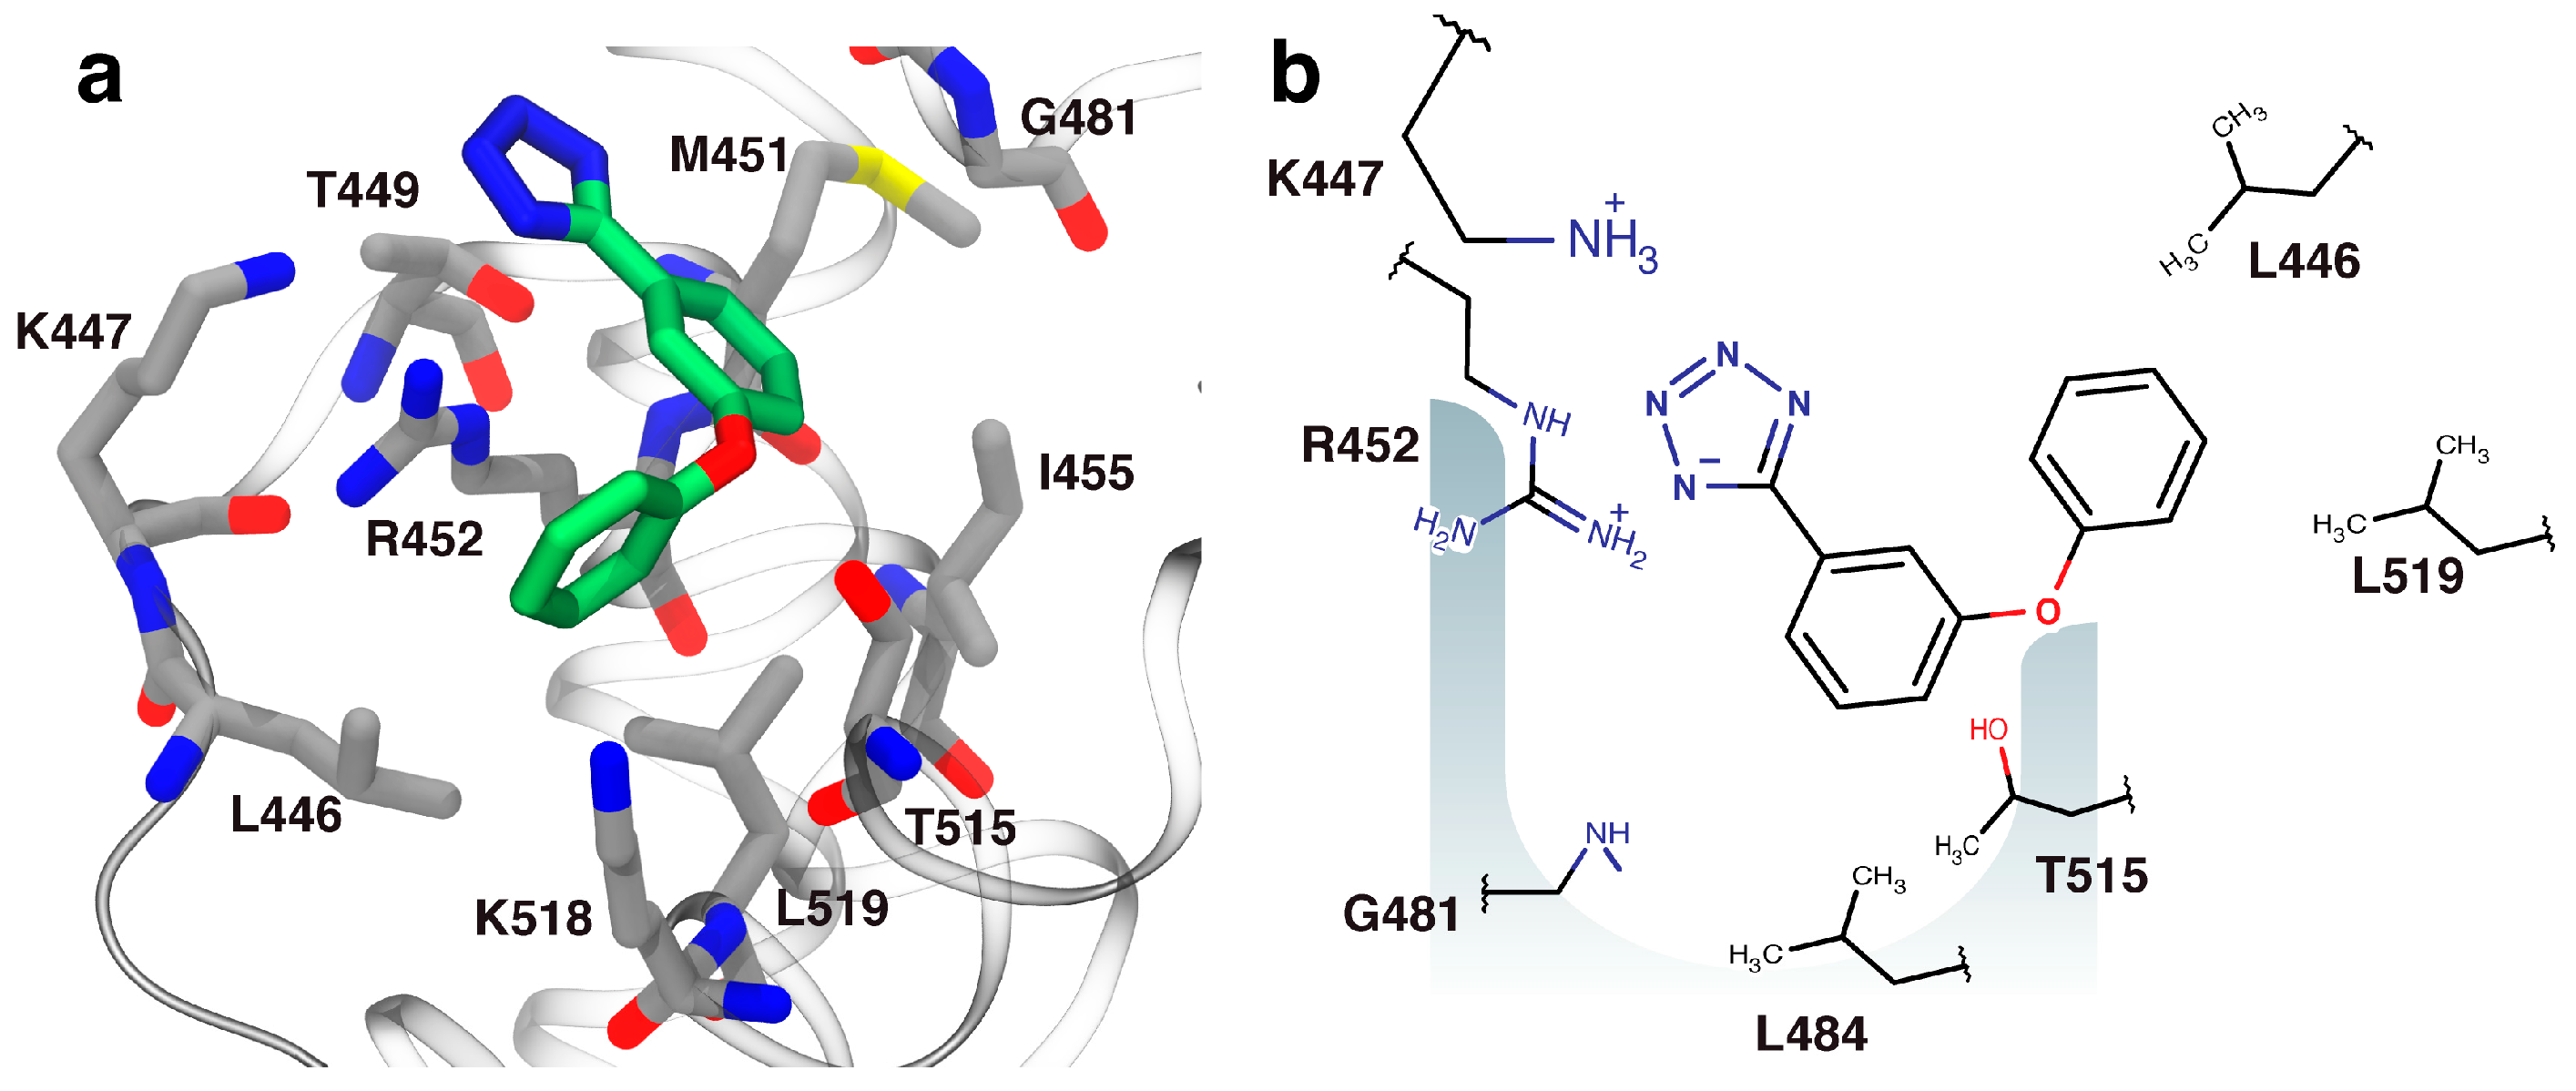
2.3. Orientation of Identified Hits Using Molecular Docking
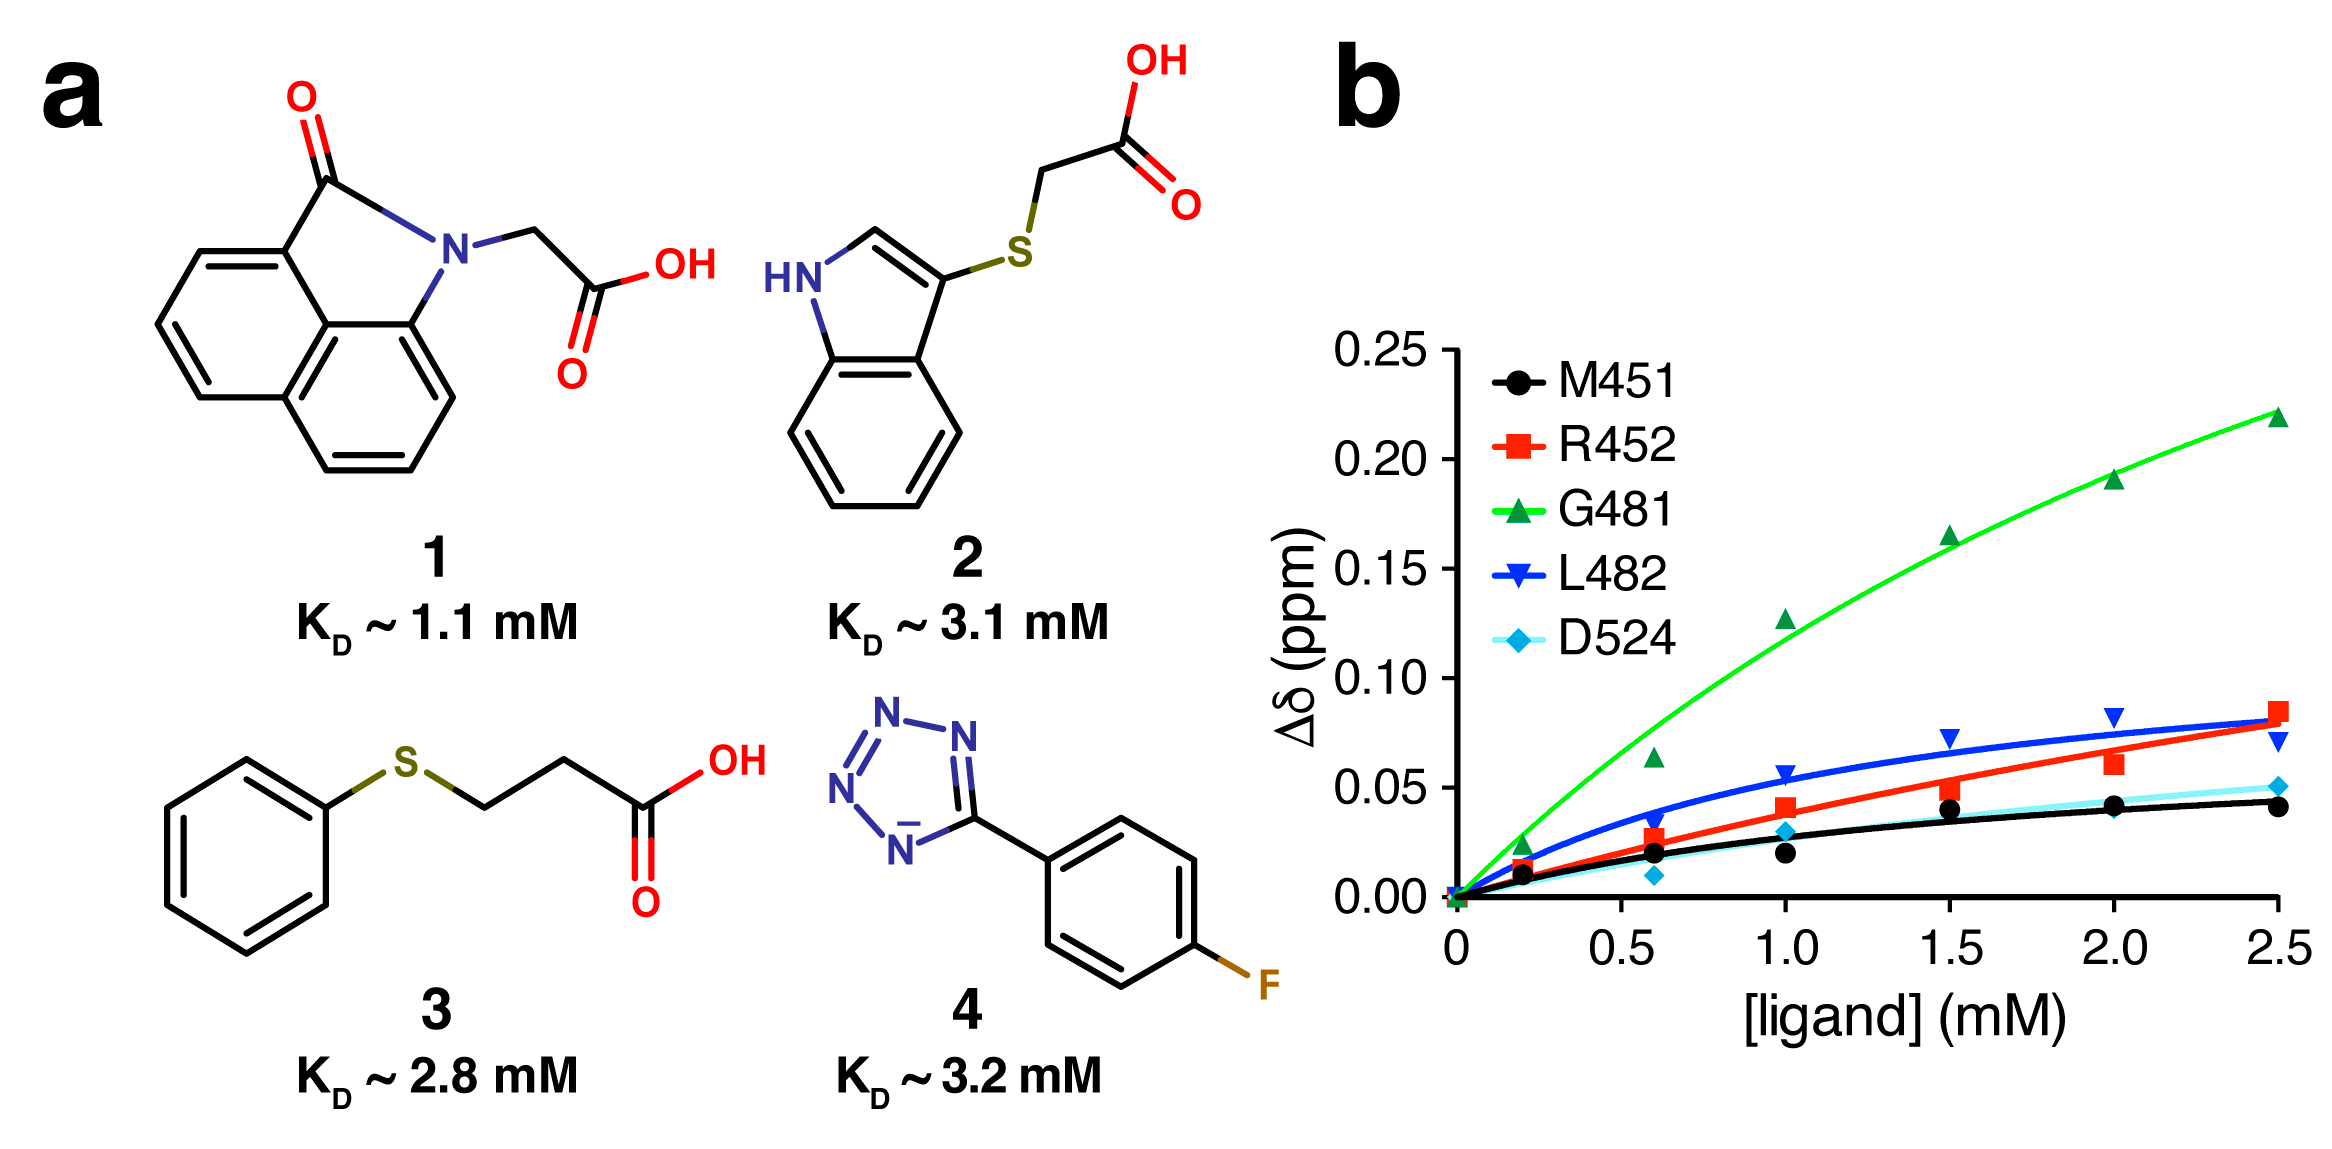
2.4. Fragment-to-Hit Optimization
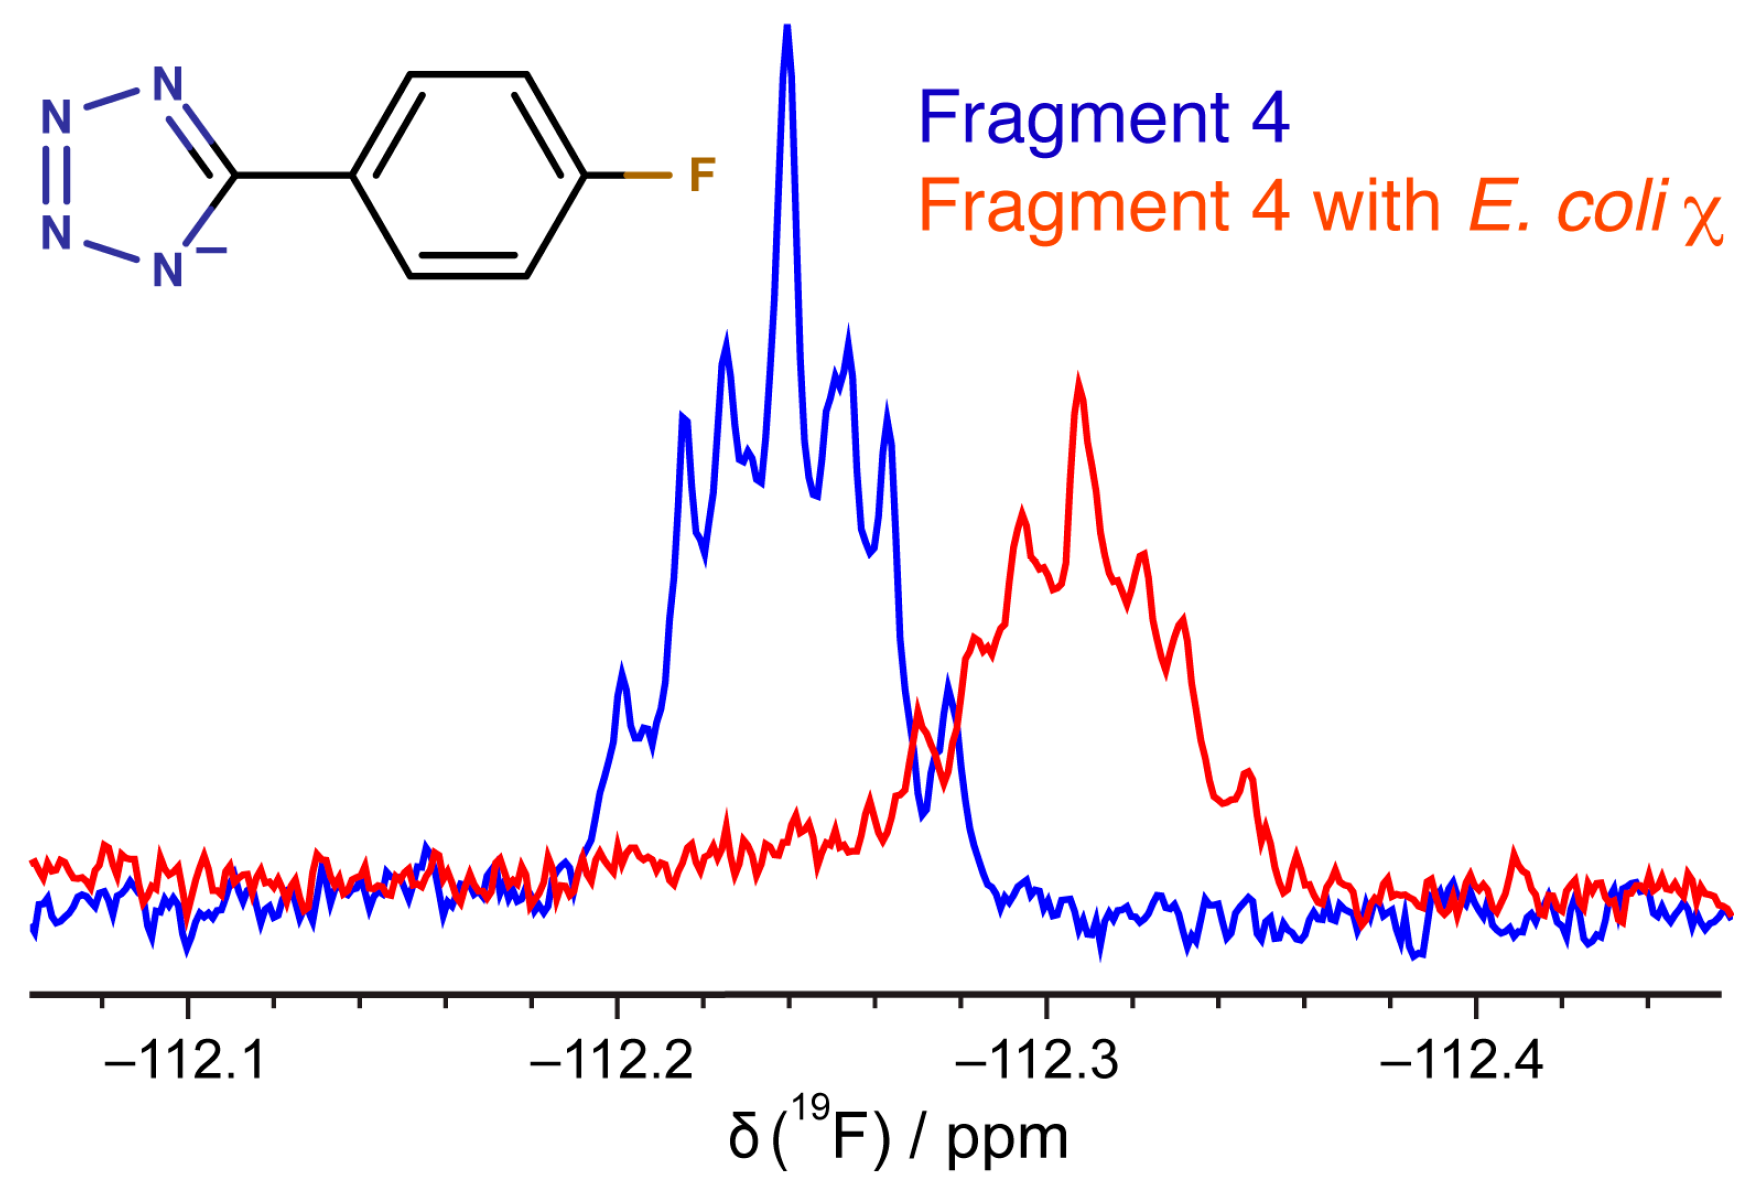
2.5. Binding of Compounds to Other SSB Partner Proteins
3. Materials and Methods
3.1. Protein Expression and Purification
3.2. Fragment Libraries
3.3. SPR Competition Assay
3.4. Saturation-Transfer Difference (STD) NMR Spectroscopy
3.5. 2D 15N–1H HSQC Spectra
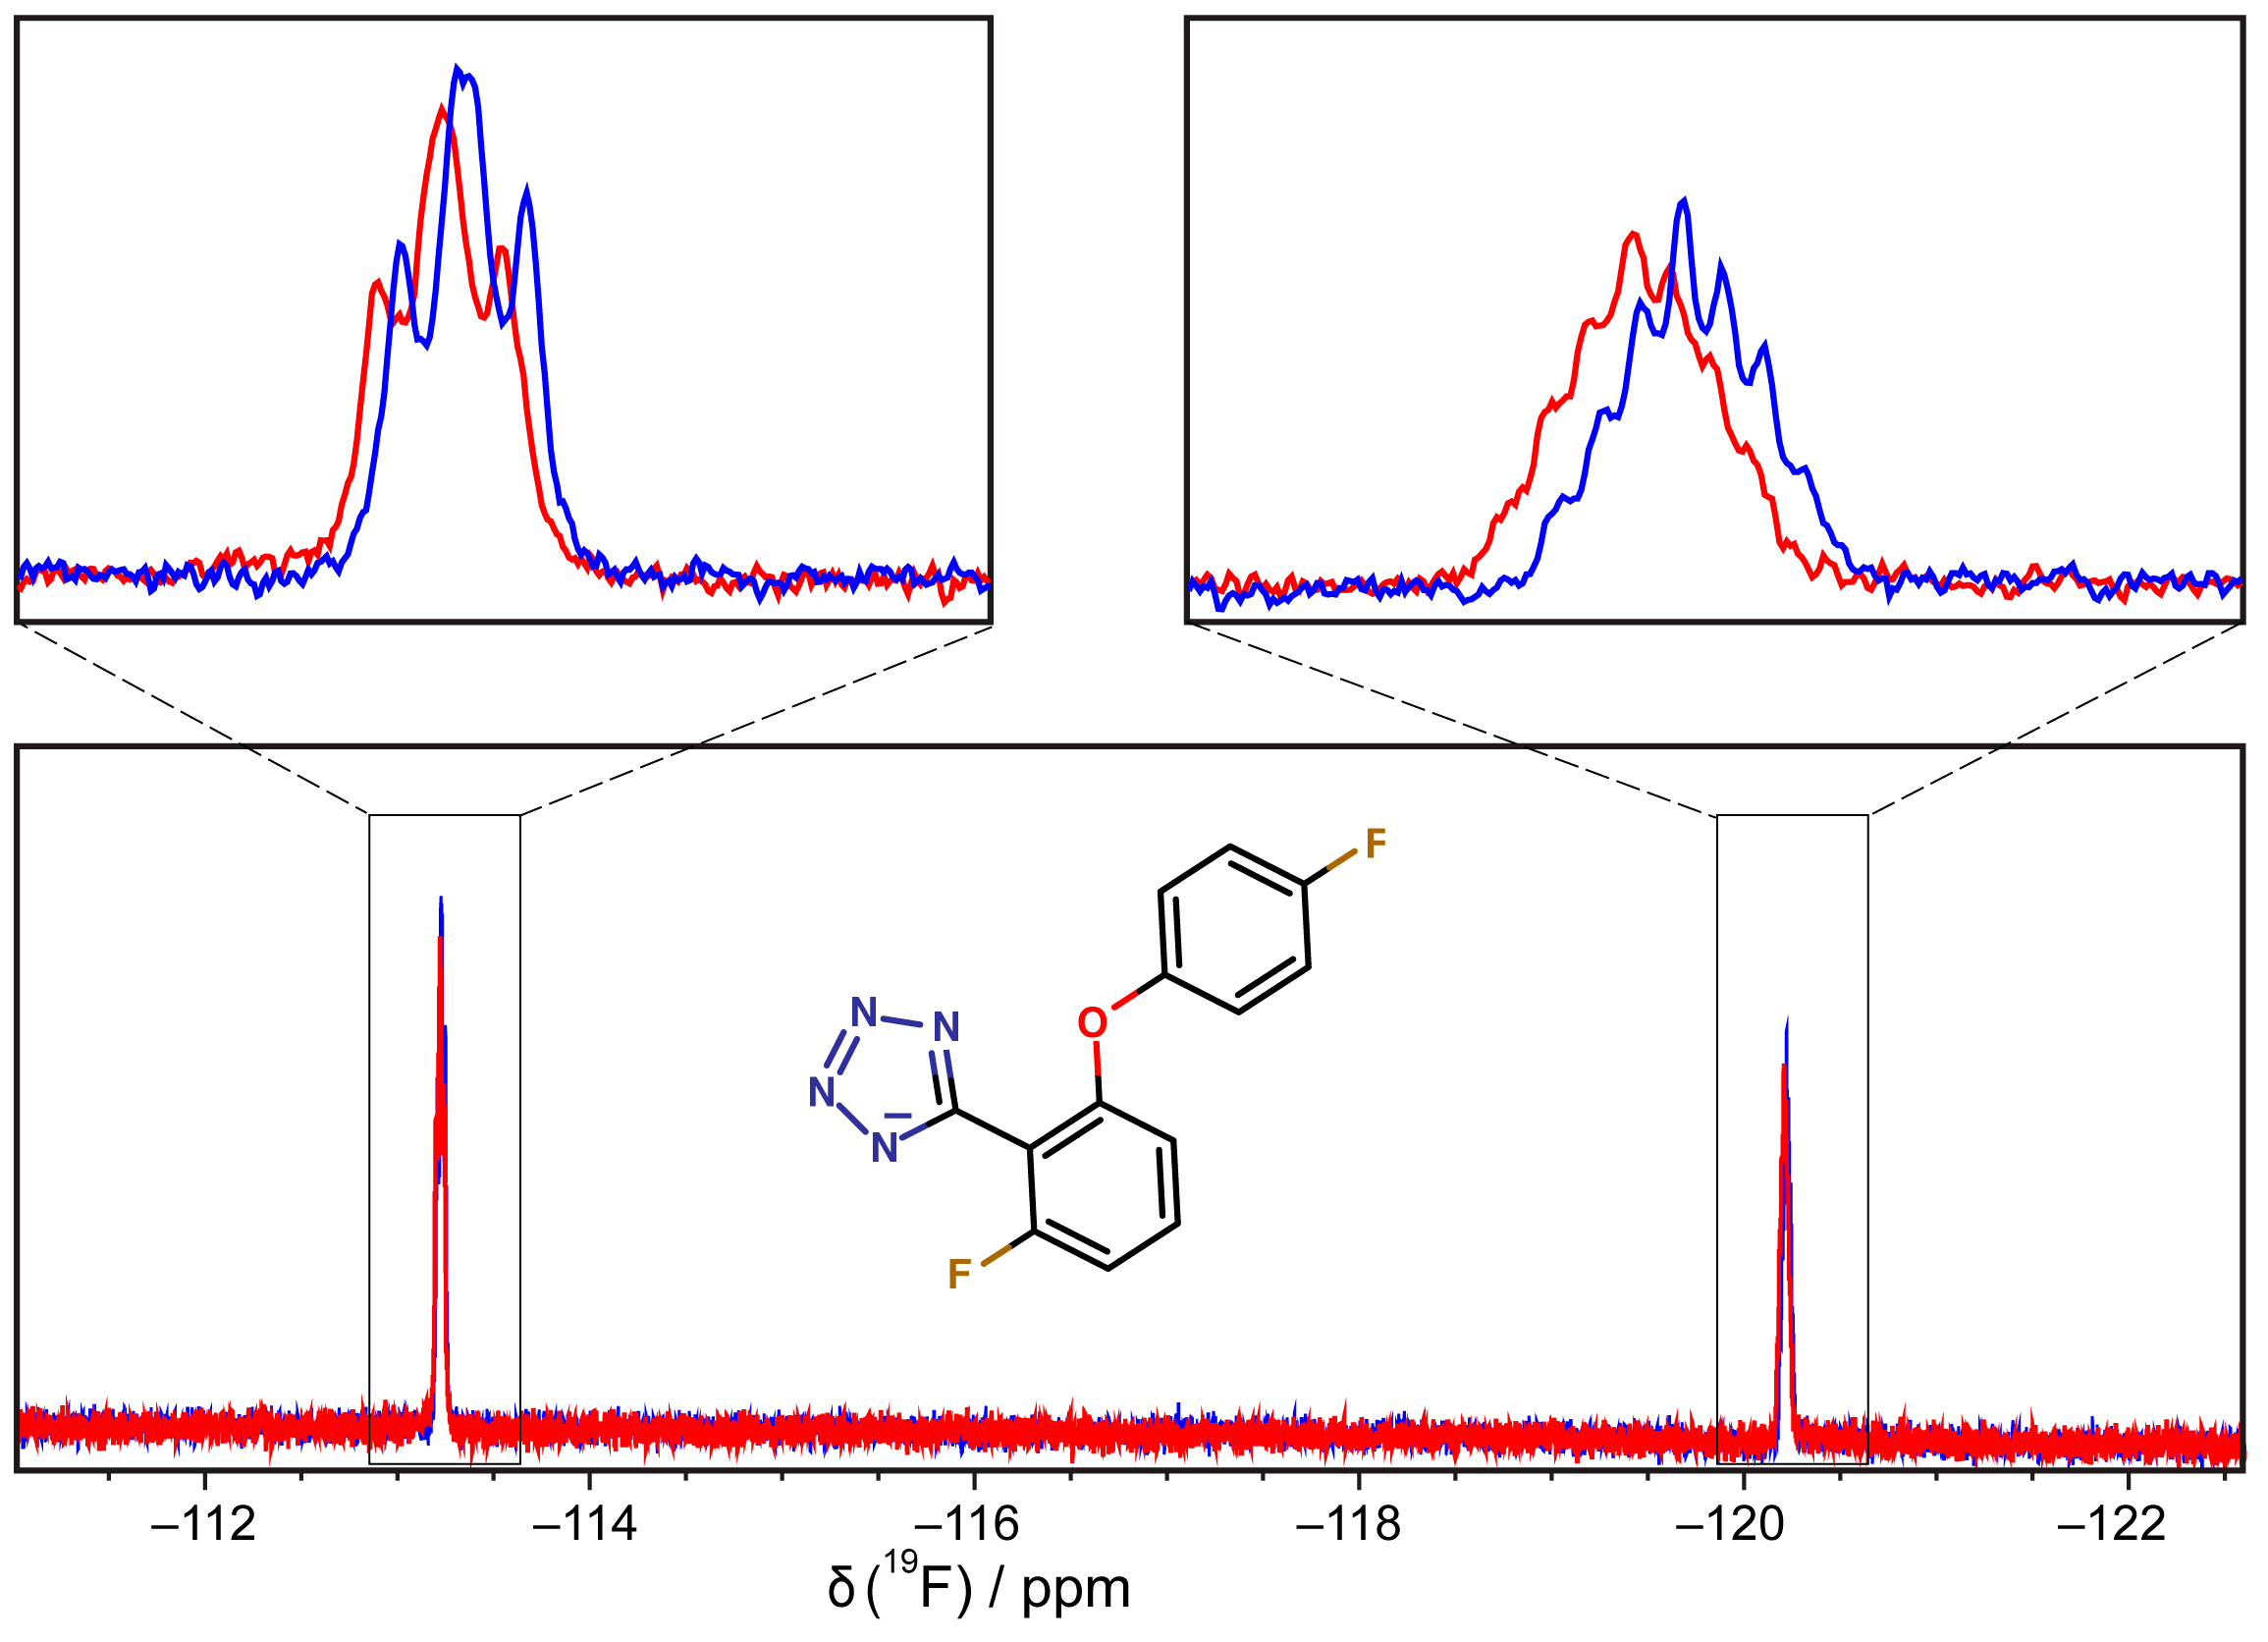
3.6. 19F-NMR Spectroscopy
3.7. Molecular Docking
4. Conclusions
Supplementary Materials
Acknowledgments
Author Contributions
Conflicts of Interest
References
- Kobori, J.A.; Kornberg, A. The Escherichia coli dnaC gene product. II. Purification, physical properties, and role in replication. J. Biol. Chem. 1982, 257, 13763–13769. [Google Scholar] [PubMed]
- Kobori, J.A.; Kornberg, A. The Escherichia coli dnaC gene product. III. Properties of the dnaB–dnaC protein complex. J. Biol. Chem. 1982, 257, 13770–13775. [Google Scholar] [PubMed]
- Tougu, K.; Marians, K.J. The interaction between helicase and primase sets the replication fork clock. J. Biol. Chem. 1996, 271, 21398–21405. [Google Scholar] [CrossRef] [PubMed]
- Kitani, T.; Yoda, K.; Ogawa, T.; Okazaki, T. Evidence that discontinuous DNA replication in Escherichia coli is primed by approximately 10 to 12 residues of RNA starting with a purine. J. Mol. Biol. 1985, 184, 45–52. [Google Scholar] [CrossRef]
- Yoda, K.-Y.; Yasuda, H.; Jiang, X.-W.; Okazaki, T. RNA-primed intitiation sites of DNA replication in the origin region of bacteriophage λ genome. Nucleic Acids Res. 1998, 16, 6531–6546. [Google Scholar] [CrossRef]
- Bouché, J.P.; Zechel, K.; Kornberg, A. dnaG gene product, a rifampicin-resistant RNA polymerase, initiates the conversion of a single-stranded coliphage DNA to its duplex replicative form. J. Biol. Chem. 1975, 250, 5995–6001. [Google Scholar] [PubMed]
- Pan, H.; Wigley, D.B. Structure of the zinc-binding domain of Bacillus stearothermophilus DNA primase. Structure 2000, 8, 231–239. [Google Scholar] [CrossRef]
- Keck, J.L.; Berger, J.M. Structure of the RNA polymerase domain of E. coli primase. Science 2000, 287, 2482–2486. [Google Scholar] [CrossRef] [PubMed]
- Podobnik, M.; McInerney, P.; O’Donnell, M.; Kuriyan, J. A TOPRIM domain in the crystal structure of the catalytic core of Escherichia coli primase confirms a structural link to DNA topoisomerases. J. Mol. Biol. 2000, 300, 353–362. [Google Scholar] [CrossRef] [PubMed]
- Sun, W.; Godson, G.N. Interaction of Escherichia coli primase with a phage G4oric-E. coli SSB complex. J. Bacteriol. 1996, 178, 6701–6705. [Google Scholar] [CrossRef] [PubMed][Green Version]
- Tougu, K.; Marians, K.J. The extreme C terminus of primase is required for interaction with DnaB at the replication fork. J. Biol. Chem. 1996, 271, 21391–21397. [Google Scholar] [CrossRef] [PubMed]
- Yuzhakov, A.; Kelman, Z.; O’Donnell, M. Trading places on DNA–a three-point switch underlies primer handoff from primase to the replicative DNA polymerase. Cell 1999, 96, 153–163. [Google Scholar] [CrossRef]
- Oakley, A.J.; Loscha, K.V.; Schaeffer, P.M.; Liepinsh, E.; Pintacuda, G.; Wilce, M.C.J.; Otting, G.; Dixon, N.E. Crystal and solution structures of the helicase-binding domain of Escherichia coli primase. J. Biol. Chem. 2005, 280, 11495–11504. [Google Scholar] [CrossRef] [PubMed]
- Su, X.-C.; Schaeffer, P.M.; Loscha, K.V.; Gan, P.H.P.; Dixon, N.E.; Otting, G. Monomeric solution structure of the helicase-binding domain of Escherichia coli DnaG primase. FEBS J. 2006, 273, 4997–5009. [Google Scholar] [CrossRef] [PubMed]
- Shereda, R.D.; Kozlov, A.G.; Lohman, T.M.; Cox, M.M.; Keck, J.L. SSB as an organizer/mobilizer of genome maintenance complexes. Crit. Rev. Biochem. Mol. Biol. 2008, 43, 289–318. [Google Scholar] [CrossRef] [PubMed]
- Robinson, A.; Causer, R.J.; Dixon, N.E. Architecture and conservation of the bacterial DNA replication machinery, an underexploited drug target. Curr. Drug Targets 2012, 13, 352–372. [Google Scholar] [CrossRef] [PubMed]
- Glover, B.P.; McHenry, C.S. The χψ subunits of DNA polymerase III holoenzyme bind to single-stranded DNA-binding protein (SSB) and facilitate replication of an SSB-coated template. J. Biol. Chem. 1998, 273, 23476–23484. [Google Scholar] [CrossRef] [PubMed]
- Kelman, Z.; Yuzhakov, A.; Andjelkovic, J.; O’Donnell, M. Devoted to the lagging strand–the χ subunit of DNA polymerase III holoenzyme contacts SSB to promote processive elongation and sliding clamp assembly. EMBO J. 1998, 17, 2436–2449. [Google Scholar] [CrossRef] [PubMed]
- Witte, G. DNA polymerase III χ subunit ties single-stranded DNA binding protein to the bacterial replication machinery. Nucleic Acids Res. 2003, 31, 4434–4440. [Google Scholar] [CrossRef] [PubMed]
- Fedorov, R.; Witte, G.; Urbanke, C.; Manstein, D.J.; Curth, U. 3D structure of Thermus aquaticus single-stranded DNA-binding protein gives insight into the functioning of SSB proteins. Nucleic Acids Res. 2006, 34, 6708–6717. [Google Scholar] [CrossRef] [PubMed]
- Naue, N.; Fedorov, R.; Pich, A.; Manstein, D.J.; Curth, U. Site-directed mutagenesis of the χ subunit of DNA polymerase III and single-stranded DNA-binding protein of E. coli reveals key residues for their interaction. Nucleic Acids Res. 2011, 39, 1398–1407. [Google Scholar] [CrossRef] [PubMed]
- Marceau, A.H.; Bahng, S.; Massoni, S.C.; George, N.P.; Sandler, S.J.; Marians, K.J.; Keck, J.L. Structure of the SSB–DNA polymerase III interface and its role in DNA replication. EMBO J. 2011, 30, 4236–4247. [Google Scholar] [CrossRef] [PubMed]
- Bhattacharyya, B.; George, N.P.; Thurmes, T.M.; Zhou, R.; Jani, N.; Wessel, S.R.; Sandler, S.J.; Ha, T.; Keck, J.L. Structural mechanisms of PriA-mediated DNA replication restart. Proc. Natl. Acad. Sci. USA 2014, 111, 1373–1378. [Google Scholar] [CrossRef] [PubMed]
- Lu, D.; Keck, J.L. Structural basis of Escherichia coli single-stranded DNA-binding protein stimulation of exonuclease I. Proc. Natl. Acad. Sci. USA 2008, 105, 9169–9174. [Google Scholar] [CrossRef] [PubMed]
- Lu, D.; Windsor, M.A.; Gellman, S.H.; Keck, J.L. Peptide inhibitors identify roles for SSB C-terminal residues in SSB/exonuclease I complex formation. Biochemistry 2009, 48, 6764–6771. [Google Scholar] [CrossRef] [PubMed][Green Version]
- Naue, N.; Beerbaum, M.; Bogutzki, A.; Schmieder, P.; Curth, U. The helicase-binding domain of Escherichia coli DnaG primase interacts with the highly conserved C-terminal region of single-stranded DNA-binding protein. Nucleic Acids Res. 2013, 41, 4507–4517. [Google Scholar] [CrossRef] [PubMed]
- Ryzhikov, M.; Koroleva, O.; Postnov, D.; Tran, A.; Korolev, S. Mechanism of RecO recruitment to DNA by single-stranded DNA binding protein. Nucleic Acids Res. 2011, 39, 6305–6314. [Google Scholar] [CrossRef] [PubMed]
- Chilingaryan, Z.; Yin, Z.; Oakley, A.J. Fragment-based screening by protein crystallography: Successes and pitfalls. Int. J. Mol. Sci. 2012, 13, 12857–12879. [Google Scholar] [CrossRef] [PubMed]
- Mayer, M.; Meyer, B. Characterization of ligand binding by saturation transfer difference NMR spectroscopy. Angew. Chem. Int. Ed. 1999, 38, 1784–1788. [Google Scholar] [CrossRef]
- Doak, B.C.; Morton, C.J.; Simpson, J.S.; Scanlon, M.J. Design and evaluation of the performance of an NMR screening fragment library. Aust. J. Chem. 2013, 66, 1465–1472. [Google Scholar] [CrossRef]
- Humphrey, W.; Dalke, A.; Schulten, K. VMD: Visual molecular dynamics. J. Mol. Graph. 1996, 14, 33–38. [Google Scholar] [CrossRef]
- Malik, M.A.; Wani, M.Y.; Al-Thabaiti, S.A.; Shiekh, R.A. Tetrazoles as carboxylic acid isosteres: Chemistry and biology. J. Incl. Phenom. Macrocycl. Chem. 2014, 78, 15–37. [Google Scholar] [CrossRef]
- Allen, F.H.; Groom, C.R.; Liebeschuetz, J.W.; Bardwell, D.A.; Olsson, T.S.G.; Wood, P.A. The hydrogen bond environments of 1H-tetrazole and tetrazolate rings: The structural basis for tetrazole–carboxylic acid bioisosterism. J. Chem. Inf. Model. 2012, 52, 857–866. [Google Scholar] [CrossRef] [PubMed]
- Fielding, L. NMR methods for the determination of protein–ligand dissociation constants. Curr. Top. Med. Chem. 2007, 3, 39–53. [Google Scholar] [CrossRef]
- Lian, L.-Y. NMR studies of weak protein–protein interactions. Prog. Nucl. Magn. Reson. Spectrosc. 2013, 71, 59–72. [Google Scholar] [CrossRef] [PubMed]
- Dalvit, C.; Vulpetti, A. Intermolecular and intramolecular hydrogen bonds involving fluorine atoms: Implications for recognition, selectivity, and chemical properties. ChemMedChem 2012, 7, 262–272. [Google Scholar] [CrossRef] [PubMed]
- Brameld, K.A.; Kuhn, B.; Reuter, D.C.; Stahl, M. Small molecule conformational preferences derived from crystal structure data. A medicinal chemistry focused analysis. J. Chem. Inf. Model. 2008, 48, 1–24. [Google Scholar] [CrossRef] [PubMed]
- Irwin, J.J.; Shoichet, B.K. ZINC−A free database of commercially available compounds for virtual screening. J. Chem. Inf. Model. 2005, 45, 177–182. [Google Scholar] [CrossRef] [PubMed]
- Medek, A.; Hajduk, P.J.; Mack, J.; Fesik, S.W. The use of differential chemical shifts for determining the binding site location and orientation of protein-bound ligands. J. Am. Chem. Soc. 2000, 122, 1241–1242. [Google Scholar] [CrossRef]
- Stamford, N.P.J.; Lilley, P.E.; Dixon, N.E. Enriched sources of Escherichia coli replication proteins. The dnaG primase is a zinc metalloprotein. Biochim. Biophys. Acta 1992, 1132, 17–25. [Google Scholar] [CrossRef]
- Love, C.A.; Lilley, P.E.; Dixon, N.E. Stable high-copy-number bacteriophage λ promoter vectors for overproduction of proteins in Escherichia coli. Gene 1996, 176, 49–53. [Google Scholar] [CrossRef]
- Loscha, K.; Oakley, A.J.; Bancia, B.; Schaeffer, P.M.; Prosselkov, P.; Otting, G.; Wilce, M.C.J.; Dixon, N.E. Expression, purification, crystallization, and NMR studies of the helicase interaction domain of Escherichia coli DnaG primase. Protein Expr. Purif. 2004, 33, 304–310. [Google Scholar] [CrossRef] [PubMed]
- Vranken, W.F.; Boucher, W.; Stevens, T.J.; Fogh, R.H.; Pajon, A.; Llinas, M.; Ulrich, E.L.; Markley, J.L.; Ionides, J.; Laue, E.D. The CCPN data model for NMR spectroscopy: Development of a software pipeline. Proteins 2005, 59, 687–696. [Google Scholar] [CrossRef] [PubMed]
- Ziarek, J.J.; Peterson, F.C.; Lytle, B.L.; Volkman, B.F. Binding site identification and structure determination of protein–ligand complexes by NMR: A semiautomated approach. Methods Enzymol. 2011, 493, 241–275. [Google Scholar] [PubMed]
- Trott, O.; Olson, A.J. AutoDock Vina: Improving the speed and accuracy of docking with a new scoring function, efficient optimization, and multithreading. J. Comput. Chem. 2010, 31, 455–461. [Google Scholar] [CrossRef] [PubMed]
- Lo, A.T.Y.; Oakley, A.J.; Dixon, N.E. The DnaG primase interaction with single-stranded DNA-binding protein (SSB). Manuscript in preparation.
- Li, H.; Robertson, A.D.; Jensen, J.H. Very fast empirical prediction and rationalization of protein pKa values. Proteins 2005, 61, 704–721. [Google Scholar] [CrossRef] [PubMed]


© 2018 by the authors. Licensee MDPI, Basel, Switzerland. This article is an open access article distributed under the terms and conditions of the Creative Commons Attribution (CC BY) license (http://creativecommons.org/licenses/by/4.0/).
Share and Cite
Chilingaryan, Z.; Headey, S.J.; Lo, A.T.Y.; Xu, Z.-Q.; Otting, G.; Dixon, N.E.; Scanlon, M.J.; Oakley, A.J. Fragment-Based Discovery of Inhibitors of the Bacterial DnaG-SSB Interaction. Antibiotics 2018, 7, 14. https://doi.org/10.3390/antibiotics7010014
Chilingaryan Z, Headey SJ, Lo ATY, Xu Z-Q, Otting G, Dixon NE, Scanlon MJ, Oakley AJ. Fragment-Based Discovery of Inhibitors of the Bacterial DnaG-SSB Interaction. Antibiotics. 2018; 7(1):14. https://doi.org/10.3390/antibiotics7010014
Chicago/Turabian StyleChilingaryan, Zorik, Stephen J. Headey, Allen T. Y. Lo, Zhi-Qiang Xu, Gottfried Otting, Nicholas E. Dixon, Martin J. Scanlon, and Aaron J. Oakley. 2018. "Fragment-Based Discovery of Inhibitors of the Bacterial DnaG-SSB Interaction" Antibiotics 7, no. 1: 14. https://doi.org/10.3390/antibiotics7010014
APA StyleChilingaryan, Z., Headey, S. J., Lo, A. T. Y., Xu, Z.-Q., Otting, G., Dixon, N. E., Scanlon, M. J., & Oakley, A. J. (2018). Fragment-Based Discovery of Inhibitors of the Bacterial DnaG-SSB Interaction. Antibiotics, 7(1), 14. https://doi.org/10.3390/antibiotics7010014