Article

Phenotypic Antimicrobial Resistance in Escherichia coli and Salmonella spp. Recovered from Broiler-Farm Environmental Matrices in Morocco


1
GeoBiodiversity and Natural Patrimony Laboratory GEOPAC Research Center Scientific Institute, Mohammed V University in Rabat, Ibn Battuta Av, Rabat B.P. 1040, Morocco
2
Department of Microbiology of Water, Food and Environment, National Institute of Hygiene, BP: 769, Agdal, 27, Avenue Ibn Batouta, Rabat 10000, Morocco
3
Laboratory of Natural Resources and Sustainable Development, Department of Biology, Faculty of Sciences, Ibn Tofail University, Kenitra 14000, Morocco
*
Author to whom correspondence should be addressed.
Antibiotics 2026, 15(8), 731; https://doi.org/10.3390/antibiotics15080731
Submission received: 30 June 2026 / Revised: 12 July 2026 / Accepted: 17 July 2026 / Published: 28 July 2026
(This article belongs to the Special Issue Advances in Antimicrobial Action and Resistance)

Abstract

Background/Objectives: Antimicrobial resistance (AMR) in poultry-production environments is an important One Health concern. This phenotypic baseline study investigated the detection and antimicrobial-resistance profiles of Escherichia coli and Salmonella spp. recovered from broiler-farm environmental matrices in the Rabat–Salé–Kénitra region of Morocco. Methods: A cross-sectional field study was conducted in 13 broiler farms on 35 sampling dates between 24 November 2023 and 28 April 2025. A total of 543 samples were collected from poultry manure, drinking troughs, farm soil, soils approximately 200 and 500 m from the poultry houses, and well water. Isolates were identified by culture and API 20E; Salmonella spp. identification was additionally confirmed by real-time PCR. Disk-diffusion results were interpreted using applicable CLSI M100, 31st edition, criteria, and colistin was tested by the colistin broth disk elution MIC method. Multidrug resistance (MDR) was defined as resistance to at least one agent in three or more antimicrobial classes. ResultsEscherichia coli and Salmonella spp. were detected in 190/543 (35.0%) and 127/543 (23.4%) samples, respectively. Among E. coli isolates, 115/190 (60.5%) were MDR; the highest matrix-specific proportions occurred in farm soil (85.7%), drinking troughs (83.3%), and poultry manure (75.7%). Among Salmonella spp. isolates, 82/127 (64.6%) were MDR, with the highest proportions in poultry manure (92.9%) and drinking troughs (78.3%). The predominant resistance rates were ampicillin (84.7%), tetracycline (61.6%), and chloramphenicol (55.8%) in E. coli, and nalidixic acid (73.2%), ampicillin (61.4%), and tetracycline (55.9%) in Salmonella spp. Resistant isolates were also detected in surrounding soils and well water; however, the study design did not permit source attribution or inference of transmission direction. Conclusions: Broiler-farm environmental matrices in the study area may represent reservoirs of phenotypically antimicrobial-resistant E. coli and Salmonella spp. The findings provide baseline evidence supporting integrated One Health surveillance, improved biosecurity, manure and litter management, water-system sanitation, and responsible veterinary antimicrobial use. Genomic typing and environmental source-tracking are required to determine persistence and transmission pathways.

1. Introduction

Poultry production contributes substantially to food security, nutrition, and rural economies by supplying meat and eggs. However, intensified production also creates challenges related to flock health, bacterial contamination, and food safety. Salmonella spp. and Escherichia coli are frequently encountered along the poultry-production continuum and are important because they can compromise animal health, food safety, and public health [1,2,3,4,5].
Antimicrobial resistance (AMR) is a major threat to animal and public health and reflects interconnected selection pressures across human medicine, livestock production, and the environment [6]. Antibiotic growth promoters historically improved feed conversion, growth performance, and disease control in intensive broiler systems, contributing to their prolonged use in poultry production [7]. International surveillance frameworks, including those coordinated by the World Organisation for Animal Health, emphasize the contribution of veterinary antimicrobial use to the broader resistance-selection landscape [8,9]. Monitoring poultry-associated E. coli and Salmonella spp. is therefore important for One Health AMR surveillance [9,10].
The poultry-farm environment is an interface at which animals, workers, water, soil, litter, and manure interact [11,12]. Feces, litter, manure handling, drainage, dust, and runoff have been proposed in the literature as possible routes by which bacteria may enter environmental matrices [13,14,15,16,17,18]. These routes are presented here as background hypotheses; the present study did not measure antimicrobial residues, quantify bacterial movement, or determine transmission pathways.
Environmental bacterial communities may also carry resistance genes on plasmids, integrons, transposons, and other mobile genetic elements [19,20,21,22]. Nevertheless, the present investigation assessed culture-based detection and phenotypic antimicrobial susceptibility only. Resistance genes, plasmids, integrons, horizontal gene transfer, and genetic relatedness were not directly investigated and are therefore not inferred from the results.
Accordingly, this study aimed to determine the detection rates of E. coli and Salmonella spp. in six broiler-farm environmental matrices and to characterize their phenotypic antimicrobial-resistance and MDR profiles. The work was designed as baseline environmental surveillance within a One Health framework rather than as a source-attribution or transmission study.

2. Results

2.1. Occurrence of Escherichia coli and Salmonella spp. In Broiler Farm Environmental Samples

A total of 543 environmental samples were analyzed for Escherichia coli and Salmonella spp. Overall, E. coli was detected in 190 samples (35.0%), whereas Salmonella spp. was detected in 127 samples (23.4%). For E. coli, the highest detection rates occurred in poultry manure (37/78; 47.4%), soil approximately 500 m from the farms (35/79; 44.3%), and farm soil (42/98; 42.9%). Lower rates were recorded in soil approximately 200 m from the farms (30/79; 38.0%), drinking troughs (24/79; 30.4%), and well water (22/130; 16.9%).
For Salmonella spp., the highest detection rates occurred in poultry manure (28/78; 35.9%), farm soil (34/98; 34.7%), and drinking troughs (23/79; 29.1%). Lower rates were found in soil approximately 200 m from the farms (14/79; 17.7%), well water (18/130; 13.8%), and soil approximately 500 m from the farms (10/79; 12.7%). These values describe detection within the sampled matrices and should not be interpreted as population prevalence. The complete matrix-specific detection results are summarized in Table 1.

2.2. Monthly Detection of Escherichia coli and Salmonella spp.

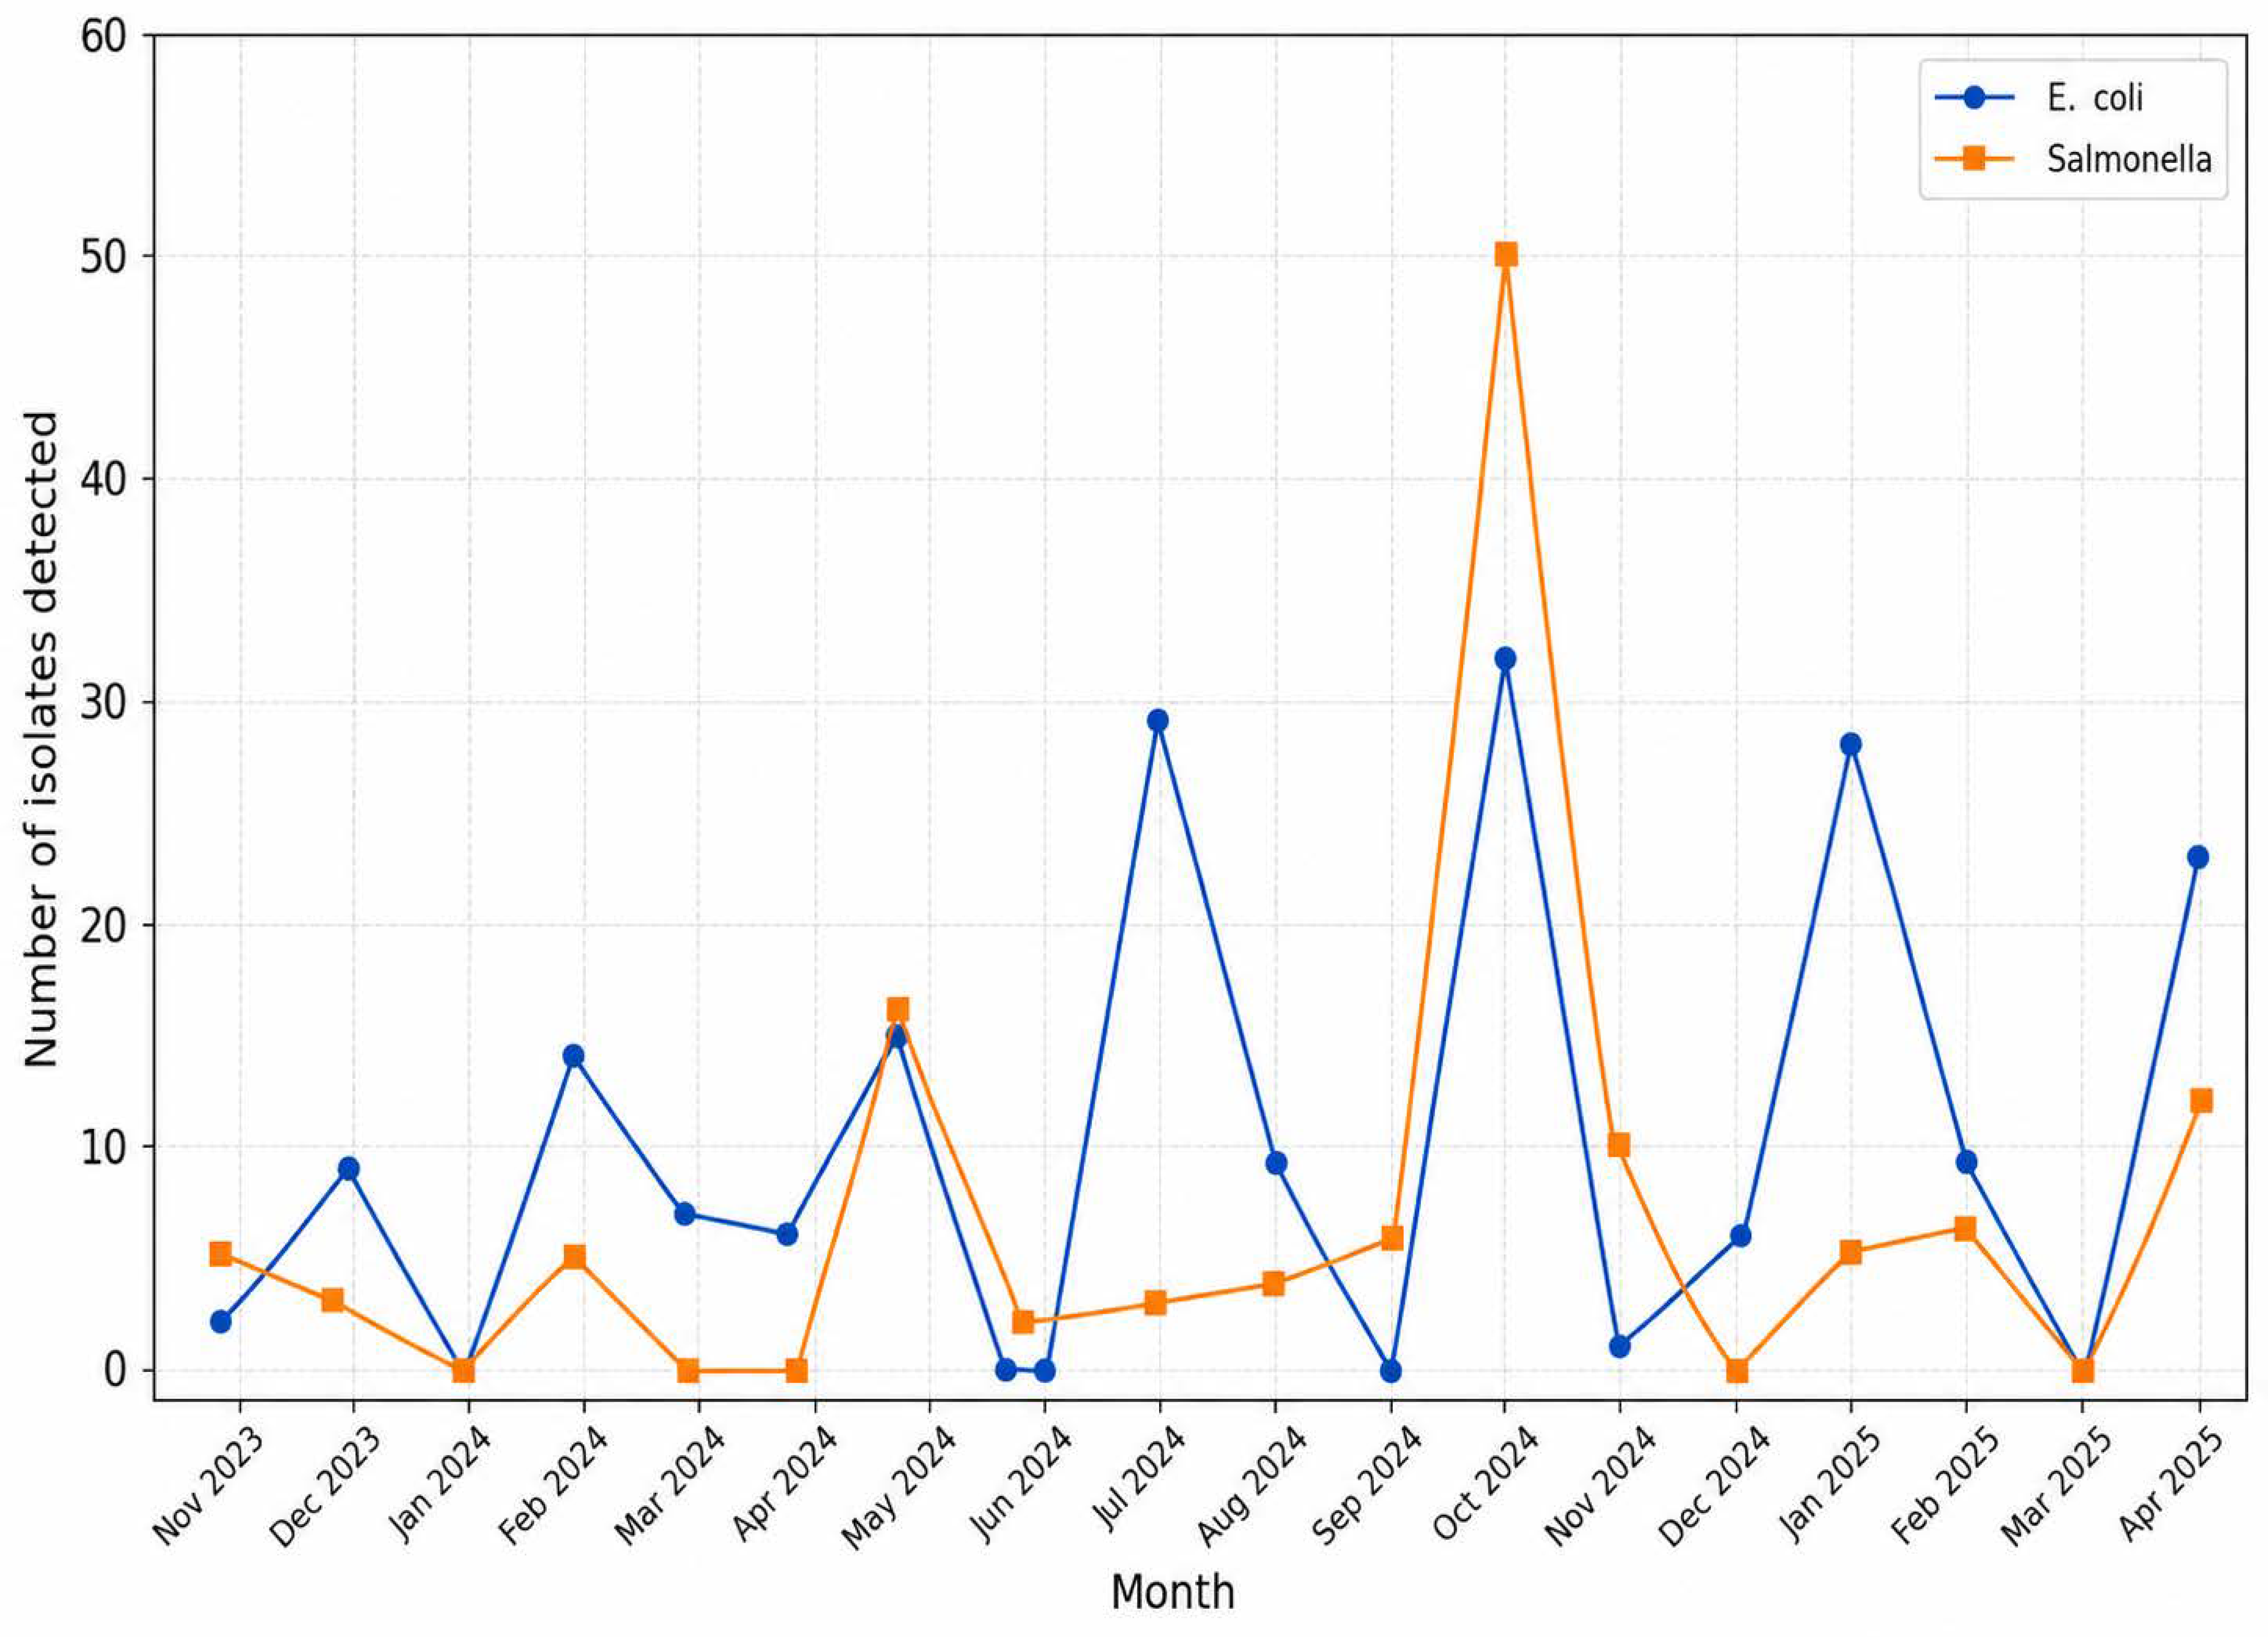
Monthly detections fluctuated across the sampling period and reflected an irregular field schedule rather than equally spaced monthly surveillance (Figure 1). Escherichia coli detections ranged from 0 to 32 per sampled month. The largest counts were recorded in October 2024 (32), July 2024 and January 2025 (28 each), and April 2025 (23). The corrected month-level counts and corresponding numbers of samples analyzed are provided in Supplementary Table S1.
Salmonella spp. detections ranged from 0 to 50 per sampled month. The highest count was observed in October 2024 (50), followed by May 2024 (13), April 2025 (12), and November 2024 (9). Four detections were recorded in December 2023. Months without sampling are not displayed as zero-detection months.
Because monthly sampling totals varied from 6 to 87 samples and the distribution of matrices also differed among months, these results are presented as descriptive detection counts rather than monthly prevalence. Month-by-matrix sample counts, positive detections, and isolate denominators are reported in Supplementary Table S1.

2.3. Geographical Distribution of Escherichia coli and Salmonella spp. Detections

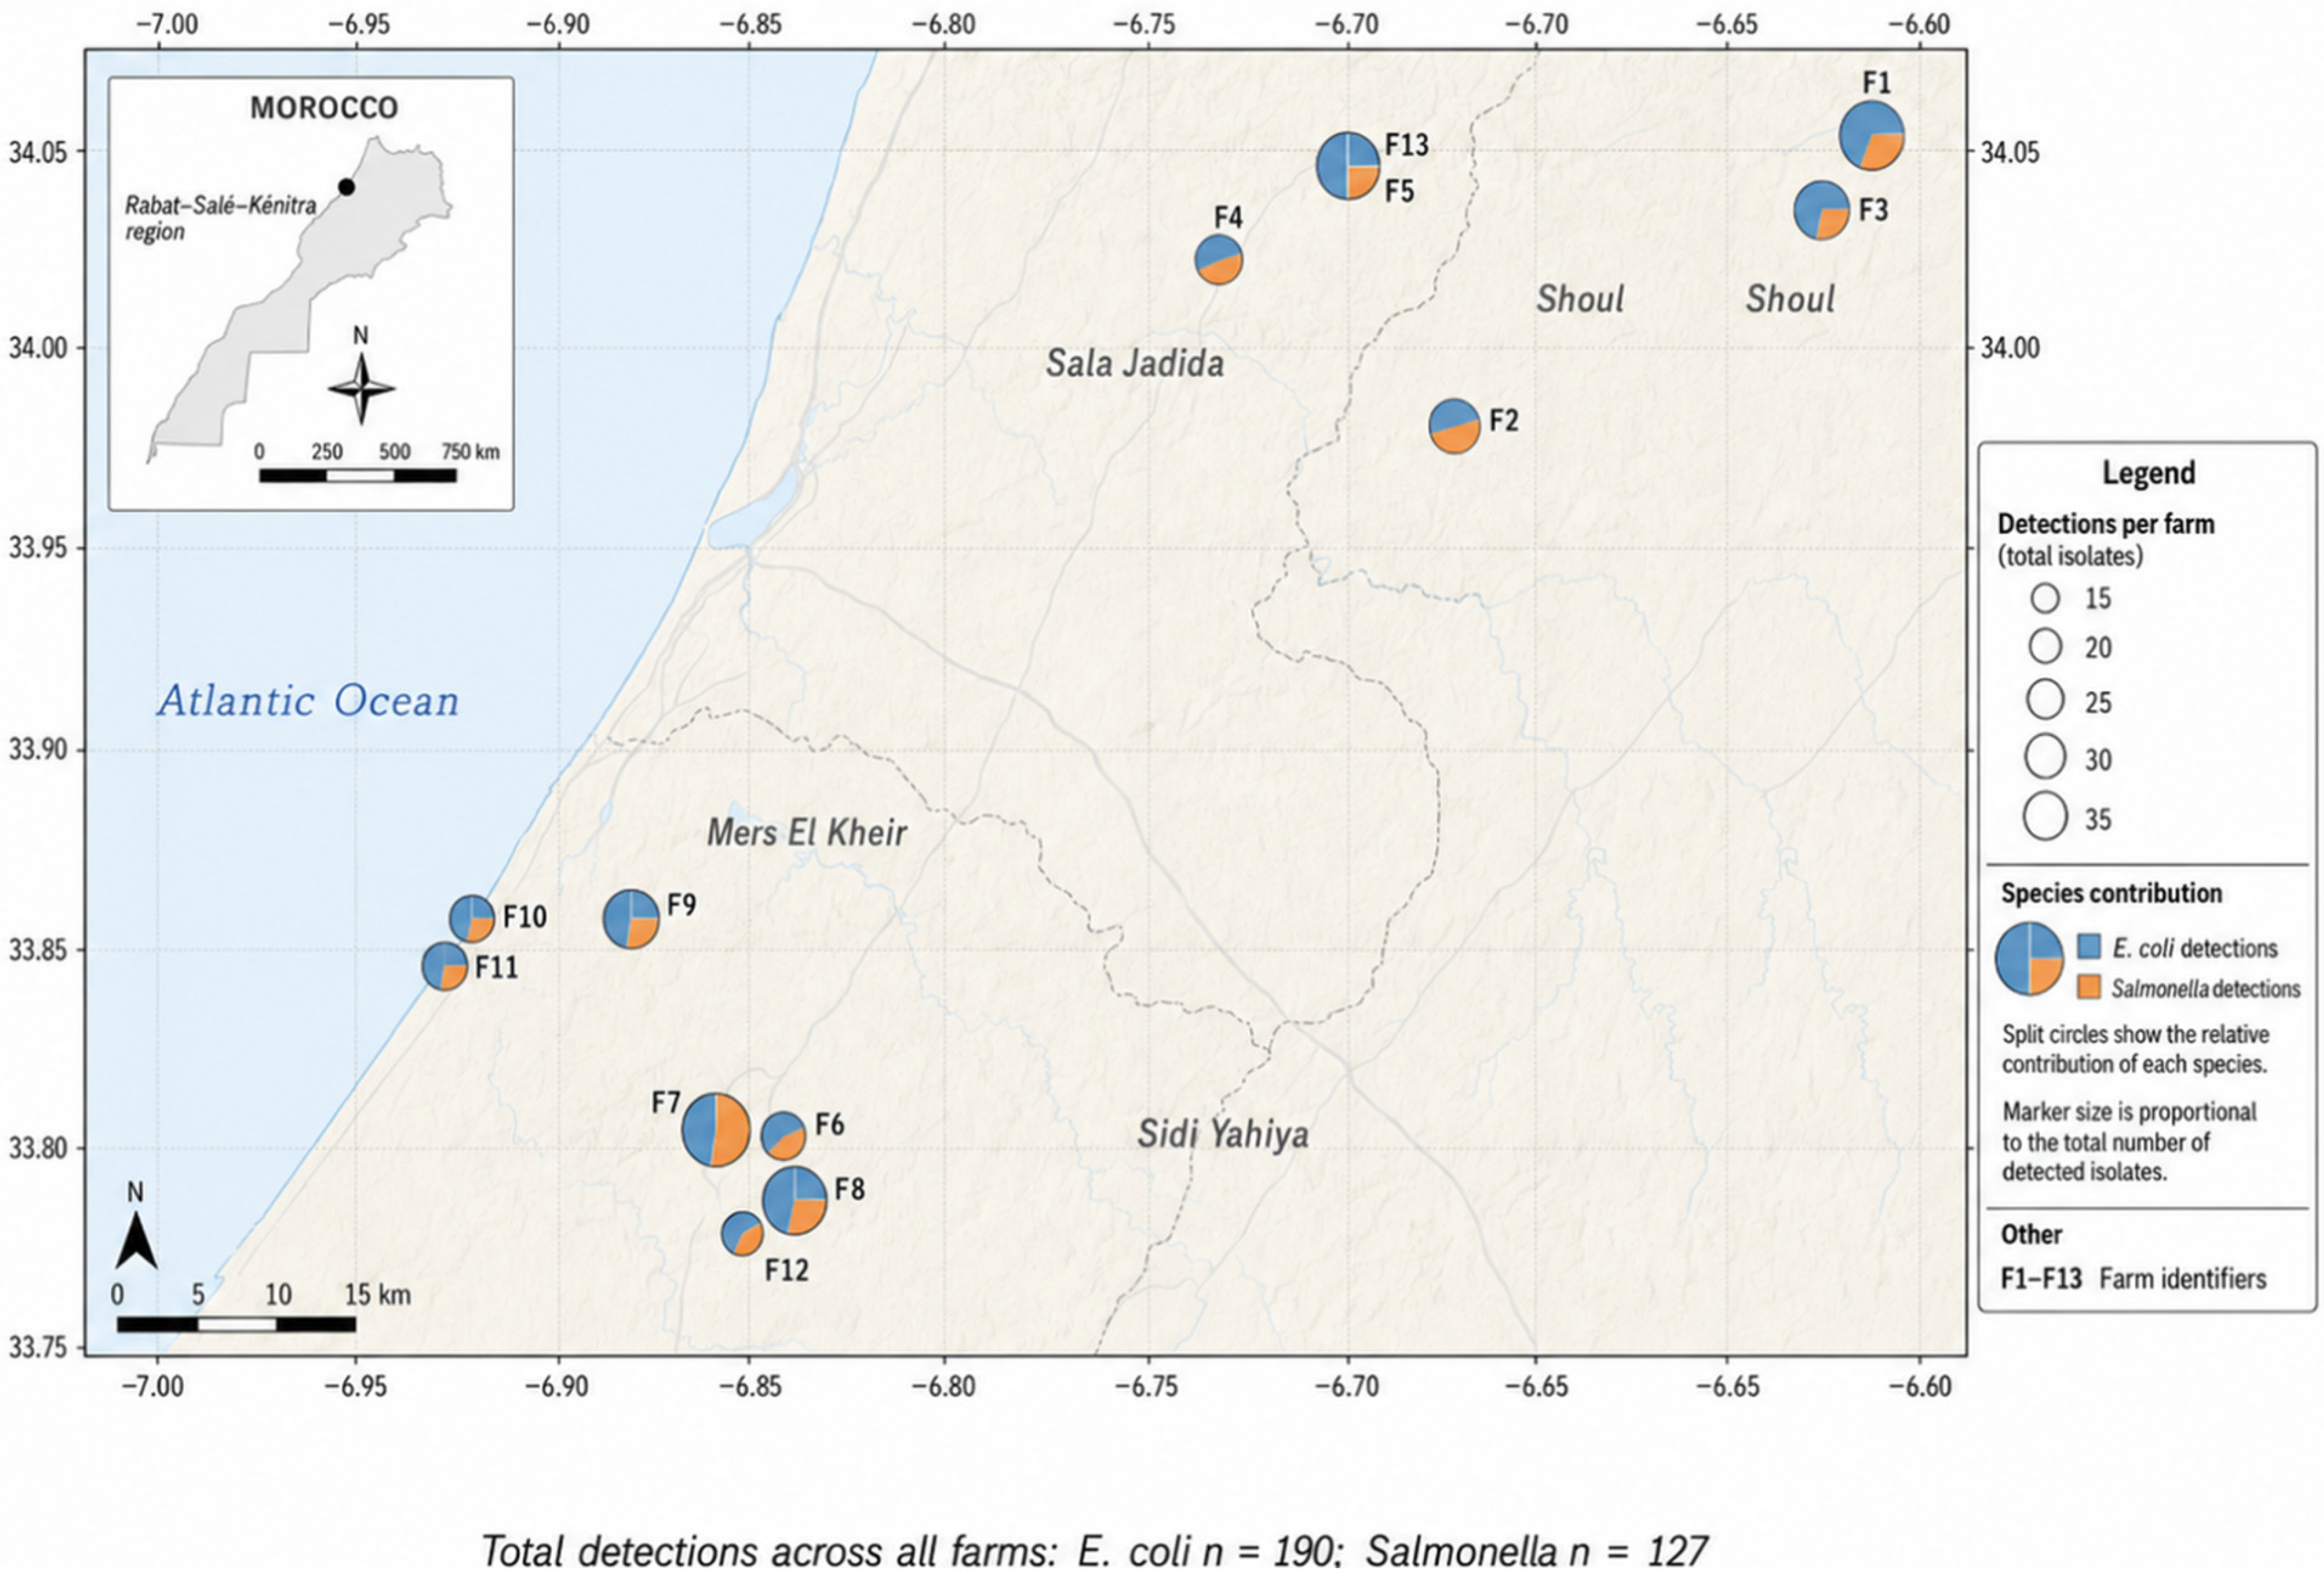
Both bacterial groups were detected in all four surveyed locations: Sidi Yahia, Mers El Kheir, Sala Jadida, and Shoul (Figure 2; Table 2). For E. coli, Sidi Yahia accounted for 61 detections (32.1% of E. coli-positive samples), Mers El Kheir and Sala Jadida for 45 each (23.7%), and Shoul for 39 (20.5%).
For Salmonella spp., Sidi Yahia accounted for 37 detections (29.1% of Salmonella-positive samples), Shoul for 31 (24.4%), Mers El Kheir for 30 (23.6%), and Sala Jadida for 29 (22.8%). These percentages describe the distribution of positive detections among the sampled locations and do not establish geographical risk differences because sampling intensity was not designed to be representative.

2.4. Phenotypic Antimicrobial Resistance Profiles of E. coli and Salmonella spp. Isolates

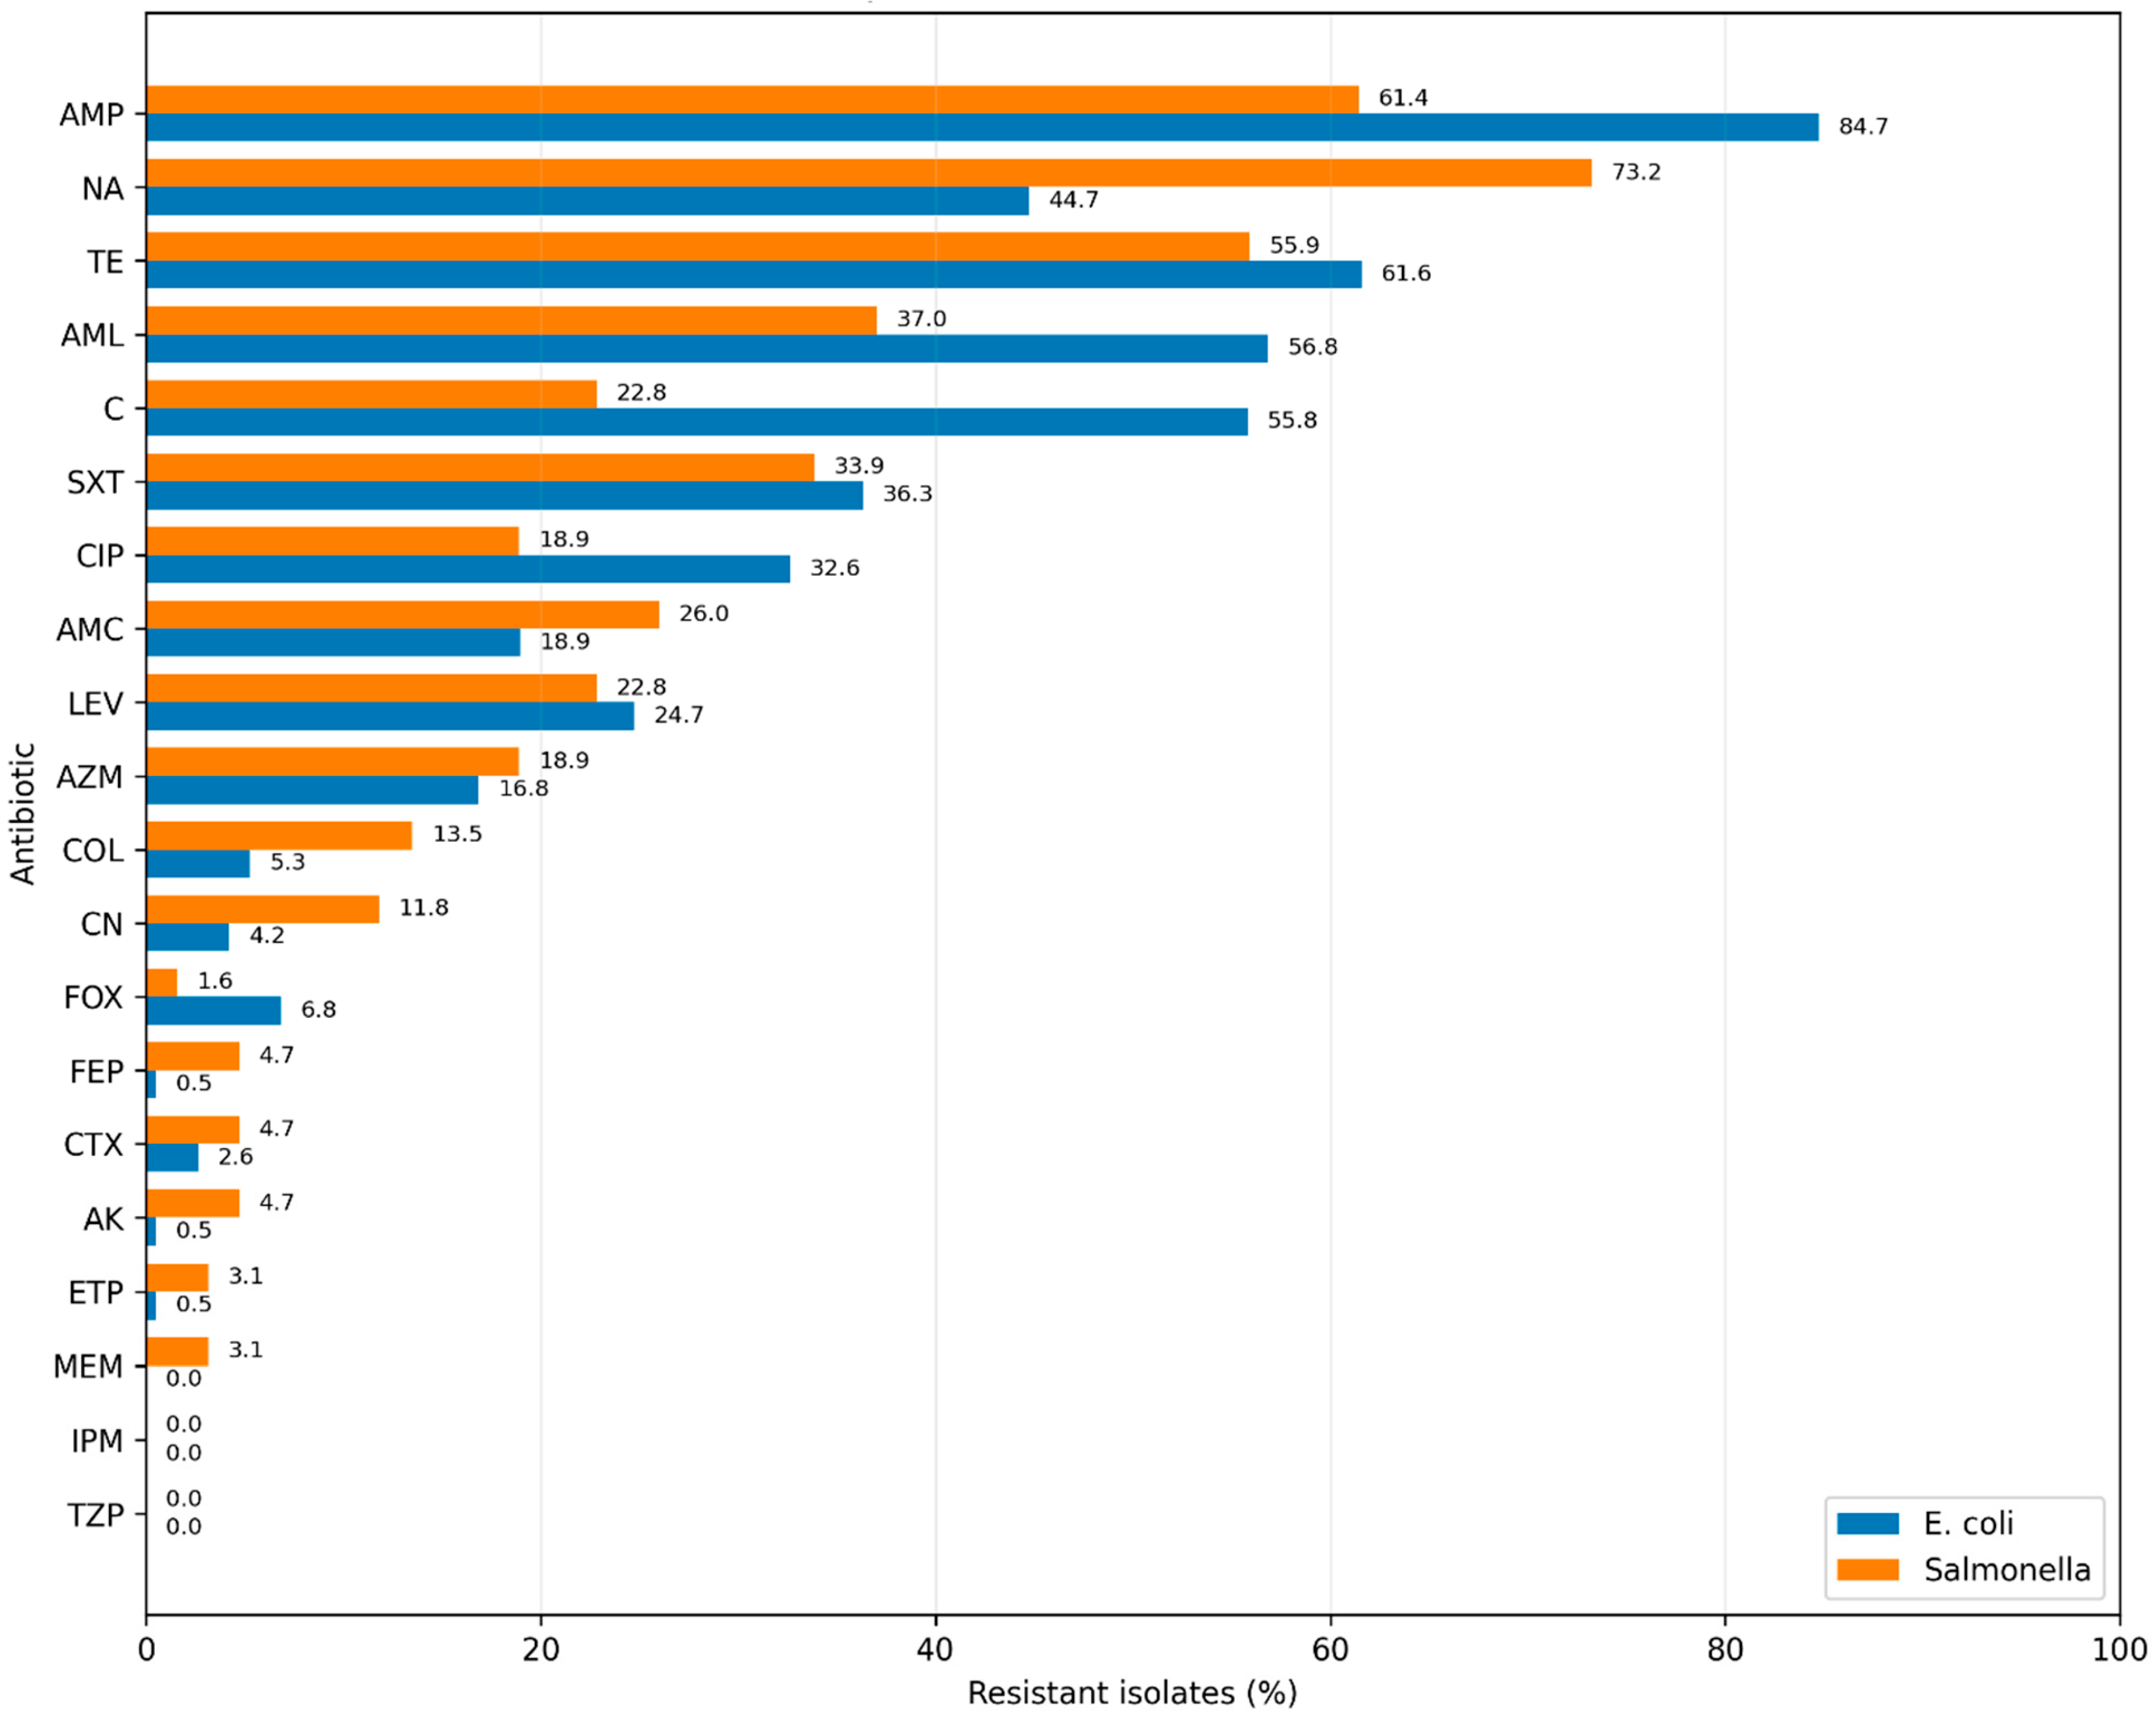
Using antimicrobial agents with applicable categorical criteria, E. coli showed the highest resistance to ampicillin (161/190; 84.7%), tetracycline (117/190; 61.6%), chloramphenicol (106/190; 55.8%), nalidixic acid (85/190; 44.7%), trimethoprim–sulfamethoxazole (69/190; 36.3%), and ciprofloxacin (62/190; 32.6%) (Figure 3). Lower rates were observed for levofloxacin (24.7%), amoxicillin–clavulanic acid (18.9%), cefoxitin (6.8%), colistin by MIC (5.3%), gentamicin (4.2%), cefotaxime (2.6%), cefepime (0.5%), amikacin (0.5%), and ertapenem (0.5%). No resistance was detected to imipenem, meropenem, or piperacillin–tazobactam.
Among Salmonella spp., the highest resistance rates were observed for nalidixic acid (93/127; 73.2%), ampicillin (78/127; 61.4%), tetracycline (71/127; 55.9%), trimethoprim–sulfamethoxazole (43/127; 33.9%), amoxicillin–clavulanic acid (33/127; 26.0%), chloramphenicol (29/127; 22.8%), and ciprofloxacin (24/127; 18.9%). Lower rates were recorded for colistin by MIC (17/127; 13.4%), gentamicin (11.8%), cefepime (4.7%), cefotaxime (4.7%), amikacin (4.7%), ertapenem (3.1%), meropenem (3.1%), and cefoxitin (1.6%). No resistance was detected to imipenem or piperacillin–tazobactam.
Direct amoxicillin and azithromycin disk results were retained as raw screening data in Supplementary Table S2 but were excluded from categorical summaries, temporal models, and MDR classification because general CLSI M100 breakpoints were not applicable to these organism–agent combinations. Salmonella levofloxacin disk results were likewise not categorically interpreted. Nalidixic acid was retained as a phenotypic screening marker and was not used alone to infer clinical fluoroquinolone susceptibility. Complete isolate-level results, colistin MICs, interpretive criteria, and exclusions are provided in Supplementary Table S2.

2.5. Monthly Evolution of Antimicrobial Resistance in E. coli and Salmonella spp.

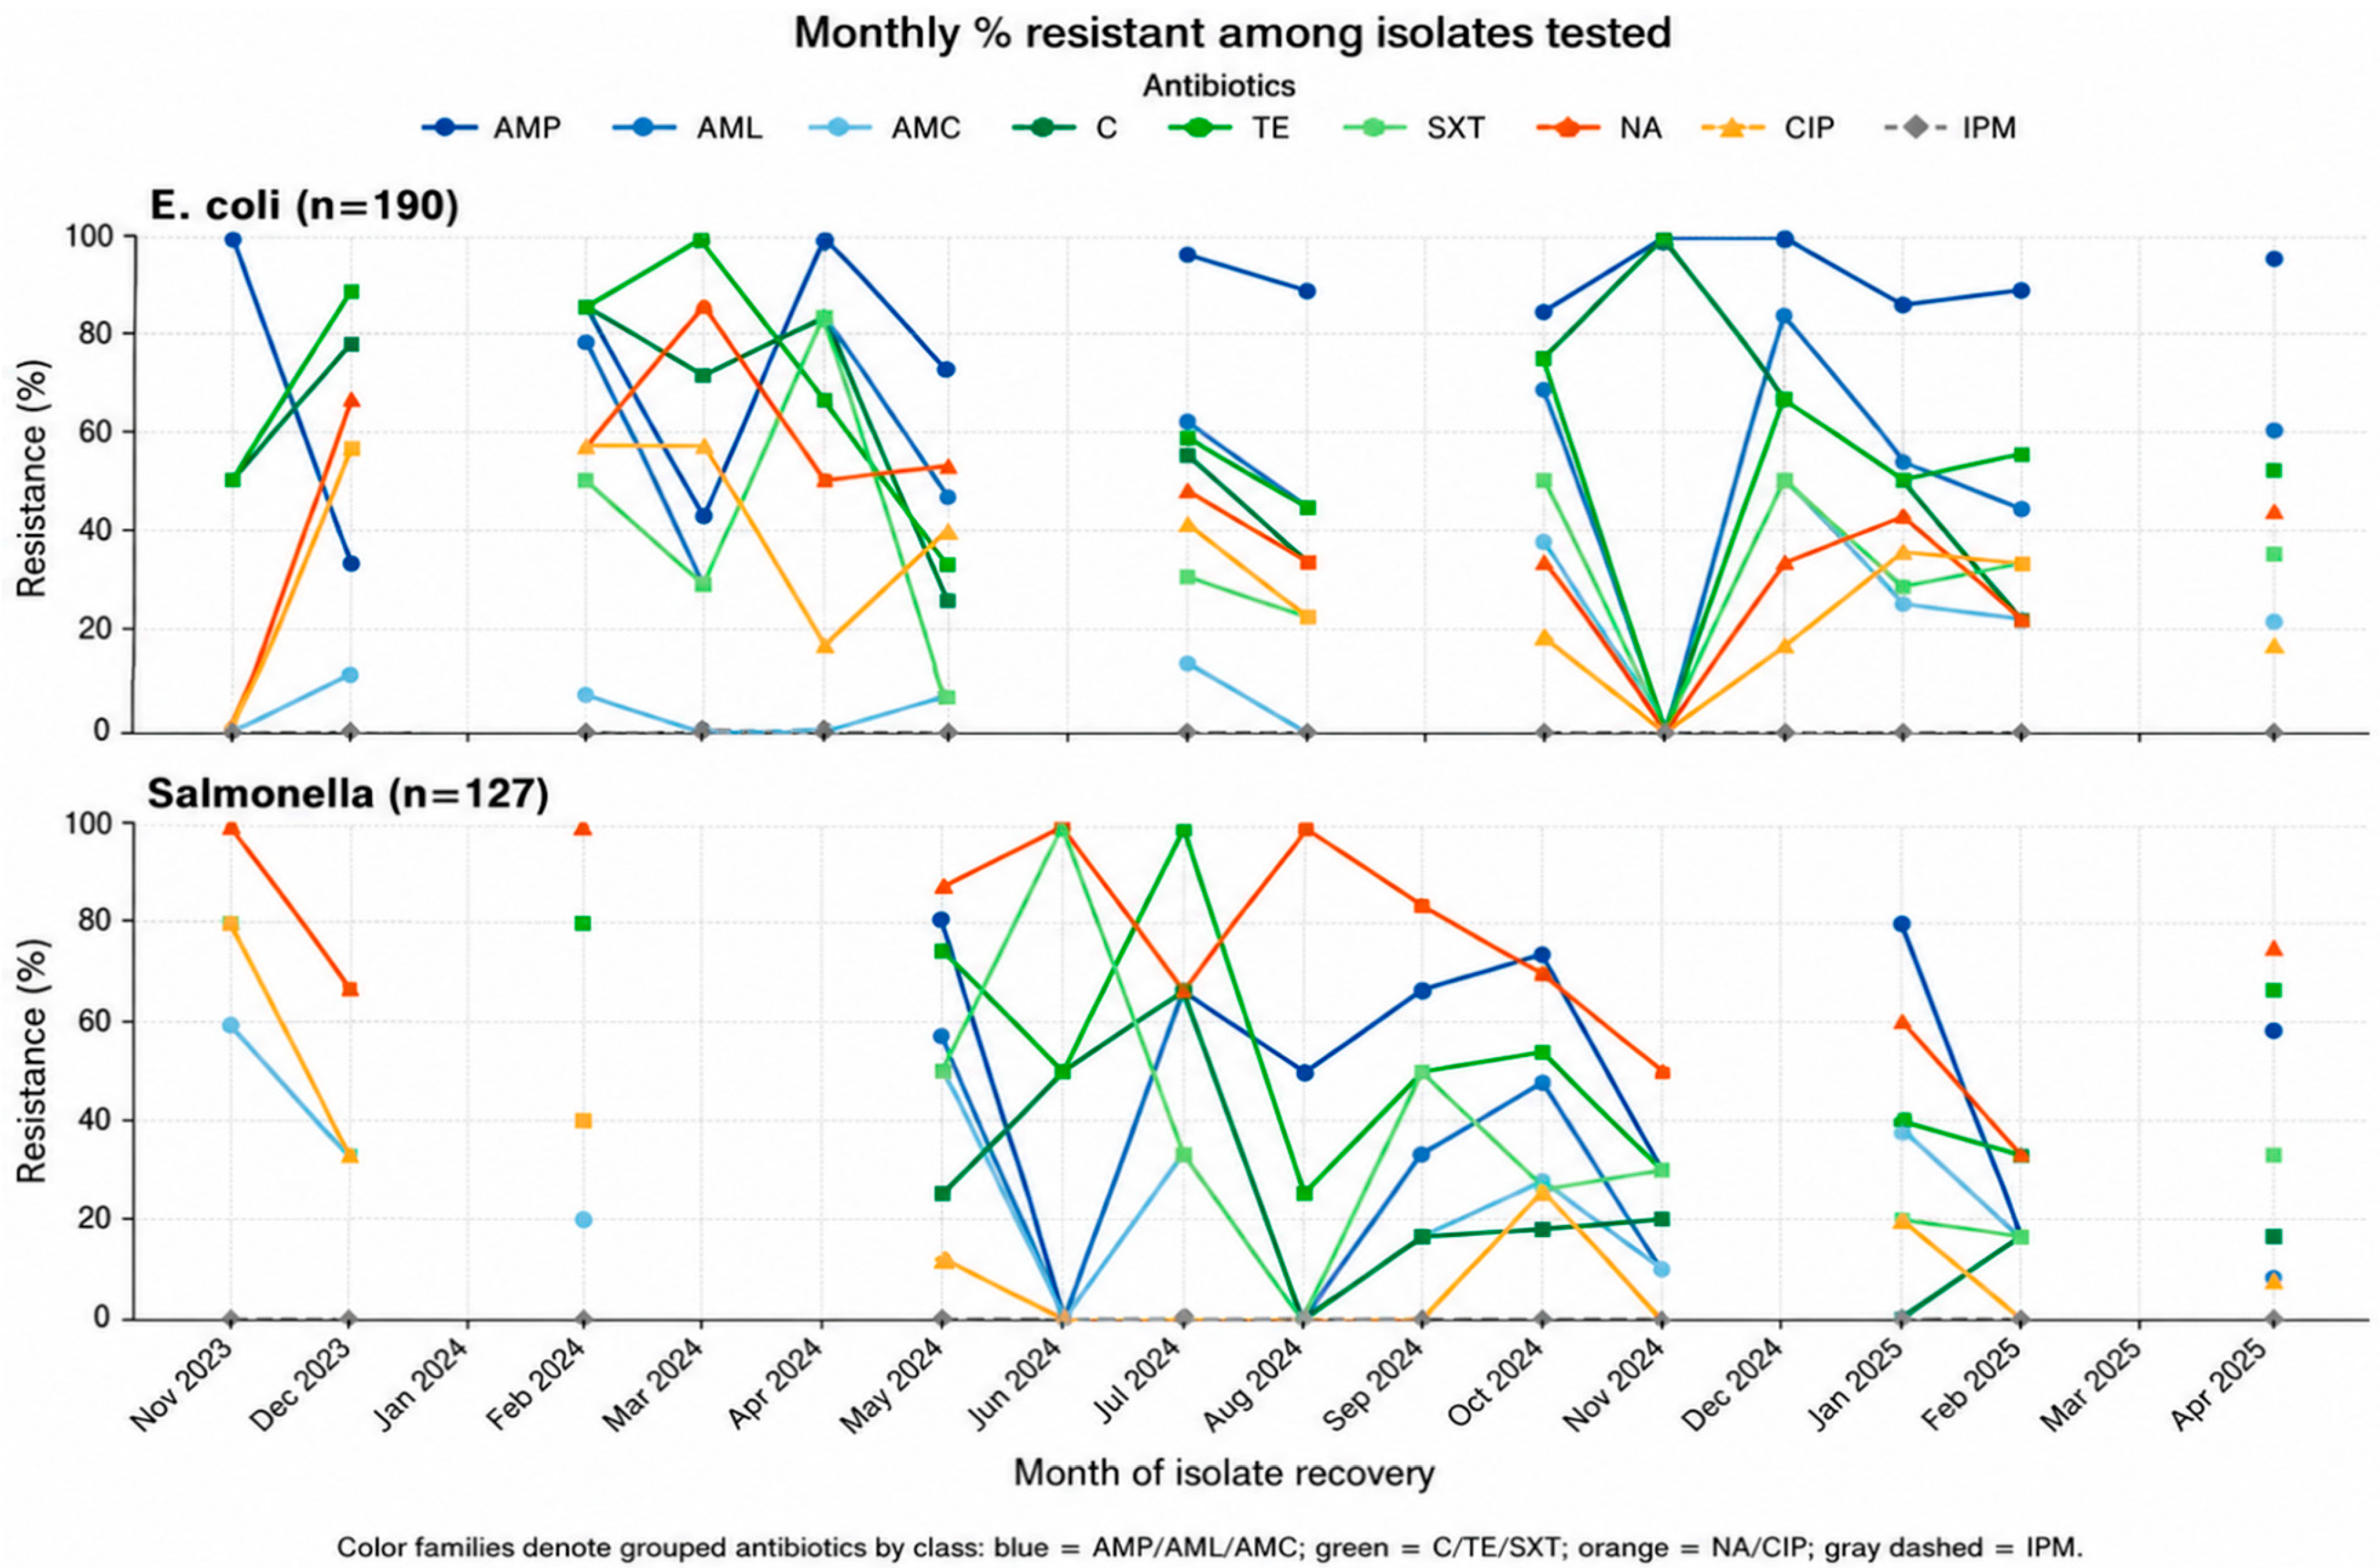
Monthly resistance percentages varied markedly in both bacterial groups (Figure 4). Because the numbers and environmental-matrix composition of isolates differed among months, the curves are descriptive and should not be interpreted as seasonality or as unadjusted evidence of a temporal increase or decrease. The number of isolates tested in each month is provided in Supplementary Table S1.
In E. coli, ampicillin resistance remained frequent across most sampled months, while tetracycline, chloramphenicol, trimethoprim–sulfamethoxazole, nalidixic acid, ciprofloxacin, and amoxicillin–clavulanic acid showed variable monthly percentages. No imipenem resistance was detected in any month. Months represented by few isolates produced unstable percentages and were interpreted cautiously.
In Salmonella spp., nalidixic acid, ampicillin, and tetracycline were the most consistently observed resistance phenotypes, whereas ciprofloxacin, chloramphenicol, trimethoprim–sulfamethoxazole, and amoxicillin–clavulanic acid varied across sampled months. No imipenem resistance was detected. These descriptive patterns were evaluated further only through models that adjusted for matrix and farm-level clustering.
Overall, Figure 4 illustrates repeated detection of resistance during the study period, not a balanced longitudinal time series. Adjusted temporal estimates are reported separately in Section 2.6 and should be interpreted together with the irregular sampling design and the month-level denominators in Supplementary Table S1.

2.6. Temporal Trends in Antimicrobial Resistance Based on Mixed-Effects Logistic Regression

Mixed-effects logistic regression adjusted for sampling matrix and included farm as a random intercept (Table 3). After Benjamini–Hochberg correction, increasing monthly associations remained statistically significant only for ampicillin resistance in E. coli (adjusted OR = 1.22, 95% CI: 1.09–1.35; q = 0.0033) and amoxicillin–clavulanic acid resistance in E. coli (adjusted OR = 1.18, 95% CI: 1.06–1.31; q = 0.0087). No temporal association remained significant for Salmonella spp. after correction. These estimates represent adjusted associations within an irregularly sampled dataset and should not be interpreted as proof of a population-level temporal trend or seasonality.

2.7. Multidrug Resistance Distribution and Predominant Resistance-Class Combinations

Among 190 E. coli isolates, 115 (60.5%) met the MDR definition (Table 4). The highest matrix-specific proportions were observed in farm soil (36/42; 85.7%), drinking troughs (20/24; 83.3%), and poultry manure (28/37; 75.7%). Lower proportions were observed in well water (10/22; 45.5%), soil approximately 200 m from the farms (10/30; 33.3%), and soil approximately 500 m from the farms (11/35; 31.4%).
Among 127 Salmonella spp. isolates, 82 (64.6%) were MDR. The highest proportions occurred in poultry manure (26/28; 92.9%) and drinking troughs (18/23; 78.3%), followed by well water (11/18; 61.1%), soil approximately 200 m from the farms (8/14; 57.1%), and farm soil (18/34; 52.9%). One of ten isolates from soil approximately 500 m from the farms was MDR (10.0%). These matrix-specific estimates describe the sampled isolates and do not demonstrate movement between matrices.
The predominant non-mutually exclusive three-class combination among MDR E. coli was β-lactams–tetracyclines–phenicols (85/115; 73.9%), followed by tetracyclines–phenicols–quinolones (69/115; 60.0%), β-lactams–tetracyclines–quinolones (67/115; 58.3%), and β-lactams–phenicols–quinolones (64/115; 55.7%) (Table 5). Combinations involving folate-pathway inhibitors were also common.
Among MDR Salmonella spp., β-lactams–tetracyclines–quinolones was the most frequent combination (48/82; 58.5%), followed by tetracyclines–quinolones–folate inhibitors (31/82; 37.8%), β-lactams–quinolones–folate inhibitors (29/82; 35.4%), and β-lactams–tetracyclines–folate inhibitors (28/82; 34.1%). An isolate resistant to more than three classes could contribute to several combinations. Complete isolate-level drug and class profiles are provided in Supplementary Table S2.

3. Discussion

This study provides baseline evidence of culture-confirmed, phenotypically antimicrobial-resistant Escherichia coli and Salmonella spp. in broiler-farm environmental matrices in Morocco [23,24,25]. E. coli and Salmonella spp. were detected in 35.0% and 23.4% of 543 samples, respectively, and 60.5% and 64.6% of the corresponding isolates were MDR. After adjustment for matrix, farm-level clustering, and multiple comparisons, only ampicillin and amoxicillin–clavulanic acid resistance in E. coli showed statistically significant positive monthly associations. No adjusted temporal association remained significant for Salmonella spp. The findings describe an environmental AMR burden but do not establish persistence, source attribution, or transmission.
Detection rates differed among matrices. E. coli was detected most frequently in poultry manure, soil approximately 500 m from the farms, and farm soil, whereas Salmonella spp. was most frequently detected in poultry manure, farm soil, and drinking troughs. Frequent recovery from manure and farm soil is compatible with fecal deposition and organic-material accumulation [26]. Detection in drinking troughs may reflect contact with birds or persistence within water-system biofilms [27]. However, matrix comparisons must be interpreted cautiously because recovery can be affected by sample composition, bacterial survival, farm practices, and unequal sampling intensity [28,29,30,31,32,33].
The dominant phenotypic resistance patterns involved ampicillin, tetracycline, chloramphenicol, and quinolone-class agents in E. coli, and nalidixic acid, ampicillin, and tetracycline in Salmonella spp. These profiles are broadly consistent with resistance reported in poultry-associated Enterobacterales [18,34,35,36,37,38]. Because farm-level antimicrobial-use histories were unavailable, resistance cannot be attributed to specific compounds. Resistance to extended-spectrum cephalosporins, aminoglycosides, carbapenems, and colistin was less frequent, but these clinically important phenotypes warrant continued surveillance.
MDR was common in both bacterial groups and was particularly frequent in manure, drinking troughs, and farm soil. The predominant three-class profiles were β-lactams–tetracyclines–phenicols in E. coli and β-lactams–tetracyclines–quinolones in Salmonella spp. These combinations demonstrate phenotypic co-resistance only. Without resistance-gene, plasmid, integron, or whole-genome data, the study cannot determine whether resistance determinants were genetically linked or shared between isolates [18,39].
From a One Health perspective, resistant bacteria detected in manure, farm soil, drinking systems, surrounding soils, and well water support inclusion of poultry-farm environments in AMR surveillance. These matrices may help identify practical intervention points, including manure and litter management, water-line sanitation, well protection, farm biosecurity, and responsible veterinary antimicrobial use [40,41,42,43,44]. The cross-sectional findings should nevertheless be regarded as phenotypic baseline surveillance rather than evidence of transmission.
Detection in soils approximately 200 and 500 m from poultry houses and in well water establishes the presence of resistant bacteria in external environmental matrices. Because strain typing, hydrological assessment, manure-management tracing, and environmental source tracking were not performed, neither the origin nor the direction of bacterial movement can be determined. Runoff, dust, insects, equipment, footwear, or manure transport remain possible hypotheses for future investigation; none was tested here. The results also do not demonstrate exposure or transmission to workers, residents, animals, groundwater, or the food chain.
Strengths of the study include the analysis of 543 samples from six matrices across 13 farms, simultaneous assessment of two relevant bacterial groups, real-time PCR confirmation of Salmonella spp., isolate-level AST reporting, MIC-based colistin testing, and mixed-effects models accounting for matrix and farm clustering. Limitations include purposive farm selection, irregular and unbalanced sampling, lack of bacterial concentration measurements, absence of farm antimicrobial-use and environmental covariates, and retention of one isolate per species per positive sample. Salmonella serotyping was not performed, and phenotypic testing could not identify resistance genes, plasmids, integrons, or genetic relationships. Future work should combine serotyping, whole-genome sequencing, plasmid analysis, hydrological assessment, and source-tracking methods.

4. Materials and Methods

4.1. Study Design, Study Area, and Farms

A cross-sectional field study was conducted in broiler farms in the Rabat–Salé–Kénitra region of Morocco [45]. Sampling occurred on 35 separate dates between 24 November 2023 and 28 April 2025. Intervals between consecutive field dates ranged from 1 to 63 days; some months included multiple visits and others had no sampling. The schedule was determined by farm accessibility, active broiler-production cycles, biosecurity requirements, and field logistics and was not intended to provide fixed monthly or seasonal coverage.
Thirteen farms were selected purposively from farms listed in official registries maintained by the Moroccan agricultural authorities, based on access and availability during the study period. The sample was therefore not a probability sample and should not be considered statistically representative of all farms in the region. All 13 farms were sampled repeatedly; farm totals ranged from 39 to 46 samples collected on 10 to 17 distinct dates. Sampling intensity was not balanced across farms, months, or matrices. Farm-by-matrix and month-by-matrix counts are provided in Supplementary Table S1. The farm locations are shown in Figure 2.

4.2. Sample Collection and Transport

Samples were collected from six matrices during broiler-production cycles: poultry manure (n = 78), drinking troughs (n = 79), farm soil (n = 98), soil approximately 200 m from the poultry houses (n = 79), soil approximately 500 m from the poultry houses (n = 79), and well water (n = 130), for a total of 543 samples. The same farms were visited repeatedly, and one or more matrices were collected according to availability at each visit. Multiple observations from a farm were therefore not assumed to be independent in the temporal models. Row-level sampling metadata and the complete farm/month/matrix distribution are provided in Supplementary Table S1. The study did not follow individual birds or specific flocks; repeated visits could occur during successive commercial broiler-production cycles. Flock diet and farm-level antimicrobial-use histories were not recorded.
Approximately 25 g of each solid matrix was collected aseptically into a sterile sampling bag. Well-water samples were collected in sterile containers. Samples were transported to the laboratory in cooled containers at approximately 4 °C and processed upon arrival.

4.3. Isolation and Identification of Escherichia coli

For solid samples, 25 g was homogenized with 225 mL of buffered peptone water and incubated at 37 °C for 16–24 h. Aliquots were streaked onto eosin methylene blue agar (Oxoid, Basingstoke, UK) and incubated aerobically at 37 °C for 24 h. Colonies with a characteristic green metallic sheen were considered presumptive E. coli and were subcultured on nutrient agar for purification.
For well water, 100 mL was filtered through a 0.45 µm membrane. The membrane was placed on eosin methylene blue agar and incubated aerobically at 37 °C for 24 h. Presumptive colonies were purified as described above.
Biochemical identification was performed with API 20E strips (bioMérieux, Marcy-l’Étoile, France) according to the manufacturer’s instructions. Strips were incubated at 36 ± 2 °C for 18–24 h, and numerical profiles were interpreted with the APIweb™ identification database (bioMérieux; https://apiweb.biomerieux.com; accessed on 18 July 2026). Doubtful or low-discrimination profiles were repeated before inclusion. Confirmed isolates were stored in 20% glycerol at −20 °C.

4.4. Isolation and Identification of Salmonella spp.

For solid samples, 25 g was homogenized with 225 mL of buffered peptone water and incubated at 37 °C for 16–24 h. A 0.1 mL aliquot was transferred to 10 mL of Rappaport–Vassiliadis enrichment broth and incubated at 42 °C for 18 h. Enriched cultures were streaked on xylose lysine deoxycholate agar and incubated at 36 °C for 18–24 h.
For well water, 1 L was filtered through a 0.45 µm membrane. The membrane was transferred to Rappaport–Vassiliadis enrichment broth and incubated at 42 °C for 18 h, after which aliquots were streaked on xylose lysine deoxycholate agar and incubated at 36 °C for 18–24 h.
Presumptive Salmonella colonies were purified on nutrient agar and identified biochemically using API 20E strips according to the manufacturer’s instructions. Profiles were interpreted with APIweb after incubation at 36 ± 2 °C for 18–24 h, and doubtful or low-discrimination profiles were repeated. Biochemically identified isolates were stored in 20% glycerol at −20 °C pending molecular confirmation.

4.5. Molecular Confirmation of Salmonella spp.

All biochemically identified Salmonella spp. isolates were confirmed by real-time PCR. Genomic DNA was extracted from pure-culture bacterial suspensions with the Maxwell® RSC PureFood Pathogen Kit (Promega, Madison, WI, USA), using the manufacturer’s Quick Protocol with the bacterial suspension substituted for the food homogenate. The innuDETECT™ Salmonella spp. Assay (Analytik Jena, Jena, Germany), a TaqMan-based qualitative assay, was run on a QuantStudio™ 5 Real-Time PCR System (Applied Biosystems, Thermo Fisher Scientific, Waltham, MA, USA) according to the manufacturer’s instructions. Positive and negative controls were included in each run. Serovar identification was not performed.

4.6. Antimicrobial Susceptibility Testing

One confirmed isolate per bacterial species and per positive environmental sample was retained for antimicrobial susceptibility testing. When several colonies with the same presumptive morphology were present, one purified representative colony was selected. Consequently, 190 E. coli and 127 Salmonella spp. isolates were tested, and within-sample strain diversity was not assessed.
Disk diffusion was performed on Mueller–Hinton agar (Oxoid, Basingstoke, UK) using a 0.5 McFarland suspension prepared from fresh colonies. Plates were inoculated uniformly, disks were applied, and plates were incubated at 35 ± 2 °C for 16–18 h unless otherwise specified in the applicable table. Zone diameters were measured in millimeters and interpreted using the organism-specific criteria in CLSI M100, 31st edition (2021), Table S2A and associated Salmonella footnotes [46]. E. coli ATCC 25922, the routine CLSI quality-control strain for Enterobacterales, was used to monitor disk-diffusion performance for both E. coli and Salmonella spp.
The categorically interpreted disks were ampicillin (10 µg), amoxicillin–clavulanic acid (20/10 µg), cefoxitin (30 µg), cefotaxime (30 µg), cefepime (30 µg), piperacillin–tazobactam (100/10 µg), gentamicin (10 µg), amikacin (30 µg), nalidixic acid (30 µg), ciprofloxacin (5 µg), levofloxacin (5 µg; E. coli only), trimethoprim–sulfamethoxazole (1.25/23.75 µg), chloramphenicol (30 µg), tetracycline (30 µg), imipenem (10 µg), ertapenem (10 µg), and meropenem (10 µg). Direct amoxicillin (25 µg) and azithromycin (15 µg) results were retained as raw screening observations but excluded from categorical analysis because general CLSI criteria were not applicable. Salmonella levofloxacin disk results were also excluded. Exact susceptible, intermediate or susceptible-dose-dependent, and resistant zone criteria are listed in Supplementary Table S2.
Colistin was not assessed by disk diffusion. MICs were determined for all 317 isolates using the CLSI colistin broth disk elution method [46]. Four tubes containing 10 mL of cation-adjusted Mueller–Hinton broth were prepared as a growth control and at final colistin concentrations of 1, 2, and 4 µg/mL using 10 µg colistin disks. After 30 min of elution at room temperature, 50 µL of a 0.5 McFarland suspension was added to each tube, producing an approximate final inoculum of 7.5 × 10⁵ CFU/mL. Tubes were incubated at 35 ± 2 °C for 16–20 h, and the MIC was the lowest concentration with complete inhibition of visible growth. For Enterobacterales, MICs ≤ 2 µg/mL were categorized as intermediate and MICs ≥4 µg/mL as resistant; CLSI provides no susceptible category. Isolate-level growth patterns and MICs are reported in Supplementary Table S2.

4.7. Definition of Multidrug Resistance

MDR was defined as resistance to at least one antimicrobial agent in three or more antimicrobial classes [47]. Intermediate and susceptible-dose-dependent results were coded as non-resistant. Only agents with applicable categorical interpretation criteria were used for MDR classification; raw amoxicillin and azithromycin screens and Salmonella levofloxacin disk results were excluded. Each antimicrobial class was counted once per isolate.

4.8. Statistical Analysis

Data were summarized by bacterial species, sampling matrix, farm, location, date, and AST profile. Detection rates were calculated as positive samples divided by samples analyzed for each bacterial group and matrix. Resistance percentages were calculated as resistant isolates divided by isolates tested and categorically interpretable for the corresponding agent. Farm- and month-level sample distributions and isolate denominators are provided in Supplementary Table S1.
Temporal associations were evaluated separately for E. coli and Salmonella spp. by mixed-effects logistic regression. Resistance was the binary outcome (resistant = 1; susceptible, intermediate, or susceptible-dose-dependent = 0), and calendar time was coded as months since the first sampling date. Sampling matrix was included as a categorical fixed effect and farm as a random intercept to account for repeated sampling and within-farm clustering. The primary model was resistance ~ month + matrix + (1|farm).
A sampling visit was defined as a farm–date combination. A visit-level random intercept was examined in sensitivity analyses but was not retained when its variance approached zero, convergence was unstable, or model fit was not meaningfully improved. Models were fitted only when at least 10 resistant and 10 non-resistant isolates were available and were not interpreted when complete or quasi-complete separation produced unstable estimates.
Adjusted odds ratios and 95% confidence intervals estimated the association with a one-month increase after adjustment for matrix and farm clustering. Benjamini–Hochberg false-discovery-rate correction was applied separately by species, with q < 0.05 considered statistically significant. Because sampling was irregular and unbalanced, descriptive monthly percentages and adjusted month coefficients were not interpreted as seasonality, causal change, or population-level trends. Analyses were performed in R (R Foundation for Statistical Computing, Vienna, Austria; https://www.r-project.org/; accessed on 18 July 2026) using the lme4 package and the supporting packages broom.mixed, dplyr, tidyr, purrr, and readxl.

5. Conclusions

This phenotypic baseline study detected antimicrobial-resistant E. coli and Salmonella spp. across multiple broiler-farm environmental matrices in Morocco, with a substantial MDR burden in both bacterial groups. Broiler-farm matrices may act as environmental reservoirs and should be incorporated into One Health surveillance and farm-level control programs. However, detection in surrounding soils and well water does not establish origin, persistence, or direction of spread. Serotyping, whole-genome sequencing, hydrological assessment, and source-tracking studies are needed to resolve transmission pathways.

Supplementary Materials

The following supporting information can be downloaded at: https://www.mdpi.com/article/10.3390/antibiotics15080731/s1.

Author Contributions

Conceptualization, W.A., N.A. and L.T.; methodology, W.A., N.A., A.Z. and A.E.; software, W.A.; validation, N.A., A.Z., A.E. and L.T.; formal analysis, W.A.; investigation, W.A., A.Z. and A.E.; resources, N.A., A.Z., A.E. and L.T.; data curation, W.A.; writing—original draft preparation, W.A.; writing—review and editing, W.A., N.A., A.Z., A.E. and L.T.; visualization, W.A.; supervision, N.A. and L.T.; project administration, N.A. and L.T. All authors have read and agreed to the published version of the manuscript.

Funding

This research was conducted as part of the project Life Sciences R&D “One Health Approach for the Genomic Surveillance of Multidrug-Resistant Bacteria, Development of a National Platform, and Investigation of Alternative Sources of Antimicrobial Potentiation,” coordinated by Mohammed VI Polytechnic University (UM6P) and the National Institute of Hygiene (INH), Morocco.

Institutional Review Board Statement

Not applicable. The study involved environmental samples only and included neither human participants nor experimental procedures on live animals.

Informed Consent Statement

Not applicable.

Data Availability Statement

The data presented in this study are available in the article and its Supplementary Materials.

Conflicts of Interest

The authors declare no conflicts of interest.

Abbreviations

The following abbreviations are used in this manuscript:
AbbreviationFull form
AKAmikacin
AMCAmoxicillin–clavulanic acid
AMLAmoxicillin
AMRAntimicrobial resistance
AMPAmpicillin
API 20EAnalytical Profile Index 20E
ARGsAntimicrobial resistance genes
ASTAntimicrobial susceptibility testing
ATCCAmerican Type Culture Collection
AZMAzithromycin
BPWBuffered peptone water
CChloramphenicol
CIConfidence interval
CIPCiprofloxacin
CLSIClinical and Laboratory Standards Institute
CNGentamicin
COLColistin
CTXCefotaxime
E. coliEscherichia coli
EMBEosin methylene blue agar
ETPErtapenem
FDRFalse discovery rate
FEPCefepime
FOXCefoxitin
IPMImipenem
LEVLevofloxacin
MDRMultidrug resistance/multidrug-resistant
MEMMeropenem
MICMinimum inhibitory concentration
NANalidixic acid
OROdds ratio
spp.Species plural
SXTTrimethoprim–sulfamethoxazole
TETetracycline
TZPPiperacillin–tazobactam
WOAHWorld Organization for Animal Health
XLDXylose lysine deoxycholate agar

References

  1. Mottet, A.; Tempio, G. Global Poultry Production: Current State and Future Outlook and Challenges. Worlds Poult. Sci. J. 2017, 73, 245–256. [Google Scholar] [CrossRef] [Scilit]
  2. Betiku, E.; Ogundipe, T.T.; Kalapala, T.; Obe, T. A Mini-Review on Multi-Hurdle Control of Salmonella Along Poultry Production Continuum. Animals 2025, 15, 875. [Google Scholar] [CrossRef] [Scilit] [PubMed]
  3. Ghougal, K.; Dib, A.L.; Lakhdara, N.; Lamri, M.; Baghezza, S.; Azizi, A.; Merrad, R.; Zouikri, A.; Cheraitia, D.; Trouni, M.; et al. Risk Factors Related to Bacterial Contamination by Enterobacteriaceae and Fecal Coliforms and the Prevalence of Salmonella Spp. in Algerian Farms, Slaughterhouses and Butcheries: A Two-Year Follow-up Study. AIMS Agric. Food 2021, 6, 768–785. [Google Scholar] [CrossRef] [Scilit]
  4. Wang, J.; Vaddu, S.; Bhumanapalli, S.; Mishra, A.; Applegate, T.; Singh, M.; Thippareddi, H. A Systematic Review and Meta-Analysis of the Sources of Salmonella in Poultry Production (Pre-Harvest) and Their Relative Contributions to the Microbial Risk of Poultry Meat. Poult. Sci. 2023, 102, 102566. [Google Scholar] [CrossRef] [Scilit] [PubMed]
  5. Risalvato, J.; Sewid, A.H.; Eda, S.; Gerhold, R.W.; Wu, J.J. Strategic Detection of Escherichia coli in the Poultry Industry: Food Safety Challenges, One Health Approaches, and Advances in Biosensor Technologies. Biosensors 2025, 15, 419. [Google Scholar] [CrossRef] [Scilit] [PubMed]
  6. Prestinaci, F.; Pezzotti, P.; Pantosti, A. Antimicrobial Resistance: A Global Multifaceted Phenomenon. Pathog. Glob. Health 2015, 109, 309–318. [Google Scholar] [CrossRef] [Scilit] [PubMed]
  7. Mehdi, Y.; Létourneau-Montminy, M.-P.; Gaucher, M.-L.; Chorfi, Y.; Suresh, G.; Rouissi, T.; Brar, S.K.; Côté, C.; Ramirez, A.A.; Godbout, S. Use of Antibiotics in Broiler Production: Global Impacts and Alternatives. Anim. Nutr. 2018, 4, 170–178. [Google Scholar] [CrossRef] [Scilit] [PubMed]
  8. Usui, M.; Tamura, Y.; Asai, T. Current Status and Future Perspective of Antimicrobial-Resistant Bacteria and Resistance Genes in Animal-Breeding Environments. J. Vet. Med. Sci. 2022, 84, 1292–1298. [Google Scholar] [CrossRef] [Scilit] [PubMed]
  9. Schmerold, I.; Van Geijlswijk, I.; Gehring, R. European Regulations on the Use of Antibiotics in Veterinary Medicine. Eur. J. Pharm. Sci. 2023, 189, 106473. [Google Scholar] [CrossRef] [Scilit] [PubMed]
  10. Cooke, E.; Rendi-Wagner, P. Rising Antimicrobial Resistance in Europe: EMA and ECDC Outline Urgent Actions to Achieve EU Targets. Lancet Reg. Health Eur. 2025, 59, 101539. [Google Scholar] [CrossRef] [Scilit] [PubMed]
  11. Elbehiry, A.; Marzouk, E. From Farm to Fork: Antimicrobial-Resistant Bacterial Pathogens in Livestock Production and the Food Chain. Vet. Sci. 2025, 12, 862. [Google Scholar] [CrossRef] [Scilit] [PubMed]
  12. Tilahun, H.E.; Efa, D.A. Antimicrobial-Resistant Escherichia coli and Salmonella in Poultry Production and Spread and Effect in the One Health Framework. Poult. Sci. 2026, 105, 106752. [Google Scholar] [CrossRef] [Scilit] [PubMed]
  13. Tripathi, A.; Jaiswal, A.; Kumar, D.; Pandit, R.; Blake, D.; Tomley, F.; Joshi, M.; Joshi, C.G.; Dubey, S.K. Whole Genome Sequencing Revealed High Occurrence of Antimicrobial Resistance Genes in Bacteria Isolated from Poultry Manure. Int. J. Antimicrob. Agents 2025, 65, 107452. [Google Scholar] [CrossRef] [Scilit] [PubMed]
  14. Luiken, R.E.C.; Heederik, D.J.J.; Scherpenisse, P.; Van Gompel, L.; van Heijnsbergen, E.; Greve, G.D.; Jongerius-Gortemaker, B.G.M.; Tersteeg-Zijderveld, M.H.G.; Fischer, J.; Juraschek, K.; et al. Determinants for Antimicrobial Resistance Genes in Farm Dust on 333 Poultry and Pig Farms in Nine European Countries. Environ. Res. 2022, 208, 112715. [Google Scholar] [CrossRef] [Scilit] [PubMed]
  15. Hedman, H.D.; Vasco, K.A.; Zhang, L. A Review of Antimicrobial Resistance in Poultry Farming within Low-Resource Settings. Animals 2020, 10, 1264. [Google Scholar] [CrossRef] [Scilit] [PubMed]
  16. EFSA Panel on Biological Hazards (BIOHAZ); Koutsoumanis, K.; Allende, A.; Álvarez-Ordóñez, A.; Bolton, D.; Bover-Cid, S.; Chemaly, M.; Davies, R.; De Cesare, A.; Herman, L.; et al. Role Played by the Environment in the Emergence and Spread of Antimicrobial Resistance (AMR) through the Food Chain. EFSA J. 2021, 19, e06651. [Google Scholar] [CrossRef] [Scilit] [PubMed]
  17. Checcucci, A.; Trevisi, P.; Luise, D.; Modesto, M.; Blasioli, S.; Braschi, I.; Mattarelli, P. Exploring the Animal Waste Resistome: The Spread of Antimicrobial Resistance Genes Through the Use of Livestock Manure. Front. Microbiol. 2020, 11, 1416. [Google Scholar] [CrossRef] [Scilit] [PubMed]
  18. Lopes, E.d.S.; Ferreira Santaren, K.C.; Araujo de Souza, L.C.; Parente, C.E.T.; Picão, R.C.; Jurelevicius, D.d.A.; Seldin, L. Cross-Environmental Cycling of Antimicrobial Resistance in Agricultural Areas Fertilized with Poultry Litter: A One Health Approach. Environ. Pollut. 2024, 363, 125177. [Google Scholar] [CrossRef] [Scilit] [PubMed]
  19. Michaelis, C.; Grohmann, E. Horizontal Gene Transfer of Antibiotic Resistance Genes in Biofilms. Antibiotics 2023, 12, 328. [Google Scholar] [CrossRef] [Scilit] [PubMed]
  20. Kumavath, R.; Gupta, P.; Tatta, E.R.; Mohan, M.S.; Salim, S.A.A.; Busi, S. Unraveling the Role of Mobile Genetic Elements in Antibiotic Resistance Transmission and Defense Strategies in Bacteria. Front. Syst. Biol. 2025, 5, 1557413. [Google Scholar] [CrossRef] [Scilit] [PubMed]
  21. Fang, J.; Chen, Z.; Yu, Z.; Shan, S.; Hou, Y.; Liu, L.; Huang, J.; Li, B.; Guo, J. Biochar Suppresses Conjugative Transfer of Antibiotic Resistance Genes in Manure-Amended Soils. ISME J. 2025, 19, wraf187. [Google Scholar] [CrossRef] [Scilit] [PubMed]
  22. Sanganyado, E.; Gwenzi, W. Antibiotic Resistance in Drinking Water Systems: Occurrence, Removal, and Human Health Risks. Sci. Total Environ. 2019, 669, 785–797. [Google Scholar] [CrossRef] [Scilit] [PubMed]
  23. Gaonkar, P.P.; Huber, L. Addressing Antimicrobial Resistance in United States Poultry: The Critical Need for Environmental Surveillance. J. Am. Vet. Med. Assoc. 2025, 263, 1481–1489. [Google Scholar] [CrossRef] [Scilit] [PubMed]
  24. Sati, H.; Carrara, E.; Savoldi, A.; Hansen, P.; Garlasco, J.; Campagnaro, E.; Boccia, S.; Castillo-Polo, J.A.; Magrini, E.; Garcia-Vello, P.; et al. The WHO Bacterial Priority Pathogens List 2024: A Prioritisation Study to Guide Research, Development, and Public Health Strategies against Antimicrobial Resistance. Lancet Infect. Dis. 2025, 25, 1033–1043. [Google Scholar] [CrossRef] [Scilit] [PubMed]
  25. Maciel-Guerra, A.; Baker, M.; Hu, Y.; Wang, W.; Zhang, X.; Rong, J.; Zhang, Y.; Zhang, J.; Kaler, J.; Renney, D.; et al. Dissecting Microbial Communities and Resistomes for Interconnected Humans, Soil, and Livestock. ISME J. 2023, 17, 21–35. [Google Scholar] [CrossRef] [Scilit] [PubMed]
  26. Cortés, P.; Pokrant, E.; Yévenes, K.; Maddaleno, A.; Flores, A.; Vargas, M.B.; Trincado, L.; Maturana, M.; Lapierre, L.; Cornejo, J. Antimicrobial Residues in Poultry Litter: Assessing the Association of Antimicrobial Persistence with Resistant Escherichia coli Strains. Antibiotics 2025, 14, 89. [Google Scholar] [CrossRef] [Scilit] [PubMed]
  27. Van Rossum, U.; Heyndrickx, M.; Rasschaert, G.; Demaître, N.; Sadiq, F.A.; Boon, N.; Cools, A.; De Reu, K. Hidden Threats: Exploring Biofilm Communities in Broiler Houses and Pig Nursery Units Drinking Water Lines. BMC Microbiol. 2026, 26, 338. [Google Scholar] [CrossRef] [Scilit] [PubMed]
  28. Papić, B.; Mićunović, J.; Slavec, B.; Šemrov, N.; Zorman Rojs, O.; Avberšek, J. A Case Study of Critical Points for the Entry and Spread of Salmonella Infantis in a Broiler Farm. Ir. Vet. J. 2026, 79, 11. [Google Scholar] [CrossRef] [Scilit] [PubMed]
  29. Ssemakadde, T.; Petra, N.P.; Busingye, J.C.; Bazira, J.; Taseera, K. Prevalence, Associated Factors and Antimicrobial Susceptibility Patterns of Salmonella Species and Pathogenic Escherichia coli Isolated from Broiler Poultry Farms in Wakiso District, Uganda. medRxiv 2024, preprint. [Google Scholar] [CrossRef] [Scilit]
  30. Ibrahim, S.; Wei Hoong, L.; Lai Siong, Y.; Mustapha, Z.; C. W. Zalati, C.W.S.; Aklilu, E.; Mohamad, M.; Kamaruzzaman, N.F. Prevalence of Antimicrobial Resistance (AMR) Salmonella spp. and Escherichia coli Isolated from Broilers in the East Coast of Peninsular Malaysia. Antibiotics 2021, 10, 579. [Google Scholar] [CrossRef] [Scilit] [PubMed]
  31. Bezerra, W.G.A.; Silva, I.N.G.d.; Vasconcelos, R.H.; Machado, D.N.; Lopes, E.d.S.; Lima, S.V.G.; Teixeira, R.S.d.C.; Lima, J.B.; Oliveira, F.R.; Maciel, W.C. Isolation and Antimicrobial Resistance of Escherichia coli and Salmonella enterica Subsp. Enterica (O:6,8) in Broiler Chickens. Acta Sci. Vet. 2016, 44, 7. [Google Scholar] [CrossRef] [Scilit]
  32. Hruby, C.E.; Soupir, M.L.; Moorman, T.B.; Pederson, C.; Kanwar, R. Salmonella and Fecal Indicator Bacteria Survival in Soils Amended with Poultry Manure. Water. Air. Soil Pollut. 2018, 229, 32. [Google Scholar] [CrossRef] [Scilit]
  33. Tran, D.T.Q.; Bradbury, M.I.; Ogtrop, F.F.V.; Bozkurt, H.; Jones, B.J.; Mcconchie, R. Environmental Drivers for Persistence of Escherichia coli and Salmonella in Manure-Amended Soils: A Meta-Analysis. J. Food Prot. 2020, 83, 1268–1277. [Google Scholar] [CrossRef] [Scilit] [PubMed]
  34. Bhattarai, R.K.; Basnet, H.B.; Dhakal, I.P.; Devkota, B. Antimicrobial Resistance of Avian Pathogenic Escherichia coli Isolated from Broiler, Layer, and Breeder Chickens. Vet. World 2024, 17, 480–499. [Google Scholar] [CrossRef] [Scilit] [PubMed]
  35. Cruz, V.D.; Alves, D.H.R.; de Souza, J.K.; Menck-Costa, M.F.; de Oliva, B.H.D.; Baptista, A.A.S.; Oba, A.; Matté, F.; Baierle, K.E.B.; da Rocha, S.P.D.; et al. Monitoring the Spread of Multidrug-Resistant Escherichia coli Throughout the Broiler Production Cycle. Antibiotics 2025, 14, 69. [Google Scholar] [CrossRef] [Scilit] [PubMed]
  36. Liao, C.; Peng, J.; Luo, S.; Xie, X.; Li, Y.; Ma, H.; Yu, M.; Ding, Y.; Ma, Y. Antimicrobial Multidrug Resistance of Escherichia coli from Broiler Farms in Zhanjiang, China. PLoS ONE 2025, 20, e0335518. [Google Scholar] [CrossRef] [Scilit] [PubMed]
  37. Liu, X.; Li, X.; Liu, J.; Chen, R.; Liu, R.; Zhao, R.; Zhao, J.; Hao, J.; Yang, S.; Luo, A.; et al. Antimicrobial Resistance of Escherichia coli from Broilers in Large-Scale Poultry Farms in Shandong Province. Front. Microbiol. 2025, 16, 1685522. [Google Scholar] [CrossRef] [Scilit] [PubMed]
  38. Bisola Bello, A.; Olamilekan Adesola, R.; Idris, I.; Yawson Scott, G.; Alfa, S.; Akinfemi Ajibade, F. Combatting Extensively Drug-Resistant Salmonella: A Global Perspective on Outbreaks, Impacts, and Control Strategies. Pathog. Glob. Health 2024, 118, 559–573. [Google Scholar] [CrossRef] [Scilit] [PubMed]
  39. El Hage, R.; El Rayess, Y.; Bonifait, L.; El Hafi, B.; Baugé, L.; Viscogliosi, E.; Hamze, M.; Mathieu, F.; Matar, G.M.; Chemaly, M. A National Study through a ‘Farm-to-Fork’ Approach to Determine Salmonella Dissemination along with the Lebanese Poultry Production Chain. Zoonoses Public Health 2022, 69, 499–513. [Google Scholar] [CrossRef] [Scilit] [PubMed]
  40. Angulo, F.J.; Collignon, P.; Powers, J.H.; Chiller, T.M.; Aidara-Kane, A.; Aarestrup, F.M. World Health Organization Ranking of Antimicrobials According to Their Importance in Human Medicine: A Critical Step for Developing Risk Management Strategies for the Use of Antimicrobials in Food Production Animals. Clin. Infect. Dis. 2009, 49, 132–141. [Google Scholar] [CrossRef] [Scilit] [PubMed]
  41. Lawwyne, L.D.; Ruenghiran, C.; Viriyarampa, S.; Chumsing, S.; Tulayakul, P. Prevalence and Antimicrobial Resistance of Escherichia coli and Salmonella spp. Isolated from Poultry Drinking Water and Cloacal Swab Compared of Two Regions in Thailand. Int. J. Infect. Dis. 2019, 79, 21. [Google Scholar] [CrossRef] [Scilit]
  42. Thi Thanh Huong, C.; Thi Ngoc, P.; Ha Thai, T. Prevalence and Antibiotic Resistance of Salmonella spp. and Escherichia coli Isolated from Poultry Farms in the North Vietnam. J. Dairy Vet. Anim. Res. 2023, 12, 70–75. [Google Scholar] [CrossRef] [Scilit]
  43. Osei, F.B.; Boamah, V.E.; Boakye, Y.D.; Agyare, C.; Abaidoo, R.C. Antibiotic Resistance of Bacteria Isolated from Water Supplies Used in Poultry Production in Ashanti Region of Ghana. Open Microbiol. J. 2021, 15, 7–15. [Google Scholar] [CrossRef] [Scilit]
  44. Piccirillo, A.; Tolosi, R.; Mughini-Gras, L.; Kers, J.G.; Laconi, A. Drinking Water and Biofilm as Sources of Antimicrobial Resistance in Free-Range Organic Broiler Farms. Antibiotics 2024, 13, 808. [Google Scholar] [CrossRef] [Scilit] [PubMed]
  45. Barkok, A. Revue du Secteur Avicole: Maroc; Food and Agriculture Organization of the United Nations: Rome, Italy, 2008; p. 52. [Google Scholar]
  46. Clinical and Laboratory Standards Institute. Performance Standards for Antimicrobial Susceptibility Testing, 31st ed.; CLSI supplement M100; Clinical and Laboratory Standards Institute: Malvern, PA, USA, 2021. [Google Scholar]
  47. Magiorakos, A.P.; Srinivasan, A.; Carey, R.B.; Carmeli, Y.; Falagas, M.E.; Giske, C.G.; Harbarth, S.; Hindler, J.F.; Kahlmeter, G.; Olsson-Liljequist, B.; et al. Multidrug-Resistant, Extensively Drug-Resistant and Pandrug-Resistant Bacteria: An International Expert Proposal for Interim Standard Definitions for Acquired Resistance. Clin. Microbiol. Infect. 2012, 18, 268–281. [Google Scholar] [CrossRef] [Scilit] [PubMed]
Figure 1. Monthly numbers of Escherichia coli- and Salmonella spp.-positive samples from November 2023 to April 2025. Monthly sample denominators are provided in Supplementary Table S1.
Antibiotics 15 00731 g001
Figure 2. Geographical distribution of Escherichia coli and Salmonella spp. detections in broiler-farm environments in the Rabat–Salé–Kénitra region, Morocco. Circle size represents the total number of detections per farm, split-circle sectors show the relative contributions of the two bacterial groups, and F1–F13 identify the farms.
Antibiotics 15 00731 g002
Figure 3. Phenotypic antimicrobial resistance among Escherichia coli (n = 190) and Salmonella spp. (n = 127) recovered from broiler-farm environmental samples. Colistin values are based on MIC testing. Salmonella levofloxacin disk results were not interpreted categorically. Agents lacking applicable general CLSI M100 criteria were excluded from the figure. AMP: ampicillin; AMC: amoxicillin–clavulanic acid; FOX: cefoxitin; CTX: cefotaxime; FEP: cefepime; TZP: piperacillin–tazobactam; CN: gentamicin; AK: amikacin; NA: nalidixic acid; CIP: ciprofloxacin; LEV: levofloxacin; SXT: trimethoprim–sulfamethoxazole; C: chloramphenicol; TE: tetracycline; COL: colistin; IPM: imipenem; ETP: ertapenem; MEM: meropenem.
Antibiotics 15 00731 g003
Figure 4. Descriptive monthly resistance percentages among Escherichia coli and Salmonella spp. isolates. The denominator for each monthly percentage is the number of isolates of the corresponding bacterial group recovered in that month. AMP: ampicillin; AMC: amoxicillin–clavulanic acid; C: chloramphenicol; TE: tetracycline; SXT: trimethoprim–sulfamethoxazole; NA: nalidixic acid; CIP: ciprofloxacin; IPM: imipenem. Monthly denominators are provided in Supplementary Table S1.
Antibiotics 15 00731 g004
Table 1. Detection rates of Escherichia coli and Salmonella spp. according to environmental matrix in broiler farms.
Matrix/SourceE. coli Positive, nE. coli Detection Rate (%)Salmonella spp. Positive, nSalmonella Detection Rate (%)Samples Analyzed, n
Poultry manure3747.42835.978
Well water2216.91813.8130
Soil4242.93434.798
Soil around 200 m3038.01417.779
Soil around 500 m3544.31012.779
Drinking trough2430.42329.179
Total19035.012723.4543
Bold indicates the total summary row.
Table 2. Geographical distribution of E. coli and Salmonella spp. detections according to study location.
LocationE. coli Detected, n (%)Salmonella spp. Detected, n (%)
Sidi Yahia61 (32.1)37 (29.1)
Mers El Kheir45 (23.7)30 (23.6)
Sala Jadida45 (23.7)29 (22.8)
Shoul39 (20.5)31 (24.4)
Total190 (100)127 (100)
Percentages represent the proportion of total positive detections for each bacterial group. Bold indicates the total summary row.
Table 3. Adjusted monthly associations with antimicrobial resistance estimated by mixed-effects logistic regression.
SpeciesAntibioticResistant Isolates, n/N (%)Adjusted OR Per Month (95% CI)Raw p-ValueBH-FDR q-Value
E. coliAmpicillin (AMP)161/190 (84.7%)1.22 (1.09–1.35)0.00030.0033
E. coliNalidixic acid (NA)85/190 (44.7%)0.96 (0.90–1.02)0.19270.2630
E. coliTrimethoprim–sulfamethoxazole (SXT)69/190 (36.3%)1.02 (0.95–1.09)0.66080.7342
E. coliAmoxicillin (AML)Raw screen only
E. coliAmoxicillin–clavulanic acid (AMC)36/190 (18.9%)1.18 (1.06–1.31)0.00170.0087
E. coliLevofloxacin (LEV)47/190 (24.7%)1.00 (0.93–1.07)0.97830.9783
E. coliCiprofloxacin (CIP)62/190 (32.6%)0.93 (0.86–1.00)0.04170.1041
E. coliChloramphenicol (C)106/190 (55.8%)0.92 (0.85–1.00)0.05680.1135
E. coliTetracycline (TE)117/190 (61.6%)0.95 (0.88–1.03)0.21040.2630
E. coliAzithromycin (AZM)Raw screen only
Salmonella spp.Ampicillin (AMP)78/127 (61.4%)1.07 (0.96–1.18)0.21910.2921
Salmonella spp.Nalidixic acid (NA)93/127 (73.2%)0.90 (0.79–1.03)0.11710.2341
Salmonella spp.Trimethoprim–sulfamethoxazole (SXT)43/127 (33.9%)0.88 (0.79–0.98)0.02490.0995
Salmonella spp.Tetracycline (TE)71/127 (55.9%)0.95 (0.85–1.06)0.37440.3744
Model: resistance ~ month + matrix + (1 | farm). Resistant isolates were coded 1 and susceptible, intermediate, or susceptible-dose-dependent results were coded 0. Odds ratios describe the adjusted association with a one-month increase. Benjamini–Hochberg correction was applied separately by species; bold values indicate q < 0.05. Models with sparse outcomes, separation, or unstable estimates were excluded. Amoxicillin and azithromycin screening results were not modeled because applicable general CLSI M100 categorical criteria were unavailable.
Table 4. Distribution of multidrug-resistant E. coli and Salmonella spp. isolates according to environmental matrix.
Matrix/SourceE. coli Positive IsolatesMDR E. coli, n (%)Salmonella Positive IsolatesMDR Salmonella spp., n (%)Samples Analyzed
Poultry manure3728 (75.7)2826 (92.9)78
Drinking trough2420 (83.3)2318 (78.3)79
Soil4236 (85.7)3418 (52.9)98
Soil around 200 m3010 (33.3)148 (57.1)79
Soil around 500 m3511 (31.4)101 (10.0)79
Well water2210 (45.5)1811 (61.1)130
Overall190115 (60.5)12782 (64.6)543
Percentages were calculated among positive isolates of the corresponding bacterial group within each matrix. MDR classification used only antimicrobial agents with applicable categorical interpretation criteria. Bold indicates the overall summary row.
Table 5. Most frequent three-class multidrug-resistance combinations among Escherichia coli and Salmonella spp. isolates.
SpeciesMDR Class CombinationNumberPercentage of MDR Isolates
E. coliβ-lactams–tetracyclines–phenicols8573.9%
E. colitetracyclines–phenicols–quinolones6960.0%
E. coliβ-lactams–tetracyclines–quinolones6758.3%
E. coliβ-lactams–phenicols–quinolones6455.7%
E. coliβ-lactams–tetracyclines–folate inhibitors6153.0%
E. colitetracyclines–phenicols–folate inhibitors6052.2%
E. coliβ-lactams–phenicols–folate inhibitors6052.2%
Salmonella spp.β-lactams–tetracyclines–quinolones4858.5%
Salmonella spp.tetracyclines–quinolones–folate inhibitors3137.8%
Salmonella spp.β-lactams–quinolones–folate inhibitors2935.4%
Salmonella spp.β-lactams–tetracyclines–folate inhibitors2834.1%
Salmonella spp.tetracyclines–phenicols–folate inhibitors2125.6%
Salmonella spp.phenicols–quinolones–folate inhibitors2024.4%
Values are the number and percentage of MDR isolates resistant to at least one agent in each indicated class. Denominators were 115 MDR E. coli isolates and 82 MDR Salmonella spp. isolates. Combinations were non-mutually exclusive and therefore do not sum to 100%. Full isolate-level profiles are provided in Supplementary Table S2.
Disclaimer/Publisher’s Note: The statements, opinions and data contained in all publications are solely those of the individual author(s) and contributor(s) and not of MDPI and/or the editor(s). MDPI and/or the editor(s) disclaim responsibility for any injury to people or property resulting from any ideas, methods, instructions or products referred to in the content.