
Development of a UHPLC-UV/Vis Method for Simultaneously Determining Six Beta-Lactam Antibiotics in Plasma: A Tool for the Clinical Implementation of Therapeutic Monitoring of Beta-Lactams
 ,
,  , , and
Abstract
1. Introduction
2. Results
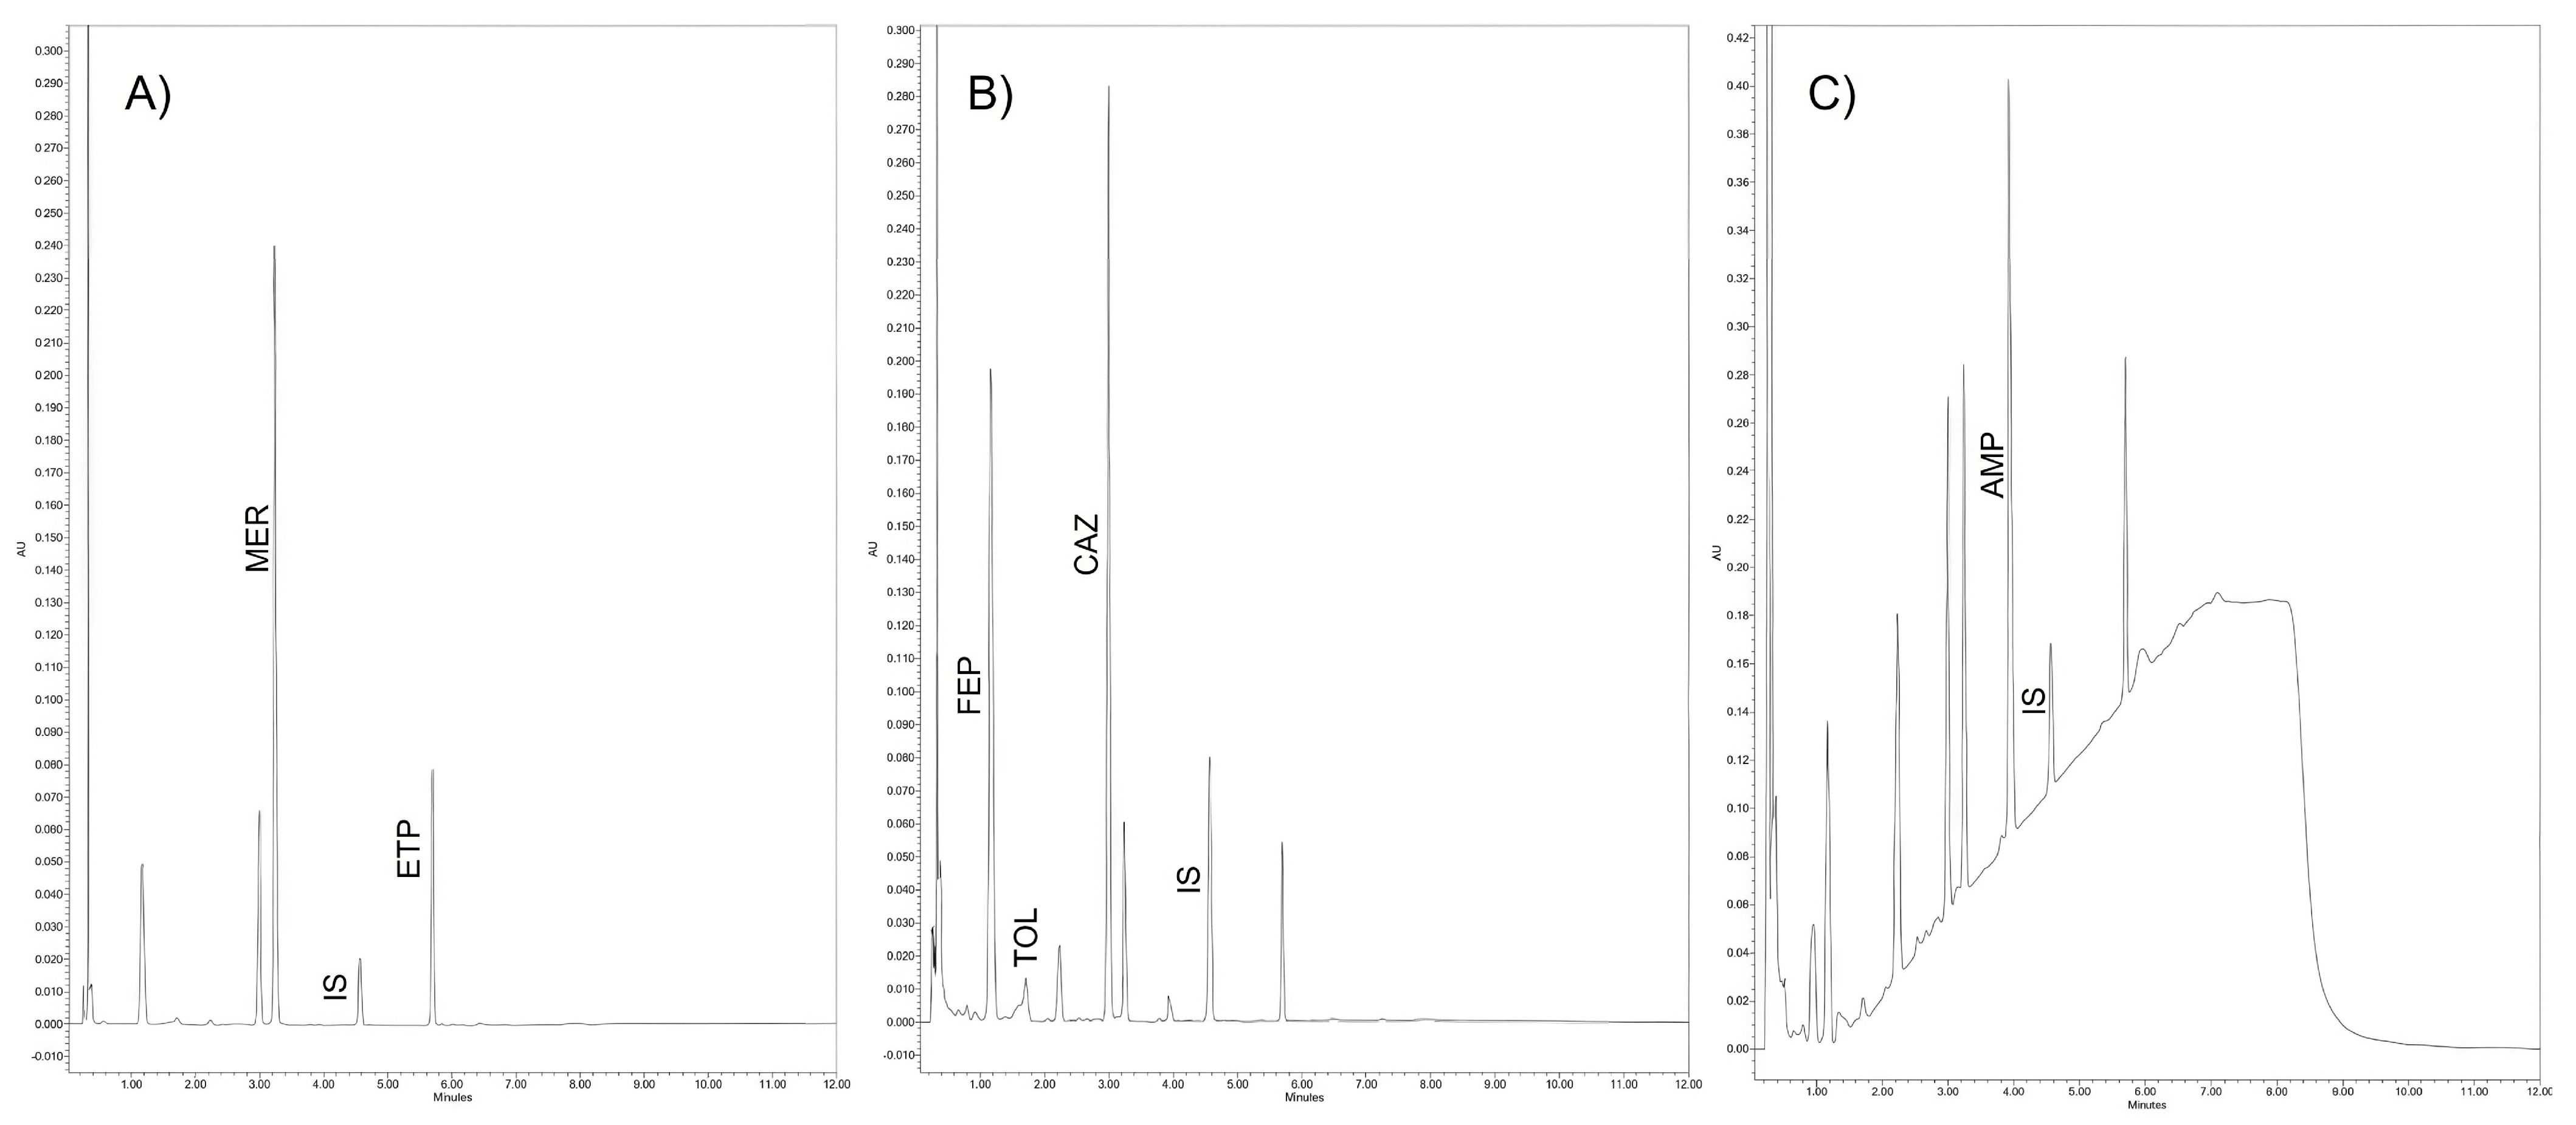
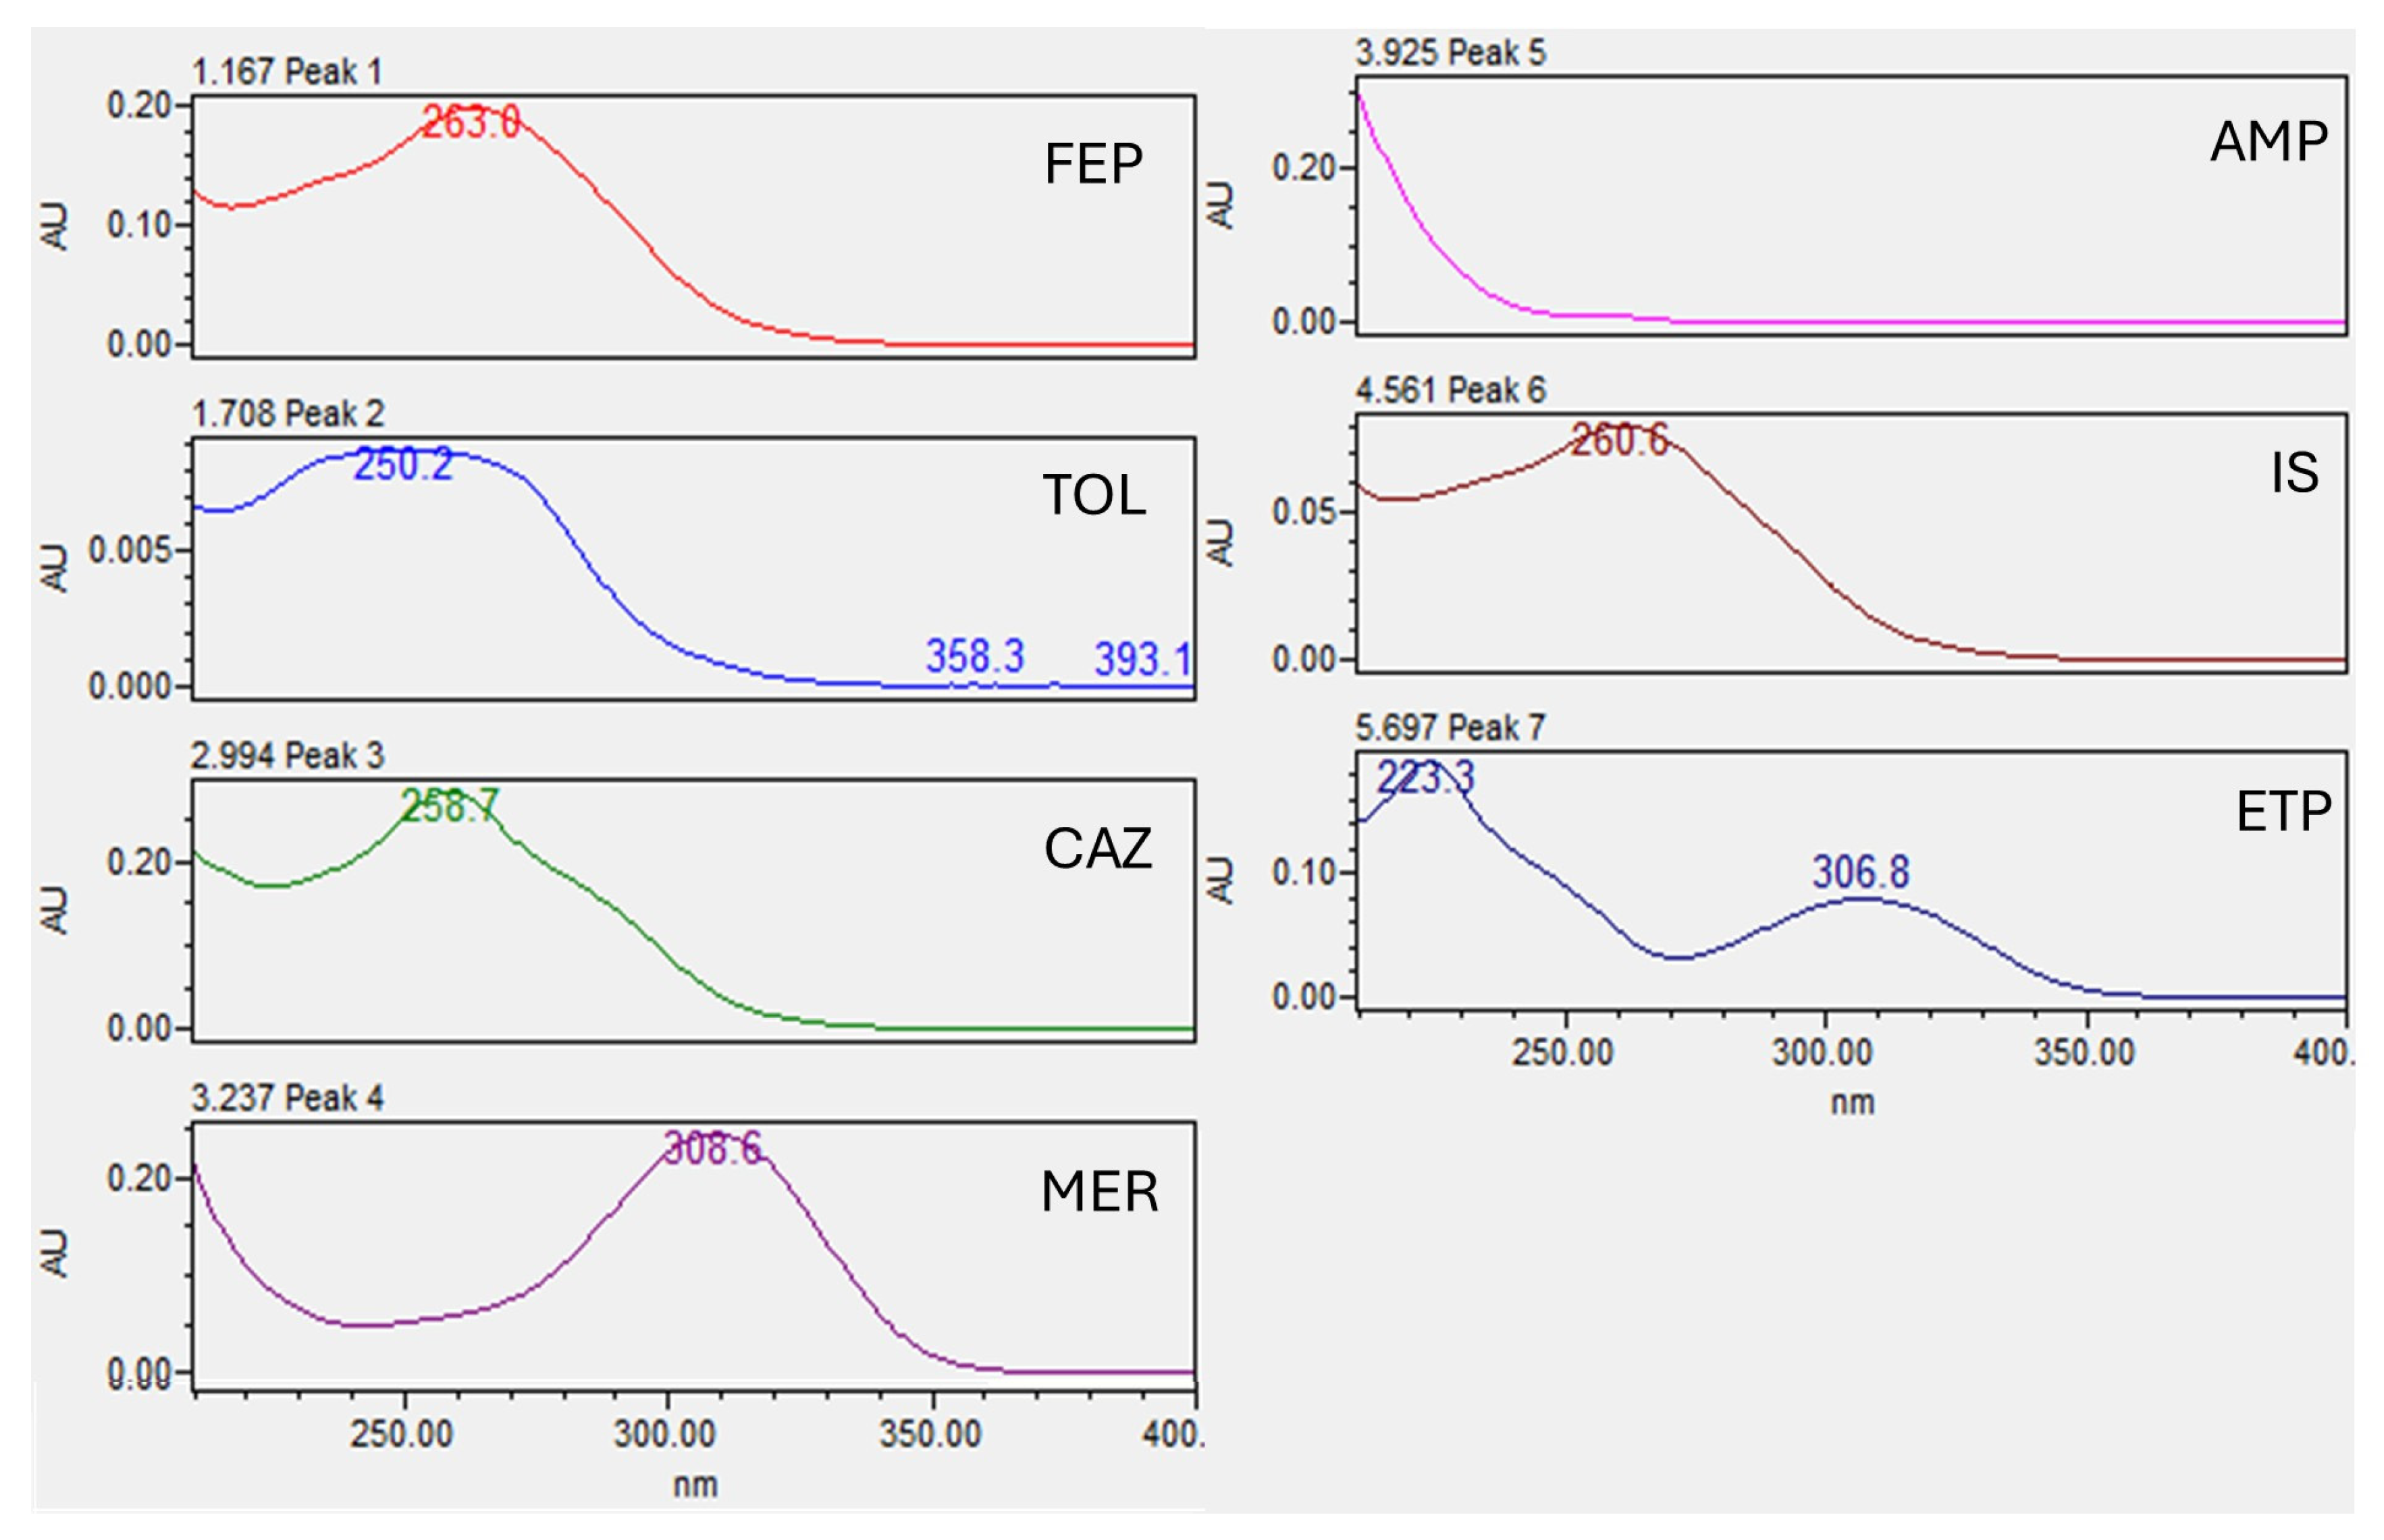
2.1. Chromatography
2.2. Validation of the Method
2.2.1. Selectivity and Carryover
2.2.2. Calibration Curve and Lower Limit of Quantification (LLOQ)
2.2.3. Accuracy and Precision of Quality Controls and Dilution Integrity
2.2.4. Internal Validation
2.3. Stability
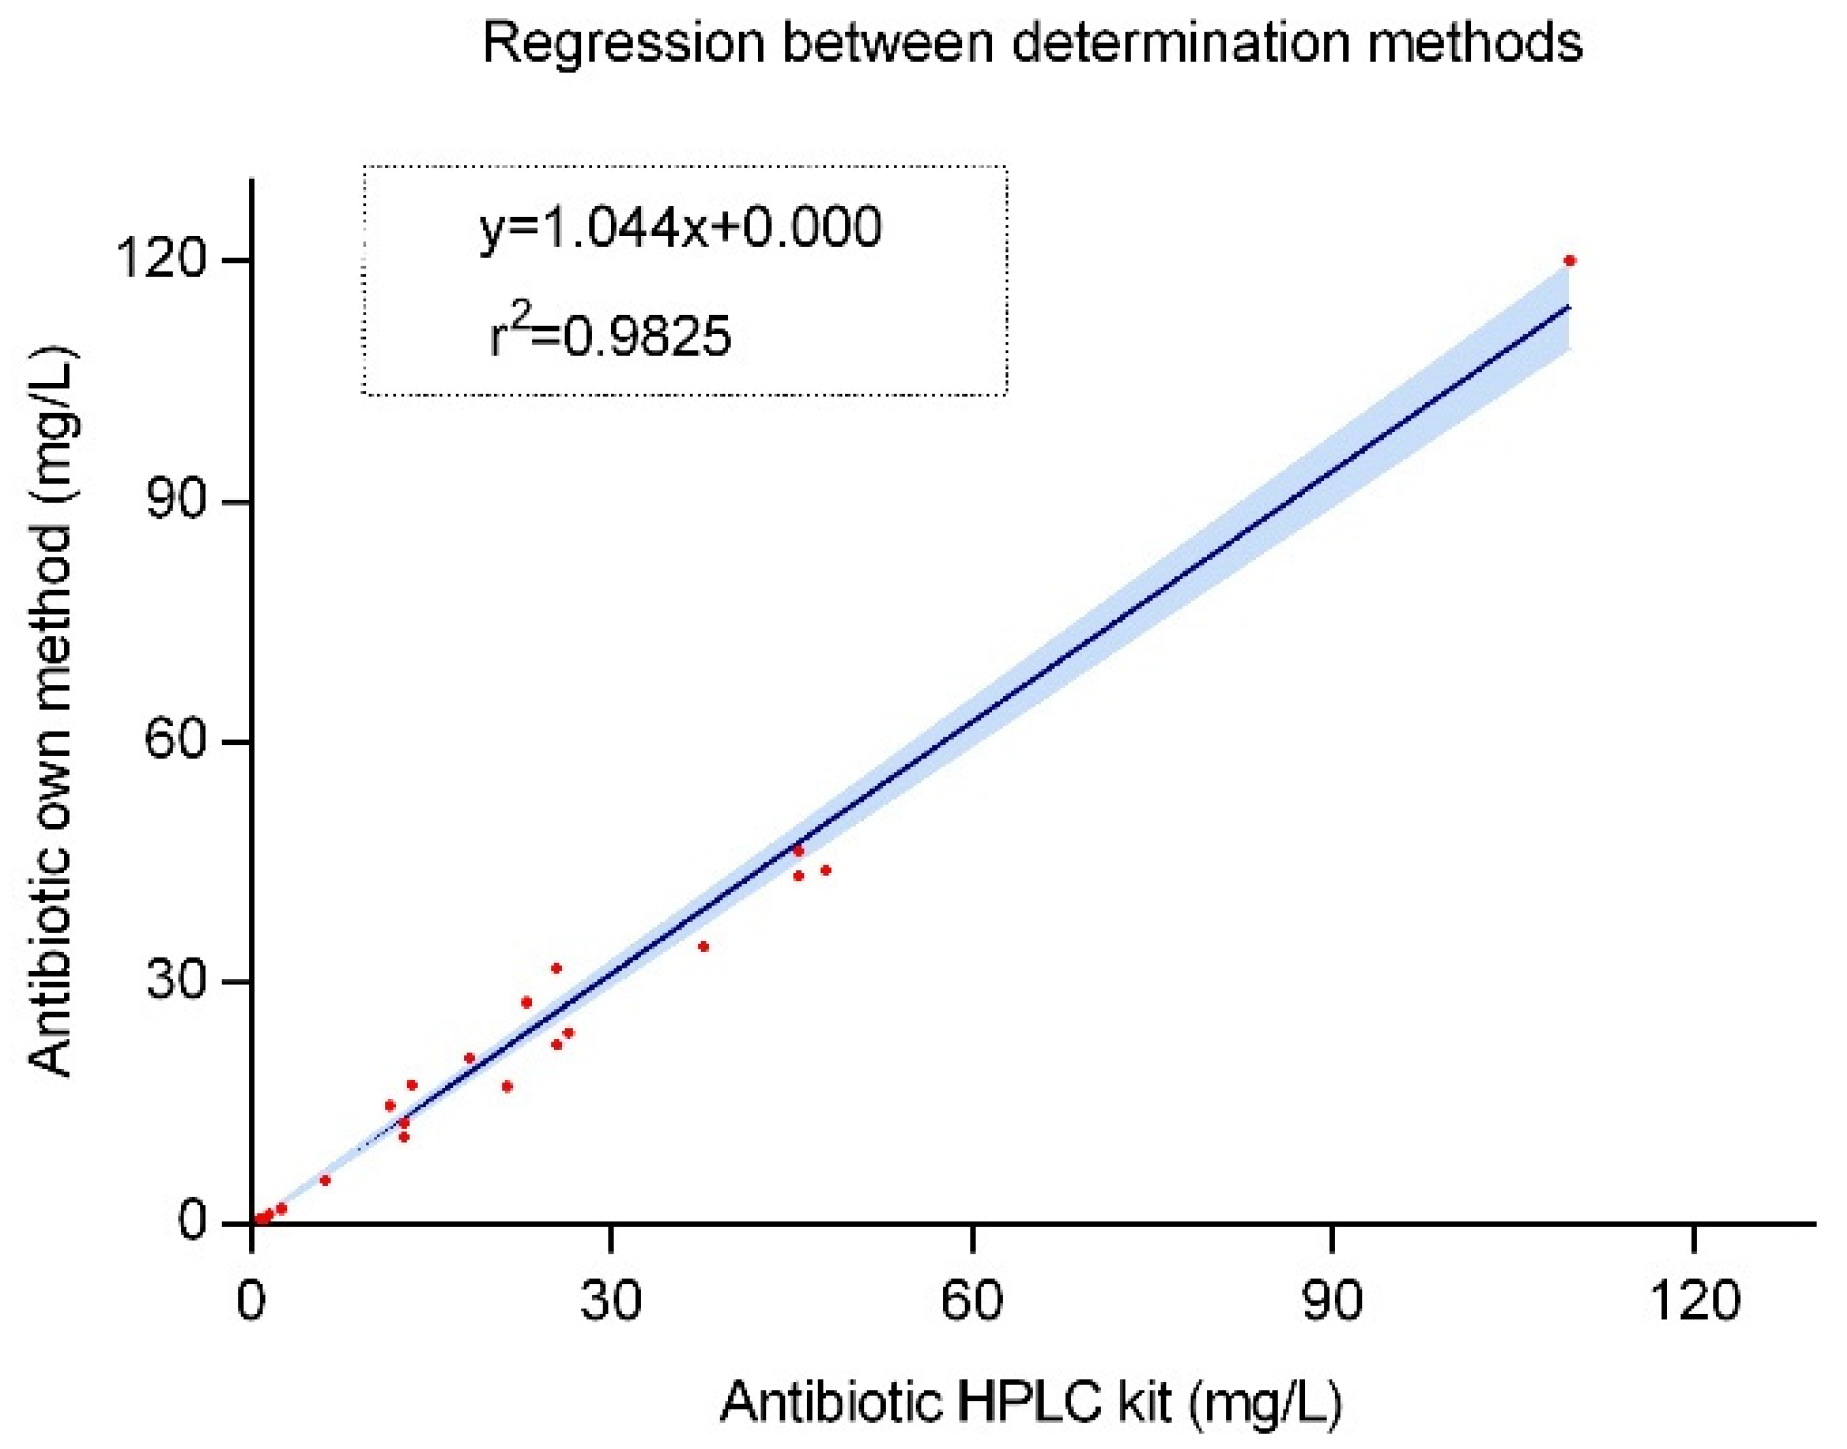
2.4. Clinical Implementation
3. Discussion
4. Materials and Methods
4.1. Reactives
4.2. Preparation of Stock Solutions and Working Solutions
4.3. Sample Preparation
4.4. Chromatography System
4.5. Validation of the Method
4.5.1. Selectivity
4.5.2. Carryover
4.5.3. Calibration Curve and Lower Limit of Quantification (LLOQ)
4.5.4. Precision and Accuracy
4.5.5. Dilution Integrity
4.5.6. Internal Validation
4.6. Stability Assay
4.7. Clinical Implementation
5. Conclusions
6. Future Directions
Supplementary Materials
Author Contributions
Funding
Institutional Review Board Statement
Informed Consent Statement
Data Availability Statement
Conflicts of Interest
References
- β-Lactams and β-Lactamase Inhibitors: An Overview–PubMed. Available online: https://pubmed.ncbi.nlm.nih.gov/27329032/ (accessed on 10 December 2024).
- Verdier, M.-C.; Tribut, O.; Tattevin, P.; Le Tulzo, Y.; Michelet, C.; Bentué-Ferrer, D. Simultaneous determination of 12 beta-lactam antibiotics in human plasma by high-performance liquid chromatography with UV detection: Application to therapeutic drug monitoring. Antimicrob. Agents Chemother. 2011, 55, 4873–4879. [Google Scholar] [CrossRef] [PubMed]
- Abdul-Aziz, M.H.; Alffenaar, J.-W.C.; Bassetti, M.; Bracht, H.; Dimopoulos, G.; Marriott, D.; Neely, M.N.; Paiva, J.-A.; Pea, F.; Sjovall, F.; et al. Antimicrobial therapeutic drug monitoring in critically ill adult patients: A Position Paper. Intensive Care Med. 2020, 46, 1127–1153. [Google Scholar] [CrossRef] [PubMed]
- Pai Mangalore, R.; Ashok, A.; Lee, S.J.; Romero, L.; Peel, T.N.; Udy, A.A.; Peleg, A.Y. Beta-Lactam Antibiotic Therapeutic Drug Monitoring in Critically Ill Patients: A Systematic Review and Meta-Analysis. Clin. Infect. Dis. 2022, 75, 1848–1860. [Google Scholar] [CrossRef] [PubMed]
- Veiga, R.P.; Paiva, J.-A. Pharmacokinetics-pharmacodynamics issues relevant for the clinical use of beta-lactam antibiotics in critically ill patients. Crit. Care 2018, 22, 233. [Google Scholar] [CrossRef]
- Roberts, J.A.; Ulldemolins, M.; Roberts, M.S.; McWhinney, B.; Ungerer, J.; Paterson, D.L.; Lipman, J. Therapeutic drug monitoring of beta-lactams in critically ill patients: Proof of concept. Int. J. Antimicrob. Agents 2010, 36, 332–339. [Google Scholar] [CrossRef]
- Novy, E.; Martinière, H.; Roger, C. The Current Status and Future Perspectives of Beta-Lactam Therapeutic Drug Monitoring in Critically Ill Patients. Antibiotics 2023, 12, 681. [Google Scholar] [CrossRef]
- Briscoe, S.E.; McWhinney, B.C.; Lipman, J.; Roberts, J.A.; Ungerer, J.P.J. A method for determining the free (unbound) concentration of ten beta-lactam antibiotics in human plasma using high performance liquid chromatography with ultraviolet detection. J. Chromatogr. B Analyt. Technol. Biomed. Life. Sci. 2012, 907, 178–184. [Google Scholar] [CrossRef]
- McWhinney, B.C.; Wallis, S.C.; Hillister, T.; Roberts, J.A.; Lipman, J.; Ungerer, J.P.J. Analysis of 12 beta-lactam antibiotics in human plasma by HPLC with ultraviolet detection. J. Chromatogr. B Analyt. Technol. Biomed. Life. Sci. 2010, 878, 2039–2043. [Google Scholar] [CrossRef]
- Bricheux, A.; Lenggenhager, L.; Hughes, S.; Karmime, A.; Lescuyer, P.; Huttner, A. Therapeutic drug monitoring of imipenem and the incidence of toxicity and failure in hospitalized patients: A retrospective cohort study. Clin. Microbiol. Infect. 2019, 25, 383.e1–383.e4. [Google Scholar] [CrossRef]
- Ikeda, K.; Morikawa, N.; Kuribayashi, M.; Ikawa, K.; Nomura, K.; Taniwaki, M. Real-time therapeutic drug monitoring of cefozopran in plasma using high-performance liquid chromatography with ultraviolet detection. J. Pharm. Biomed. Anal. 2007, 45, 811–816. [Google Scholar] [CrossRef]
- Eldougdoug, M.W.; Youssef, D.M.; El-Shal, A.S.; Sharaf, Y.A.; Raparla, S.; Jasti, B.R.; Elnahas, H.M. Evaluation of ceftriaxone pharmacokinetics in hospitalized Egyptian pediatric patients. Eur. J. Pediatr. 2023, 182, 4407–4420. [Google Scholar] [CrossRef]
- Denooz, R.; Charlier, C. Simultaneous determination of five beta-lactam antibiotics (cefepim, ceftazidim, cefuroxim, meropenem and piperacillin) in human plasma by high-performance liquid chromatography with ultraviolet detection. J. Chromatogr. B Analyt. Technol. Biomed. Life. Sci. 2008, 864, 161–167. [Google Scholar] [CrossRef] [PubMed]
- Zaragoza, R.; Vidal-Cortés, P.; Aguilar, G.; Borges, M.; Diaz, E.; Ferrer, R.; Maseda, E.; Nieto, M.; Nuvials, F.X.; Ramirez, P.; et al. Update of the treatment of nosocomial pneumonia in the ICU. Crit. Care 2020, 24, 383. [Google Scholar] [CrossRef] [PubMed]
- D’Cunha, R.; Bach, T.; Young, B.A.; Li, P.; Nalbant, D.; Zhang, J.; Winokur, P.; An, G. Quantification of Cefepime, Meropenem, Piperacillin, and Tazobactam in Human Plasma Using a Sensitive and Robust Liquid Chromatography-Tandem Mass Spectrometry Method, Part 1: Assay Development and Validation. Antimicrob. Agents Chemother. 2018, 62, e00859-18. [Google Scholar] [CrossRef] [PubMed]
- Barreto, E.F.; Chitre, P.N.; Pine, K.H.; Shepel, K.K.; Rule, A.D.; Alshaer, M.H.; Abdul Aziz, M.H.; Roberts, J.A.; Scheetz, M.H.; Ausman, S.E.; et al. Why is the Implementation of Beta-Lactam Therapeutic Drug Monitoring for the Critically Ill Falling Short? A Multicenter Mixed-Methods Study. Ther. Drug Monit. 2023, 45, 508–518. [Google Scholar] [CrossRef] [PubMed]
- Venugopalan, V.; Hamza, M.; Santevecchi, B.; DeSear, K.; Cherabuddi, K.; Peloquin, C.A.; Alshaer, M.H. Implementation of a β-lactam therapeutic drug monitoring program: Experience from a large academic medical center. Am. J. Health Syst. Pharm 2022, 79, 1586–1591. [Google Scholar] [CrossRef] [PubMed]
- Antibiotics in Serum/Plasma–HPLC. Available online: https://chromsystems.com/en/antibiotics-in-serum-plasma-hplc-61000.html (accessed on 10 December 2024).
- Guilhaumou, R.; Benaboud, S.; Bennis, Y.; Dahyot-Fizelier, C.; Dailly, E.; Gandia, P.; Goutelle, S.; Lefeuvre, S.; Mongardon, N.; Roger, C.; et al. Optimization of the treatment with beta-lactam antibiotics in critically ill patients-guidelines from the French Society of Pharmacology and Therapeutics (Société Française de Pharmacologie et Thérapeutique-SFPT) and the French Society of Anaesthesia and Intensive Care Medicine (Société Française d’Anesthésie et Réanimation-SFAR). Crit. Care 2019, 23, 104. [Google Scholar] [CrossRef]
- Shipkova, M.; López, O.M.; Picard, N.; Noceti, O.; Sommerer, C.; Christians, U.; Wieland, E. Analytical Aspects of the Implementation of Biomarkers in Clinical Transplantation. Ther. Drug Monit. 2016, 38 (Suppl. S1), S80–S92. [Google Scholar] [CrossRef]
- Adaway, J.E.; Keevil, B.G.; Owen, L.J. Liquid chromatography tandem mass spectrometry in the clinical laboratory. Ann. Clin. Biochem. 2015, 52, 18–38. [Google Scholar] [CrossRef]
- Parker, S.L.; Pandey, S.; Sime, F.B.; Stuart, J.; Lipman, J.; Roberts, J.A.; Wallis, S.C. A validated LC-MS/MS method for the simultaneous quantification of the novel combination antibiotic, ceftolozane-tazobactam, in plasma (total and unbound), CSF, urine and renal replacement therapy effluent: Application to pilot pharmacokinetic studies. Clin. Chem. Lab. Med. 2021, 59, 921–933. [Google Scholar] [CrossRef]
- Mula, J.; Chiara, F.; Manca, A.; Palermiti, A.; Maiese, D.; Cusato, J.; Simiele, M.; De Rosa, F.G.; Di Perri, G.; De Nicolò, A.; et al. Analytical validation of a novel UHPLC-MS/MS method for 19 antibiotics quantification in plasma: Implementation in a LC-MS/MS Kit. Biomed. Pharmacother. 2023, 163, 114790. [Google Scholar] [CrossRef] [PubMed]
- Rigo-Bonnin, R.; Gomez-Junyent, J.; García-Tejada, L.; Benavent, E.; Soldevila, L.; Tubau, F.; Murillo, O. Measurement of ceftolozane and tazobactam concentrations in plasma by UHPLC-MS/MS. Clinical application in the management of difficult-to-treat osteoarticular infections. Clin. Chim. Acta 2019, 488, 50–60. [Google Scholar] [CrossRef] [PubMed]
- Ezquer-Garin, C.; Ferriols-Lisart, R.; Alós-Almiñana, M.; Aguilar-Aguilar, G.; Belda-Nacher, J.F.; Carbonell, J.-A. Validated HPLC-UV detection method for the simultaneous determination of ceftolozane and tazobactam in human plasma. Bioanalysis 2018, 10, 461–473. [Google Scholar] [CrossRef]
- Toullec, L.; Dupouey, J.; Vigne, C.; Marsot, A.; Allanioux, L.; Blin, O.; Leone, M.; Guilhaumou, R. Analytical Interference During Cefepime Therapeutic Drug Monitoring in Intensive Care Patient: About a Case Report. Therapies 2017, 72, 587–592. Available online: https://www.sciencedirect.com/science/article/abs/pii/S0040595717300562?via=ihub (accessed on 20 December 2024). [CrossRef]
- Bioanalytical Method Validation–Scientific Guideline European Medicines Agency (EMA). Available online: https://www.ema.europa.eu/en/bioanalytical-method-validation-scientific-guideline (accessed on 4 October 2024).
- Center for Drug Evaluation and Research; Center for Veterinary Medicine. Bioanalytical Method Validation Guidance for Industry. Available online: https://www.fda.gov/regulatory-information/search-fda-guidance-documents/bioanalytical-method-validation-guidance-industry (accessed on 20 December 2024).
- Rigo-Bonnin, R.; Ribera, A.; Arbiol-Roca, A.; Cobo-Sacristán, S.; Padullés, A.; Murillo, Ò.; Shaw, E.; Granada, R.; Pérez-Fernández, X.L.; Tubau, F.; et al. Development and validation of a measurement procedure based on ultra-high performance liquid chromatography-tandem mass spectrometry for simultaneous measurement of β-lactam antibiotic concentration in human plasma. Clin. Chim. Acta 2017, 468, 215–224. [Google Scholar] [CrossRef]
- Carlier, M.; Stove, V.; De Waele, J.J.; Verstraete, A.G. Ultrafast quantification of β-lactam antibiotics in human plasma using UPLC–MS/MS. J. Chromatogr. B 2015, 978–979, 89–94. [Google Scholar] [CrossRef]
- Colin, P.; De Bock, L.; T’jollyn, H.; Boussery, K.; Van Bocxlaer, J. Development and validation of a fast and uniform approach to quantify β-lactam antibiotics in human plasma by solid phase extraction-liquid chromatography–electrospray-tandem mass spectrometry. Talanta 2013, 103, 285–293. [Google Scholar] [CrossRef] [PubMed]
- Ohmori, T.; Suzuki, A.; Niwa, T.; Ushikoshi, H.; Shirai, K.; Yoshida, S.; Ogura, S.; Itoh, Y. Simultaneous determination of eight β-lactam antibiotics in human serum by liquid chromatography–tandem mass spectrometry. J. Chromatogr. B 2011, 879, 1038–1042. [Google Scholar] [CrossRef]
- Cohen-Wolkowiez, M.; White, N.R.; Bridges, A.; Benjamin, D.K.; Kashuba, A.D.M. Development of a liquid chromatography–tandem mass spectrometry assay of six antimicrobials in plasma for pharmacokinetic studies in premature infants. J. Chromatogr. B 2011, 879, 3497–3506. [Google Scholar] [CrossRef]
- Rhodes, A.; Evans, L.E.; Alhazzani, W.; Levy, M.M.; Antonelli, M.; Ferrer, R.; Kumar, A.; Sevransky, J.E.; Sprung, C.L.; Nunnally, M.E.; et al. Surviving Sepsis Campaign: International Guidelines for Management of Sepsis and Septic Shock: 2016. Intensive Care Med. 2017, 43, 304–377. [Google Scholar] [CrossRef]
- Stašek, J.; Keller, F.; Kočí, V.; Klučka, J.; Klabusayová, E.; Wiewiorka, O.; Strašilová, Z.; Beňovská, M.; Škardová, M.; Maláska, J. Update on Therapeutic Drug Monitoring of Beta-Lactam Antibiotics in Critically Ill Patients-A Narrative Review. Antibiotics 2023, 12, 568. [Google Scholar] [CrossRef] [PubMed]
- European Committee on Antimicrobial Susceptibility Testing (EUCAST) Antimicrobial Wild Type Distributions of Microorganisms. Available online: https://mic.eucast.org/search/ (accessed on 20 December 2024).
- Bahmany, S.; Ewoldt, T.M.J.; Abdulla, A.; Koch, B.C.P. Stability of 10 Beta-Lactam Antibiotics in Human Plasma at Different Storage Conditions. Ther. Drug Monit. 2023, 45, 606–615. [Google Scholar] [CrossRef] [PubMed]
- Gijsen, M.; Filtjens, B.; Annaert, P.; Armoudjian, Y.; Debaveye, Y.; Wauters, J.; Slaets, P.; Spriet, I. Meropenem Stability in Human Plasma at -20 °C: Detailed Assessment of Degradation. Antibiotics 2021, 10, 449. [Google Scholar] [CrossRef] [PubMed]
- Preanalytical Stability of 13 Antibiotics in Biological Samples: A Crucial Factor for Therapeutic Drug Monitoring. Available online: https://www.mdpi.com/2079-6382/13/7/675 (accessed on 6 April 2025).
- Roberts, J.A.; Paul, S.K.; Akova, M.; Bassetti, M.; De Waele, J.J.; Dimopoulos, G.; Kaukonen, K.-M.; Koulenti, D.; Martin, C.; Montravers, P.; et al. DALI: Defining antibiotic levels in intensive care unit patients: Are current β-lactam antibiotic doses sufficient for critically ill patients? Clin. Infect. Dis. 2014, 58, 1072–1083. [Google Scholar] [CrossRef]
- Sime, F.B.; Roberts, M.S.; Peake, S.L.; Lipman, J.; Roberts, J.A. Does Beta-lactam Pharmacokinetic Variability in Critically Ill Patients Justify Therapeutic Drug Monitoring? A Systematic Review. Ann. Intensive Care 2012, 2, 35. [Google Scholar] [CrossRef]
- Gonçalves-Pereira, J.; Póvoa, P. Antibiotics in critically ill patients: A systematic review of the pharmacokinetics of β-lactams. Crit. Care 2011, 15, R206. [Google Scholar] [CrossRef]
- Boidin, C.; Moshiri, P.; Dahyot-Fizelier, C.; Goutelle, S.; Lefeuvre, S. Pharmacokinetic variability of beta-lactams in critically ill patients: A narrative review. Anaesth. Crit. Care Pain. Med. 2020, 39, 87–109. [Google Scholar] [CrossRef]
- Fratoni, A.J.; Nicolau, D.P.; Kuti, J.L. A guide to therapeutic drug monitoring of β-lactam antibiotics. Pharmacother. J. Hum. Pharmacol. Drug Ther. 2021, 41, 220–233. [Google Scholar] [CrossRef]
- Schießer, S.; Hitzenbichler, F.; Kees, M.G.; Kratzer, A.; Lubnow, M.; Salzberger, B.; Kees, F.; Dorn, C. Measurement of Free Plasma Concentrations of Beta-Lactam Antibiotics: An Applicability Study in Intensive Care Unit Patients. Ther. Drug Monit. 2021, 43, 264–270. [Google Scholar] [CrossRef]
- Ulldemolins, M.; Roberts, J.A.; Rello, J.; Paterson, D.L.; Lipman, J. The Effects of Hypoalbuminaemia on Optimizing Antibacterial Dosing in Critically Ill Patients. Clin. Pharmacokinet. 2011, 50, 99–110. [Google Scholar] [CrossRef]
- European Committee on Antimicrobial Susceptibility Testing (EUCAST). Public Consultations. Available online: https://www.eucast.org/publications-and-documents/consultations (accessed on 13 December 2024).


| Analyte | λ (nm) | tR (min) | Calibration Range | Equation | R2 | LLOQ | %MRE at LLOQ |
|---|---|---|---|---|---|---|---|
| FEP | 260 | 1.2 | 2.5–50 mg/L | y = 0.54x + 0.62 | 0.9996 | 2.5 mg/L | 6.1% |
| TOL | 260 | 1.7 | 5–50 mg/L | y = 0.066x + 0.03 | 0.9978 | 5.0 mg/L | 8.8% |
| CAZ | 260 | 3.0 | 1–50 mg/L | y = 0.70x − 0.07 | 0.9993 | 1.0 mg/L | 4.8% |
| MER | 304 | 3.4 | 1–50 mg/L | y = 1.74x + 0.94 | 0.9995 | 1.0 mg/L | 4.7% |
| AMP | 210 | 4.0 | 1–50 mg/L | y = 1.19x + 0.41 | 0.9995 | 1.0 mg/L | 5.1% |
| ETP | 304 | 5.8 | 2.5–50 mg/L | y = 0.69x + 0.02 | 0.9987 | 2.5 mg/L | 5.5% |
| Analyte | Within-Day Mean (mg/L) (%CV,%MRE) | Between-Day Mean (mg/L) (%CV,%MRE) | ||||||||
|---|---|---|---|---|---|---|---|---|---|---|
| Quality Controls | Dilution Integrity | Quality Controls | Dilution Integrity | |||||||
| Low (5 mg/L) | Medium (20 mg/L) | High (50 mg/L) | ULOQ I (100 mg/L) | ULOQ II (150 mg/L) | Low (5 mg/L) | Medium (20 mg/L) | High (50 mg/L) | ULOQ I (100 mg/L) | ULOQ II (150 mg/L) | |
| FEP | 4.99 (0.1%, 6.5%) | 17.74 (0.2%, 11.3%) | 47.51 (0.1%, 4.8%) | 95.17 (0.3%, 4.8%) | 161.89 (0.3%, 7.9%) | 5.50 (14.3%, 9.9%) | 20.37 (7.4%, 1.9%) | 49.64 (6.4%, 0.7%) | 94 (1.1%, 5.7%) | 165 (2.2%, 10.1%) |
| TOL | 4.69 (2.2%, 6.1%) | 20.38 (0.9%, 1.9% | 53.5 (2.7%, 7.0%) | 88.83 (0.1%, 11.1%) | 157.50 (0.2%, 5.0%) | 4.59 (2.8%, 8.3%) | 20.24 (1.2%, 1.2%) | 53.74 (6.9%, 7.5%) | 85.04 (4.8%, 14.9%) | 159.24 (1.5%, 6.1%) |
| CAZ | 4.99 (0.1%, 0.1%) | 18.95 (0.1%, 5.2%) | 48.20 (2.7%, 3.6%) | 95.17 (0.3%, 4.8%) | 144.61 (0.1%, 3.6%) | 5.01 (5%, 0.3%) | 20.84 (6.7%, 4.2%) | 51.93 (5.8%, 3.9%) | 94.25 (1.1%, 5.7%) | 151.53 (4.8%, 1.0%) |
| MER | 5.23 (2.2%, 6.1%) | 19.52 (0.2%, 2.4%) | 50.00 (0.2%, 0.0%) | 85.37 (0.2%, 14.6%) | 161.41 (0.2%, 7.6%) | 5.11 (2.6%, 2.2%) | 19.30 (4.9%, 3.5%) | 49.46 (8.3%, 1.1%) | 85.20 (0.9%, 14.7%) | 144.79 (12.1%, 3.5%) |
| AMP | 5.16 (9.0%, 3.2%) | 20.74 (2.5%, 3.7%) | 51.15 (0.2%, 2.3%) | 93.89 (0.7%, 6.1%) | 161.11 (2.2%, 7.4%) | 4.78 (11.6%, 4.5%) | 20.78 (10.4%, 3.9%) | 50.32 (5.8%, 0.6%) | 93.92 (0.7%, 6.1%) | 160.03 (1.8%, 6.7%) |
| ETP | 5.33 (0.1%, 6.5%) | 17.74 (0.2%, 11.1%) | 47.61 (0.1%, 4.8%) | 88.33 (0.5%, 11.6%) | 150.43 (0.1%, 0.3%) | 5.74 (9.1%, 14.8%) | 19.46 (8.8%, 2.7%) | 47.98 (8.4%, 4.0%) | 85.3 (3.7%, 14.6%) | 131.70 (8.8%, 10.6%) |
| Antibiotic | Low 5 mg/L | High 50 mg/L | ||||
|---|---|---|---|---|---|---|
| Peak Area from Fresh Solution | Peak Area From Solution Stored at −20 °C for 6 Months | Difference (%) | Peak Area from Fresh Solution | Peak Area from Solution Stored at −20 °C for 6 Months | Difference (%) | |
| FEP | 141,798.5 | 157,414.0 | 11.01 ± 0.13 | 1,370,465.0 | 1,526,423.5 | 11.37 ± 0.03 |
| TOL | 76,984.5 | 73,137.0 | −4.99 ± 0.11 | 744,373.5 | 699,744.0 | −5.99 ± 0.07 |
| CAZ | 236,617.0 | 209,564.5 | −11.4 ± 0.03 | 2,282,023.0 | 1,951,511.0 | −14.5 ± 0.01 |
| MER | 133,465.0 | 114,503.0 | −14.2 ± 0.08 | 1,291,916.5 | 1,096,498.0 | −14.8 ± 0.15 |
| AMP | 223,954.3 | 203,698.7 | −9.0 ± 1.5 | 2,079,699.0 | 1,951,500.5 | −6.2 ± 0.18 |
| ETP | 104,775.5 | 83,711.0 | −20.1 ± 0.04 | 1,029,813.0 | 797,063.5 | −22.6 ± 0.014 |
| Medium 25 mg/L | Medium 25 mg/L | |||||
| Peak area from fresh solution | Peak area from solution stored at −20 °C for 6 months | Difference (%) | Peak area from fresh solution | Peak area from solution stored at −20 °C for 9 months | Difference (%) | |
| IS | 1157,708.5 | 1257,436.0 | 9.7 ± 0.24 | 1157,708.5 | 1172,750.0 | 1.3 ± 0.4 |
| Antibiotic | Low 5 mg/L | Medium 20 mg/L | High 50 mg/L | ||||||
|---|---|---|---|---|---|---|---|---|---|
| Peak Area from Fresh Solution | Peak Area from Solution Stored at −20 °C for 1 month | Difference (%) | Peak Area from Fresh Solution | Peak Area from Solution Stored at −20 °C for 1 month | Difference (%) | Peak Area from Fresh Solution | Peak Area from Solution Stored at −20 °C for 1 month | Difference (%) | |
| FEP | 32,625.0 | 29,158.3 | −10.62 ± 0.7 | 123,900.3 | 104,940.7 | −15.30 ± 0.1 | 306,269.0 | 285,653.7 | −6.7 ± 0.04 |
| TOL | 5070.0 | 5615.3 | 10.8 ± 2.2 | 24,996.0 | 23,176.0 | −6.9 ± 0.1 | 45,603.0 | 40,493.3 | −11.2 ± 0.35 |
| CAZ | 46,166.3 | 43,545.3 | −5.68 ± 0.2 | 170,085.3 | 175,213.3 | 3.01 ± 0.04 | 417,308.0 | 400,512.3 | −4.0 ± 0.05 |
| MER | 29,229.7 | 24,032.0 | −17.78 ± 0.3 | 101,248.7 | 112,355.0 | 11.0 ± 0.2 | 254,201.3 | 250,520.3 | −1.4 ± 0.06 |
| AMP | 62,630.3 | 62,674.0 | 0.054 ± 3.1 | 217,591.7 | 208,389.3 | −4.2 ± 3.4 | 547,094.3 | 517,966.7 | −5.2 ± 4.15 |
| ETP | 9758.7 | 10,005.3 | 2.55 ± 1.93 | 41,269.7 | 49,095.0 | 19.0 ± 0.04 | 107,943.0 | 90,978.7 | −15.71 ± 0.09 |
Disclaimer/Publisher’s Note: The statements, opinions and data contained in all publications are solely those of the individual author(s) and contributor(s) and not of MDPI and/or the editor(s). MDPI and/or the editor(s) disclaim responsibility for any injury to people or property resulting from any ideas, methods, instructions or products referred to in the content. |
© 2025 by the authors. Licensee MDPI, Basel, Switzerland. This article is an open access article distributed under the terms and conditions of the Creative Commons Attribution (CC BY) license (https://creativecommons.org/licenses/by/4.0/).
Share and Cite
Varela-Rey, I.; Martínez-Guitián, M.; Hermelo-Vidal, G.; Bandín-Vilar, E.; Novo-Veleiro, I.; Varela-García, P.M.; Zarra-Ferro, I.; González-Barcia, M.; Mondelo-García, C.; Fernández-Ferreiro, A. Development of a UHPLC-UV/Vis Method for Simultaneously Determining Six Beta-Lactam Antibiotics in Plasma: A Tool for the Clinical Implementation of Therapeutic Monitoring of Beta-Lactams. Antibiotics 2025, 14, 613. https://doi.org/10.3390/antibiotics14060613
Varela-Rey I, Martínez-Guitián M, Hermelo-Vidal G, Bandín-Vilar E, Novo-Veleiro I, Varela-García PM, Zarra-Ferro I, González-Barcia M, Mondelo-García C, Fernández-Ferreiro A. Development of a UHPLC-UV/Vis Method for Simultaneously Determining Six Beta-Lactam Antibiotics in Plasma: A Tool for the Clinical Implementation of Therapeutic Monitoring of Beta-Lactams. Antibiotics. 2025; 14(6):613. https://doi.org/10.3390/antibiotics14060613
Chicago/Turabian StyleVarela-Rey, Iria, Marta Martínez-Guitián, Gonzalo Hermelo-Vidal, Enrique Bandín-Vilar, Ignacio Novo-Veleiro, Pablo Manuel Varela-García, Irene Zarra-Ferro, Miguel González-Barcia, Cristina Mondelo-García, and Anxo Fernández-Ferreiro. 2025. "Development of a UHPLC-UV/Vis Method for Simultaneously Determining Six Beta-Lactam Antibiotics in Plasma: A Tool for the Clinical Implementation of Therapeutic Monitoring of Beta-Lactams" Antibiotics 14, no. 6: 613. https://doi.org/10.3390/antibiotics14060613
APA StyleVarela-Rey, I., Martínez-Guitián, M., Hermelo-Vidal, G., Bandín-Vilar, E., Novo-Veleiro, I., Varela-García, P. M., Zarra-Ferro, I., González-Barcia, M., Mondelo-García, C., & Fernández-Ferreiro, A. (2025). Development of a UHPLC-UV/Vis Method for Simultaneously Determining Six Beta-Lactam Antibiotics in Plasma: A Tool for the Clinical Implementation of Therapeutic Monitoring of Beta-Lactams. Antibiotics, 14(6), 613. https://doi.org/10.3390/antibiotics14060613