
Insight into the Phenolic Composition of Cabernet Sauvignon Grapevine Berries During Fermentation—Towards the Application of Winery By-Products for Antibacterial Purposes


Abstract
1. Introduction
2. Results
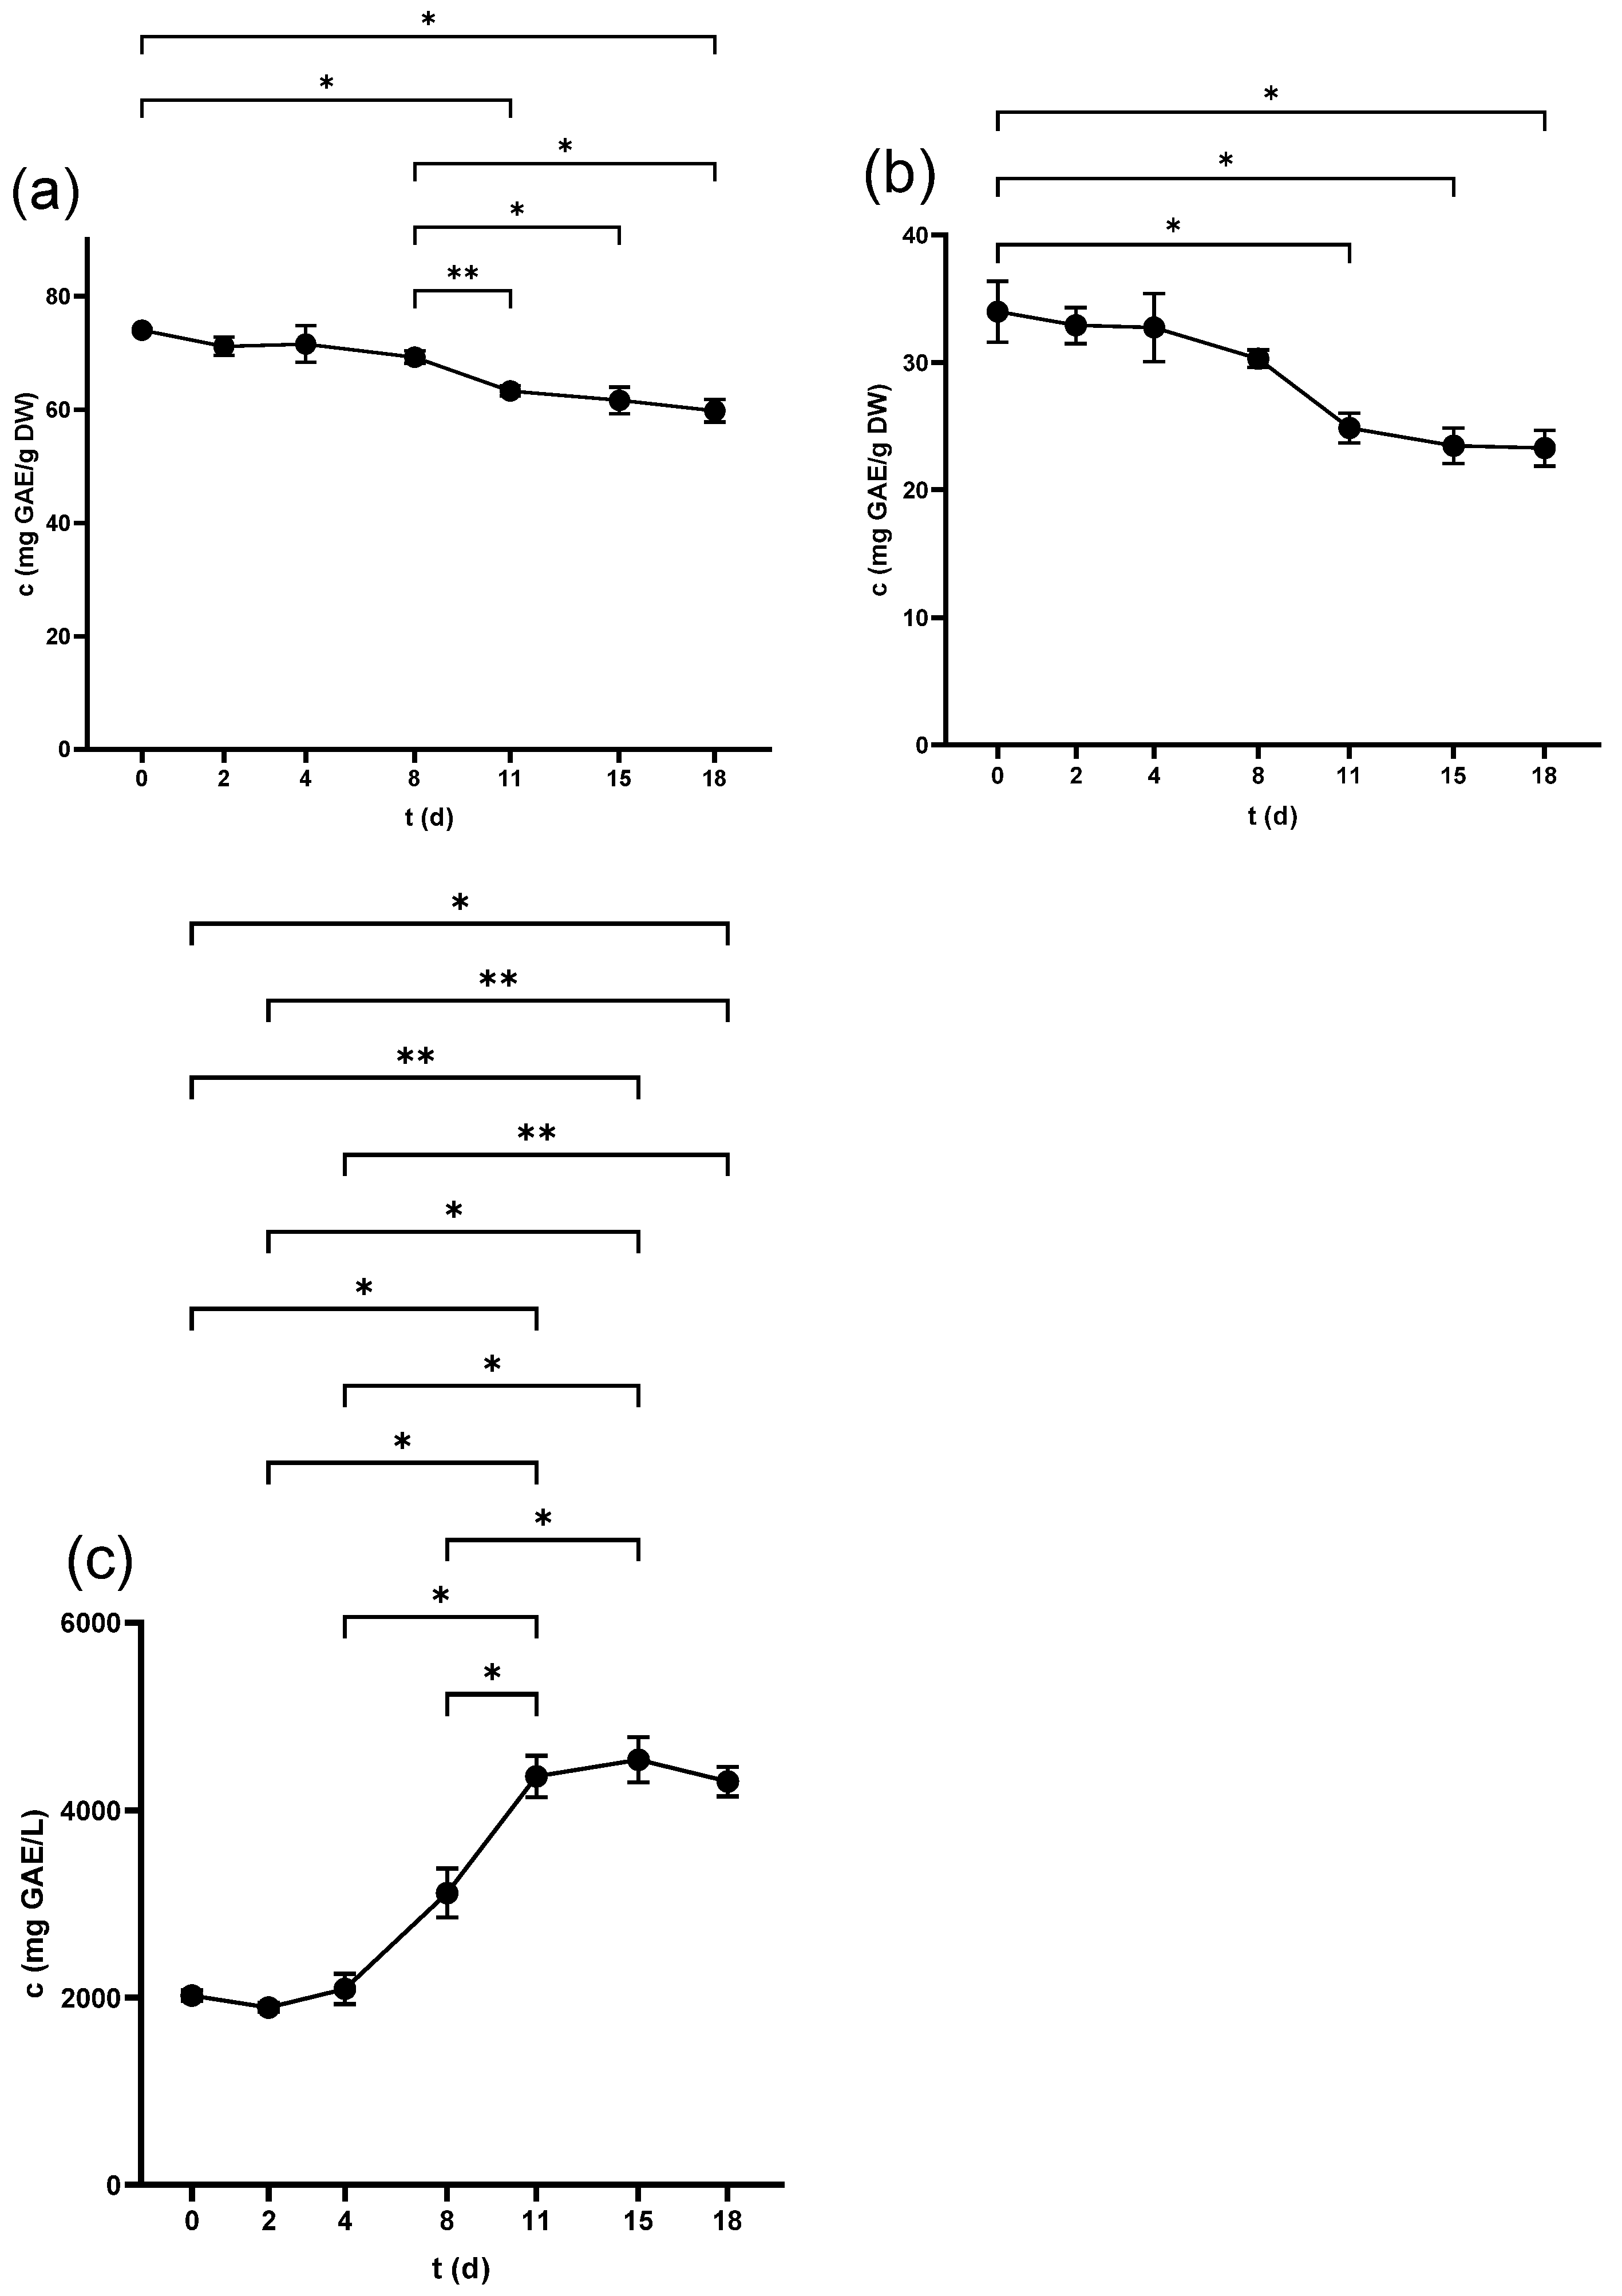
2.1. Total Phenolic Content (TPC)
2.1.1. TPC of Seeds
2.1.2. TPC of Skins
2.1.3. TPC of Juice
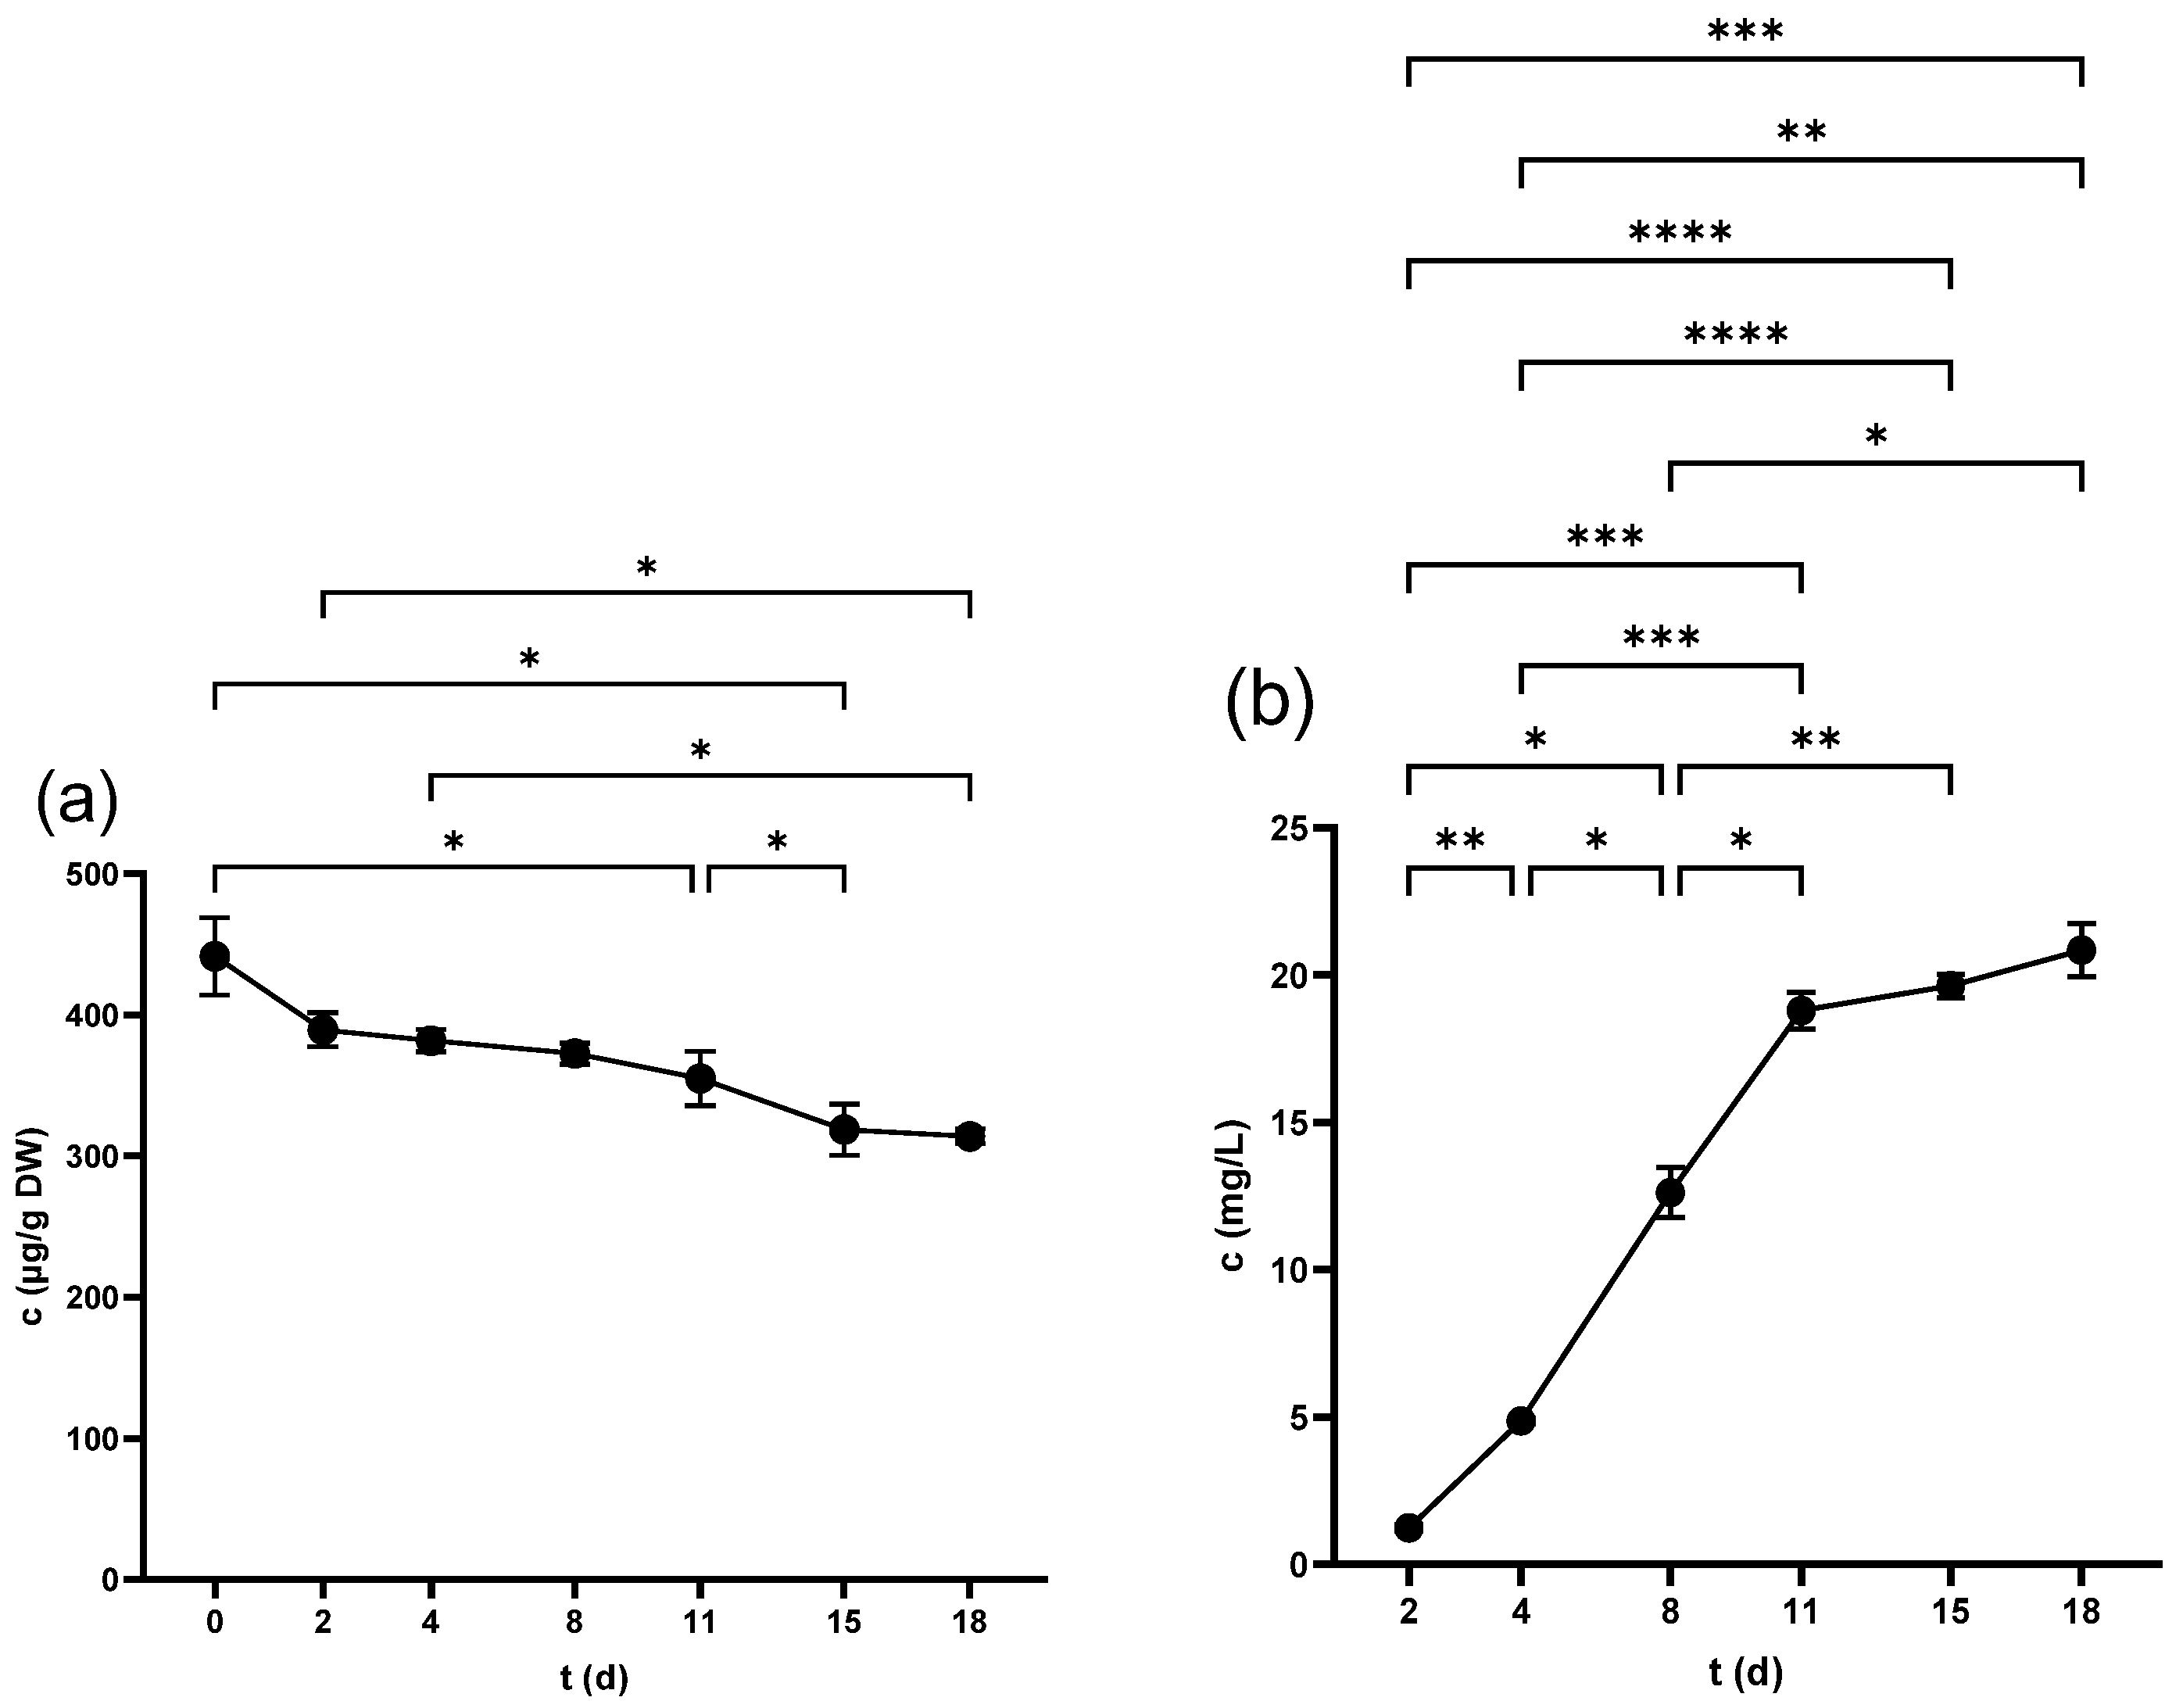
2.2. Flavan-3-ols
2.2.1. Flavan-3-ols in Seeds
2.2.2. Flavan-3-ols in Skins
2.2.3. Flavan-3-ols in Juice
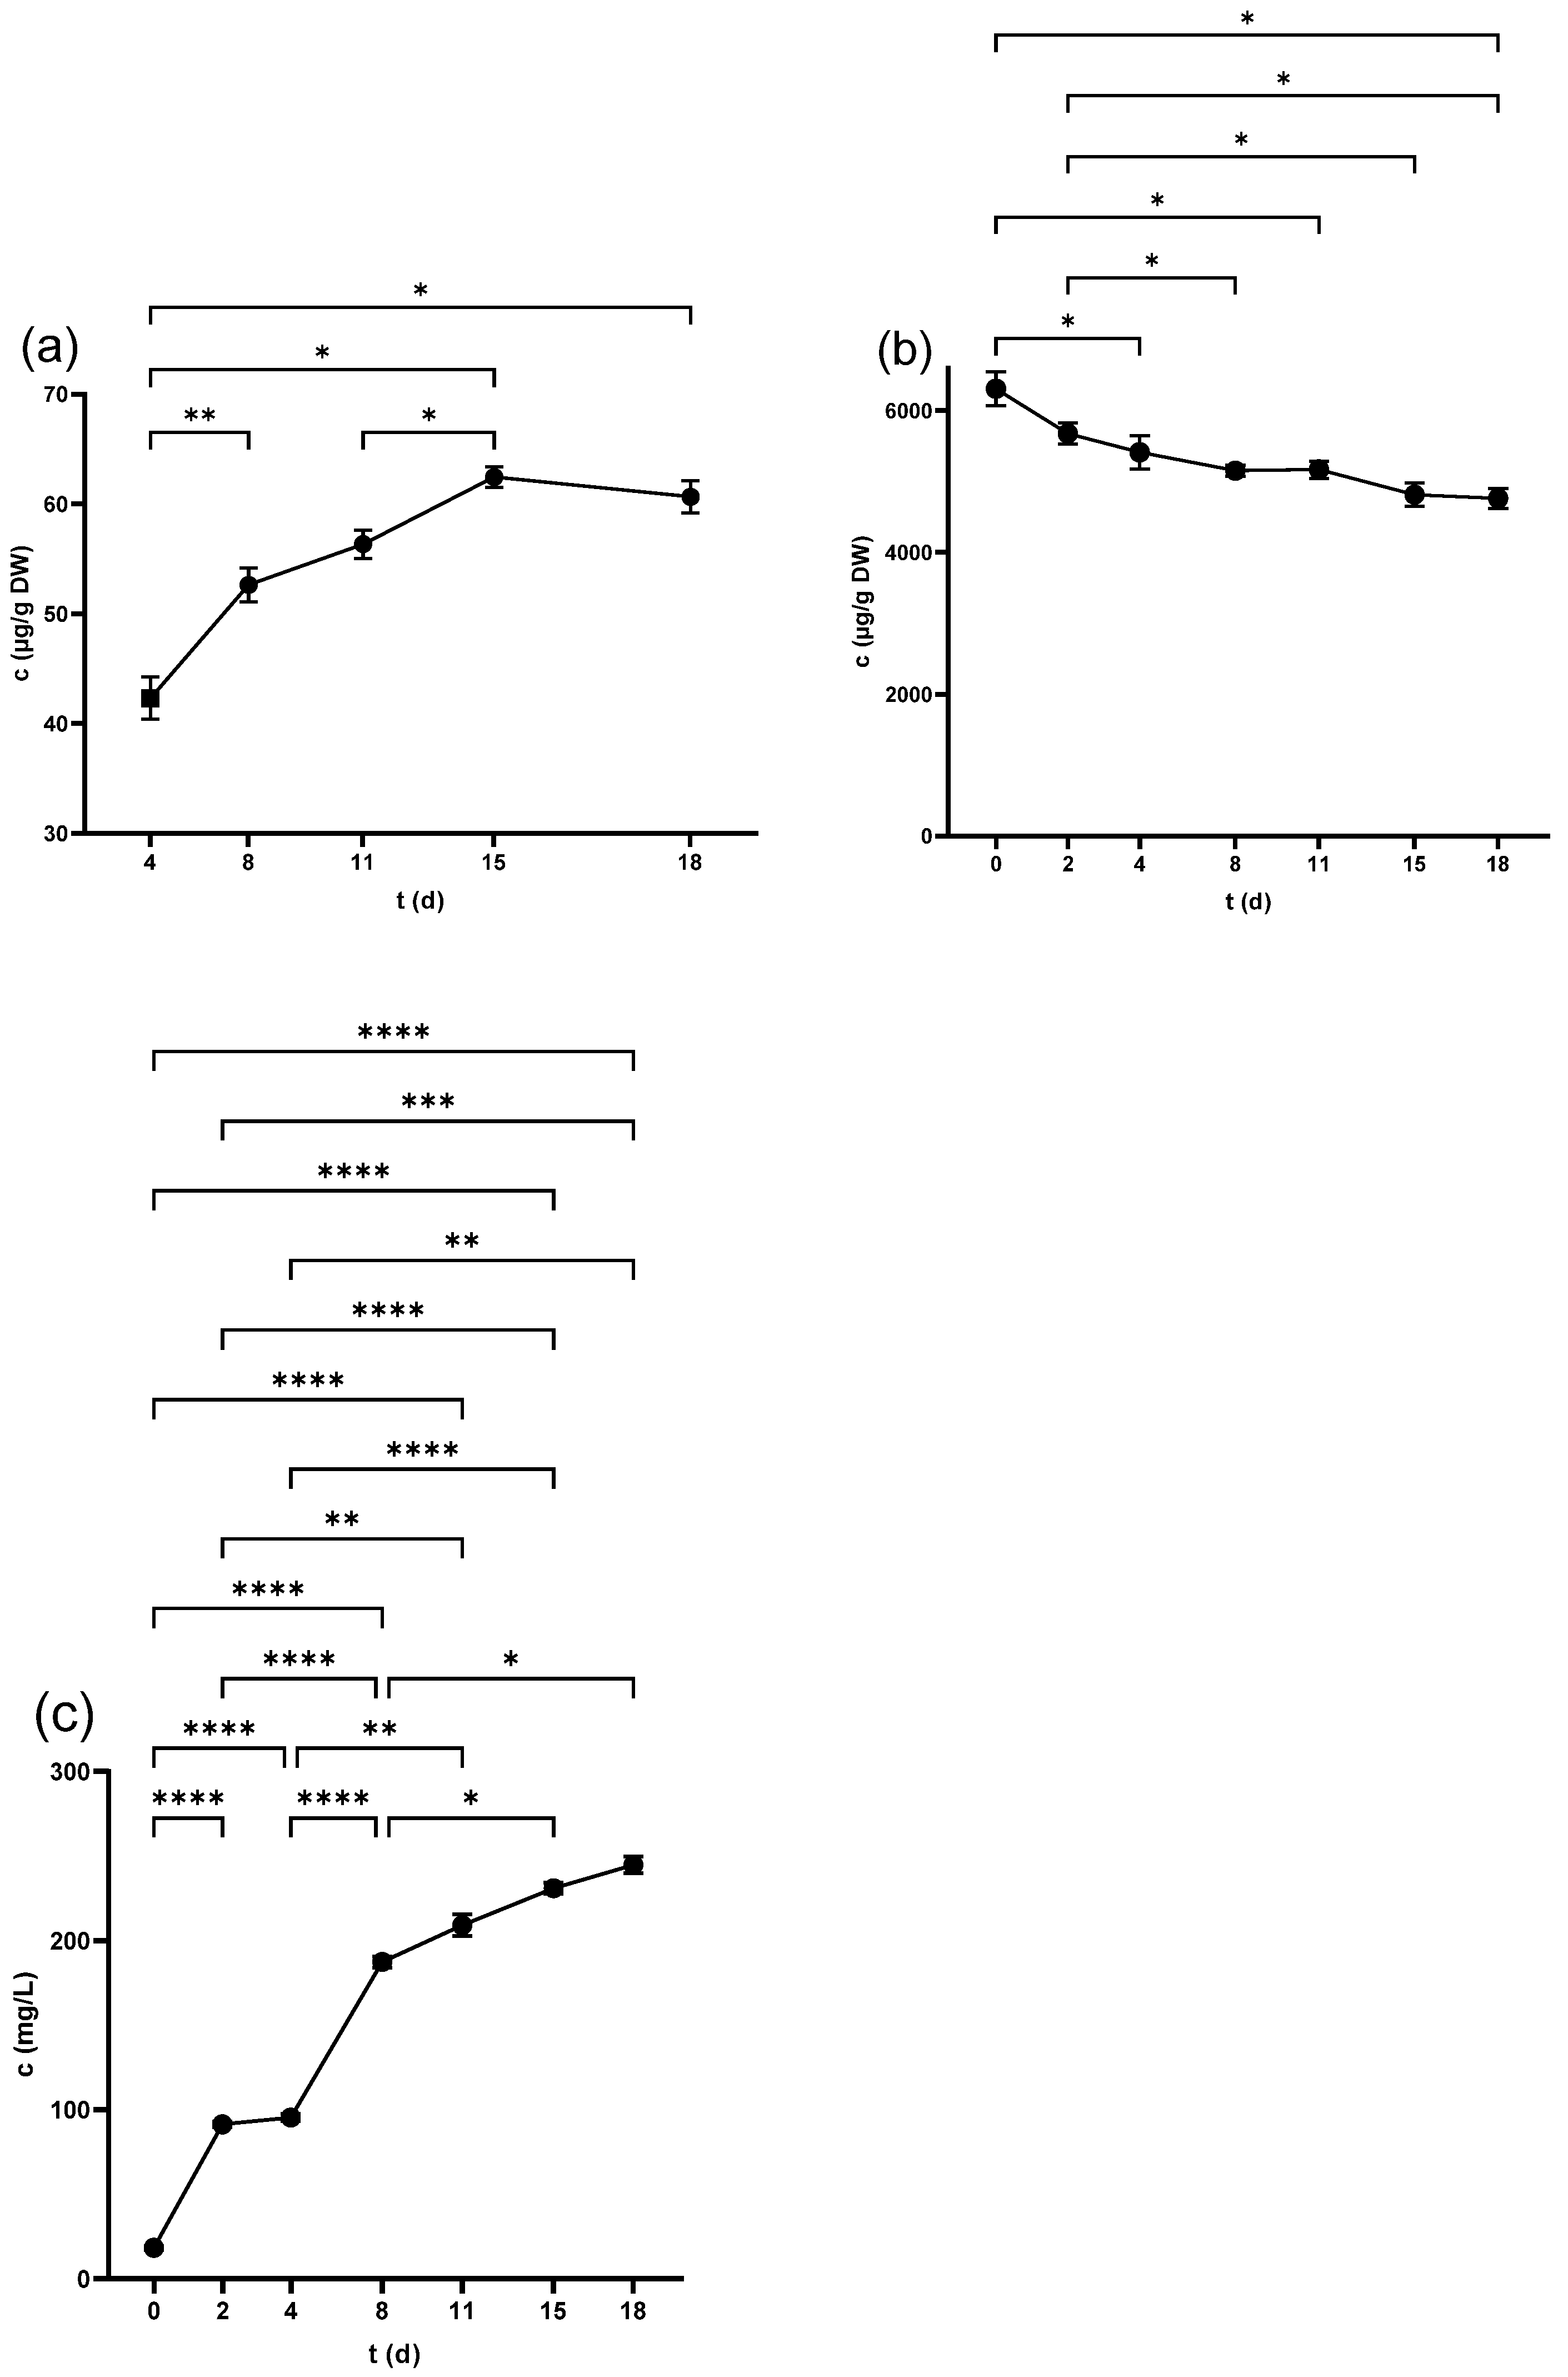
2.3. Flavonols
2.3.1. Flavonols in Seeds
2.3.2. Flavonols in Skins
2.3.3. Flavonols in Juice
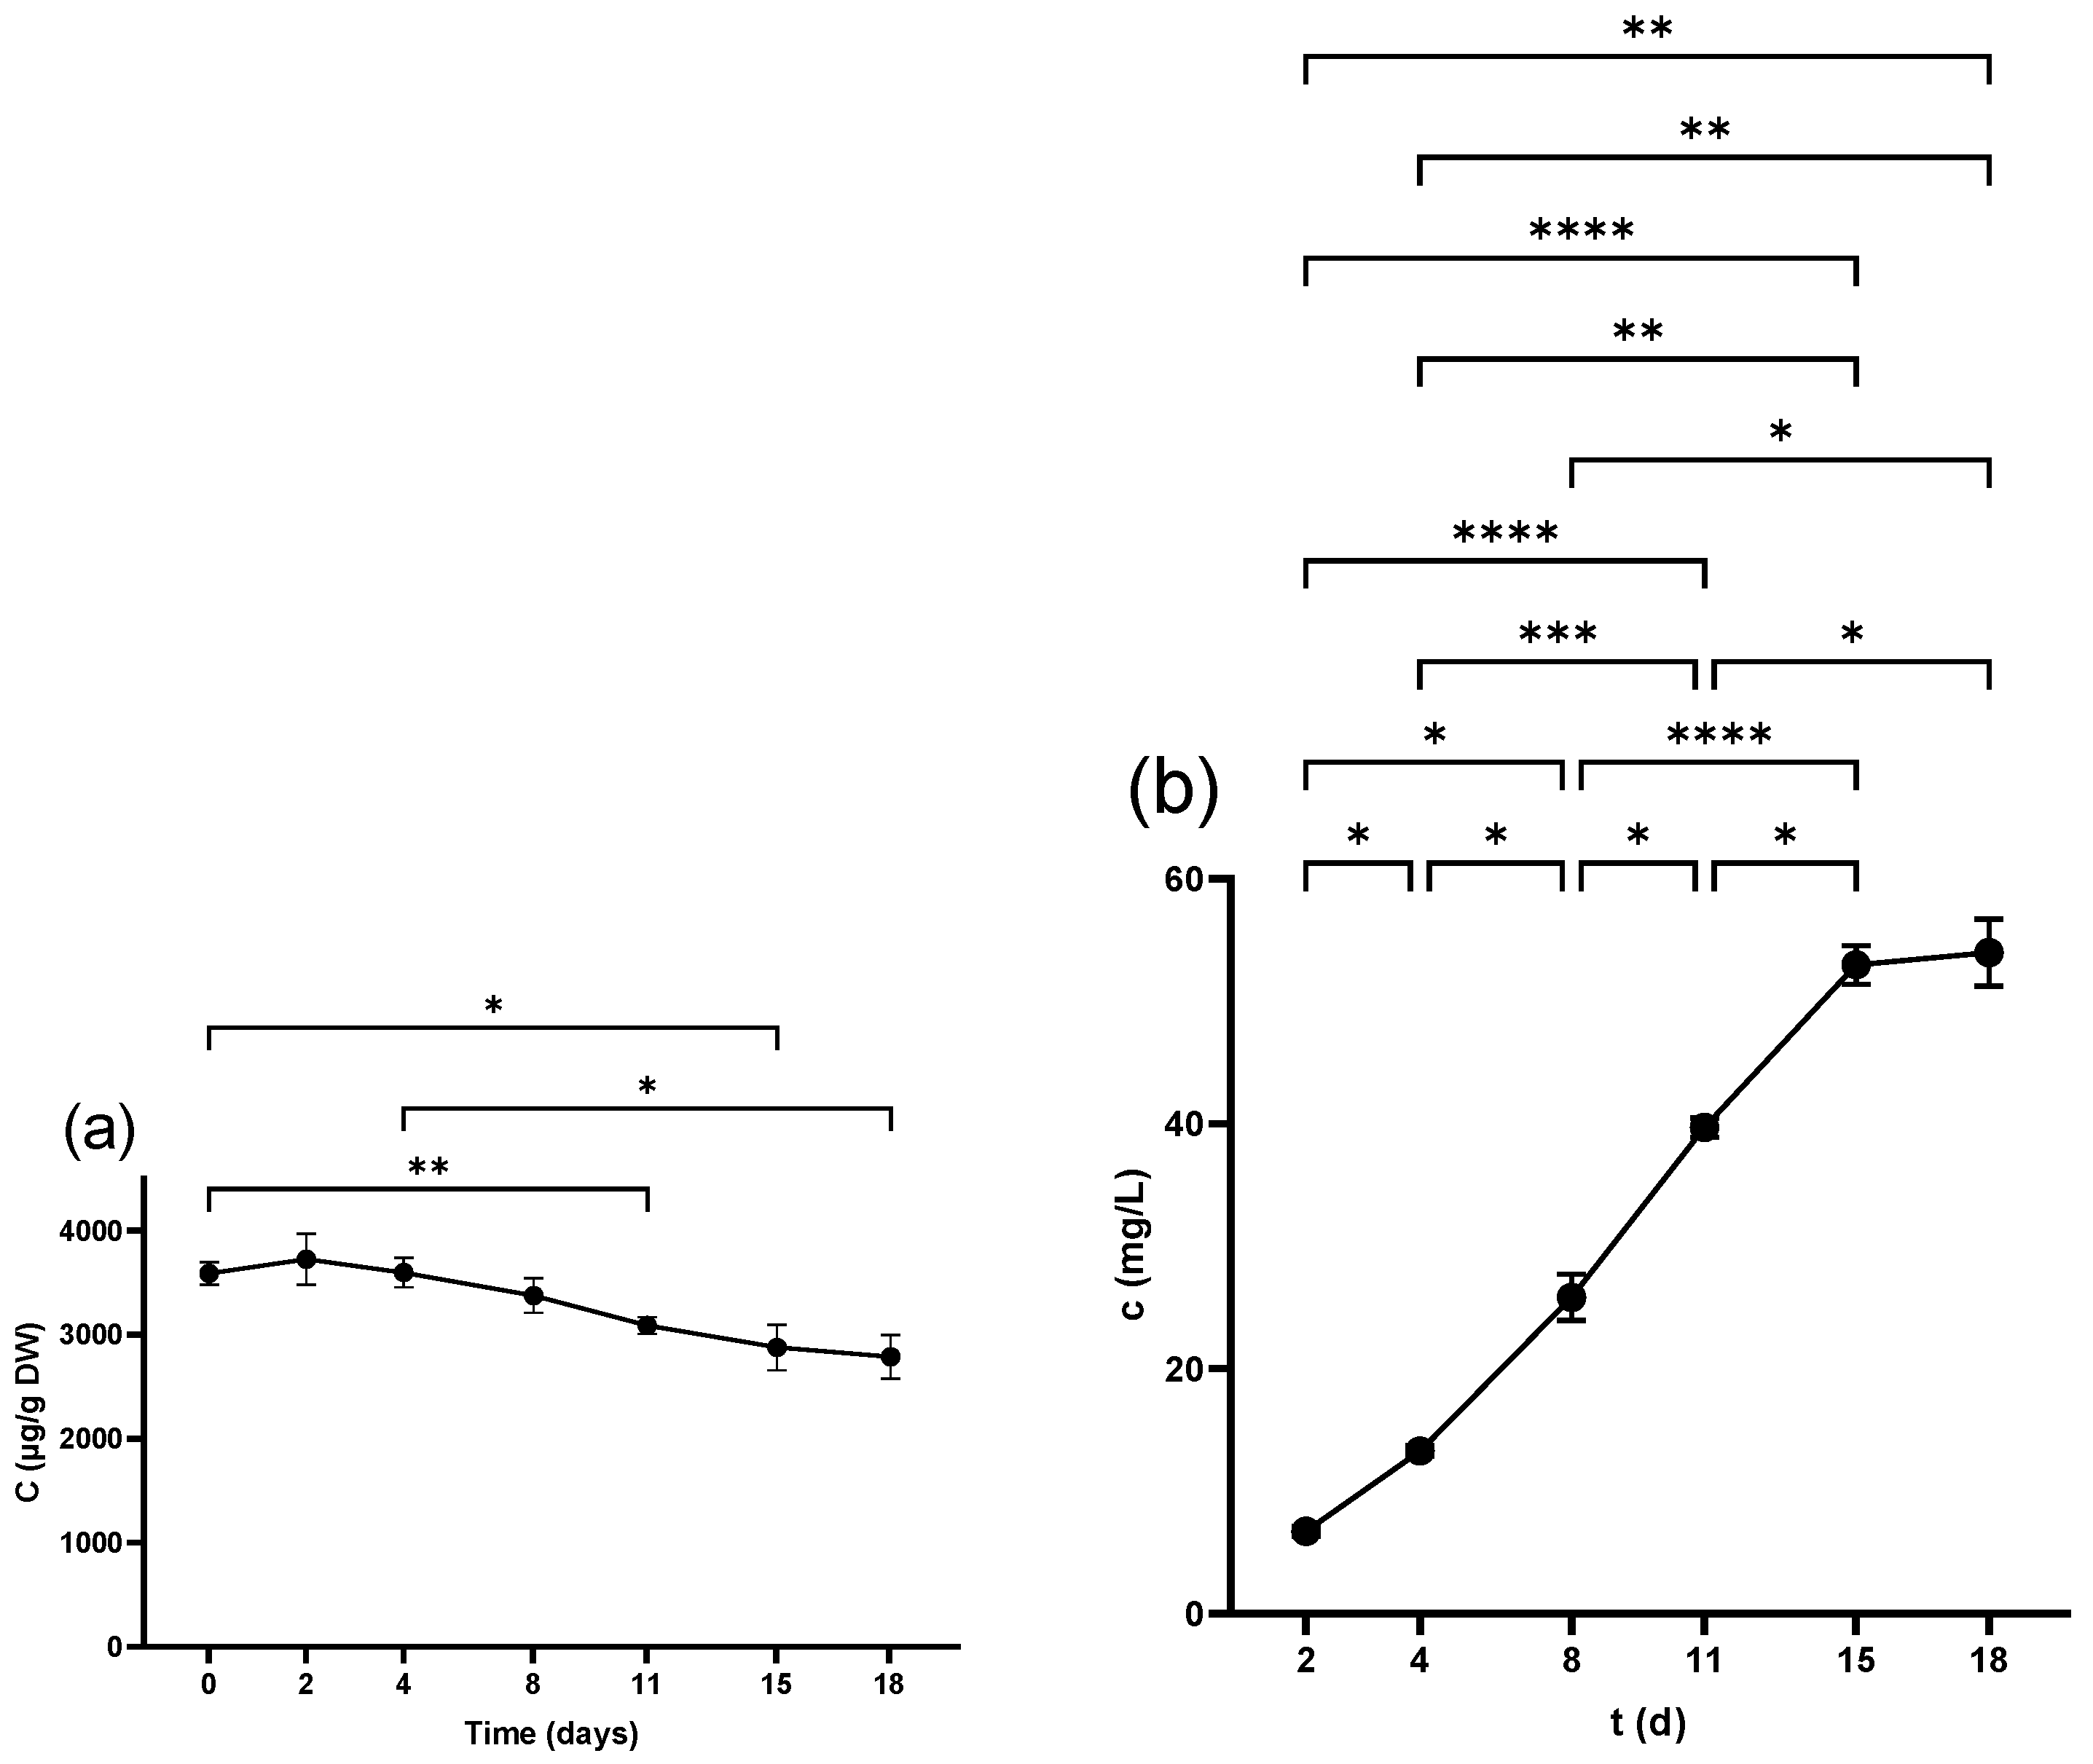
2.4. Anthocyanins
2.4.1. Anthocyanins in Seeds
2.4.2. Anthocyanins in Skins
2.4.3. Anthocyanins in Juice
2.5. Stilbenes
2.5.1. Stilbenes in Seeds
2.5.2. Stilbenes in Skins
2.5.3. Stilbenes in Juice
2.6. Enrichment of Phenolics in the Seed and Skin Extracts
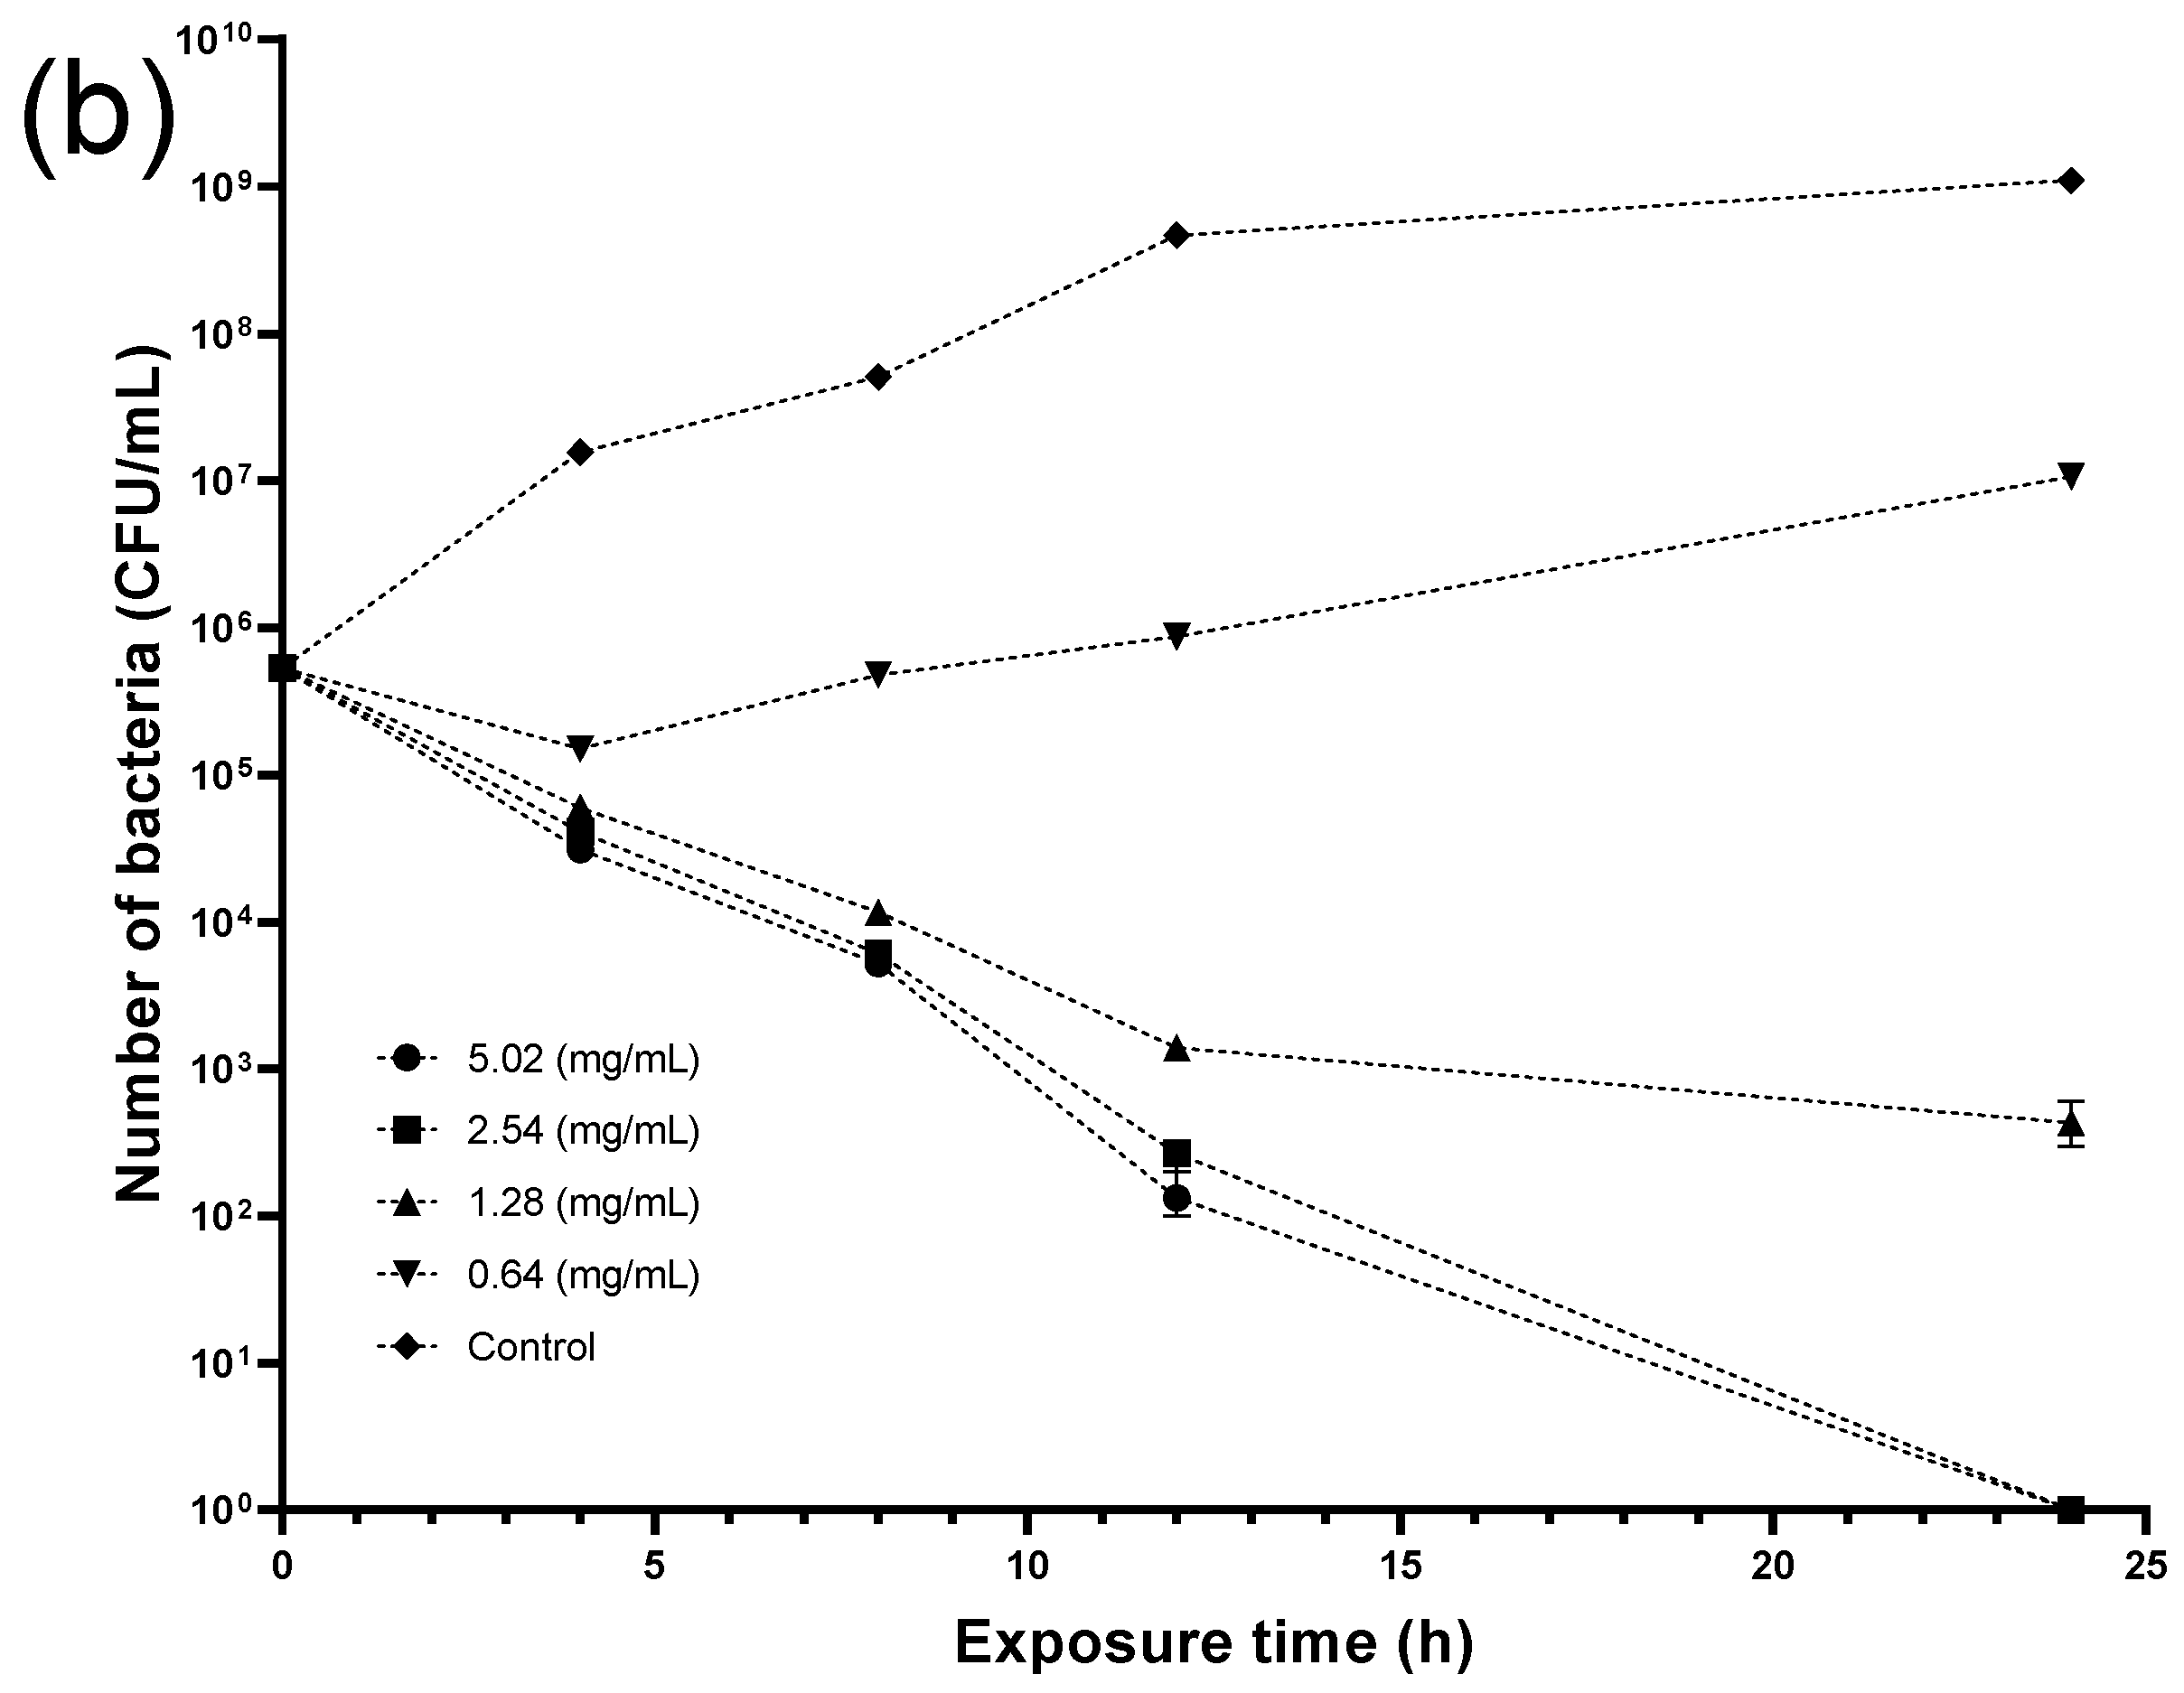
2.7. Antimicrobial Experiments
3. Discussion
4. Materials and Methods
4.1. Chemicals and Reagents
4.2. Sample Preparation
4.3. Sample Extractions
4.4. Preparation of Seed and Skin Crude Extract and HPLC Analysis
4.5. Total Phenolic Content (TPC) Determination
4.6. HPLC Analysis of Individual PPs
4.6.1. HPLC Analysis of Flavan-3-ols
4.6.2. HPLC Analysis of Anthocyanins
4.6.3. HPLC Analysis of Stilbenes
4.6.4. HPLC Analysis of Flavonols
4.7. Antimicrobial Experiments
4.7.1. Bacterial Strains and Cultural Conditions
4.7.2. Antibacterial Testing and the Time-Kill Assay
4.8. Statistical Methods
5. Conclusions
Supplementary Materials
Author Contributions
Funding
Institutional Review Board Statement
Informed Consent Statement
Data Availability Statement
Acknowledgments
Conflicts of Interest
References
- Beres, C.; Costa, G.N.S.; Cabezudo, I.; da Silva-James, N.K.; Teles, A.S.C.; Cruz, A.P.G.; Mellinger-Silva, C.; Tonon, R.V.; Cabral, L.M.C.; Freitas, S.P. Towards integral utilization of grape pomace from winemaking process: A review. Waste Manag. 2017, 68, 581–594. [Google Scholar] [CrossRef] [PubMed]
- Nurzyńska-Wierdak, R. Phenolic Compounds from New Natural Sources—Plant Genotype and Ontogenetic Variation. Molecules 2023, 28, 1731. [Google Scholar] [CrossRef] [PubMed]
- Giovinazzo, G.; Grieco, F. Functional Properties of Grape and Wine Polyphenols. Plant Foods Hum. Nutr. 2015, 70, 454–462. [Google Scholar] [CrossRef] [PubMed]
- Martin, M.E.; Grao-Cruces, E.; Millan-Linares, M.C.; Montserrat de la Paz, S. Grape (Vitis vinifera L.) Seed Oil: A Functional Food from the Winemaking Industry. Foods 2020, 9, 1360. [Google Scholar] [CrossRef] [PubMed]
- Liu, R.H. Health-Promoting Components of Fruits and Vegetables in the Diet. Adv. Nutr. Int. Rev. J. 2013, 4, 384S–392S. [Google Scholar] [CrossRef]
- Lv, Q.-Z.; Long, J.-T.; Gong, Z.-F.; Nong, K.-Y.; Liang, X.-M.; Qin, T.; Huang, W.; Yang, L. Current State of Knowledge on the Antioxidant Effects and Mechanisms of Action of Polyphenolic Compounds. Nat. Prod. Commun. 2021, 16, 1934578X2110277. [Google Scholar]
- Garavaglia, J.; Markoski, M.M.; Oliveira, A.; Marcadenti, A. Grape Seed Oil Compounds: Biological and Chemical Actions for Health. Nutr. Metab. Insights 2016, 9, 59–64. [Google Scholar] [CrossRef]
- Montagut, G.; Onnockx, S.; Vaqué, M.; Bladé, C.; Blay, M.; Fernández-Larrea, J.; Pujadas, G.; Salvadó, M.J.; Arola, L.; Pirson, I.; et al. Oligomers of grape-seed procyanidin extract activate the insulin receptor and key targets of the insulin signaling pathway differently from insulin. J. Nutr. Biochem. 2010, 21, 476–481. [Google Scholar] [CrossRef]
- Olas, B.; Wachowicz, B.; Tomczak, A.; Erler, J.; Stochmal, A.; Oleszek, W. Comparative anti-platelet and antioxidant properties of polyphenol-rich extracts from: Berries of Aronia melanocarpa, seeds of grape and bark of Yucca schidigera in vitro. Platelets 2008, 19, 70–77. [Google Scholar] [CrossRef]
- Ghouila, Z.; Laurent, S.; Boutry, S.; Vander Elst, L.; Nateche, F.; Muller, R.N.; Baaliouamer, A. Antioxidant, antibacterial and cell toxicity effects of polyphenols from Ahmeur Bouamer grape seed extracts. J. Fundam. Appl. Sci. 2017, 9, 392. [Google Scholar] [CrossRef]
- Álvarez-Martínez, F.J.; Barrajón-Catalán, E.; Encinar, J.A.; Rodríguez-Díaz, J.C.; Micol, V. Antimicrobial Capacity of Plant Polyphenols against Gram-positive Bacteria: A Comprehensive Review. Curr. Med. Chem. 2020, 27, 2576–2606. [Google Scholar] [CrossRef] [PubMed]
- Perito, M.A.; Chiodo, E.; Serio, A.; Paparella, A.; Fantini, A. Factors Influencing Consumers’ Attitude Towards Biopreservatives. Sustainability 2020, 12, 10338. [Google Scholar] [CrossRef]
- Yousefi, M.; Khorshidian, N.; Hosseini, H. Potential Application of Essential Oils for Mitigation of Listeria monocytogenes in Meat and Poultry Products. Front. Nutr. 2020, 7, 577287. [Google Scholar] [CrossRef] [PubMed]
- Bouarab Chibane, L.; Degraeve, P.; Ferhout, H.; Bouajila, J.; Oulahal, N. Plant antimicrobial polyphenols as potential natural food preservatives. J. Sci. Food Agric. 2019, 99, 1457–1474. [Google Scholar] [CrossRef]
- Nisa, M.; Dar, R.A.; Fomda, B.A.; Nazir, R. Combating food spoilage and pathogenic microbes via bacteriocins: A natural and eco-friendly substitute to antibiotics. Food Control. 2023, 149, 109710. [Google Scholar] [CrossRef]
- World Health Organization. Food Safety. 2022. Available online: https://www.who.int/news-room/fact-sheets/detail/food-safety (accessed on 10 October 2024).
- Qian, W.; Liu, M.; Fu, Y.; Zhang, J.; Liu, W.; Li, J.; Li, X.; Li, Y.; Wang, T. Antimicrobial mechanism of luteolin against Staphylococcus aureus and Listeria monocytogenes and its antibiofilm properties. Microb. Pathog. 2020, 142, 104056. [Google Scholar] [CrossRef]
- U.S. Food & Drug Administration. Get the Facts About Listeria. 2020. Available online: https://www.fda.gov/animal-veterinary/animal-health-literacy/get-facts-about-listeria (accessed on 11 November 2024).
- Koopmans, M.M.; Brouwer, M.C.; Vazquez-Boland, J.A.; van de Beek, D. Human Listeriosis. Clin. Microbiol. Rev. 2023, 36, e0006019. [Google Scholar] [CrossRef]
- Murray, R.J. Recognition and management of Staphylococcus aureus toxin-mediated disease. Intern. Med. J. 2005, 35 (Suppl. S2), S106–S119. [Google Scholar] [CrossRef]
- Wattinger, L.; Stephan, R.; Layer, F.; Johler, S. Comparison of Staphylococcus aureus isolates associated with food intoxication with isolates from human nasal carriers and human infections. Eur. J. Clin. Microbiol. Infect. Dis. 2012, 31, 455–464. [Google Scholar] [CrossRef]
- Scallan, E.; Hoekstra, R.M.; Angulo, F.J.; Tauxe, R.V.; Widdowson, M.A.; Roy, S.L.; Jones, J.L.; Griffin, P.M. Foodborne illness acquired in the United States—major pathogens. Emerg. Infect. Dis. 2011, 17, 7–15. [Google Scholar] [CrossRef]
- Fetsch, A.; Johler, S. Staphylococcus aureus as a Foodborne Pathogen. Curr. Clin. Microbiol. Rep. 2018, 5, 88–96. [Google Scholar] [CrossRef]
- Evenson, M.L.; Hinds, M.W.; Bernstein, R.S.; Bergdoll, M.S. Estimation of human dose of staphylococcal enterotoxin A from a large outbreak of staphylococcal food poisoning involving chocolate milk. Int. J. Food Microbiol. 1988, 7, 311–316. [Google Scholar] [CrossRef] [PubMed]
- Davidson, P.M.; Critzer, F.J.; Taylor, T.M. Naturally Occurring Antimicrobials for Minimally Processed Foods. Annu. Rev. Food Sci. Technol. 2013, 4, 163–190. [Google Scholar] [CrossRef] [PubMed]
- Mamur, S.; Yüzbaşioğlu, D.; Unal, F.; Yilmaz, S. Does potassium sorbate induce genotoxic or mutagenic effects in lymphocytes? Toxicol. In Vitr. 2010, 24, 790–794. [Google Scholar] [CrossRef] [PubMed]
- Kitsiou, M.; Purk, L.; Ioannou, C.; Wantock, T.; Sandison, G.; Harle, T.; Gutierrez-Merino, J.; Klymenko, O.V.; Velliou, E. On the evaluation of the antimicrobial effect of grape seed extract and cold atmospheric plasma on the dynamics of Listeria monocytogenes in novel multiphase 3D viscoelastic models. Int. J. Food Microbiol. 2023, 406, 110395. [Google Scholar] [CrossRef]
- International Organisation of Vine and Wine. Focus OIV 2017: Distribution of the World’s Grapevine Varieties; OIV: Paris, France, 2017; ISBN 979-10-91799-89-8. [Google Scholar]
- Ferrer-Gallego, R.; Silva, P. The Wine Industry By-Products: Applications for Food Industry and Health Benefits. Antioxidants 2022, 11, 2025. [Google Scholar] [CrossRef]
- Blancquaert, E.H.; Oberholster, A.; Ricardo-Da-Silva, J.M.; Deloire, A.J. Grape Flavonoid Evolution and Composition Under Altered Light and Temperature Conditions in Cabernet Sauvignon (Vitis vinifera L.). Front. Plant Sci. 2019, 10, 1062. [Google Scholar] [CrossRef]
- Borbalán, Á.M.A.; Zorro, L.; Guillén, D.A.; Barroso, C.G. Study of the polyphenol content of red and white grape varieties by liquid chromatography–mass spectrometry and its relationship to antioxidant power. J. Chromatogr. A 2003, 1012, 31–38. [Google Scholar] [CrossRef]
- Petrović, A.; Živković, N.; Torović, L.; Bukarica, A.; Nikolić, V.; Cvejić, J.; Gojković-Bukarica, L. Comparative Study of the Stilbenes and Other Phenolic Compounds in Cabernet Sauvignon Wines Obtained from Two Different Vinifications: Traditional and Co-Inoculation. Processes 2024, 12, 1020. [Google Scholar] [CrossRef]
- Balík, J.; Kyseláková, M.; Vrchotová, N.; Tříska, J.; Kumšta, M.; Veverka, J.; Híc, P.; Totušek, J.; Lefnerová, D. Relations between polyphenols content and antioxidant activity in vine grapes and leaves. Czech J. Food Sci. 2008, 26, S25–S32. [Google Scholar] [CrossRef]
- Sanhueza, L.; Melo, R.; Montero, R.; Maisey, K.; Mendoza, L.; Wilkens, M. Synergistic interactions between phenolic compounds identified in grape pomace extract with antibiotics of different classes against Staphylococcus aureus and Escherichia coli. PLoS ONE 2017, 12, e0172273. [Google Scholar] [CrossRef] [PubMed]
- Rockenbach, I.I.; Gonzaga, L.V.; Rizelio, V.M.; Gonçalves, A.E.d.S.S.; Genovese, M.I.; Fett, R. Phenolic compounds and antioxidant activity of seed and skin extracts of red grape (Vitis vinifera and Vitis labrusca) pomace from Brazilian winemaking. Food Res. Int. 2011, 44, 897–901. [Google Scholar] [CrossRef]
- Deng, Q.; Penner, M.H.; Zhao, Y. Chemical composition of dietary fiber and polyphenols of five different varieties of wine grape pomace skins. Food Res. Int. 2011, 44, 2712–2720. [Google Scholar] [CrossRef]
- Vejarano, R.; Luján-Corro, M. Red Wine and Health: Approaches to Improve the Phenolic Content During Winemaking. Front. Nutr. 2022, 9, 890066. [Google Scholar] [CrossRef] [PubMed]
- Chen, J.; Thilakarathna, W.P.D.W.; Astatkie, T.; Rupasinghe, H.P.V. Optimization of Catechin and Proanthocyanidin Recovery from Grape Seeds Using Microwave-Assisted Extraction. Biomolecules 2020, 10, 243. [Google Scholar] [CrossRef]
- Ikigai, H.; Nakae, T.; Hara, Y.; Shimamura, T. Bactericidal catechins damage the lipid bilayer. Biochim. Biophys. Acta (BBA)—Biomembr. 1993, 1147, 132–136. [Google Scholar] [CrossRef]
- Spina, M.; Cuccioloni, M.; Mozzicafreddo, M.; Montecchia, F.; Pucciarelli, S.; Eleuteri, A.M.; Fioretti, E.; Angeletti, M. Mechanism of inhibition of wt-dihydrofolate reductase from E. coli by tea epigallocatechin-gallate. Proteins 2008, 72, 240–251. [Google Scholar] [CrossRef]
- Renzetti, A.; Betts, J.W.; Fukumoto, K.; Rutherford, R.N. Antibacterial green tea catechins from a molecular perspective: Mechanisms of action and structure–activity relationships. Food Funct. 2020, 11, 9370–9396. [Google Scholar] [CrossRef]
- Mattivi, F.; Vrhovsek, U.; Masuero, D.; Trainotti, D. Differences in the amount and structure of extractable skin and seed tannins amongst red grape varieties. Aust. J. Grape Wine Res. 2009, 15, 27–35. [Google Scholar] [CrossRef]
- Šarac, D.P.; Tremmel, M.; Vujetić, J.; Torović, L.; Orčić, D.; Popović, L.; Mimica-Dukić, N.; Lesjak, M. How do in vitro digestion and cell metabolism affect the biological activity and phenolic profile of grape juice and wine. Food Chem. 2024, 449, 139228. [Google Scholar] [CrossRef]
- Radovanović, B.C.; Radovanović, A.N.; Souquet, J. Phenolic profile and free radical-scavenging activity of Cabernet Sauvignon wines of different geographical origins from the Balkan region. J. Sci. Food Agric. 2010, 90, 2455–2461. [Google Scholar] [CrossRef] [PubMed]
- Carando, S.; Teissedre, P.-L.; Pascual-Martinez, L.; Cabanis, J.-C. Levels of Flavan-3-ols in French Wines. J. Agric. Food Chem. 1999, 47, 4161–4166. [Google Scholar] [CrossRef] [PubMed]
- Deng, H.; Meng, X.; Xue, B.; Li, L. Unveiling the antibacterial potential of anthocyanins—A comprehensive review on this natural plant extract. Crit. Rev. Food Sci. Nutr. 2024, 1–14. [Google Scholar] [CrossRef]
- Li, Y.; Ma, R.; Xu, Z.; Wang, J.; Chen, T.; Chen, F.; Wang, Z. Identification and quantification of anthocyanins in Kyoho grape juice-making pomace, Cabernet Sauvignon grape winemaking pomace and their fresh skin. J. Sci. Food Agric. 2013, 93, 1404–1411. [Google Scholar] [CrossRef] [PubMed]
- Yang, P.; Yuan, C.; Wang, H.; Han, F.; Liu, Y.; Wang, L.; Liu, Y. Stability of Anthocyanins and Their Degradation Products from Cabernet Sauvignon Red Wine under Gastrointestinal pH and Temperature Conditions. Molecules 2018, 23, 354. [Google Scholar] [CrossRef]
- Xie, Y.; Yang, W.; Tang, F.; Chen, X.; Ren, L. Antibacterial Activities of Flavonoids: Structure-Activity Relationship and Mechanism. Curr. Med. Chem. 2015, 22, 132–149. [Google Scholar] [CrossRef]
- Mattivi, F.; Guzzon, R.; Vrhovsek, U.; Stefanini, M.; Velasco, R. Metabolite Profiling of Grape: Flavonols and Anthocyanins. J. Agric. Food Chem. 2006, 54, 7692–7702. [Google Scholar] [CrossRef]
- Flint, S.D.; Jordan, P.W.; Caldwell, M.M. Plant protective response to enhanced UV-B radiation under field conditions: Leaf optical properties and photosynthesis. Photochem. Photobiol. 1985, 41, 95–99. [Google Scholar] [CrossRef]
- Castillo-Muñoz, N.; Gómez-Alonso, S.; García-Romero, E.; Hermosín-Gutiérrez, I. Flavonol Profiles of Vitis vinifera Red Grapes and Their Single-Cultivar Wines. J. Agric. Food Chem. 2007, 55, 992–1002. [Google Scholar] [CrossRef]
- Langcake, P.; Pryce, R.J. A new class of phytoalexins from grapevines. Cell. Mol. Life Sci. 1977, 33, 151–152. [Google Scholar] [CrossRef]
- Hatem, O.; Steinbach, A.; Schneider, G.; Röckel, F.; Kőrösi, L. Wild Vitis Species as Stilbenes Sources: Cane Extracts and Their Antibacterial Activity against Listeria monocytogenes. Molecules 2024, 29, 3518. [Google Scholar] [CrossRef] [PubMed]
- Krasteva, D.; Ivanov, Y.; Chengolova, Z.; Godjevargova, T. Antimicrobial Potential, Antioxidant Activity, and Phenolic Content of Grape Seed Extracts from Four Grape Varieties. Microorganisms 2023, 11, 395. [Google Scholar] [CrossRef] [PubMed]
- Nayak, A.; Bhushan, B.; Rosales, A.; Turienzo, L.R.; Cortina, J.L. Valorisation potential of Cabernet grape pomace for the recovery of polyphenols: Process intensification, optimisation and study of kinetics. Food Bioprod. Process. 2018, 109, 74–85. [Google Scholar] [CrossRef]
- González-Alamilla, E.N.; Gonzalez-Cortazar, M.; Valladares-Carranza, B.; Rivas-Jacobo, M.A.; Herrera-Corredor, C.A.; Ojeda-Ramírez, D.; Zaragoza-Bastida, A.; Rivero-Perez, N. Chemical Constituents of Salix babylonica L. and Their Antibacterial Activity Against Gram-Positive and Gram-Negative Animal Bacteria. Molecules 2019, 24, 2992. [Google Scholar] [CrossRef]
- Soyuçok, A.; Kılıç, B.; Kılıç, G.B.; Yalçın, H. In vitro antimicrobial activity of ginseng extract against Staphylococcus aureus, Salmonella typhimurium and Listeria monocytogenes and its inhibitory effects on these pathogens in cooked ground beef. Meat Sci. 2024, 216, 109559. [Google Scholar] [CrossRef]
- Friedman, M.; Henika, P.R.; Levin, C.E. Bactericidal activities of health-promoting, food-derived powders against the foodborne pathogens Escherichia coli, Listeria monocytogenes, Salmonella enterica, and Staphylococcus aureus. J. Food Sci. 2013, 78, M270–M275. [Google Scholar] [CrossRef]
- Pirone-Davies, C.; Chen, Y.; Pightling, A.; Ryan, G.; Wang, Y.; Yao, K.; Hoffmann, M.; Allard, M.W. Genes significantly associated with lineage II food isolates of Listeria monocytogenes. BMC Genom. 2018, 19, 708. [Google Scholar] [CrossRef]
- Popowska, M.; Markiewicz, Z. Classes and functions of Listeria monocytogenes surface proteins. Pol. J. Microbiol. 2004, 53, 75–88. [Google Scholar]
- Rasheed, N.A.; Hussein, N.R. Staphylococcus aureus: An overview of discovery, characteristics, epidemiology, virulence factors and antimicrobial sensitivity. Eur. J. Mol. Clin. Med. 2021, 8, 1160–1183. [Google Scholar]
- Kadariya, J.; Smith, T.C.; Thapaliya, D. Staphylococcus aureus and staphylococcal food-borne disease: An ongoing challenge in public health. BioMed Res. Int. 2014, 2014, 827965. [Google Scholar] [CrossRef]
- Carrera, M.; Böhme, K.; Gallardo, J.M.; Barros-Velázquez, J.; Cañas, B.; Calo-Mata, P. Characterization of Foodborne Strains of Staphylococcus aureus by Shotgun Proteomics: Functional Networks, Virulence Factors and Species-Specific Peptide Biomarkers. Front. Microbiol. 2017, 8, 2458. [Google Scholar] [CrossRef] [PubMed]
- Kao, T.-T.; Tu, H.-C.; Chang, W.-N.; Chen, B.-H.; Shi, Y.-Y.; Chang, T.-C.; Fu, T.-F. Grape seed extract inhibits the growth and pathogenicity of Staphylococcus aureus by interfering with dihydrofolate reductase activity and folate-mediated one-carbon metabolism. Int. J. Food Microbiol. 2010, 141, 17–27. [Google Scholar] [CrossRef] [PubMed]
- Zhao, X.; Chen, L.; Wu, J.; He, Y.; Yang, H. Elucidating antimicrobial mechanism of nisin and grape seed extract against Listeria monocytogenes in broth and on shrimp through NMR-based metabolomics approach. Int. J. Food Microbiol. 2020, 319, 108494. [Google Scholar] [CrossRef] [PubMed]
- Perumalla, A.V.S.; Hettiarachchy, N.S. Green tea and grape seed extracts—Potential applications in food safety and quality. Food Res. Int. 2011, 44, 827–839. [Google Scholar] [CrossRef]
- Saavedra, M.J.; Borges, A.; Dias, C.; Aires, A.; Bennett, R.N.; Rosa, E.S.; Simões, M. Antimicrobial Activity of Phenolics and Glucosinolate Hydrolysis Products and their Synergy with Streptomycin against Pathogenic Bacteria. Med. Chem. 2010, 6, 174–183. [Google Scholar] [CrossRef]
- Qin, R.; Xiao, K.; Li, B.; Jiang, W.; Peng, W.; Zheng, J.; Zhou, H. The combination of catechin and epicatechin callate from Fructus Crataegi potentiates beta-lactam antibiotics against methicillin-resistant staphylococcus aureus (MRSA) in vitro and in vivo. Int. J. Mol. Sci. 2013, 14, 1802–1821. [Google Scholar] [CrossRef]
- Kitsiou, M.; Wantock, T.; Sandison, G.; Harle, T.; Gutierrez-Merino, J.; Klymenko, O.V.; Karatzas, K.A.; Velliou, E. Determination of the combined effect of grape seed extract and cold atmospheric plasma on foodborne pathogens and their environmental stress knockout mutants. Appl. Environ. Microbiol. 2024, 90, e0017724. [Google Scholar] [CrossRef]
- Kőrösi, L.; Molnár, S.; Teszlák, P.; Dörnyei, Á.; Maul, E.; Töpfer, R.; Marosvölgyi, T.; Szabó, É.; Röckel, F. Comparative Study on Grape Berry Anthocyanins of Various Teinturier Varieties. Foods 2022, 11, 3668. [Google Scholar] [CrossRef]
- Bouderias, S.; Teszlák, P.; Jakab, G.; Kőrösi, L. Age- and season-dependent pattern of flavonol glycosides in Cabernet Sauvignon grapevine leaves. Sci. Rep. 2020, 10, 14241. [Google Scholar] [CrossRef]
- Kőrösi, L.; Bouderias, S.; Csepregi, K.; Bognár, B.; Teszlák, P.; Scarpellini, A.; Castelli, A.; Hideg, É.; Jakab, G. Nanostructured TiO2-induced photocatalytic stress enhances the antioxidant capacity and phenolic content in the leaves of Vitis vinifera on a genotype-dependent manner. J. Photochem. Photobiol. B Biol. 2019, 190, 137–145. [Google Scholar] [CrossRef]
- Carrel, M.; Perencevich, E.N.; David, M.Z. USA300 Methicillin-Resistant Staphylococcus aureus, United States, 2000–2013. Emerg. Infect. Dis. 2015, 21, 1973–1980. [Google Scholar] [CrossRef]


| Phenolic Compound in Seed | Non-Crushed | Freshly Crushed (3 h) | Before Pressing (18 d) | After Pressing (18 d) |
|---|---|---|---|---|
| (µg/g DW) | ||||
| Catechin | 3999.9 ± 147.9 ab | 3589.0 ± 108.0 a | 2788.0 ± 210.3 c | 2081.4 ± 110.1 bc |
| Epicatechin | 2454.7 ± 100.5 ab | 2157.9 ± 50.6 a | 1635.5 ± 121.7 c | 1167.6 ± 71.1 bc |
| Quercetin-3-O-galactoside | nd | nd | nd | nd |
| Quercetin-3-O-glucoside | 34.9 ± 0.9 ab | 32.9 ± 0.3 a | 29.3 ± 0.3 c | 25.7 ± 0.5 bc |
| Quercetin-3-O-glucuronide | nd | nd | trace | trace |
| Myricetin-3-O-galactoside | nd | trace | trace | trace |
| Myricetin-3-O-glucoside | nd | trace | trace | trace |
| Kaempferol-3-O-glucoside | nd | nd | nd | nd |
| Kaempferol-3-O-rutinoside | nd | nd | nd | nd |
| Kaempferol-3-O-glucuronide | nd | nd | nd | nd |
| Isorhamnetin-3-O-glucoside | nd | nd | nd | nd |
| Malvidin-3-O-glucoside | trace | trace | 60.7 ± 1.5 a | 77.3 ± 1.1 a |
| Delphinidin-3-O-glucoside | nd | trace | 11.4 ± 0.4 a | 13.5 ± 0.2 a |
| Cyanidin-3-O-glucoside | nd | nd | nd | nd |
| Petunidind-3-O-glucoside | nd | nd | trace | trace |
| Peonidin-3-O-glucoside | nd | nd | nd | nd |
| Resveratrol | nd | nd | nd | nd |
| Piceid | nd | nd | nd | nd |
| Phenolic Compound in Skin | Non-Crushed | Freshly Crushed (3 h) | Before Pressing (18 d) | After Pressing (18 d) |
|---|---|---|---|---|
| (µg/g DW) | ||||
| Catechin | nd | nd | nd | nd |
| Epicatechin | nd | nd | nd | nd |
| Quercetin-3-O-galactoside | 571.3 ± 23.9 ab | 441.6 ± 27.4 a | 314 ± 5.39 c | 275.1 ± 6.4 bc |
| Quercetin-3-O-glucoside | 445.6 ± 19.5 ab | 388.5 ± 1.5 a | 213.2 ± 9.9 c | 190.5 ± 5.9 bc |
| Quercetin-3-O-glucuronide | 56.2 ± 11.8 a | 34.3 ± 5.1 a | trace | trace |
| Myricetin-3-O-galactoside | 228.6 ± 12.1 ab | 178.3 ± 11.1 a | 95.2 ± 4.9 c | 68.4 ± 3.0 bc |
| Myricetin-3-O-glucoside | 265.5 ± 10.1 ab | 233.7 ± 10.1 a | 121.7 ± 7.1 c | 101.6 ± 0.9 bc |
| Kaempferol-3-O-glucoside | 56.41 ± 10.03 a | 37.73 ± 9.12 a | trace | trace |
| Kaempferol-3-O-rutinoside | trace | trace | trace | trace |
| Kaempferol-3-O-glucuronide | trace | trace | trace | trace |
| Isorhamnetin-3-O-glucoside | trace | trace | trace | trace |
| Malvidin-3-O-glucoside | 9135.4 ± 560.4 ab | 6307.9 ± 238.4 a | 4761.4 ± 242.1 c | 4598.2 ± 159.9 bc |
| Delphinidin-3-O-glucoside | 3168.8 ± 204.3 ab | 2362.0 ± 153.1 a | 1724.7 ± 101.4 c | 1471.8 ± 86 bc |
| Cyanidin-3-O-glucoside | 613.6 ± 22.2 ab | 531.4 ± 15.1 a | 317 ± 9 c | 283.1 ± 10.1 bc |
| Petunidind-3-O-glucoside | 2152.3 ± 112.4 ab | 1505.4 ± 37.1 a | 1089.4 ± 81.3 c | 887.8 ± 11.6 bc |
| Peonidin-3-O-glucoside | 932.1 ± 38.6 ab | 773.6 ± 39.8 a | 392 ± 17.9 c | 331.6 ± 12.5 bc |
| Resveratrol | trace | nd | nd | nd |
| Piceid | 74.9 ± 2.4 ab | 38.80 ± 0.7 a | 28.5 ± 2.0 | 26.6 ± 0.3 b |
| Phenolic Compound in Juice/Wine | Non-Crushed | Freshly Crushed (3 h) | Before Pressing (18 d) | After Pressing (18 d) |
|---|---|---|---|---|
| (mg/L) | ||||
| Catechin | nd | 1.9 ± 0.1 | 54 ± 2.7 a | 60.8 ± 1.5 a |
| Epicatechin | nd | trace | 26.3 ± 1.3 a | 32.4 ± 1.3 a |
| Quercetin-3-O-galactoside | trace | trace | 20.8 ± 0.9 a | 23.6 ± 1.0 a |
| Quercetin-3-O-glucoside | trace | trace | 9.7 ± 0.3 a | 11.1 ± 0.2 a |
| Quercetin-3-O-glucuronide | nd | nd | trace | trace |
| Myricetin-3-O-galactoside | nd | nd | 2.6 ± 0.0 a | 3.8 ± 0.1 a |
| Myricetin-3-O-glucoside | nd | nd | 5.0 ± 0.3 a | 5.7 ± 0.2 a |
| Kaempferol-3-O-glucoside | nd | nd | trace | trace |
| Kaempferol-3-O-rutinoside | nd | nd | nd | nd |
| Kaempferol-3-O-glucuronide | nd | nd | nd | nd |
| Isorhamnetin-3-O-glucoside | nd | nd | nd | nd |
| Malvidin-3-O-glucoside | 9.6 ± 0.3 ab | 18.4 ± 1.2 a | 244.8 ± 4.9 c | 293.3 ± 6.3 bc |
| Delphinidin-3-O-glucoside | 2.6 ± 0.2 ab | 4.7 ± 0.3 a | 45.4 ± 2.7 | 48.8 ± 4.3 b |
| Cyanidin-3-O-glucoside | trace | 1.4 ± 0.0 | 4.6 ± 0.1 | 4.5 ± 0.0 |
| Petunidind-3-O-glucoside | trace | 3.1 ± 0.2 | 42.2 ± 2.3 a | 43.7 ± 3.1 a |
| Peonidin-3-O-glucoside | trace | 3.0 ± 0.2 | 16.7 ± 0.2 | 17.2 ± 1.1 |
| Resveratrol | nd | nd | nd | nd |
| Piceid | nd | nd | trace | trace |
| Phenolic Compound | c (µg/g DW) |
|---|---|
| Catechin | 32,025.3 ± 154.2 |
| Epicatechin | 14,652.5 ± 42.8 |
| Quercetin-3-O-galactoside | trace |
| Quercetin-3-O-glucoside | 89 ± 0.6 |
| Quercetin-3-O-glucuronide | trace |
| Myricetin-3-O-galactoside | 62.6 ± 0.4 |
| Myricetin-3-O-glucoside | trace |
| Kaempferol-3-O-glucoside | nd |
| Kaempferol-3-O-rutinoside | nd |
| Kaempferol-3-O-glucuronide | nd |
| Isorhamnetin-3-O-glucoside | nd |
| Malvidin-3-O-glucoside | 249.5 ± 1.8 |
| Delphinidin-3-O-glucoside | 39.9 + 0.1 |
| Cyanidin-3-O-glucoside | nd |
| Petunidind-3-O-glucoside | trace |
| Peonidin-3-O-glucoside | trace |
| Resveratrol | nd |
| Piceid | trace |
| Phenolic Compound | c (µg/g DW) |
|---|---|
| Malvidin-3-O-glucoside | 12,628.7 ± 58.2 |
| Delphinidin-3-O-glucoside | 776.3 ± 4.3 |
| Cyanidin-3-O-glucoside | 274.8 ± 2.5 |
| Petunidind-3-O-glucoside | 985.2 ± 8.4 |
| Peonidin-3-O-glucoside | 385.2 ± 7 |
| Total and Individual Phenolics | Concentration of Crude Seed Extract in Antibacterial Test (mg/mL) | |||
|---|---|---|---|---|
| 5.02 | 2.54 | 1.28 | 0.64 | |
| Total phenolic content (mg GAE/mL) | 4.92 ± 0.08 | 2.49 ± 0.04 | 1.26 ± 0.02 | 0.63 ± 0.01 |
| Catechin (µg/mL) | 160.77 ± 0.77 | 81.34 ± 0.39 | 40.99 ± 0.18 | 20.50 ± 0.10 |
| Epicatechin (µg/mL) | 73.56 ± 0.21 | 37.22 ± 0.10 | 18.76 ± 0.05 | 9.38 ± 0.03 |
| Quercetin-3-O-glucoside (µg/mL) | 0.45 ± 0.00 | 0.23 ± 0.00 | 0.11 ± 0.00 | 0.06 ± 0.00 |
| Myricetin-3-O-galactoside (µg/mL) | 0.31 ± 0.00 | 0.16 ± 0.00 | 0.08 ± 0.00 | 0.04 ± 0.00 |
| Malvidin-3-O-glucoside (µg/mL) | 1.25 ± 0.01 | 0.63 ± 0.00 | 0.32 ± 0.00 | 0.16 ± 0.00 |
| Delphinidin-3-O-glucoside (µg/mL) | 0.20 ± 0.00 | 0.10 ± 0.00 | 0.05 ± 0.00 | 0.03 ± 0.00 |
| Total and Individual Phenolics | Concentration of Crude Skin Extract in Antibacterial Test (mg/mL) | |||
|---|---|---|---|---|
| 5.02 | 2.54 | 1.28 | 0.64 | |
| Total phenolic content (mg GAE/mL) | 0.93 ± 0.06 | 0.47 ± 0.03 | 0.24 ± 0.01 | 0.12 ± 0.01 |
| Malvidin-3-O-glucoside | 63.40 ± 0.29 | 32.08 ± 0.15 | 16.16 ± 0.07 | 8.08 ± 0.04 |
| Delphinidin-3-O-glucoside | 3.90 ± 0.02 | 1.97 ± 0.01 | 0.99 ± 0.01 | 0.50 ± 0.00 |
| Cyanidin-3-O-glucoside | 1.38 ± 0.01 | 0.70 ± 0.01 | 0.35 ± 0.00 | 0.18 ± 0.00 |
| Petunidind-3-O-glucoside | 4.95 ± 0.04 | 2.51 ± 0.02 | 1.26 ± 0.01 | 0.63 ± 0.01 |
| Peonidin-3-O-glucoside | 1.93 ± 0.04 | 0.98 ± 0.02 | 0.49 ± 0.01 | 0.25 ± 0.00 |
Disclaimer/Publisher’s Note: The statements, opinions and data contained in all publications are solely those of the individual author(s) and contributor(s) and not of MDPI and/or the editor(s). MDPI and/or the editor(s) disclaim responsibility for any injury to people or property resulting from any ideas, methods, instructions or products referred to in the content. |
© 2025 by the authors. Licensee MDPI, Basel, Switzerland. This article is an open access article distributed under the terms and conditions of the Creative Commons Attribution (CC BY) license (https://creativecommons.org/licenses/by/4.0/).
Share and Cite
Hatem, O.; Seres-Steinbach, A.; Schneider, G.; Szabó, É.; Kőrösi, L. Insight into the Phenolic Composition of Cabernet Sauvignon Grapevine Berries During Fermentation—Towards the Application of Winery By-Products for Antibacterial Purposes. Antibiotics 2025, 14, 236. https://doi.org/10.3390/antibiotics14030236
Hatem O, Seres-Steinbach A, Schneider G, Szabó É, Kőrösi L. Insight into the Phenolic Composition of Cabernet Sauvignon Grapevine Berries During Fermentation—Towards the Application of Winery By-Products for Antibacterial Purposes. Antibiotics. 2025; 14(3):236. https://doi.org/10.3390/antibiotics14030236
Chicago/Turabian StyleHatem, Okba, Anita Seres-Steinbach, György Schneider, Éva Szabó, and László Kőrösi. 2025. "Insight into the Phenolic Composition of Cabernet Sauvignon Grapevine Berries During Fermentation—Towards the Application of Winery By-Products for Antibacterial Purposes" Antibiotics 14, no. 3: 236. https://doi.org/10.3390/antibiotics14030236
APA StyleHatem, O., Seres-Steinbach, A., Schneider, G., Szabó, É., & Kőrösi, L. (2025). Insight into the Phenolic Composition of Cabernet Sauvignon Grapevine Berries During Fermentation—Towards the Application of Winery By-Products for Antibacterial Purposes. Antibiotics, 14(3), 236. https://doi.org/10.3390/antibiotics14030236