Abstract
Parkinson’s disease: Parkinson’s disease (PD) is the second-most common neurodegenerative disease, affecting at least 0.3% of the worldwide population and over 3% of those over 80 years old. According to recent research (2018), in 2016, 6.1 million (95% uncertainty interval (UI) 5.0–7.3) individuals had Parkinson’s disease globally, compared with 2.5 million (2.0–3.0) in 1990. The pandemic-like spreading of PD is considered a slow-moving disaster. Most recent studies indicated the possible role of an altered microbiome, dysbiosis, in the development of PD, which occurs long before the clinical diagnosis of PD. Antibiotics are considered as major disruptors of the intestinal flora and we have hypothesized that, as different classes of antibiotics might induce different dysbiosis, certain classes of antibiotics could trigger the PD-related dysbiosis as well. Comparative analyses were performed between the average yearly antibiotic consumption of 30 European countries (1997–2016) and the PD prevalence database (estimated for 2016). We divided the time frame of antibiotic consumption of 1997–2016 into four subsections to estimate the possible time lapse between antibiotic exposure and the prevalence, prevalence change, and PD-related death rates estimated for 2016. Our results indicated that countries with high consumption of narrow-spectrum penicillin experienced a higher increase in PD prevalence than the others. Countries reporting a decline in PD from 1990 to 2016 demonstrated a reduction in the consumption of narrow-spectrum penicillin in this period.
1. Introduction
According to recent reports [1], in 2016, 6.1 million (95% uncertainty interval (UI) 5.0–7.3) individuals had Parkinson’s disease globally, compared with 2.5 million (2.0–3.0) in 1990.
As of the WHO report (13 June 2022), globally, disability and death due to PD are increasing faster than for any other neurological disorder. The prevalence of PD has doubled in the past 25 years. Global estimates in 2019 showed over 8.5 million individuals with PD. Current estimates suggest that, in 2019, PD resulted in 5.8 million disability-adjusted life years, an increase of 81% since 2000, and caused 329,000 deaths, an increase of over 100% since 2000 (https://www.who.int/news-room/fact-sheets/detail/parkinson-disease, accessed on 18 August 2022). The pandemic-like spreading of PD is considered a slow-moving disaster. Parkinson’s disease occurs when nerve cells, or neurons, in the brain die or become impaired. Although many brain areas are affected, the most common symptoms result from the loss of neurons in an area near the base of the brain called the substantia nigra [2]. Normally, the neurons in this area produce an important brain chemical known as dopamine. Dopamine is a chemical messenger responsible for transmitting signals between the substantia nigra and the next “relay station” of the brain, the corpus striatum, to produce smooth, purposeful movement. Loss of dopamine results in abnormal nerve-firing patterns within the brain that cause impaired movement. Studies have shown that most people with Parkinson’s have lost 60 to 80 percent or more of the dopamine-producing cells in the substantia nigra by the time symptoms appear and that people with PD also have a loss of the nerve endings that produce the neurotransmitter norepinephrine [3,4].
The pathological hallmark of PD is the accumulation of filamentous, cytoplasmic inclusions consisting mainly of α-synuclein aggregations in the form of Lewy bodies (LB) or Lewy neurites (LN). α-Synuclein phosphorylation and fibrillization lead to LB formation and induce neuron death [5,6]. LB are found in certain areas of the CNS, e.g., the basal ganglia, the dorsal motor nucleus of the vagus (NV), the olfactory bulb (OB), the locus coeruleus (LC) and the intermediolateral nucleus in the spinal cord (IML); and of the peripheral nervous system (PNS), e.g., the celiac ganglia and enteric nervous system (ENS) of PD patients [7,8,9]. Several etiological factors were implicated as causative agents promoting the development of PD, out of which genetics, toxic agents (such as toxic fumes, manganese, etc.), and mitochondrial injury could be mentioned [10].
The genetic background is considered in only 5–10% of the cases. The majority of PD is genetically complex, caused by the combination of common genetic variants in concert with environmental factors. Genome-wide association studies have identified twenty-six PD risk loci to date; however, these show only moderate effects on the risk for PD [11]. Furthermore, an individual’s risk of PD is partially the product of as-yet poorly defined polygenic risk factors. Based on the progression of both symptoms and pathology from the periphery to the CNS, Braak and colleagues proposed that, in some patients, Parkinson’s disease might initiate at peripheral sites, particularly the nasal cavity and/or the intestine [12,13]. Very recent epidemiological evidence suggests that both vagotomy and appendectomy decrease the risk of PD in humans. These exciting observations provide further support that peripheral signals, particularly from the gastrointestinal tract, can contribute to the manifestation of this CNS disease [14,15,16]. A large number of studies have been performed to catalog the diversity and abundance of microbial taxa present in the intestinal microbiomes of persons with PD in comparison to healthy individuals [17]. Among these studies, the majority utilized fecal sampling and 16S rRNA sequencing to assess the gastrointestinal microbiome architecture. Most consistently, decreases in the Lachnospiraceae family, including Blautia sp. and Roseburia sp., as well as decreases in Faecalibacterium, have been reported. Taxa enriched in PD include the Lactobacillaceae family, Akkermansia sp., and Bifidiobacterium sp. Autopsy studies, including both Parkinson’s disease patients and matched controls, demonstrated that α-synuclein aggregates in Parkinson’s disease patients can be found in both the substantia nigra and the enteric nervous system. Therefore, it has been hypothesized that the pathological process that leads eventually to Parkinson’s disease might initially take place in the enteric nervous system years before the appearance of motor features. Dysbiosis of the normal gut microbiome is thought to be associated with pathophysiologic changes not only in the gastrointestinal system itself but also in the enteric and central nervous systems. [18,19]. Growing evidence indicates that gut microbiota play a critical role in regulating the progression of neurodegenerative diseases such as Parkinson’s disease.
2. Hypothesis
We hypothesized that exposure to different classes of antibiotics is involved in the pathogenesis of PD as a contributor to the development of PD-related dysbiosis. Based on the data listed above, it is likely that certain antibiotics change the gut microbiome, favoring curli-producing species. These bacteria deposit αSyn in the enteric nervous system (ENS) and promote further amyloid deposition via cross-seeding, which results in the formation of transmissible self-propagating prion-like proteins. Amyloidosis appears in the ENS and later on in the central nervous system until the full expression of motor symptoms of PD develops, due to the loss of dopamine supply in basal ganglia. In addition, antibiotics result in low-grade systemic inflammation, which also contributes to damage of neurons in the enteric and central nervous systems. As Parkinson’s disease (PD) is a neurodegenerative amyloid disorder with debilitating motor symptoms due to the loss of dopaminesynthesizing, basal-ganglia-projecting neurons in the substantia nigra, an interesting feature of the disease is that most PD patients have gastrointestinal problems and bacterial dysbiosis years before the full expression of motor symptoms [18,19]. We hypothesized that antibiotic consumption might be a contributing factor to gut microbiome dysbiosis in PD, favoring curli-producing Enterobacteria. Curli is a bacterial α-synuclein (αSyn) that is deposited first in the enteric nervous system, and amyloid deposits are propagated in a prion-like manner to the central nervous system. In addition, antibiotics result in low-grade systemic inflammation, which also contributes to damage of neurons in the enteric and central nervous system.
3. Materials and Methods
To evaluate the hypothesis, antibiotic consumption databases were compared to PD prevalence data for 2016. For antibiotic consumption patterns, publicly available antibiotic databases (ECDC yearly reports) for 1997–2016 (https://www.ecdc.europa.eu/en/antimicrobial-consumption/database/quality-indicators, accessed on 15 July 2022) were compared to the prevalence and change of the prevalence between 1990–2016 and the Parkinson’s-related death rates were calculated from the Parkinson’s database [1] for 30 European countries. Average yearly consumption of total systemic antibiotics (ATC classification J01) expressed in Defined Daily Dose/1000 Inhabitants/Day (DID) was calculated, as was the relative share of major antibiotic classes consumed in the community at ATC levels 3 and 4 as tetracycline (J01A), penicillin (J01C), broad-spectrum, beta-lactamase sensitive penicillin (J01CA), narrow spectrum, beta-lactamase sensitive penicillin (J01CE), narrow spectrum, beta-lactamase resistant penicillin (J01CF), broad-spectrum, beta-lactamase resistant combination penicillin (J01CR), cephalosporin (J01D), macrolide and lincosamides, streptogramins (J01F), and quinolone (J01M). Estimating the possible time-lapse of the antibiotic consumption and the development of PD, we separately calculated the average antibiotic consumption for the periods of 1997–2001, 2002–2006, 2007–2011, and 2012–2016, covering 20 years. Results were featured in Table 1, Table 2, Table 3 and Table 4. A separate comparison was performed between the antibiotic consumption patterns of countries with a declining prevalence of PD (Bulgaria, France, Italy, and the Netherlands) and the countries with the highest prevalence of PD (Denmark, Norway, Portugal, and the UK), featured in Table 5. Diagrams were plotted for graphically demonstrating the association between the increases of PD prevalence in 21 European countries and the average consumption of narrow-spectrum penicillin for the time segment 1997–2001. (Figure 1 and Figure 2).

Table 1.
Average antibiotic consumption for 1997–2001 expressed as a relative share in % of the total systemic antibiotic consumption in the community estimated in Defined Daily Dose/1000 Inhabitants/Day (DID) compared to the prevalence of PD estimated for 2016, the change of prevalence between 1990–2016 in percentage (%), and the PD-related deaths/100,000 population. Positive, significant correlation or significantly elevated risk was estimated when the p-value showed ≤0.05 (p = ≤0.05) (marked with yellow filling color) and the negative correlation or lowered risk was marked with green filling color. Positive/negative, non-significant correlations or elevated/lowered risks were considered when the p-value fell between 0.051 and 0.09 (p = 0.051 ≤ 0.09) and marked with an orange filling color.
Table 2.
Average antibiotic consumption for 2002–2006 expressed as a relative share in % of the total systemic antibiotic consumption in the community estimated in Defined Daily Dose/1000 Inhabitants/Day (DID) compared to the prevalence of PD estimated for 2016, the change of prevalence between 1990–2016 in percentage (%), and the PD-related deaths/100,000 population. Positive, significant correlation or significantly elevated risk was estimated, when the p-value showed ≤0.05 (p = ≤0.05) (marked with yellow filling color) and the negative correlation or lowered risk was marked with green filling color. Positive/negative, non-significant correlations or elevated/lowered risks were considered when the p-value fell between 0.051 and 0.09 (p = 0.051 ≤ 0.09) and marked with an orange filling color.
Table 3.
Average antibiotic consumption for 2007–2011 expressed as a relative share in % of the total systemic antibiotic consumption in the community estimated in Defined Daily Dose/1000 Inhabitants/Day (DID) compared to the prevalence of PD estimated for 2016, the change of prevalence between 1990–2016 in percentage (%), and the PD-related deaths/100,000 population. Positive, significant correlation or significantly elevated risk was estimated, when the p-value showed ≤0.05 (p = ≤0.05) (marked with yellow filling color) and the negative correlation or lowered risk was marked with green filling color. Positive/negative, non-significant correlations or elevated/lowered risks were considered when the p-value fell between 0.051 and 0.09 (p = 0.051 ≤ 0.09) and marked with an orange filling color.
Table 4.
Average antibiotic consumption for 2012–2016 expressed as a relative share in % of the total systemic antibiotic consumption in the community estimated in Defined Daily Dose/1000 Inhabitants/Day (DID) compared to the prevalence of PD estimated for 2016, the change of prevalence between 1990–2016 in percentage (%), and the PD-related deaths/100,000 population. Positive, significant correlation or significantly elevated risk was estimated, when the p-value showed ≤0.05 (p = ≤0.05) (marked with yellow filling color) and the negative correlation or lowered risk was marked with green filling color. Positive/negative, non-significant correlations or elevated/lowered risks were considered when the p-value fell between 0.051 and 0.09 (p = 0.051 ≤ 0.09) and marked with an orange filling color.
Table 5.
Comparison of the consumption of narrow-spectrum penicillin (J01CE, J01CF) in countries with the highest prevalence change of PD and the countries with decreased prevalence of PD. The higher consumption of narrow-spectrum penicillin (J01CE, J01CF) promoting the prevalence of PD is well observed in the countries with the top highest prevalence of PD, while, in the countries showing a decreasing prevalence of PD, a reduction in the consumption of narrow-spectrum penicillin (except for Portugal/J01CF/) is seen in the 5-year periods. The difference between the consumption of narrow-spectrum, beta-lactamase sensitive penicillin in countries with a higher increase in PD prevalence is nearly 6-fold compared to countries showing a reduction in the prevalence of PD between 1990–2016, while the difference in the consumption of narrow-spectrum, beta-lactamase resistant penicillin is 3-fold.
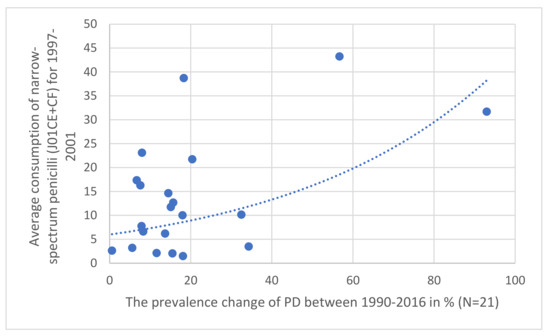
Figure 1.
Correlation observed between the prevalence increase of PD in 21 European countries (1997–2001) compared to the relative share of the consumption of narrow-spectrum, beta-lactamase sensitive (J01CE) and resistant (J01CF) penicillin (J01CE + CF).
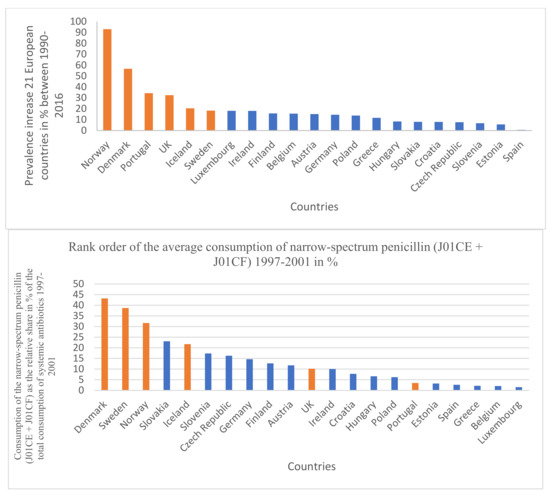
Figure 2.
Rank order of prevalence increase of PD in 21 European countries (%) for the time period 1997–2011 and the rank order of the consumption of narrow-spectrum penicillin (J01CE + J01CF). Identical countries are marked with orange filling color. Out of six countries with the highest increase of PD prevalence, four countries are identical with the penicillin-consumption rank order (1997–2001).
Pearson calculation was applied to estimate the correlation between antibiotic consumption and the prevalence, change of the prevalence (1990–2016), and death prevalence attributed to PD. A significant correlation was considered when p values were ≤0.05. A non-significant correlation was estimated when the p values fell between 0.051–0.09. Positive (supportive) and negative (inhibitor) significant correlations were considered and evaluated. Statistical results were recorded and featured in the same tables (Table 1, Table 2, Table 3 and Table 4). Logistic regression analysis was performed to estimate the odds ratio (OR) at the 95% confidence interval (CI) together with the related p-values.
4. Results
The results are summarized in Table 1, Table 2, Table 3, Table 4 and Table 5. Across different time sections, the possible promoting effect of the narrow-spectrum penicillin (J01CE, J01CF) on the development of PD was well observed, while the inhibitory effect of broad-spectrum penicillin (J01CA), broad-spectrum combination penicillin (J01CR), and other broad-spectrum antibiotics (cephalosporin/J01D/, quinolone/J01M/) were detected also. In the first period (Table 1 1997–2001), a significant promoting effect was observed between the prevalence of PD (2016) and the consumption of narrow-spectrum penicillin (J01CE, J01CF) and cephalosporin (J01D). A significant inhibitory effect was observed between broad-spectrum, beta-lactamase sensitive penicillin (J01CA), quinolone (J01M), and the prevalence increase of PD (1990–2016). It is of concern that quinolone consumption showed positive significant association with the PD-attributed death rate. The other periods (Table 2, Table 3 and Table 4, 2002–2006, 2007–2011, 2012–2016) showed similar associations. It was observed that countries with a reduction in PD prevalence between 1990–2016 (Bulgaria, France, Italy, Netherlands) considerably reduced their consumption of narrow-spectrum penicillin (J01CE, J01CF) in this period. In comparison, the similar four countries with the highest increase in PD prevalence (Denmark, Norway, Portugal, UK), it was observed that they used a nearly six-fold higher amount of narrow-spectrum, beta-lactamase sensitive (J01CE) and three-fold higher of beta-lactamase-resistant penicillin (J01CF) (Table 5). Diagrams (Figure 1) indicate a strong correlation between the average consumption of narrow-spectrum penicillin (J01CE + J01CF) and the prevalence increase of PD (N: 21). Figure 2 indicates the association between the rank order of PD prevalence increase and the consumption of narrow-spectrum antibiotics.
5. Discussion
Our observations indicate a positive statistical association and higher risk for the development of PD in countries consuming higher amounts of narrow-spectrum penicillin, which is demonstrated in Figure 2, showing the association between the PD prevalence increase and the consumption of narrow-spectrum penicillin for the time period 1997–2001. Similar associations were detected in the other time periods as well, but statistically significant negative associations and reduced risk of PD were also detected on comparing the consumption of broad-spectrum antibiotics (quinolone) and the PD prevalence. The opposing effect of the consumption of “promoter” (penicillin) and “inhibitor” antibiotics (broad-spectrum antibiotics) might determine the actual prevalence of PD, along with other factors playing a role in the development of PD (genetics).
While Parkinson’s disease has been historically studied as a disease of the central nervous system, there is a growing appreciation for the roles of both gastrointestinal function and its resident microbes within this disease state. Recent studies focused on the microbiome during Parkinson’s disease may advance our understanding of disease etiology and provide perspective for previously unrecognized therapeutic avenues through the modulation of intestinal microbes. In recent years, a large number of studies have been performed to catalog the diversity and abundance of microbial taxa present in the intestinal microbiomes of persons with PD in comparison to healthy individuals [20]. Among these studies, the majority utilized fecal sampling and 16S rRNA sequencing to assess the gastrointestinal microbiome architecture. Most consistently, decreases in the Lachnospiraceae family, including Blautia sp. and Roseburia sp., as well as decreases in Faecalibacterium, have been reported. Taxa enriched in PD include the Lactobacillaceae family, Akkermansia sp., and Bifidiobacterium sp. Fecal-derived microbial communities are easily observed. Unlike tissue or small intestinal contents, they do not require invasive procedures to acquire. However, the microbiome present in the feces is not identical to that within other regions of the gastrointestinal tract. It is critical to determine whether the dysbiosis present during PD has functional contributions, with microbes as active instigators or modulators of the disease state. Alternatively, dysbiosis may arise due to inherent changes in the host’s physiology (e.g., functional constipation) and the microbial population is affected as a bystander. In the latter case, dysbiosis would not be causative or influential on PD, but instead be an epiphenomenon. Experimental evidence supporting a functional role for gut microbes in impacting disease outcomes in PD is beginning to surface. In one study, eliminating microbial signals in ⍺Syn-overexpressing mice through either germ-free rederivation or microbial depletion with antibiotics decreased ⍺Syn amyloid deposition in the brain, neuroinflammation, and motor deficits. Antibiotic treatment has been shown to also dampen MPTP (1-methyl-4-phenyl-1,2,3,6-tetrahydropyridine) in toxin-induced models of PD by preventing ⍺Syn aggregation and dopaminergic cell death [21,22,23]. Similarly, experimental studies demonstrated the inhibitory effect of Doxycyclin in the development of α-synuclein-induced pathogenicity, which is in accord with our observation (Table 4) that tetracyclines might have an inhibitory effect on the development of Parkinson’s disease [24]. Similar microbial modulation of pathology has been observed in other models of amyloid disease. In two different mouse models of amyloid-β deposition, representing Alzheimer’s disease, the germ-free status of antibiotic treatment decreased amyloid-β pathology in relevant brain regions. It is exciting to consider the possibility of shared mechanisms of microbial influence within the gastrointestinal tract on the deposition of amyloid proteins in the brain that is central to neurodegenerative disease [25,26,27]. Analysis of the microbial community composition revealed that those animals displaying the most motor dysfunction (i.e., those with ⍺Syn-overexpression and receiving PD-derived microbes) harbored several changes to microbial taxa. These alterations may suggest the presence of microbes that exacerbate disease in the model, or instead, the absence of microbes that may dampen a disease state. It is worthy of consideration that E. coli produces an extracellular structure, termed curli, which takes on an amyloid form similar to pathogenic ⍺Syn [28]. Curli amyloids provide a mechanism of surface attachment, immune evasion, and defense against bacteriophages. This suggests that, rather than LPS signaling alone, the production of this bacterial amyloid could provide a specific signal from the GI tract that can impact PD-relevant physiologies in the brain. How curli may act to elicit these changes is largely unknown. Curli may act to stimulate inflammatory responses or, based on its structure, may have the potential to template the generation of ⍺Syn amyloids and directly drive PD pathology [29]. There also exists the possibility of beneficial interactions that are missing or decreased due to PD dysbiosis [30]. There may be microbes that produce molecules that dampen inflammation or inhibit the aggregation of ⍺Syn, ultimately preventing disease initiation or slowing its progression. There are many examples of beneficial microbes that are capable of specifically dampening inflammatory responses within the GI tract [31,32], as we have observed in the inhibitory effect of certain classes of antibiotics (Table 1, Table 2, Table 3 and Table 4, green filling color). In line with this, one experimental study of fecal microbial transplant (FMT) demonstrated that mice receiving a healthy microbial population were protected from dopaminergic neuron death following MPTP treatment [33]. While data demonstrating that persons with PD harbor a dysbiotic intestinal microbiome continue to accumulate, one pressing question is how the dysbiosis initially arises. Certainly, physiological changes such as constipation, which occurs early in PD, can shift the population of the gut microbiome [34,35]. Diet is also well established to shape the intestinal microbiome; however, links between diet and PD are tenuous [36]. Pharmaceutical interventions also affect the microbiome structure, but even with this confounding variable taken into account, dysbiosis during PD is still apparent [37]. The microbiome of persons with PD is indeed enriched for microbial genes that are involved in the metabolism of xenobiotics, suggesting that environmental exposures impact microbiome structure [38].
6. Conclusions
Our comparative analysis of antibiotic consumption patterns for the years 1997–2016 in 30 European countries and the PD database established for 2016 indicated a potential sequential role of different classes of antibiotics in the development of PD, possibly through the modification of gut flora, either augmenting (narrow-spectrum penicillin) or inhibiting (broad-spectrum antibiotics) the process. The augmenting effect of the narrow-spectrum penicillin was observed in every time segment of the compared databases of antibiotic consumption throughout the 20 years (1997–2016), but the effect of other antibiotic classes showing either augmenting or inhibiting properties occurred only in different time-segments. Countries with a high consumption rate of narrow-spectrum penicillin, showed a high prevalence increase of PD, and countries experiencing a reduction in PD prevalence between 1990–2016 showed three–six-fold lower consumption of narrow-spectrum penicillin. It could be hypothesized that penicillin augments the production of curli amyloid fibril or promotes the proliferation of curli-producing microbes and other antibiotic classes might act through the upregulation or down-regulation of the curli-producing capabilities of the gut flora influencing the pathological process, which leads to the development of PD. It might be suspected also that the altered microbiome produces less SCFA (short-chained fatty acids), as SCFA induces regulatory T (Treg) cells; a decrease in SCFA-producing bacteria may be a prerequisite for the development of PD. Similar observations had been reported in the literature [39,40,41]. Our observation indicated the possible role of antibiotic consumption in the development of PD and our results are further strengthened by the fact that countries with high consumption of narrow-spectrum penicillin experienced a higher prevalence increase of PD, while when others reducing or ceasing the consumption of narrow-spectrum penicillin experienced a reduction in the prevalence of PD in the previous 25 years. Further studies might elucidate the molecular background of this mechanism.
Limitations: The associations of PD’s prevalence with different classes of antibiotics could not be applied to individual cases.
Strength: Using large databases, our statistical results are convincing and in accord with other publications.
Author Contributions
G.T.: Writing the original draft, conceptualization, M.N.: Resources, M.R.: Methodology, G.M.: Formal analysis, and L.B.: Supervision. All authors have read and agreed to the published version of the manuscript.
Funding
This research received no external funding.
Institutional Review Board Statement
Not applicable.
Informed Consent Statement
Not applicable.
Data Availability Statement
Not applicable.
Conflicts of Interest
The authors declare no conflict of interest.
References
- GBD 2016 Parkinson’s Disease Collaborators. Global, regional, and national burden of Parkinson’s disease, 1990-2016: A systematic analysis for the Global Burden of Disease Study 2016. Lancet Neurol. 2018, 11, 939–953. [Google Scholar] [CrossRef]
- Pfeiffer, R.F. Gastrointestinal dysfunction in Parkinson’s disease. Parkinsonism Relat. Disorders 2011, 1, 10–15. [Google Scholar] [CrossRef] [PubMed]
- Postuma, R.B.; Gagnon, J.F.; Montplaisir, J. Clinical prediction of Parkinson’s disease: Planning for the age of neuroprotection. J. Neurol. Neurosurg. Psychiatry 2010, 9, 1008-13. [Google Scholar] [CrossRef]
- Perez-Pardo, P.; Kliest, T.; Dodiya, H.B.; Broersen, L.M.; Garssen, J.; Keshavarzian, A.; Kraneveld, A. The gut-brain axis in Parkinson’s disease: Possibilities for food-based therapies. Eur. J. Pharmacol. 2017, 817, 86–95. [Google Scholar] [CrossRef] [PubMed]
- Volpicelli-Daley, L.A.; Luk, K.C.; Patel, T.P.; Tanik, S.A.; Riddle, D.M.; Stieber, A.; Meaney, D.F.; Trojanowski, J.Q.; Lee, V.M. Exogenous α-synuclein fibrils induce Lewy body pathology leading to synaptic dysfunction and neuron death. Neuron 2011, 72, 57–71. [Google Scholar] [CrossRef]
- Henderson, M.X.; Trojanowski, J.Q.; Lee, V.M. α-Synuclein pathology in Parkinson’s disease and related α-synucleinopathies. Neurosci. Lett. 2019, 709, 134316. [Google Scholar] [CrossRef]
- Braak, H.; de Vos, R.A.; Bohl, J.; Del Tredici, K. Gastric alpha-synuclein immunoreactive inclusions in Meissner’s and Auerbach’s plexuses in cases staged for Parkinson’s disease-related brain pathology. Neurosci. Lett. 2006, 396, 67–72. [Google Scholar] [CrossRef]
- McGeer, P.L.; McGeer, E.G. The alpha-synuclein burden hypothesis of Parkinson’s disease and its relationship to Alzheimer’s disease. Exp. Neurol. 2008, 212, 235–238. [Google Scholar] [CrossRef]
- Wakabayashi, K.; Takahashi, H.; Takeda, S.; Ohama, E.; Ikuta, F. Lewy bodies in the enteric nervous system in Parkinson’s disease. Arch. Histol. Cytol. 1989, 52, 191–194. [Google Scholar] [CrossRef]
- Kalia, L.V.; Lang, A.E. Parkinson’s disease. Lancet 2015, 386, 896–912. [Google Scholar] [CrossRef]
- Cherian, A.; Divya, K.P. Genetics of Parkinson’s disease. Acta Neurol. Belg. 2020, 120, 1297–1305. [Google Scholar] [CrossRef] [PubMed]
- Brown-Jermyn, D.; Chen, J.-F.; Holmqvist, S.; Chutna, O.; Bousset, L.; Aldrin-Kirk, P.; Li, W.; Björklund, T.; Wang, Z.Y.; Roybon, L.; et al. Direct evidence of Parkinson’s pathology spread from the gastrointestinal tract to the brain in rats. Acta Neuropathol. 2014, 128, 805–820. [Google Scholar] [CrossRef]
- Braak, H.; Rüb, U.; Gai, W.P.; Del Tredici, K. Idiopathic Parkinson’s disease: Possible routes by which vulnerable neuronal types may be subject to neuroinvasion by an unknown pathogen. J. Neural Transm. 2003, 110, 517–536. [Google Scholar] [CrossRef]
- Del Tredici, K.; Braak, H. A not entirely benign procedure: Progression of Parkinson’s disease. Acta Neuropathol. 2008, 115, 379–384. [Google Scholar] [CrossRef] [PubMed]
- Killinger, B.A.; Madaj, Z.; Sikora, J.W.; Rey, N.; Haas, A.J.; Vepa, Y.; Lindqvist, D.; Chen, H.; Thomas, P.M.; Brundin, P.; et al. The vermiform appendix impacts the risk of developing Parkinson’s disease. Sci. Transl. Med. 2018, 10, eaar5280. [Google Scholar] [CrossRef] [PubMed]
- Liu, B.; Fang, F.; Pedersen, N.L.; Tillander, A.; Ludvigsson, J.F.; Ekbom, A.; Svenningsson, P.; Chen, H.; Wirdefeldt, K. Vagotomy and Parkinson disease: A Swedish register-based matched-cohort study. Neurology 2017, 88, 1996–2002. [Google Scholar] [CrossRef] [PubMed]
- Elfil, M.; Kamel, S.; Kandil, M.; Koo, B.B.; Schaefer, S.M. Implications of the Gut Microbiome in Parkinson’s Disease. Mov. Disord. 2020, 35, 921–933. [Google Scholar] [CrossRef]
- Romano, S.; Savva, G.M.; Bedarf, J.R.; Charles, I.G.; Hildebrand, F.; Narbad, A. Meta-analysis of the Parkinson’s disease gut microbiome suggests alterations linked to intestinal inflammation. NPJ Parkinsons Dis. 2021, 7, 27. [Google Scholar] [CrossRef]
- Cryan, J.F.; O’Riordan, K.J.; Sandhu, K.; Peterson, V.; Dinan, T.G. The gut microbiome in neurological disorders. Lancet Neurol. 2020, 19, 179–194. [Google Scholar] [CrossRef]
- Sampson, T. The impact of indigenous microbes on Parkinson’s disease. Neurobiol. Dis. 2020, 135, 104426. [Google Scholar] [CrossRef]
- Bisht, R.; Kaur, B.; Gupta, H.; Prakash, A. Ceftriaxone mediated rescue of nigral oxidative damage and motor deficits in MPTP model of Parkinson’s disease in rats. Neurotoxicology 2014, 44, 71–79. [Google Scholar] [CrossRef]
- Du, Y.; Ma, Z.; Lin, S.; Dodel, R.C.; Gao, F.; Bales, K.R.; Triarhou, L.C.; Chernet, E.; Perry, K.W.; Nelson, D.L.; et al. Minocycline prevents nigrostriatal dopaminergic neurodegeneration in the MPTP model of Parkinson’s disease. Proc. Natl. Acad. Sci. USA 2001, 98, 14669–14674. [Google Scholar] [CrossRef] [PubMed]
- Kaur, B.; Prakash, A. Ceftriaxone attenuates glutamate-mediated neuro-inflammation and restores BDNF in MPTP model of Parkinson’s disease in rats. Pathophysiology 2017, 24, 71–79. [Google Scholar] [CrossRef] [PubMed]
- Dominguez-Meijide, A.; Parrales, V.; Vasili, E.; González-Lizárraga, F.; König, A.; Lázaro, D.F.; Lannuzel, A.; Haik, S.; Del Bel, E.; Chehín, R.; et al. Doxycycline inhibits α-synuclein-associated pathologies in vitro and in vivo. Neurobiol. Dis. 2021, 151, 105256. [Google Scholar] [CrossRef] [PubMed]
- Labrie, V.; Brundin, P. Alpha-Synuclein to the Rescue: Immune Cell Recruitment by Alpha-Synuclein during Gastrointestinal Infection. J. Innate Immun. 2017, 9, 437–440. [Google Scholar] [CrossRef] [PubMed]
- Stolzenberg, E.; Berry, D.; Yang, D.; Lee, E.Y.; Kroemer, A.; Kaufman, S.; Wong, G.C.L.; Oppenheim, J.J.; Sen, S.; Fishbein, T.; et al. A Role for Neuronal Alpha-Synuclein in Gastrointestinal Immunity. J. Innate Immun. 2017, 9, 456–463. [Google Scholar] [CrossRef] [PubMed]
- Minter, M.R.; Hinterleitner, R.; Meisel, M.; Zhang, C.; Leone, V.; Zhang, X.; Oyler-Castrillo, P.; Zhang, X.; Musch, M.W.; Shen, X.; et al. Antibiotic-induced perturbations in microbial diversity during post-natal development alter amyloid pathology in an aged APPSWE/PS1ΔE9 murine model of Alzheimer’s disease. Sci. Rep. 2017, 7, 10411. [Google Scholar] [CrossRef]
- Tursi, S.A.; Tükel, Ç. Curli-Containing Enteric Biofilms Inside and Out: Matrix Composition, Immune Recognition, and Disease Implications. Microbiol. Mol. Biol. Rev. 2018, 82, e00028-18. [Google Scholar] [CrossRef]
- Ellermann, M.; Sartor, R.B. Intestinal bacterial biofilms modulate mucosal immune responses. J. Immunol. Sci. 2018, 2, 13–18. [Google Scholar]
- Hufnagel, D.A.; Tükel, C.; Chapman, M.R. Disease to dirt: The biology of microbial amyloids. PLoS Pathog. 2013, 9, e1003740. [Google Scholar] [CrossRef]
- Vidakovic, L.; Singh, P.K.; Hartmann, R.; Nadell, C.D.; Drescher, K. Dynamic biofilm architecture confers individual and collective mechanisms of viral protection. Nat. Microbiol. 2018, 3, 26–31. [Google Scholar] [CrossRef] [PubMed]
- Zheng, D.; Liwinski, T.; Elinav, E. Interaction between microbiota and immunity in health and disease. Cell Res. 2020, 30, 492–506. [Google Scholar] [CrossRef] [PubMed]
- Sun, M.F.; Zhu, Y.L.; Zhou, Z.L.; Jia, X.B.; Xu, Y.D.; Yang, Q.; Cui, C.; Shen, Y.Q. Neuroprotective effects of fecal microbiota transplantation on MPTP-induced Parkinson’s disease mice: Gut microbiota, glial reaction and TLR4/TNF-α signaling pathway. Brain Behav. Immun. 2018, 70, 48–60. [Google Scholar] [CrossRef] [PubMed]
- Chung, H.; Kasper, D.L. Microbiota-stimulated immune mechanisms to maintain gut homeostasis. Curr. Opin. Immunol. 2010, 22, 455–460. [Google Scholar] [CrossRef] [PubMed]
- Zhao, Y.; Yu, Y.B. Intestinal microbiota and chronic constipation. Springerplus 2016, 5, 1130. [Google Scholar] [CrossRef]
- Erro, R.; Brigo, F.; Tamburin, S.; Zamboni, M.; Antonini, A.; Tinazzi, M. Nutritional habits, risk, and progression of Parkinson disease. J. Neurol. 2018, 265, 12–23. [Google Scholar] [CrossRef]
- Bedarf, J.R.; Hildebrand, F.; Coelho, L.P.; Sunagawa, S.; Bahram, M.; Goeser, F.; Bork, P.; Wüllner, U. Functional implications of microbial and viral gut metagenome changes in early stage L-DOPA-naïve Parkinson’s disease patients. Genome Med. 2017, 9, 39. [Google Scholar] [CrossRef]
- Sampson, T.R.; Debelius, J.W.; Thron, T.; Janssen, S.; Shastri, G.G.; Ilhan, Z.E.; Challis, C.; Schretter, C.E.; Rocha, S.; Gradinaru, V.; et al. Gut Microbiota Regulate Motor Deficits and Neuroinflammation in a Model of Parkinson’s Disease. Cell 2016, 167, 1469–1480.e12. [Google Scholar] [CrossRef]
- Mertsalmi, T.H.; Pekkonen, E.; Scheperjans, F. Antibiotic exposure and risk of Parkinson’s disease in Finland: A nationwide case-control study. Mov. Disord. 2020, 35, 431–442. [Google Scholar] [CrossRef]
- Nishiwaki, H.; Hamaguchi, T.; Ito, M.; Ishida, T.; Maeda, T.; Kashihara, K.; Tsuboi, Y.; Ueyama, J.; Shimamura, T.; Mori, H.; et al. Short-Chain Fatty Acid-Producing Gut Microbiota Is Decreased in Parkinson’s Disease but Not in Rapid-Eye-Movement Sleep Behavior Disorder. mSystems 2020, 5, e00797-20. [Google Scholar] [CrossRef]
- Ternák, G.; Kuti, D.; Kovács, K.J. Dysbiosis in Parkinson’s disease might be triggered by certain antibiotics. Med. Hypotheses 2020, 137, 109564. [Google Scholar] [CrossRef] [PubMed]
Publisher’s Note: MDPI stays neutral with regard to jurisdictional claims in published maps and institutional affiliations. |
© 2022 by the authors. Licensee MDPI, Basel, Switzerland. This article is an open access article distributed under the terms and conditions of the Creative Commons Attribution (CC BY) license (https://creativecommons.org/licenses/by/4.0/).