
Clinical Implication of the Relationship between Antimicrobial Resistance and Infection Control Activities in Japanese Hospitals: A Principal Component Analysis-Based Cluster Analysis

 , ,
, ,
Abstract
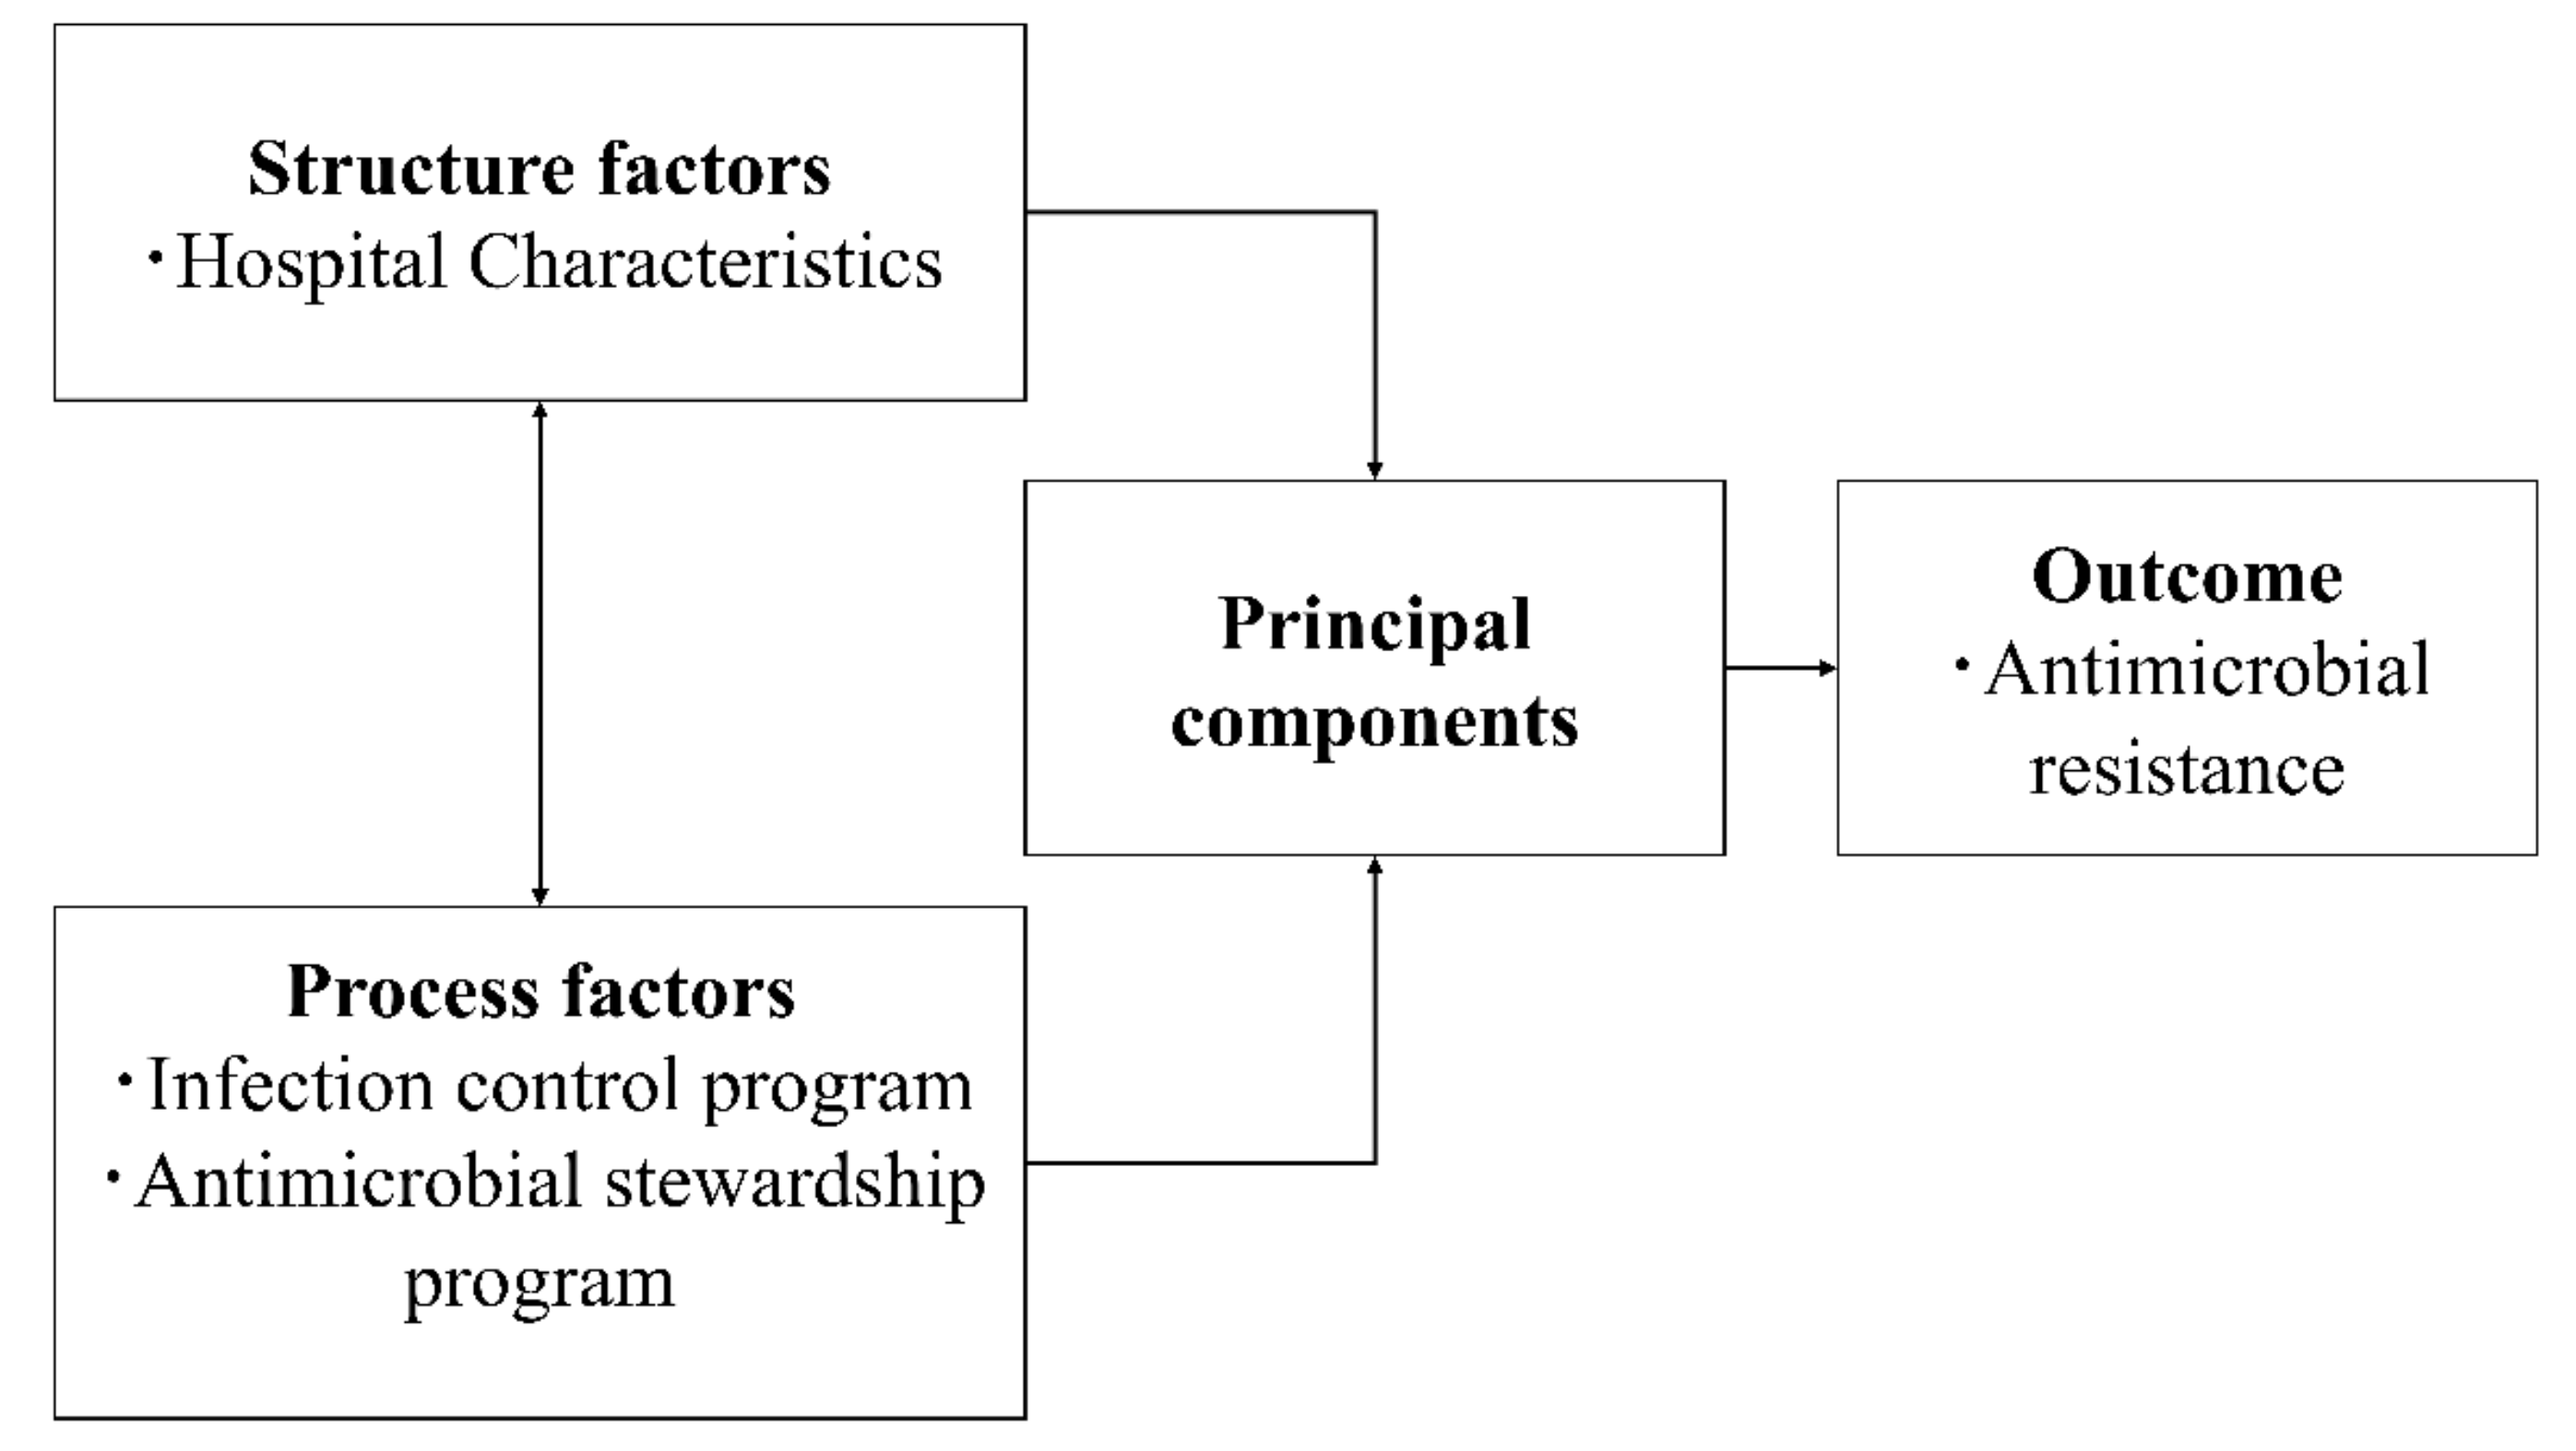
1. Introduction
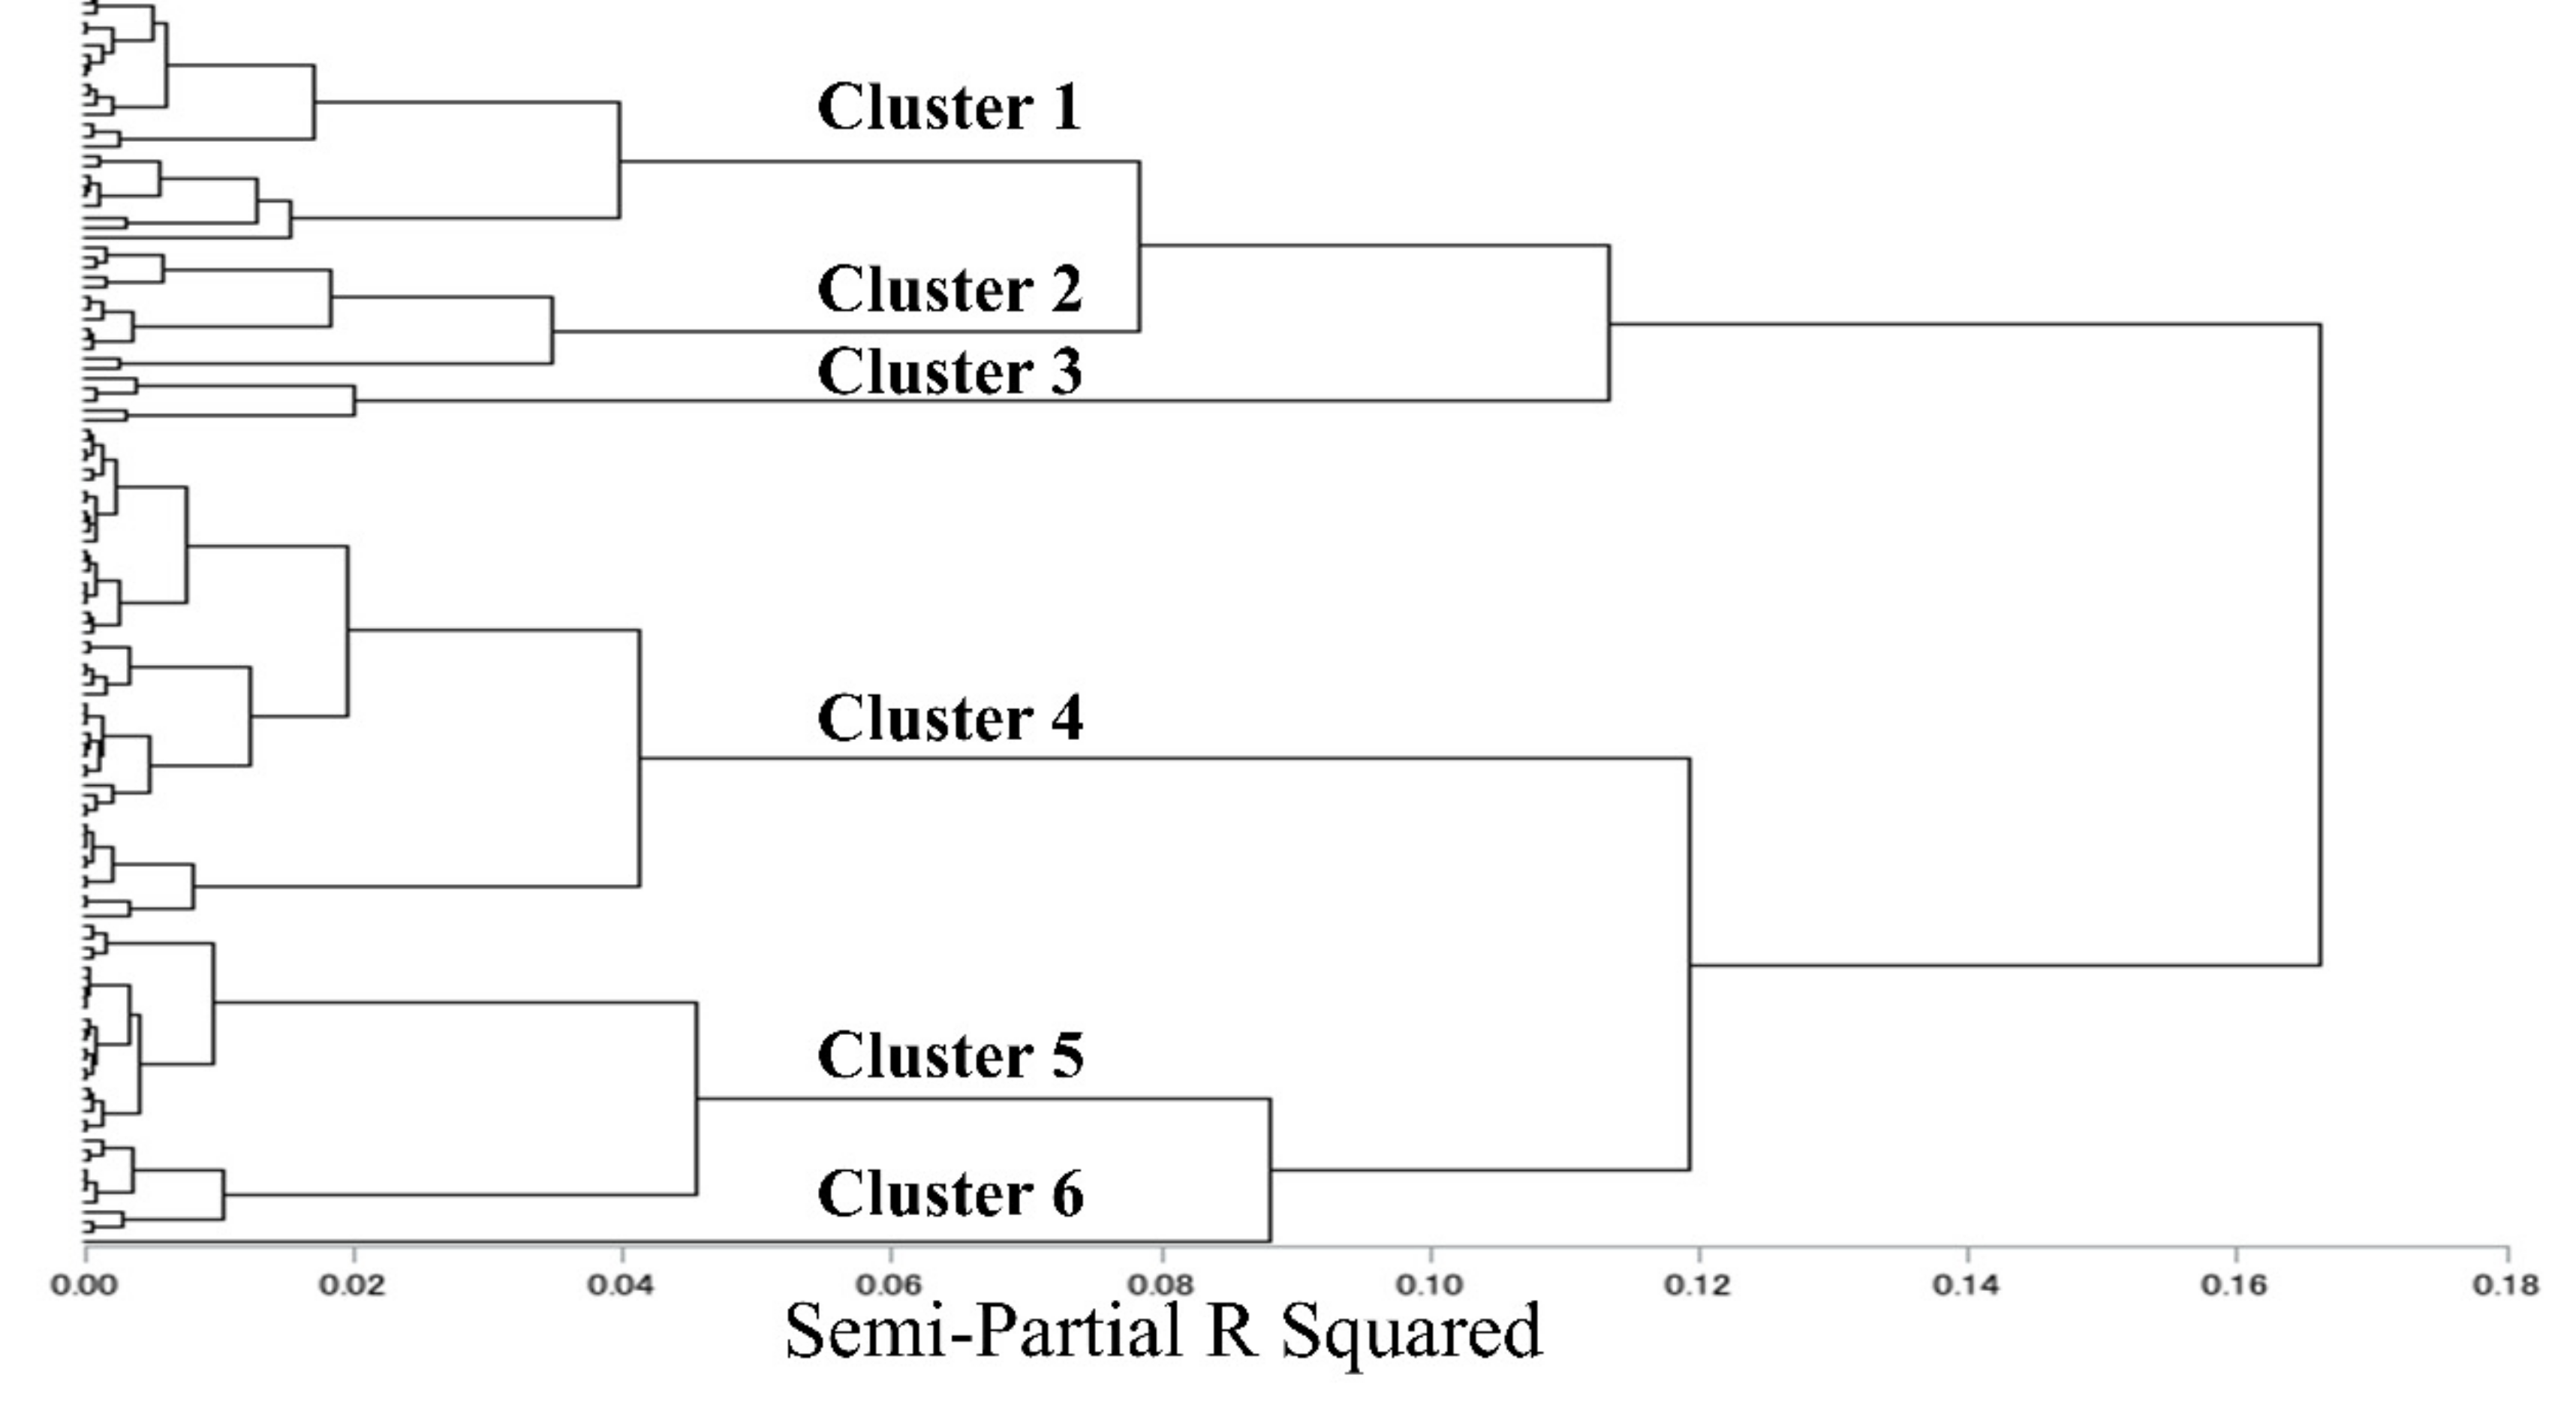
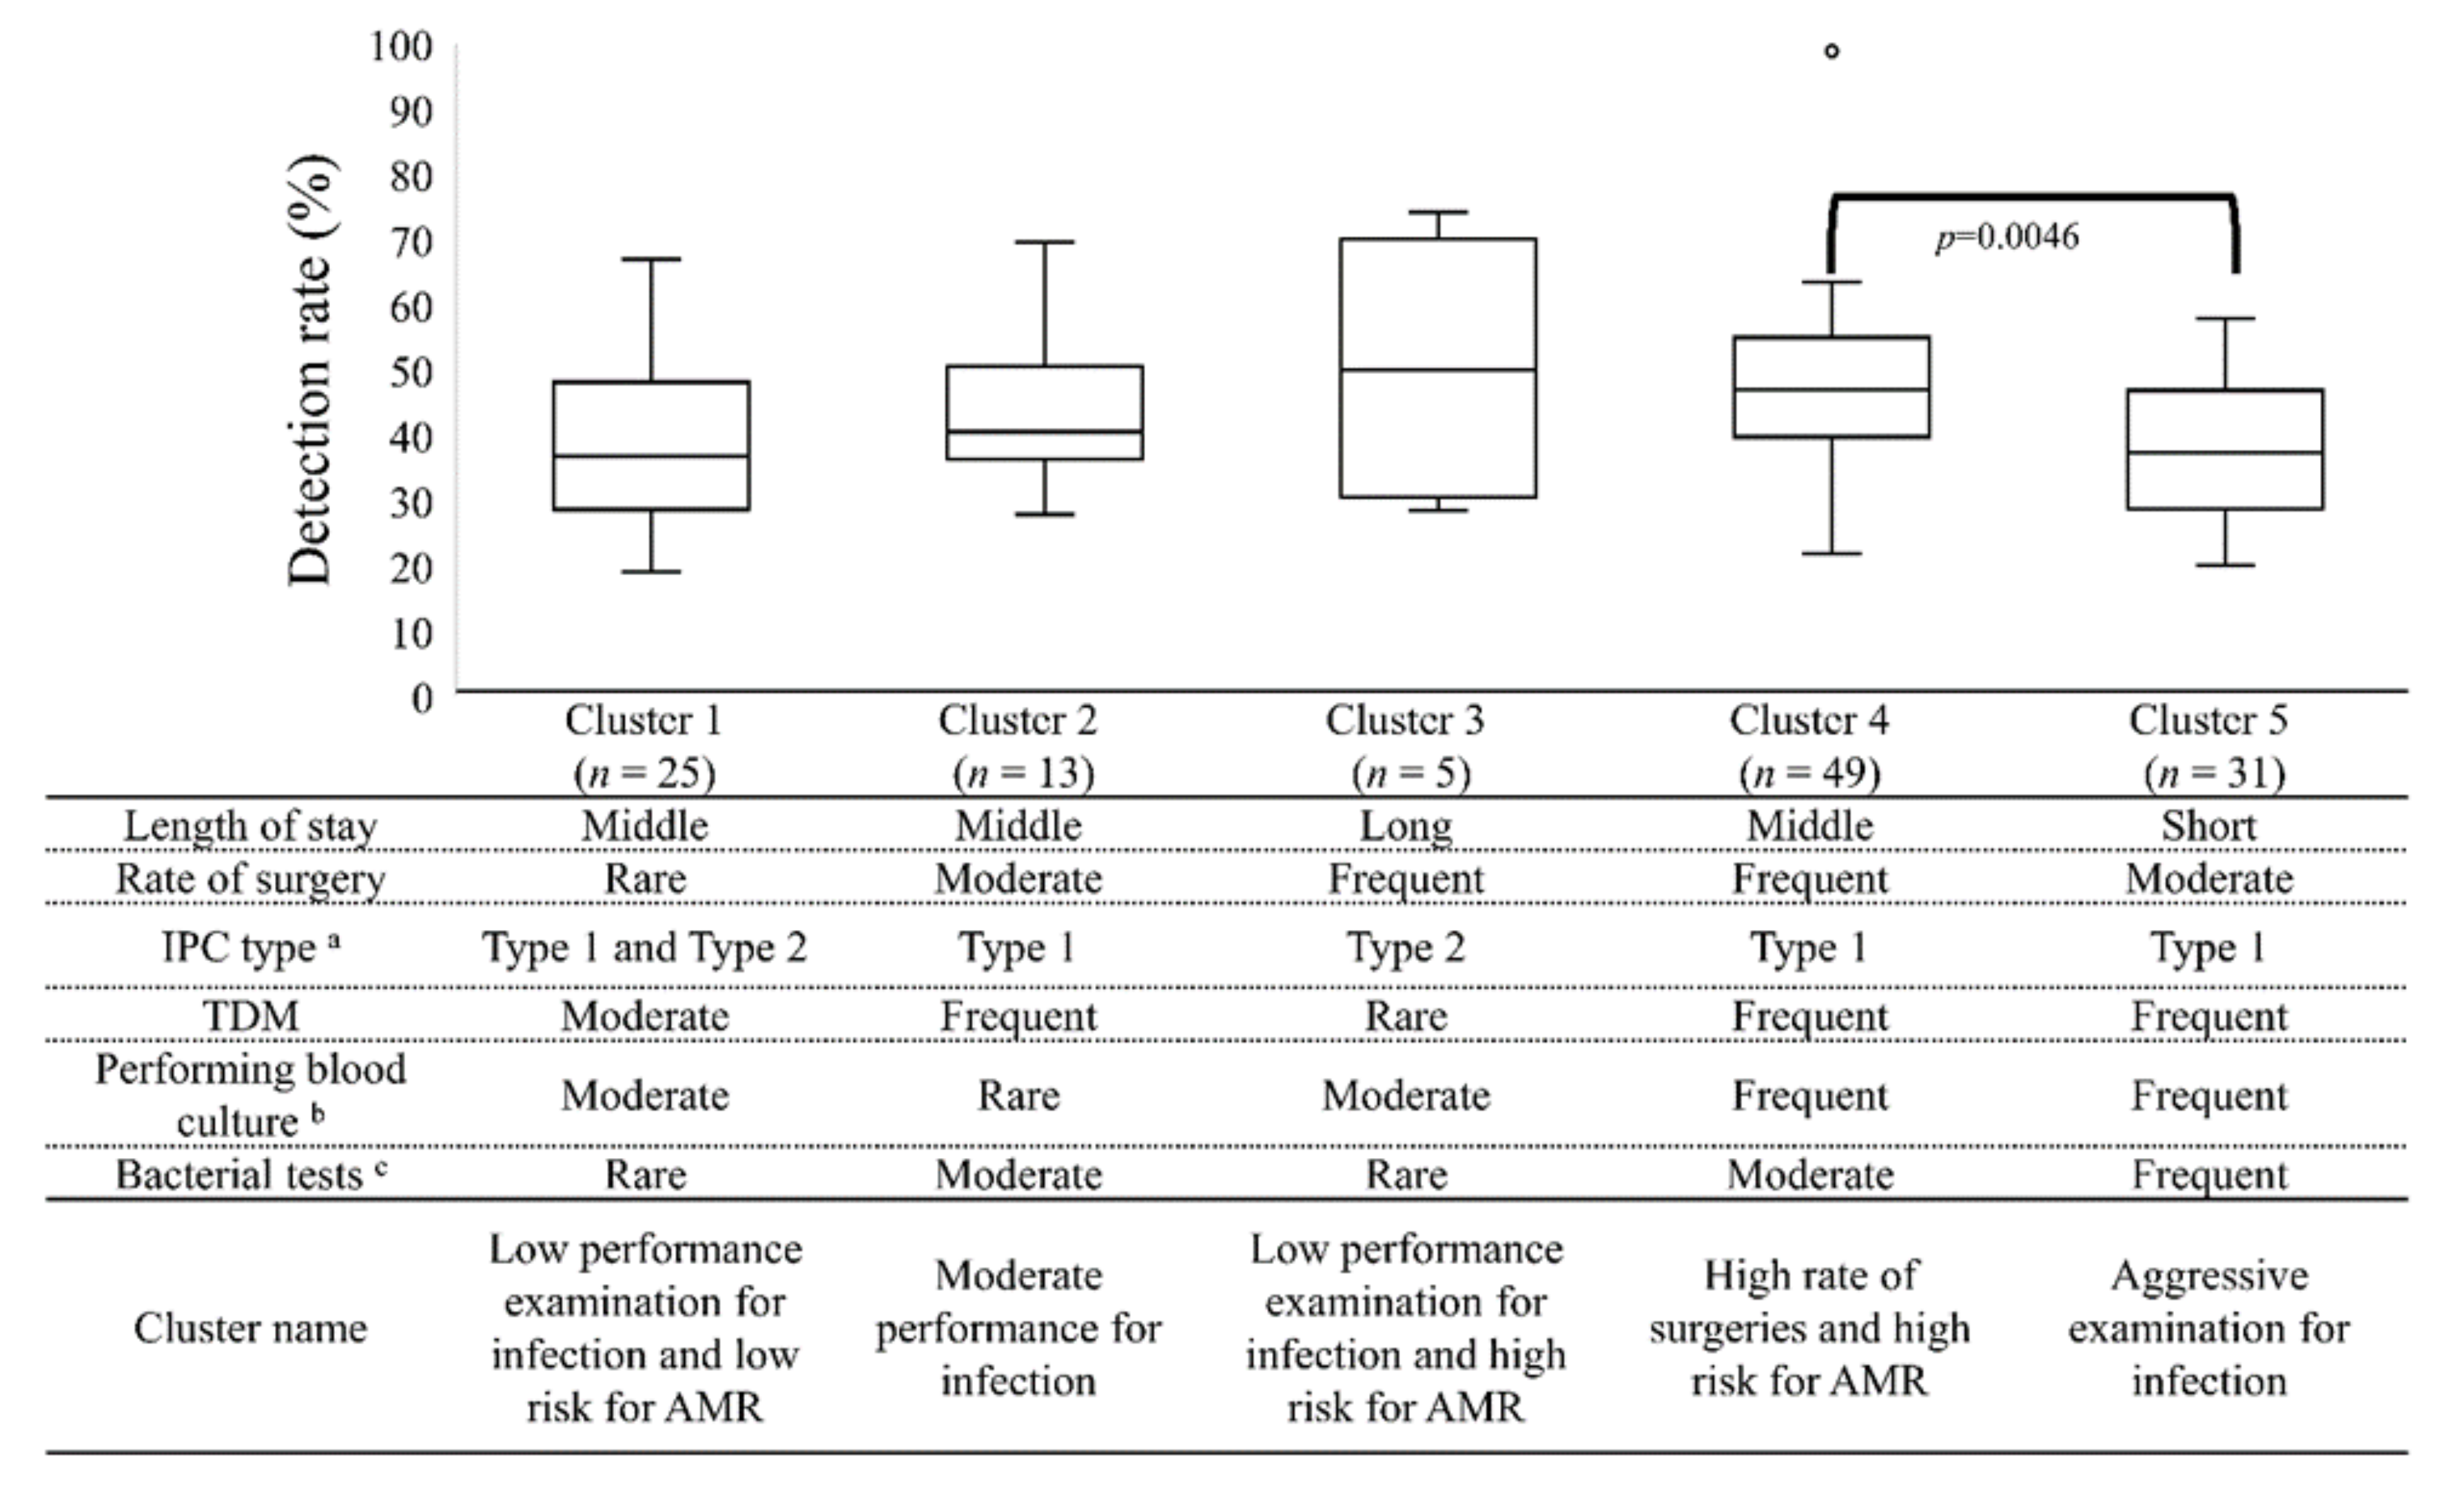
2. Results
3. Discussion
4. Materials and Methods
4.1. Data Source
4.2. Study Inclusion and Exclusion Criteria
4.3. Variable Definitions and Facility Categories
4.4. Principal Component Analysis and Cluster Analysis
4.5. Statistical Analyses
5. Conclusions
Author Contributions
Funding
Institutional Review Board Statement
Informed Consent Statement
Data Availability Statement
Conflicts of Interest
Appendix A

| Eigenvalue | % of Variance | Eigenvector | |
|---|---|---|---|
| Principal component 1: “Bacterial tests” | 2.49 | 24.9 | |
| Number of bacterial tests | 0.52 | ||
| Blood culture collected prior to broad spectrum antibiotic therapy | 0.49 | ||
| Number of CD detected test | 0.42 | ||
| Principal component2: “Operations” | 1.47 | 14.8 | |
| Rate of surgeries | 0.53 | ||
| Region | −0.58 | ||
| Average length of stay | 0.44 | ||
| Principal component 3: “Ability of ICT” | 1.29 | 12.9 | |
| TDM implementation rate for vancomycin | 0.41 | ||
| Medical fee for IPC type 1 | 0.60 | ||
| Contamination of blood cultures | −0.4 | ||
| Principal component 4: “Skill in performing blood cultures” | 1.08 | 10.8 | |
| Multiple sets of blood culture | −0.7 | ||
| Contamination of blood cultures | 0.51 |
| Cluster 1 (n = 25) | Cluster 2 (n = 13) | Cluster 3 (n = 5) | Cluster 4 (n = 49) | Cluster 5 (n = 31) | Overall p-Value g | |
|---|---|---|---|---|---|---|
| Structure factors | ||||||
| Number of beds (beds) | 269 (190–490) | 275 (218–559) | 106 (100–163) e | 304 (210–377) e | 466 (337–505) c,d | 0.0002 |
| Number of patients admissions per year (patients) | 6303 (4291–11901) | 5789 (3952–12,996) c | 2587 (1919–2962) b,d,e | 6184 (4429–9231) c | 11,046 (8988–13,612) c,d | <0.001 |
| Average length of stay (days) | 12.5 (11.2–13.4) | 13.4 (10.7–14.8) | 14.9 (13.2–20.4) e | 13.2 (11.7–15) e | 10.9 (9.9–11.8) c,d | <0.001 |
| Rate of surgeries (%) f | 22.1 ± 4.8 d | 25.3 ± 4.7 | 29.1 ± 6.3 | 29.3 ± 5.4 a,e | 25.3 ± 3.7 d | 0.0055 g |
| ICU patient admissions (%) | 3.0 (0–9.5) | 0 (0–5.5) | 0 (0–0) | 0 (0–4.6) | 3.7 (0–4.9) | 0.0365 |
| CVC use patients (%) | 6.1 (4.7–9.6) | 8.0 (5.0–9.7) c | 3.1 (1.7–4.7) b,e | 5.6 (3.9–8.0) | 6.4 (4.7–8.1) c | 0.0159 |
| UC use patients (%) | 13.3 (9.2–18.7) | 12.3 (9.4–14.4) | 14.2 (11.2–21.6) | 12.1 (9.8–13.4) | 12.0 (8.6–15.1) | 0.3219 |
| Region (East Japan: %) | 92.0 | 84.6 | 0 | 36.7 | 70.9 | |
| Medical fee for IPC type 1 (%) | 84.0 | 100 | 0 | 100 | 100 | |
| Teaching Hospital (%) | 76.0 | 92.3 | 60.0 | 87.8 | 96.7 | |
| 7:1 hospital charge index (%) | 92.0 | 100 | 100 | 94.0 | 100 | |
| Pharmaceutical service (%) | 64.0 | 76.9 | 40.0 | 65.3 | 64.5 | |
| Process factors | ||||||
| TDM implementation rate for vancomycin (%) | 64.3 (40.3–73.0) b,d,e | 82.1 (60.5–86.8) a | 9.7 (4.9–61.5) d,e | 80.0 (71.4–87.3) a,c | 80.8 (76.3–88.7) a,c | <0.001 |
| Multiple sets of blood cultures (%) | 80.6 (66.5–86.5) b | 46.3 (13.7–51.5) a,c,d,e | 78.0 (74.5–88.5) b | 82.3 (75.2–87.3) b | 85.0 (74.0–92.4) b | <0.001 |
| Contamination of blood cultures (%) | 4.0 (2.5–4.9) | 4.1 (1.3–9.2) | 3.5 (2.6–5.3) | 3.0 (1.8–4.2) | 2.4 (1.9–3.7) | 0.0988 |
| Number of CD detected test (/1000 bed-days) | 3.8 (1.5–5.1) | 3.7 (2.5–4.9) | 4.4 (1.6–8.2) | 3.8 (2.5–4.6) e | 5.4 (4–6.1) d | 0.0114 |
| Blood culture collected prior to broad spectrum antibiotic therapy (%) | 40.6 (34.8–53.6) d,e | 60.9 (37.7–74.8) | 30.1 (21.4–45.1) e | 59.2 (41.8–64.6) a,e | 72.3 (66.3–79.6) a,c,d | <0.001 |
| Specimens for culture prior to broad spectrum antibiotic therapy (%) | 72.8 (63.4–80.4) d,e | 87.3 (72.3–90.2) | 63.0 (43.9–68.4) e | 81.8 (74.6–85.7) a,e | 85.9 (83.5–92.3) a,c,d | <0.001 |
| Number of bacterial tests (/100 bed-days) | 6.8 (5.6–9.4) e | 10.3 (7.2–11.1) e | 6.7 (2.4–9.3) e | 8.5 (6.5–10.5) e | 14.6 (11.6–19.0) a,b,c,d | <0.001 |
| AUD of antibiotic injection (/100 bed-days) | 15.4 (12.1–17.4) e | 18.3 (14.1–20.2) | 12.8 (10.5–16.7) | 14.5 (11.1–16.0) e | 19.1 (17.2–21.9) a,d | <0.001 |
| DOT of antibiotic injection (/100 bed-days) | 25.6 (21.7–28.4) e | 28.3 (26.1–31.4) d | 24.9 (16.7–26.3) | 23.5 (19.6–26.8) b,e | 30.1 (26.6–32.3) a,d | <0.001 |
| Name | Units | Definition |
|---|---|---|
| Structure factors | ||
| Number of beds | Beds | Number of hospital beds |
| Number of admissions patients per year | Patients | |
| Average length of stay | Days | |
| Rate of surgeries | % | Number of JANIS SSI surveillance/Number of all surgeries × 100 |
| ICU admission patients | % | ICU admission patients/Number of admission patients per year |
| CVC patients | % | Number of Central Venous Catheter used patients/Number of admission patients per year × 100 |
| UC patients | % | Number of urinary Catheter used patients/Number of admission patients per year × 100 |
| Region | % | West Japan = 0, East Japan = 1 |
| Medical fee for IPC type 1 | % | Medical fee for IPC type 2 = 0, Medical fee for IPC type 1 = 1 |
| Teaching Hospital | % | Non-Teaching Hospital = 0, Teaching Hospital = 1 |
| 7:1 hospital charge index | % | 10:1 hospital charge index = 0, 7:1 hospital charge index = 1 |
| Pharmaceutical service | % | Non-Pharmaceutical service = 0, Pharmaceutical service = 1 |
| Process factors | ||
| TDM implementation rate for vancomycin | % | TDM performed patients in denominator/Patient treatment duration >3 days for vancomycin |
| Multiple sets of blood culture | % | Number of patients in whom multiple blood cultures were taken/Total number of patients who blood cultures were taken |
| Contamination of blood cultures | % | Number of contaminated cultures/Number of patients in whom multiple blood cultures were taken |
| Number of CD detected tests | /1000 bed-days | Number of CD detected tests/length of hospital stay for inpatients × 1000 |
| Blood culture collected prior to broad spectrum antibiotic therapy | % | Before starting broad spectrum systemic antibiotic therapy in hospitalized adults with at least one blood culture/Admitted broad spectrum systemic antibiotic therapy |
| Specimens for culture prior to broad spectrum antibiotic therapy | % | Before starting broad spectrum systemic antibiotic therapy in hospitalized adults with bacterial culture/Admitted broad spectrum systemic antibiotic therapy |
| Number of bacterial tests | /100 bed-days | Number of bacterial tests/length of hospital stay for inpatients × 100 |
| AUD of antibiotic injection | /100 bed-days | Antimicrobial consumptions (g)/(DDD a × length of hospital stay for inpatients) × 100 |
| DOT of antibiotic injection | /100 bed-days | DOT/length of hospital stay for inpatients × 100 |
| Antimicrobial resistance | ||
| MRSA/S. aureus detection rate | % | MRSA detected patients/Number of MRSA + MSSA detected patients × 100 |
References
- The Government of Japan. National Action Plan on Antimicrobial Resistance (AMR), 2016–2020. Available online: http://www.mhlw.go.jp/file/06-Seisakujouhou-10900000-Kenkoukyoku/0000138942.pdf (accessed on 28 November 2021).
- Japan Nosocomial Infections Surveillance, Ministry of Health, Labour and Welfare. JANIS Open Report. Available online: https://janis.mhlw.go.jp/english/report/index.html (accessed on 28 November 2021).
- Gu, Y.; Fujitomo, Y.; Ohmagari, N. Outcomes and Future Prospect of Japan’s National Action Plan on Antimicrobial Resistance (2016–2020). Antibiotics 2021, 10, 1293. [Google Scholar] [CrossRef] [PubMed]
- Chou, A.F.; Yano, E.M.; McCoy, K.D.; Willis, D.R.; Doebbeling, B.N. Structural and process factors affecting the implementation of antimicrobial resistance prevention and control strategies in U.S. hospitals. Health Care Manag. Rev. 2008, 33, 308–322. [Google Scholar] [CrossRef] [PubMed]
- Arcenillas, P.; Boix-Palop, L.; Gómez, L.; Xercavins, M.; March, P.; Martinez, L.; Riera, M.; Madridejos, R.; Badia, C.; Nicolás, J.; et al. Assessment of Quality Indicators for Appropriate Antibiotic Use. Antimicrob. Agents Chemother. 2018, 62, e00875-18. [Google Scholar] [CrossRef] [PubMed]
- National Center for Global Health and Medicine. The Japan Surveillance for Infection Prevention and Healthcare Epidemiology System (J-SIPHE). Available online: https://j-siphe.ncgm.go.jp/ (accessed on 28 November 2021).
- Brotherton, A.L. Metrics of Antimicrobial Stewardship Programs. Med. Clin. N. Am. 2018, 102, 965–976. [Google Scholar] [CrossRef]
- Morikane, K. Infection Control in Healthcare Settings in Japan. J. Epidemiol. 2012, 22, 86–90. [Google Scholar] [CrossRef]
- Maeda, M.; Muraki, Y.; Kosaka, T.; Yamada, T.; Aoki, Y.; Kaku, M.; Kawaguchi, T.; Seki, M.; Tanabe, Y.; Fujita, N.; et al. The first nationwide survey of antimicrobial stewardship programs conducted by the Japanese Society of Chemotherapy. J. Infect. Chemother. 2019, 25, 83–88. [Google Scholar] [CrossRef]
- Maeda, M.; Muraki, Y.; Kosaka, T.; Yamada, T.; Aoki, Y.; Kaku, M.; Seki, M.; Tanabe, Y.; Fujita, N.; Niki, Y.; et al. Impact of health policy on structural requisites for antimicrobial stewardship: A nationwide survey conducted in Japanese hospitals after enforcing the revised reimbursement system for antimicrobial stewardship programs. J. Infect. Chemother. 2021, 27, 1–6. [Google Scholar] [CrossRef]
- Maezawa, T.T.K.; Kuroda, Y.; Hori, S.; Kizu, J. Changes in infection control in medical facilities after the revision of medical fees. Jpn. J. Infect. Prev. Control 2014, 29, 429–436. [Google Scholar] [CrossRef][Green Version]
- Kobayashi, Y.Y.Y.; Yamada, M.; Asai, M.; Oda, H.; Ikuta, K. Changes in the cost of items for infection control and the MRSA infection incidence density rate in before and after “Additional Reimbursement for Infection Prevention 1”. Jpn. J. Infect. Prev. Control 2016, 31, 370–377. [Google Scholar] [CrossRef]
- Donabedian, A. Evaluating the quality of medical care. 1966. Milbank Q. 2005, 83, 691–729. [Google Scholar] [CrossRef]
- Izenman, A.J. Modern Multivariate Statistical Techniques: Regression, Classification, and Manifold Learning; Springer: New York, NY, USA, 2008. [Google Scholar]
- Burgel, P.-R.; Paillasseur, J.-L.; Caillaud, D.; Tillie-Leblond, I.; Chanez, P.; Escamilla, R.; Court-Fortune, I.; Perez, T.; Carré, P.; Roche, N. Clinical COPD phenotypes: A novel approach using principal component and cluster analyses. Eur. Respir. J. 2010, 36, 531–539. [Google Scholar] [CrossRef] [PubMed]
- Zhu, H.; Wu, C.; Jiang, N.; Wang, Y.; Zhao, J.; Xu, D.; Wang, Q.; Li, M.; Zeng, X. Identification of 6 dermatomyositis subgroups using principal component analysis-based cluster analysis. Int. J. Rheum. Dis. 2019, 22, 1383–1392. [Google Scholar] [CrossRef] [PubMed]
- Ahmad, T.; Desai, N.; Wilson, F.; Schulte, P.; Dunning, A.; Jacoby, D.; Allen, L.; Fiuzat, M.; Rogers, J.; Felker, G.M.; et al. Clinical Implications of Cluster Analysis-Based Classification of Acute Decompensated Heart Failure and Correlation with Bedside Hemodynamic Profiles. PLoS ONE 2016, 11, e0145881. [Google Scholar] [CrossRef] [PubMed]
- Vavougios, G.D.; George, D.G.; Pastaka, C.; Zarogiannis, S.G.; Gourgoulianis, K.I. Phenotypes of comorbidity in OSAS patients: Combining categorical principal component analysis with cluster analysis. J. Sleep Res. 2016, 25, 31–38. [Google Scholar] [CrossRef]
- Rhodes, A.; Evans, L.E.; Alhazzani, W.; Levy, M.M.; Antonelli, M.; Ferrer, R.; Kumar, A.; Sevransky, J.E.; Sprung, C.L.; Nunnally, M.E.; et al. Surviving Sepsis Campaign: International Guidelines for Management of Sepsis and Septic Shock: 2016. Crit. Care Med. 2017, 45, 486–552. [Google Scholar] [CrossRef]
- Hidron, A.I.; Edwards, J.R.; Patel, J.; Horan, T.C.; Sievert, D.M.; Pollock, D.A.; Fridkin, S.K. NHSN annual update: Antimicrobial-resistant pathogens associated with healthcare-associated infections: Annual summary of data reported to the National Healthcare Safety Network at the Centers for Disease Control and Prevention, 2006–2007. Infect. Control Hosp. Epidemiol. 2008, 29, 996–1011. [Google Scholar] [CrossRef]
- Shigemura, K.; Osawa, K.; Mukai, A.; Ohji, G.; Lee, J.J.; Yoshida, H.; Fujisawa, M.; Arakawa, S. Infection control team activity and recent antibiograms in the Kobe University Hospital. J. Antibiot. (Tokyo) 2013, 66, 511–516. [Google Scholar] [CrossRef][Green Version]
- Mitsuboshi, S.; Tsugita, M. Impact of alcohol-based hand sanitizers, antibiotic consumption, and other measures on detection rates of antibiotic-resistant bacteria in rural Japanese hospitals. J. Infect. Chemother. 2019, 25, 225–228. [Google Scholar] [CrossRef]
- Pittet, D.; Hugonnet, S.; Harbarth, S.; Mourouga, P.; Sauvan, V.; Touveneau, S.; Perneger, T.V. Effectiveness of a hospital-wide programme to improve compliance with hand hygiene. Infection Control Programme. Lancet 2000, 356, 1307–1312. [Google Scholar] [CrossRef]
- Uematsu, H.; Yamashita, K.; Kunisawa, S.; Fushimi, K.; Imanaka, Y. Estimating the disease burden of methicillin-resistant Staphylococcus aureus in Japan: Retrospective database study of Japanese hospitals. PLoS ONE 2017, 12, e0179767. [Google Scholar] [CrossRef]
- Tanaka, S.; Seto, K.; Kawakami, K. Pharmacoepidemiology in Japan: Medical databases and research achievements. J. Pharm. Health Care Sci. 2015, 1, 16. [Google Scholar] [CrossRef] [PubMed]
- Tsutsui, A.; Suzuki, S. Japan nosocomial infections surveillance (JANIS): A model of sustainable national antimicrobial resistance surveillance based on hospital diagnostic microbiology laboratories. BMC Health Serv. Res. 2018, 18, 799. [Google Scholar] [CrossRef] [PubMed]
- Mimura, W.; Fukuda, H.; Akazawa, M. Antimicrobial utilization and antimicrobial resistance in patients with haematological malignancies in Japan: A multi-centre cross-sectional study. Ann. Clin. Microbiol. Antimicrob. 2020, 19, 7. [Google Scholar] [CrossRef] [PubMed]
- Valletta, J.J.; Torney, C.; Kings, M.; Thornton, A.; Madden, J. Applications of machine learning in animal behaviour studies. Anim. Behav. 2017, 124, 203–220. [Google Scholar] [CrossRef]
- Kuroda, M.; Masaya, I.; Yuichi, M.; Sakakihara, M. Principal components based on a subset of qualitative variables and its accelerated computational algorithm. In Proceedings of the ISI 58th World Statistics Congress of the International Statistical Institute, Dublin, Ireland, 21–26 August 2011. [Google Scholar]
- Der, G.; Everitt, B.S. A Handbook of Statistical Analyses Using SAS, 3rd ed.; Chapman & Hall/CRC: New York, NY, USA, 2008; pp. 295–317. [Google Scholar]
- Ward, J.H. Hierarchical Grouping to Optimize an Objective Function. J. Am. Stat. Assoc. 1963, 58, 236–244. [Google Scholar] [CrossRef]


| Characteristics | Hospital Baseline (n = 124) |
|---|---|
| Structure factors | |
| Number of beds (beds) a | 330 (223–478) |
| Number of patients admissions per year (patients) a | 7099 (4576–11284) |
| Average length of stay (days) | 12.4 (11.1–14.1) |
| Rate of surgeries (%) b | 26.5 (5.6) |
| ICU patient admissions (%) a | 0.3 (0–4.9) |
| CVC use patients (%) a | 6.0 (4.6–8.5) |
| UC use patients (%) a | 12.2 (9.4–15.1) |
| Region (East Japan: %) | 59.7 |
| Medical fee for IPC type 1 (%) | 92.7 |
| Teaching Hospital (%) a | 87.1 |
| 7:1 hospital charge index (%) a | 96.0 |
| Pharmaceutical service (%) a | 65.3 |
| Process factors | |
| TDM implementation rate for vancomycin (%) | 79.2 (67.0–84.9) |
| Multiple sets of blood cultures (%) | 81.1 (68.7–88.5) |
| Contamination of blood cultures (%) | 3.1 (1.9–4.6) |
| Number of CD detected test (/1000 bed days) | 4.2 (2.6–5.4) |
| Blood culture collected prior to broad spectrum antibiotic therapy (%) c | 60.1 (40.8–71.5) |
| Specimens for culture prior to broad spectrum antibiotic therapy (%) a,c | 82.4 (72.6–88.4) |
| Number of bacterial tests (/100 bed days) | 9.8 (6.7–12.9) |
| AUD of antibiotic injection (/100 bed days) a | 15.8 (12.8–19.1) |
| DOT of antibiotic injection (/100 bed days) a | 26.3 (22.4–30.3) |
| Antimicrobial resistance | |
| MRSA/S. aureus detection rate a | 42.3 (33.3–52.5) |
| Cluster 1 (n = 25) | Cluster 2 (n = 13) | Cluster 3 (n = 5) | Cluster 4 (n = 49) | Cluster 5 (n = 31) | Overall p-Value | |
|---|---|---|---|---|---|---|
| Structure factors | ||||||
| Number of beds (beds) | 269 | 275 | 106 e | 304 e | 466 c,d | 0.0002 |
| Number of patients admissions per year (patients) | 6303 | 5789 c | 2587 b,d,e | 6184 c | 11,046 c,d | <0.001 |
| Average length of stay (days) | 12.5 | 13.4 | 14.9 e | 13.2 e | 10.9 c, d | <0.001 |
| Rate of surgeries (%) f | 22.1 ± 4.8 | 25.3 ± 4.7 | 29.1 ± 6.3 | 29.3 ± 5.4 a,e | 25.3 ± 3.7 d | 0.0055 g |
| ICU patient admissions (%) | 3.0 | 0 | 0 | 0 | 3.7 | 0.0365 |
| CVC use patients (%) | 6.1 | 8.0 c | 3.1 b,e | 5.6 | 6.4 c | 0.0159 |
| UC use patients (%) | 13.3 | 12.3 | 14.2 | 12.1 | 12.0 | 0.3219 |
| Region (East Japan: %) | 92.0 | 84.6 | 0 | 36.7 | 70.9 | |
| Medical fee for IPC type 1 (%) | 84.0 | 100 | 0 | 100 | 100 | |
| Teaching Hospital (%) | 76.0 | 92.3 | 60.0 | 87.8 | 96.7 | |
| 7:1 hospital charge index (%) | 92.0 | 100 | 100 | 94.0 | 100 | |
| Pharmaceutical service (%) | 64.0 | 76.9 | 40.0 | 65.3 | 64.5 | |
| Process factors | ||||||
| TDM implementation rate for vancomycin (%) | 64.3 b,d,e | 82.1 a | 9.7 d,e | 80.0 a,c | 80.8 a,c | <0.001 |
| Multiple sets of blood cultures (%) | 80.6 b | 46.3 a,c,d,e | 78.0 b | 82.3 b | 85.0 b | <0.001 |
| Contamination of blood cultures (%) | 4.0 | 4.1 | 3.5 | 3.0 | 2.4 | 0.0988 |
| Number of CD detected test (/1000 bed days) | 3.8 | 3.7 | 4.4 | 3.8 e | 5.4 d | 0.0114 |
| Blood culture collected prior to broad spectrum antibiotic therapy (%) | 40.6 d,e | 60.9 | 30.1 e | 59.2 a,e | 72.3 a,c,d | <0.001 |
| Specimens for culture prior to broad spectrum antibiotic therapy (%) | 72.8 d,e | 87.3 | 63.0 e | 81.8 a,e | 85.9 | <0.001 |
| Number of bacterial tests (/100 bed days) | 6.8 e | 10.3 e | 6.7 e | 8.5 e | 14.6 a,b,c,d | <0.001 |
| AUD of antibiotic injection (/100 bed days) | 15.4 e | 18.3 | 12.8 | 14.5 e | 19.1 a,d | <0.001 |
| DOT of antibiotic injection (/100 bed days) | 25.6 e | 28.3 d | 24.9 | 23.5 b,e | 30.1 a,d | <0.001 |
Publisher’s Note: MDPI stays neutral with regard to jurisdictional claims in published maps and institutional affiliations. |
© 2022 by the authors. Licensee MDPI, Basel, Switzerland. This article is an open access article distributed under the terms and conditions of the Creative Commons Attribution (CC BY) license (https://creativecommons.org/licenses/by/4.0/).
Share and Cite
Shoji, T.; Sato, N.; Fukuda, H.; Muraki, Y.; Kawata, K.; Akazawa, M. Clinical Implication of the Relationship between Antimicrobial Resistance and Infection Control Activities in Japanese Hospitals: A Principal Component Analysis-Based Cluster Analysis. Antibiotics 2022, 11, 229. https://doi.org/10.3390/antibiotics11020229
Shoji T, Sato N, Fukuda H, Muraki Y, Kawata K, Akazawa M. Clinical Implication of the Relationship between Antimicrobial Resistance and Infection Control Activities in Japanese Hospitals: A Principal Component Analysis-Based Cluster Analysis. Antibiotics. 2022; 11(2):229. https://doi.org/10.3390/antibiotics11020229
Chicago/Turabian StyleShoji, Tomokazu, Natsu Sato, Haruhisa Fukuda, Yuichi Muraki, Keishi Kawata, and Manabu Akazawa. 2022. "Clinical Implication of the Relationship between Antimicrobial Resistance and Infection Control Activities in Japanese Hospitals: A Principal Component Analysis-Based Cluster Analysis" Antibiotics 11, no. 2: 229. https://doi.org/10.3390/antibiotics11020229
APA StyleShoji, T., Sato, N., Fukuda, H., Muraki, Y., Kawata, K., & Akazawa, M. (2022). Clinical Implication of the Relationship between Antimicrobial Resistance and Infection Control Activities in Japanese Hospitals: A Principal Component Analysis-Based Cluster Analysis. Antibiotics, 11(2), 229. https://doi.org/10.3390/antibiotics11020229