
Transcription Factor EepR Is Required for Serratia marcescens Host Proinflammatory Response by Corneal Epithelial Cells


Abstract
1. Introduction
2. Results
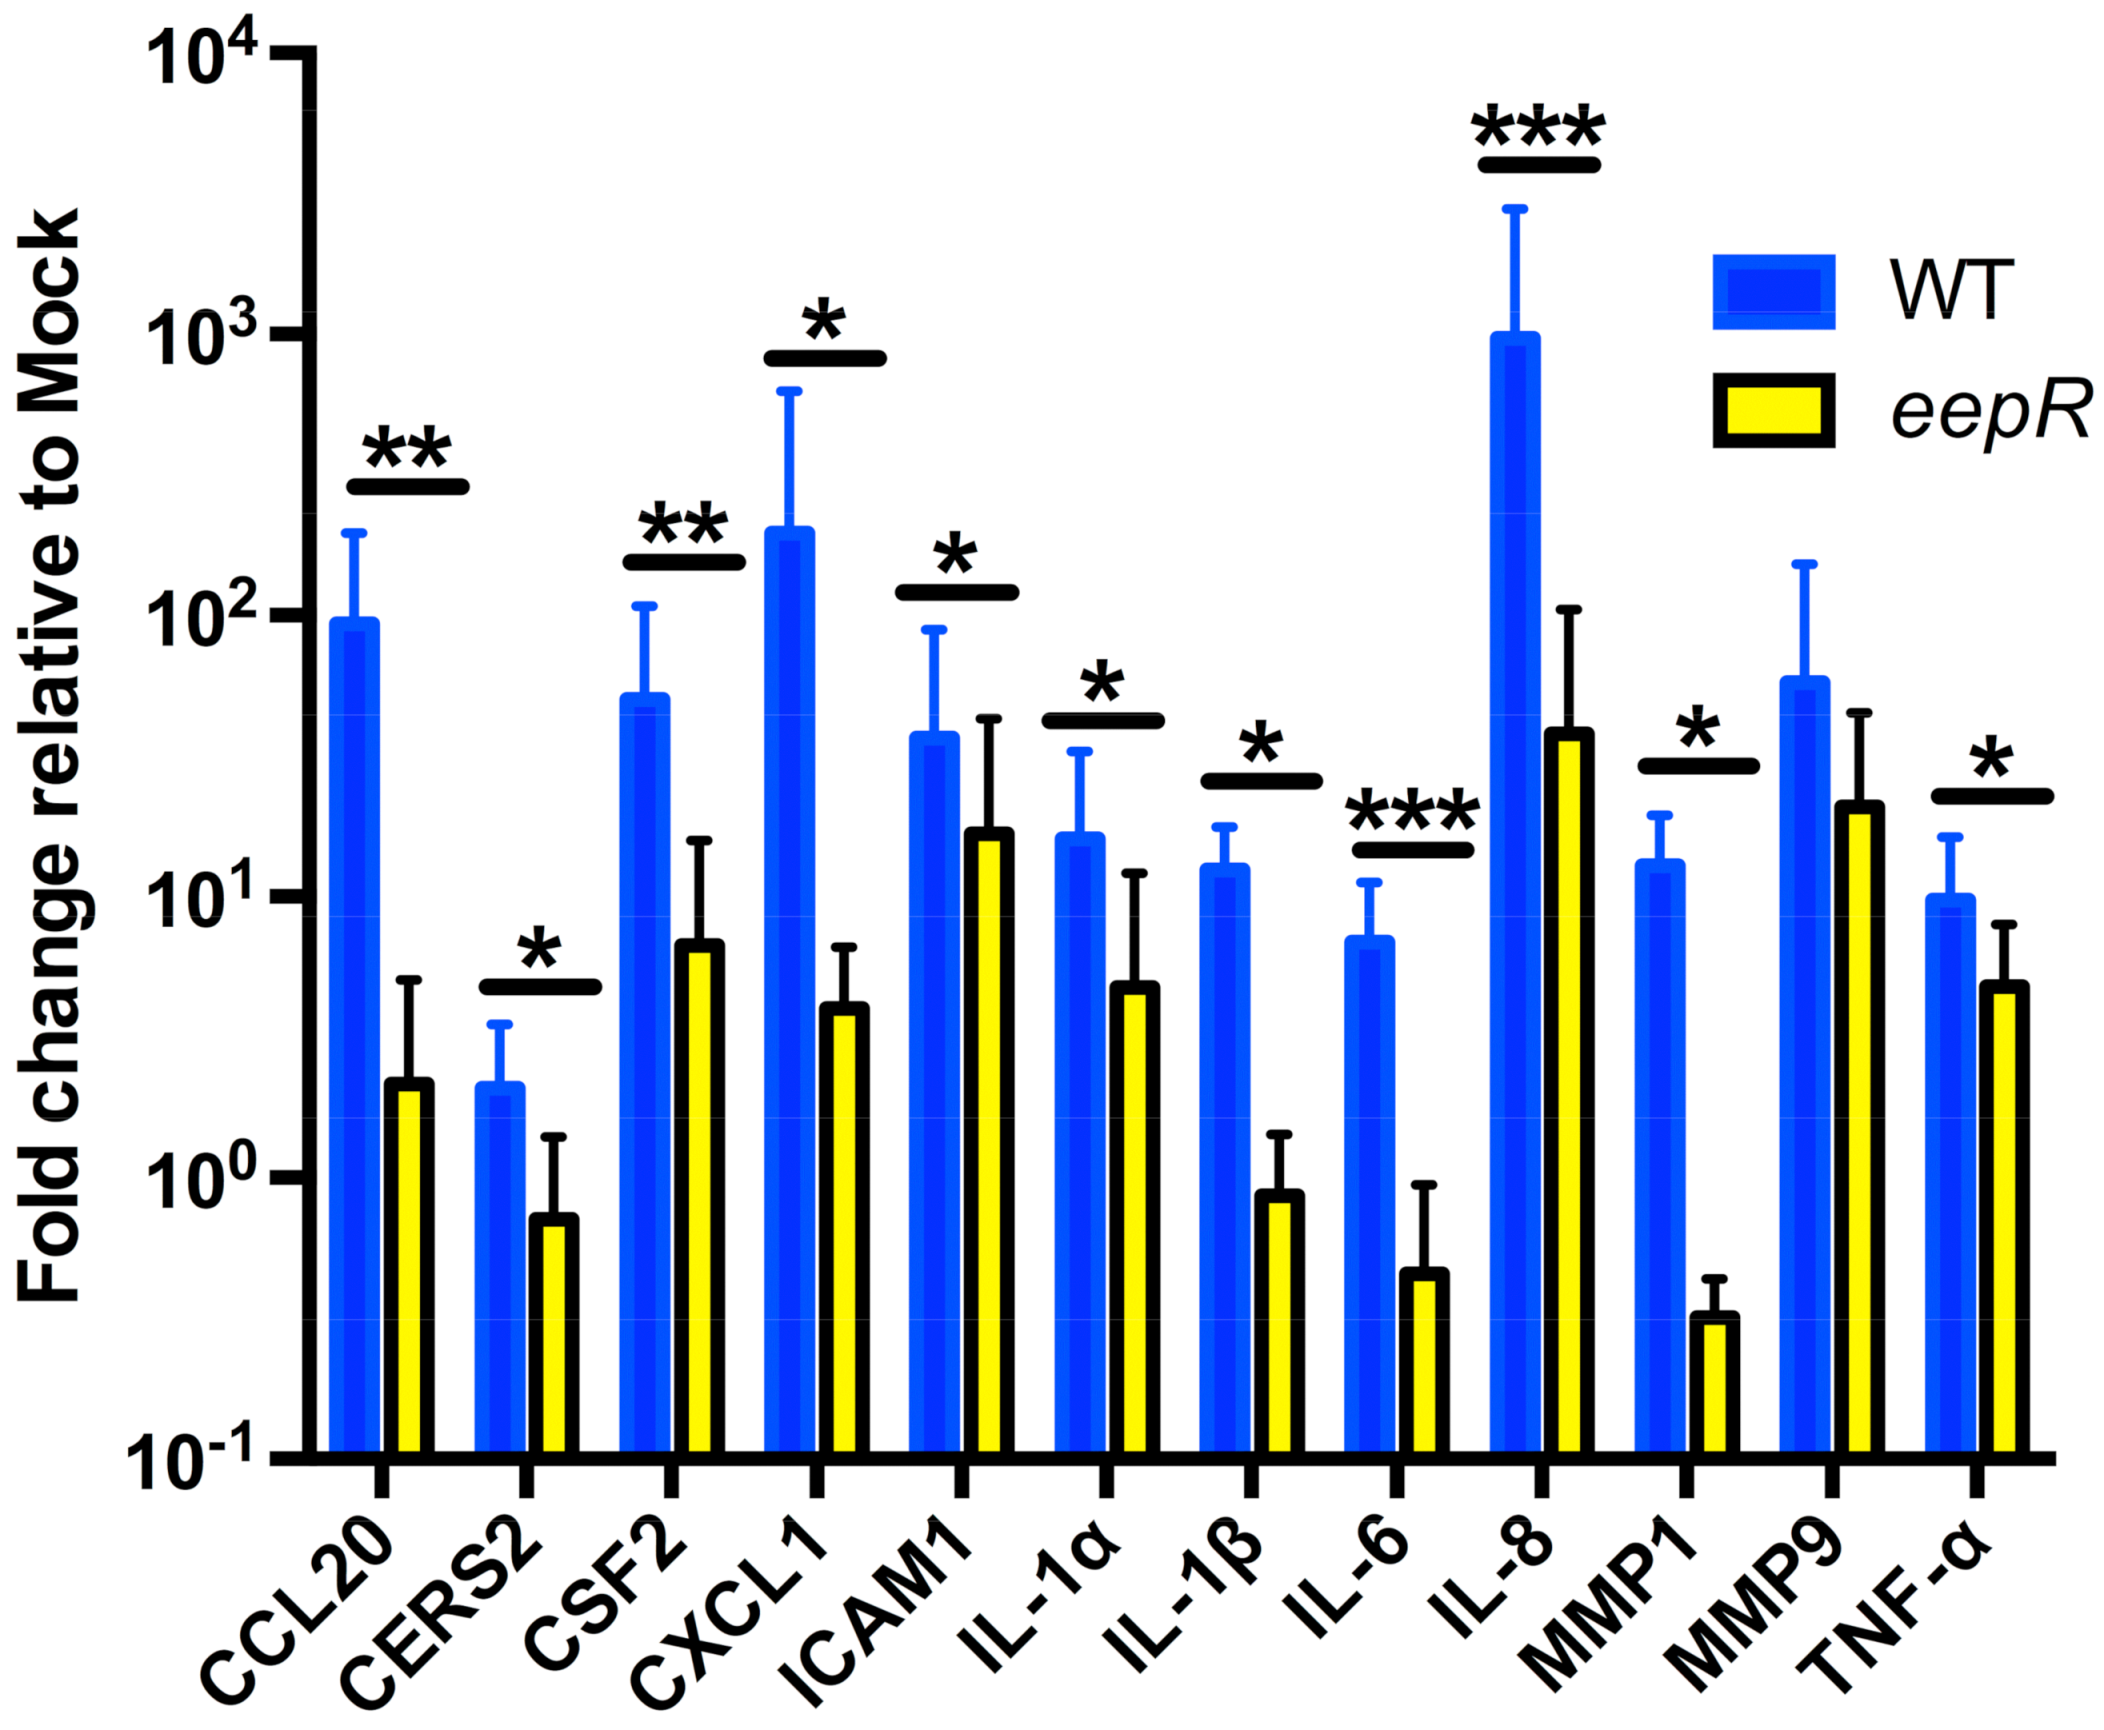
2.1. HCLE Cells Exposed to eepR Mutant S. marcescens Secretomes Have an Attenuated Inflammatory Response Compared with Wild-type Treated HCLE Cells
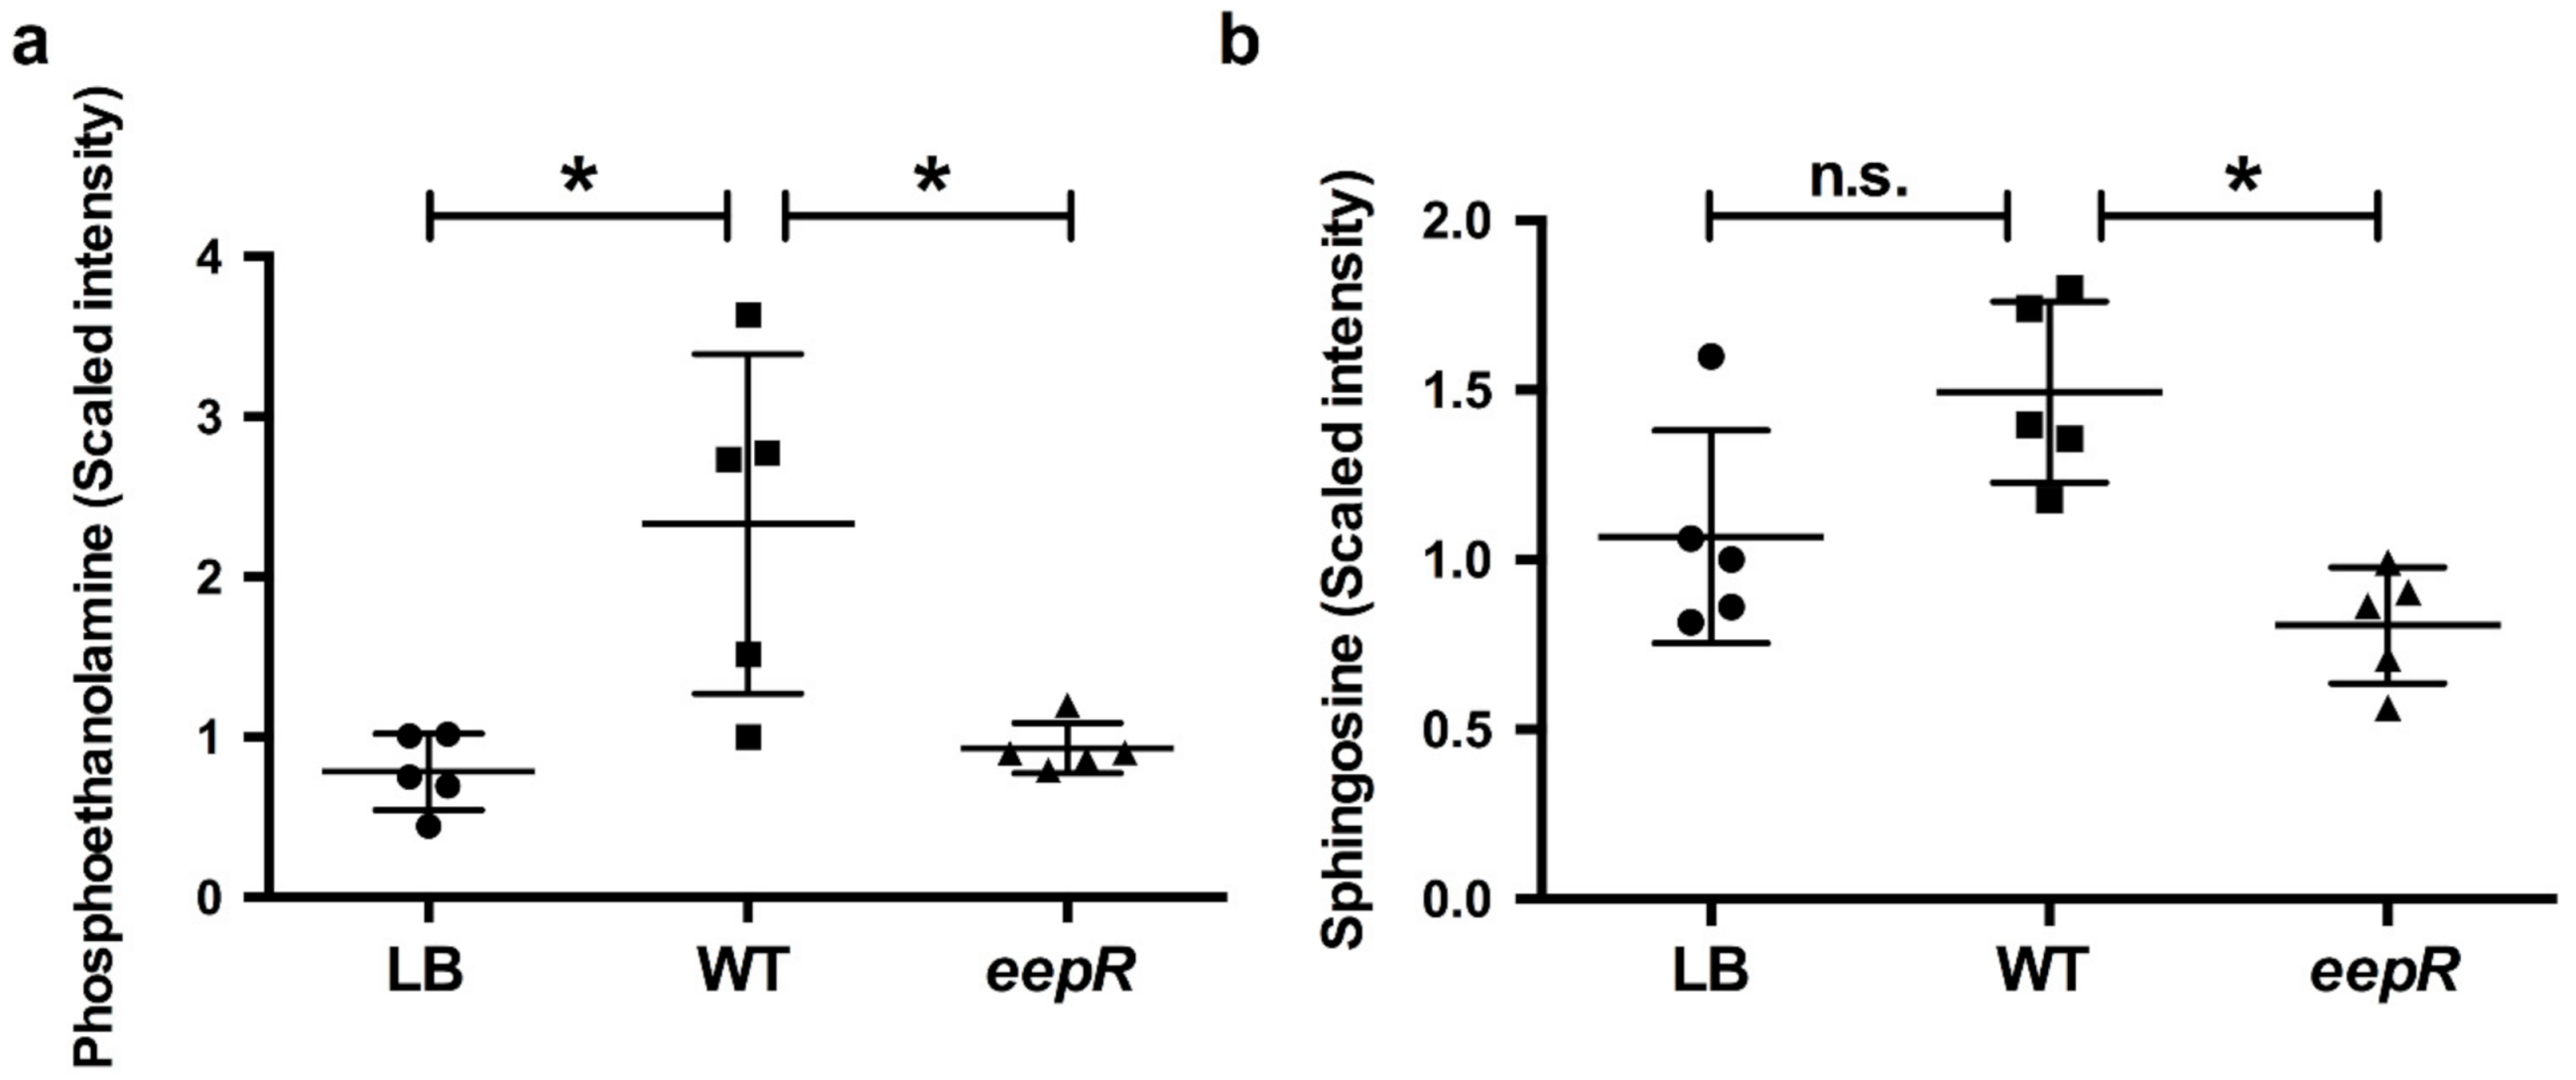
2.2. Bacterial Secretomes Influence Corneal Epithelial CellLipid Metabolism
3. Discussion
4. Materials and Methods
4.1. Bacterial Growth Conditions and Media
4.2. Microarray
4.3. Quantitative Reverse Transcriptase PCR (qPCR)
4.4. Metabolomics
4.5. Statistical Analysis
Supplementary Materials
Author Contributions
Funding
Data Availability Statement
Conflicts of Interest
References
- Fleiszig, S.M.; McNamara, N.A.; Evans, D.J. The tear film and defense against infection. Adv. Exp. Med. Biol. 2002, 506, 523–530. [Google Scholar]
- McDermott, A.M. Antimicrobial compounds in tears. Exp. Eye Res. 2013, 117, 53–61. [Google Scholar] [CrossRef]
- Evans, D.J.; Fleiszig, S.M. Why does the healthy cornea resist Pseudomonas aeruginosa infection? Am. J. Ophthalmol. 2013, 155, 961–970. [Google Scholar] [CrossRef] [PubMed]
- Metruccio, M.M.E.; Tam, C.; Evans, D.J.; Xie, A.L.; Stern, M.E.; Fleiszig, S.M.J. Contributions of MyD88-dependent receptors and CD11c-positive cells to corneal epithelial barrier function against Pseudomonas aeruginosa. Sci. Rep. 2017, 7, 13829. [Google Scholar] [CrossRef] [PubMed]
- Callegan, M.C.; O’Callaghan, R.J.; Hill, J.M. Pharmacokinetic considerations in the treatment of bacterial keratitis. Clin. Pharmacokinet. 1994, 27, 129–149. [Google Scholar] [CrossRef] [PubMed]
- Hazlett, L.D. Role of innate and adaptive immunity in the pathogenesis of keratitis. Ocul. Immunol. Inflamm. 2005, 13, 133–138. [Google Scholar] [CrossRef] [PubMed]
- Pearlman, E.; Sun, Y.; Roy, S.; Karmakar, M.; Hise, A.G.; Szczotka-Flynn, L.; Ghannoum, M.; Chinnery, H.R.; McMenamin, P.G.; Rietsch, A. Host defense at the ocular surface. Int. Rev. Immunol. 2013, 32, 4–18. [Google Scholar] [CrossRef] [PubMed]
- Ruan, X.; Chodosh, J.; Callegan, M.C.; Booth, M.C.; Lee, T.D.; Kumar, P.; Gilmore, M.S.; Pereira, H.A. Corneal expression of the inflammatory mediator CAP37. Investig. Ophthalmol. Vis. Sci. 2002, 43, 1414–1421. [Google Scholar]
- Willcox, M.D. Pseudomonas aeruginosa infection and inflammation during contact lens wear: A review. Optom. Vis. Sci. 2007, 84, 273–278. [Google Scholar] [CrossRef]
- Mah-Sadorra, J.H.; Najjar, D.M.; Rapuano, C.J.; Laibson, P.R.; Cohen, E.J. Serratia corneal ulcers: A retrospective clinical study. Cornea 2005, 24, 793–800. [Google Scholar] [CrossRef]
- Voelz, A.; Muller, A.; Gillen, J.; Le, C.; Dresbach, T.; Engelhart, S.; Exner, M.; Bates, C.J.; Simon, A. Outbreaks of Serratia marcescens in neonatal and pediatric intensive care units: Clinical aspects, risk factors and management. Int. J. Hyg. Environ. Health 2010, 213, 79–87. [Google Scholar] [CrossRef]
- Mahlen, S.D. Serratia infections: From military experiments to current practice. Clin. Microbiol. Rev. 2011, 24, 755–791. [Google Scholar] [CrossRef]
- Rahim, K.; Saleha, S.; Zhu, X.; Huo, L.; Basit, A.; Franco, O.L. Bacterial Contribution in Chronicity of Wounds. Microb. Ecol. 2017, 73, 710–721. [Google Scholar] [CrossRef]
- Scales, B.S.; Huffnagle, G.B. The microbiome in wound repair and tissue fibrosis. J. Pathol. 2013, 229, 323–331. [Google Scholar] [CrossRef]
- Scali, C.; Kunimoto, B. An update on chronic wounds and the role of biofilms. J. Cutan. Med. Surg. 2013, 17, 371–376. [Google Scholar] [CrossRef]
- Brothers, K.M.; Stella, N.A.; Hunt, K.M.; Romanowski, E.G.; Liu, X.; Klarlund, J.K.; Shanks, R.M. Putting on the brakes: Bacterial impediment of wound healing. Sci. Rep. 2015, 5, 14003. [Google Scholar] [CrossRef]
- Brothers, K.M.; Stella, N.A.; Romanowski, E.G.; Kowalski, R.P.; Shanks, R.M. EepR Mediates Secreted-Protein Production, Desiccation Survival, and Proliferation in a Corneal Infection Model. Infect. Immun. 2015, 83, 4373–4382. [Google Scholar] [CrossRef]
- Shanks, R.M.Q.; Stella, N.A.; Lahr, R.M.; Aston, M.A.; Brothers, K.M.; Callaghan, J.D.; Sigindere, C.; Liu, X. Suppressor analysis of eepR mutant defects reveals coordinate regulation of secondary metabolites and serralysin biosynthesis by EepR and HexS. Microbiology 2017, 163, 280–288. [Google Scholar] [CrossRef]
- Stella, N.A.; Lahr, R.M.; Brothers, K.M.; Kalivoda, E.J.; Hunt, K.M.; Kwak, D.H.; Liu, X.; Shanks, R.M. Serratia marcescens cyclic AMP-receptor protein controls transcription of EepR, a novel regulator of antimicrobial secondary metabolites. J. Bacteriol. 2015, 197, 2468–2478. [Google Scholar] [CrossRef]
- Chidambaram, J.D.; Kannambath, S.; Srikanthi, P.; Shah, M.; Lalitha, P.; Elakkiya, S.; Bauer, J.; Prajna, N.V.; Holland, M.J.; Burton, M.J. Persistence of Innate Immune Pathways in Late Stage Human Bacterial and Fungal Keratitis: Results from a Comparative Transcriptome Analysis. Front. Cell Infect. Microbiol. 2017, 7, 193. [Google Scholar] [CrossRef]
- Gao, N.; Sang Yoon, G.; Liu, X.; Mi, X.; Chen, W.; Standiford, T.J.; Yu, F.S. Genome-wide transcriptional analysis of differentially expressed genes in flagellin-pretreated mouse corneal epithelial cells in response to Pseudomonas aeruginosa: Involvement of S100A8/A9. Mucosal Immunol. 2013, 6, 993–1005. [Google Scholar] [CrossRef]
- Huang, X.; Hazlett, L.D. Analysis of Pseudomonas aeruginosa corneal infection using an oligonucleotide microarray. Investig. Ophthalmol. Vis. Sci. 2003, 44, 3409–3416. [Google Scholar] [CrossRef][Green Version]
- Heimer, S.R.; Yamada, A.; Russell, H.; Gilmore, M. Response of corneal epithelial cells to Staphylococcus aureus. Virulence 2010, 1, 223–235. [Google Scholar] [CrossRef]
- Shanks, R.M.; Stella, N.A.; Hunt, K.M.; Brothers, K.M.; Zhang, L.; Thibodeau, P.H. Identification of SlpB, a Cytotoxic Protease from Serratia marcescens. Infect. Immun. 2015, 83, 2907–2916. [Google Scholar] [CrossRef] [PubMed]
- Brothers, K.M.; Kowalski, R.P.; Tian, S.; Kinchington, P.R.; Shanks, R.M.Q. Bacteria induce autophagy in a human ocular surface cell line. Exp. Eye Res. 2018, 168, 12–18. [Google Scholar] [CrossRef]
- Brothers, K.M.; Stella, N.A.; Shanks, R.M.Q. Biologically active pigment and ShlA cytolysin of Serratia marcescens induce autophagy in a human ocular surface cell line. BMC Ophthalmol. 2020, 20, 120. [Google Scholar] [CrossRef]
- Hume, E.; Sack, R.; Stapleton, F.; Willcox, M. Induction of cytokines from polymorphonuclear leukocytes and epithelial cells by ocular isolates of Serratia marcescens. Ocul. Immunol. Inflamm. 2004, 12, 287–295. [Google Scholar] [CrossRef]
- Saika, S.; Okada, Y.; Miyamoto, T.; Yamanaka, O.; Ohnishi, Y.; Ooshima, A.; Liu, C.Y.; Weng, D.; Kao, W.W. Role of p38 MAP kinase in regulation of cell migration and proliferation in healing corneal epithelium. Investig. Ophthalmol. Vis. Sci. 2004, 45, 100–109. [Google Scholar] [CrossRef] [PubMed]
- Al-Mujaini, A.; Al-Kharusi, N.; Thakral, A.; Wali, U.K. Bacterial keratitis: Perspective on epidemiology, clinico-pathogenesis, diagnosis and treatment. Sultan Qaboos Univ. Med. J. 2009, 9, 184–195. [Google Scholar]
- Teweldemedhin, M.; Gebreyesus, H.; Atsbaha, A.H.; Asgedom, S.W.; Saravanan, M. Bacterial profile of ocular infections: A systematic review. BMC Ophthalmol. 2017, 17, 212. [Google Scholar] [CrossRef]
- Zhang, J.; Kumar, A.; Wheater, M.; Yu, F.S. Lack of MD-2 expression in human corneal epithelial cells is an underlying mechanism of lipopolysaccharide (LPS) unresponsiveness. Immunol. Cell Biol. 2009, 87, 141–148. [Google Scholar] [CrossRef] [PubMed]
- Ueta, M.; Nochi, T.; Jang, M.H.; Park, E.J.; Igarashi, O.; Hino, A.; Kawasaki, S.; Shikina, T.; Hiroi, T.; Kinoshita, S.; et al. Intracellularly expressed TLR2s and TLR4s contribution to an immunosilent environment at the ocular mucosal epithelium. J. Immunol. 2004, 173, 3337–3347. [Google Scholar] [CrossRef] [PubMed]
- Schutyser, E.; Struyf, S.; Van Damme, J. The CC chemokine CCL20 and its receptor CCR6. Cytokine Growth Factor Rev. 2003, 14, 409–426. [Google Scholar] [CrossRef]
- Shea-Donohue, T.; Zhao, A.; Antalis, T.M. SerpinB2 mediated regulation of macrophage function during enteric infection. Gut Microbes 2014, 5, 254–258. [Google Scholar] [CrossRef] [PubMed]
- Guo, F.; Li, Y.; Wang, J.; Li, Y.; Li, Y.; Li, G. Stanniocalcin1 (STC1) Inhibits Cell Proliferation and Invasion of Cervical Cancer Cells. PLoS ONE 2013, 8, e53989. [Google Scholar] [CrossRef]
- Elkington, P.T.; O’Kane, C.M.; Friedland, J.S. The paradox of matrix metalloproteinases in infectious disease. Clin. Exp. Immunol. 2005, 142, 12–20. [Google Scholar] [CrossRef]
- Akaike, T.; Molla, A.; Ando, M.; Araki, S.; Maeda, H. Molecular mechanism of complex infection by bacteria and virus analyzed by a model using serratial protease and influenza virus in mice. J. Virol. 1989, 63, 2252–2259. [Google Scholar] [CrossRef]
- Kamata, R.; Yamamoto, T.; Matsumoto, K.; Maeda, H. A serratial protease causes vascular permeability reaction by activation of the Hageman factor-dependent pathway in guinea pigs. Infect. Immun. 1985, 48, 747–753. [Google Scholar] [CrossRef]
- Shea, B.S.; Tager, A.M. Sphingolipid regulation of tissue fibrosis. Open Rheumatol. J. 2012, 6, 123–129. [Google Scholar] [CrossRef]
- Bertani, G. Studies on lysogenesis. I. The mode of phage liberation by lysogenic Escherichia coli. J. Bacteriol. 1951, 62, 293–300. [Google Scholar] [CrossRef]
- Gipson, I.K.; Spurr-Michaud, S.; Argueso, P.; Tisdale, A.; Ng, T.F.; Russo, C.L. Mucin gene expression in immortalized human corneal-limbal and conjunctival epithelial cell lines. Investig. Ophthalmol. Vis. Sci. 2003, 44, 2496–2506. [Google Scholar] [CrossRef]
- Dos Santos, A.; Balayan, A.; Funderburgh, M.L.; Ngo, J.; Funderburgh, J.L.; Deng, S.X. Differentiation Capacity of Human Mesenchymal Stem Cells into Keratocyte Lineage. Investig. Ophthalmol. Vis. Sci. 2019, 60, 3013–3023. [Google Scholar] [CrossRef]
- Nozato, K.; Fujita, J.; Kawaguchi, M.; Ohara, G.; Morishima, Y.; Ishii, Y.; Huang, S.K.; Kokubu, F.; Satoh, H.; Hizawa, N. IL-17F Induces CCL20 in Bronchial Epithelial Cells. J. Allergy 2011, 2011, 587204. [Google Scholar] [CrossRef]
- Erez-Roman, R.; Pienik, R.; Futerman, A.H. Increased ceramide synthase 2 and 6 mRNA levels in breast cancer tissues and correlation with sphingosine kinase expression. Biochem. Biophys. Res. Commun. 2010, 391, 219–223. [Google Scholar] [CrossRef]
- Sun, Y.; Guo, Q.M.; Liu, D.L.; Zhang, M.Z.; Shu, R. In vivo expression of Toll-like receptor 2, Toll-like receptor 4, CSF2 and LY64 in Chinese chronic periodontitis patients. Oral Dis. 2010, 16, 343–350. [Google Scholar] [CrossRef]
- Schultz, K.R.; Klarnet, J.P.; Gieni, R.S.; HayGlass, K.T.; Greenberg, P.D. The role of B cells for in vivo T cell responses to a Friend virus-induced leukemia. Science 1990, 249, 921–923. [Google Scholar] [CrossRef]
- Glushakova, O.; Kosugi, T.; Roncal, C.; Mu, W.; Heinig, M.; Cirillo, P.; Sanchez-Lozada, L.G.; Johnson, R.J.; Nakagawa, T. Fructose induces the inflammatory molecule ICAM-1 in endothelial cells. J. Am. Soc. Nephrol. 2008, 19, 1712–1720. [Google Scholar] [CrossRef]
- Dabkeviciene, D.; Sasnauskiene, A.; Leman, E.; Kvietkauskaite, R.; Daugelaviciene, N.; Stankevicius, V.; Jurgelevicius, V.; Juodka, B.; Kirveliene, V. mTHPC-mediated photodynamic treatment up-regulates the cytokines VEGF and IL-1alpha. Photochem. Photobiol. 2012, 88, 432–439. [Google Scholar] [CrossRef]
- Kulik, T.J. Inhaled nitric oxide in the management of congenital heart disease. Curr. Opin. Cardiol. 1996, 11, 75–80. [Google Scholar] [CrossRef]
- Morris, M.C.; Gilliam, E.A.; Button, J.; Li, L. Dynamic modulation of innate immune response by varying dosages of lipopolysaccharide (LPS) in human monocytic cells. J. Biol. Chem. 2014, 289, 21584–21590. [Google Scholar] [CrossRef]
- Huntington, J.T.; Shields, J.M.; Der, C.J.; Wyatt, C.A.; Benbow, U.; Slingluff, C.L., Jr.; Brinckerhoff, C.E. Overexpression of collagenase 1 (MMP-1) is mediated by the ERK pathway in invasive melanoma cells: Role of BRAF mutation and fibroblast growth factor signaling. J. Biol. Chem. 2004, 279, 33168–33176. [Google Scholar] [CrossRef] [PubMed]
- Safranek, J.; Pesta, M.; Holubec, L.; Kulda, V.; Dreslerova, J.; Vrzalova, J.; Topolcan, O.; Pesek, M.; Finek, J.; Treska, V. Expression of MMP-7, MMP-9, TIMP-1 and TIMP-2 mRNA in lung tissue of patients with non-small cell lung cancer (NSCLC) and benign pulmonary disease. Anticancer Res. 2009, 29, 2513–2517. [Google Scholar] [PubMed]


| Mean of Normalized Expression, Duplicates | Expression Ratios | Scaled eepR | ||||||||
|---|---|---|---|---|---|---|---|---|---|---|
| Gene symbol | Entrez Gene number | LB control | WT Serratia | eepR mutant | WT/cont | eepR/cont | eepR/WT | WT/eepR | Biological Function | |
| CXCL8 * | 3576 | 41 | 2346 | 145 | 56.6 | 3.5 | 0.1 | 16.2 | 0.04 | Inflammatory cytokine |
| CXCL1 * | 2919 | 51 | 1452 | 566 | 28.4 | 11.1 | 0.4 | 2.6 | 0.37 | Inflammatory cytokine |
| CCL20 * | 6364 | 297 | 8224 | 1757 | 27.7 | 5.9 | 0.2 | 4.7 | 0.18 | Inflammatory cytokine |
| ITGB8 | 3696 | 4 | 91 | 38 | 25.7 | 10.8 | 0.4 | 2.4 | 0.40 | Integrin-mediated cell adhesion |
| CXCL3 | 2921 | 35 | 830 | 108 | 23.7 | 3.1 | 0.1 | 7.7 | 0.09 | Chemotaxis |
| GFPT2 | 9945 | 5 | 96 | 39 | 18.4 | 7.4 | 0.4 | 2.5 | 0.37 | Glutamine fructose-6-phosphate transaminase |
| CSF2 * | 1437 | 74 | 1311 | 192 | 17.7 | 2.6 | 0.1 | 6.8 | 0.10 | granulocyte macrophage colony-stimulating factor receptor binding |
| LIF | 3976 | 71 | 1164 | 93 | 16.4 | 1.3 | 0.1 | 12.5 | 0.02 | TGF Beta Signaling |
| CSF3 | 1440 | 47 | 746 | 146 | 16.0 | 3.1 | 0.2 | 5.1 | 0.14 | granulocyte colony-stimulating factor receptor binding |
| MMP1 * | 4312 | 104 | 1639 | 114 | 15.7 | 1.1 | 0.1 | 14.4 | 0.01 | Proteolysis |
| CXCL2 | 2920 | 83 | 1163 | 428 | 14.1 | 5.2 | 0.4 | 2.7 | 0.32 | Chemokine |
| MTSS1 | 9788 | 11 | 137 | 31 | 12.9 | 2.9 | 0.2 | 4.4 | 0.16 | Actin binding |
| HCAR3 | 8843 | 306 | 3840 | 589 | 12.6 | 1.9 | 0.2 | 6.5 | 0.08 | G-protein coupled receptor signaling |
| IL20 | 50604 | 31 | 379 | 26 | 12.3 | 0.8 | 0.1 | 14.6 | −0.01 | Receptor binding |
| TNFAIP2 | 7127 | 20 | 236 | 198 | 11.7 | 9.9 | 0.8 | 1.2 | 0.83 | Angiogenesis |
| ICAM1 * | 3383 | 40 | 445 | 217 | 11.3 | 5.5 | 0.5 | 2.1 | 0.44 | T cell antigen processing and presentation |
| IL36G | 56300 | 92 | 1011 | 536 | 11.0 | 5.8 | 0.5 | 1.9 | 0.48 | Positive regulation of cytokine production |
| SQSTM1 | 8878 | 8 | 81 | 28 | 10.7 | 3.7 | 0.3 | 2.9 | 0.28 | Positive regulation of protein phosphorylation |
| MMP10 | 4319 | 100 | 1064 | 92 | 10.7 | 0.9 | 0.1 | 11.6 | −0.01 | Proteolysis |
| PRDM1 | 639 | 139 | 1394 | 146 | 10.1 | 1.1 | 0.1 | 9.5 | 0.01 | Negative regulation of transcription from RNA polymerase II |
| TRAF1 | 7185 | 16 | 160 | 54 | 10.0 | 3.4 | 0.3 | 3.0 | 0.27 | Apoptosis |
| IL1R2 | 7850 | 66 | 640 | 412 | 9.7 | 6.2 | 0.6 | 1.6 | 0.60 | Immune response |
| IL24 | 11009 | 474 | 4413 | 678 | 9.3 | 1.4 | 0.2 | 6.5 | 0.05 | Apoptosis |
| MMP9 * | 4318 | 408 | 3792 | 2017 | 9.3 | 4.9 | 0.5 | 1.9 | 0.48 | Proteolysis |
| IL6 * | 3569 | 60 | 545 | 152 | 9.1 | 2.5 | 0.3 | 3.6 | 0.19 | Inflammatory cytokine |
| Mean of Normalized Expression, Duplicates | Expression Ratios | Scaled eepR | ||||||||
|---|---|---|---|---|---|---|---|---|---|---|
| Gene Symbol | Entrez Gene number | LB control | WT Serratia | eepR mutant | WT/cont | eepR/cont | eepR/WT | WT/eepR | Biological Function | |
| TXNIP | 10628 | 2659 | 64 | 320 | 0.02 | 0.1 | 5.0 | 0.2 | −0.90 | Negative regulation of transcription from RNA polymerase II |
| CTGF | 1490 | 1245 | 55 | 35 | 0.04 | 0.0 | 0.6 | 1.6 | −1.02 | Cartilage condensation |
| 236865_at | --- | 117 | 7 | 24 | 0.06 | 0.2 | 3.5 | 0.3 | −0.84 | Unknown |
| ARRDC4 | 91947 | 1338 | 96 | 285 | 0.07 | 0.2 | 3.0 | 0.3 | −0.85 | Positive regulation of ubiquitin-protein ligase activity |
| LOC100287896 | 100287896 | 81 | 6 | 38 | 0.08 | 0.5 | 5.9 | 0.2 | −0.57 | Unknown |
| NAP1L3 | 4675 | 35 | 4 | 31 | 0.10 | 0.9 | 8.6 | 0.1 | −0.14 | Nucleosome assembly |
| RP4-813F11.4 | --- | 146 | 19 | 13 | 0.13 | 0.1 | 0.7 | 1.5 | −1.05 | Unknown |
| HJURP | 55355 | 747 | 105 | 430 | 0.14 | 0.6 | 4.1 | 0.2 | −0.49 | Nucleosome assembly |
| PIK3R3 | 8503 | 95 | 14 | 70 | 0.14 | 0.7 | 5.2 | 0.2 | −0.31 | Phospholipid metabolic process |
| SLC26A7 | 115111 | 24 | 4 | 5 | 0.14 | 0.2 | 1.3 | 0.8 | −0.95 | Gastric acid secretion |
| ARRDC3 | 57561 | 257 | 40 | 113 | 0.15 | 0.4 | 2.9 | 0.4 | −0.66 | Temperature homeostasis |
| ZNF750 | 79755 | 148 | 24 | 62 | 0.16 | 0.4 | 2.6 | 0.4 | −0.69 | Transcription, DNA-dependent |
| GPX8 | 493869 | 92 | 15 | 86 | 0.16 | 0.9 | 5.8 | 0.2 | −0.08 | Response to oxidative stress |
| MECOM | 2122 | 154 | 25 | 65 | 0.16 | 0.4 | 2.6 | 0.4 | −0.69 | Neutrophil homeostasis |
| ENC1 | 8507 | 379 | 64 | 169 | 0.17 | 0.4 | 2.6 | 0.4 | −0.67 | Multicellular organismal development |
| THAP2 | 83591 | 88 | 15 | 11 | 0.17 | 0.1 | 0.7 | 1.4 | −1.05 | Nucleic acid binding |
| 1560973_a_at | --- | 34 | 6 | 16 | 0.18 | 0.5 | 2.7 | 0.4 | −0.63 | Unknown |
| ZNF658 | 26149 | 56 | 10 | 56 | 0.19 | 1.0 | 5.4 | 0.2 | −0.00 | Transcription, DNA-dependent |
| ST6GALNAC5 | 81849 | 76 | 14 | 44 | 0.19 | 0.6 | 3.1 | 0.3 | −0.51 | Protein glycosylation |
| AOC3 | 8639 | 84 | 16 | 8 | 0.19 | 0.1 | 0.5 | 2.0 | −1.11 | Cell adhesion |
| AKNAD1 | 254268 | 67 | 13 | 23 | 0.20 | 0.3 | 1.7 | 0.6 | −0.82 | Cytoplasm |
| FAM83D | 81610 | 1588 | 313 | 1235 | 0.20 | 0.8 | 3.9 | 0.3 | −0.28 | Cell cycle |
| 242708_at | --- | 44 | 9 | 8 | 0.20 | 0.2 | 0.9 | 1.1 | −1.01 | Unknown |
| ZC3H6 | 376940 | 99 | 20 | 32 | 0.21 | 0.3 | 1.6 | 0.6 | −0.85 | Nucleic acid binding |
| * FAM72A | 554282 | 1976 | 413 | 1063 | 0.21 | 0.5 | 2.6 | 0.4 | −0.58 | Cytoplasm |
| Mean of Normalized Expression, Duplicates | Expression Ratios | Scaled eepR | ||||||||
|---|---|---|---|---|---|---|---|---|---|---|
| Gene Symbol | Entrez Gene number | LB control | WT Serratia | eepR mutant | WT/cont | eepR/cont | eepR/WT | WT/eepR | Biological Function | |
| CXCL1 | 2919 | 51 | 1452 | 566 | 28.4 | 11.1 | 0.4 | 2.6 | 0.37 | Inflammatory cytokine |
| ITGB8 | 3696 | 4 | 91 | 38 | 25.7 | 10.8 | 0.4 | 2.4 | 0.40 | Integrin-mediated cell adhesion |
| TNFAIP2 | 7127 | 20 | 236 | 198 | 11.7 | 9.9 | 0.8 | 1.2 | 0.83 | Angiogenesis |
| OLR1 | 4973 | 155 | 1302 | 1195 | 8.4 | 7.7 | 0.9 | 1.1 | 0.91 | Proteolysis |
| IL1R2 | 7850 | 66 | 640 | 412 | 9.7 | 6.2 | 0.6 | 1.6 | 0.60 | Immune response |
| CCL20 | 6364 | 297 | 8224 | 1757 | 27.7 | 5.9 | 0.2 | 4.7 | 0.18 | Inflammatory cytokine |
| IL36G | 56300 | 92 | 1011 | 536 | 11.0 | 5.8 | 0.5 | 1.9 | 0.48 | Positive regulation of cytokine production |
| SLC2A6 | 11182 | 34 | 97 | 189 | 2.9 | 5.6 | 1.9 | 0.5 | 2.45 | Transport |
| ICAM1 | 3383 | 40 | 445 | 217 | 11.3 | 5.5 | 0.5 | 2.1 | 0.44 | T cell antigen processing and presentation |
| CXCL2 | 2920 | 83 | 1163 | 428 | 14.1 | 5.2 | 0.4 | 2.7 | 0.32 | Chemokine |
| MMP9 | 4318 | 408 | 3792 | 2017 | 9.3 | 4.9 | 0.5 | 1.9 | 0.48 | Proteolysis |
| CXCL10 | 3627 | 115 | 211 | 533 | 1.8 | 4.6 | 2.5 | 0.4 | 4.36 | Positive regulation of leukocyte chemotaxis |
| IL1R2 | 7850 | 53 | 435 | 241 | 8.3 | 4.6 | 0.6 | 1.8 | 0.49 | Immune response |
| ICAM1 | 3383 | 47 | 367 | 213 | 7.9 | 4.6 | 0.6 | 1.7 | 0.52 | T cell antigen processing and presentation |
| BIRC3 | 330 | 27 | 147 | 114 | 5.4 | 4.2 | 0.8 | 1.3 | 0.72 | Toll-like receptor signaling pathway |
| SGPP2 | --- | 51 | 297 | 206 | 5.8 | 4.0 | 0.7 | 1.4 | 0.63 | Phospholipid metabolic process |
| C15orf48 | 84419 | 26 | 92 | 99 | 3.5 | 3.8 | 1.1 | 0.9 | 1.11 | Mitochondrion |
| JMJD4 | 65094 | 38 | 56 | 146 | 1.5 | 3.8 | 2.6 | 0.4 | 5.88 | Protein binding |
| C6orf132 | 647024 | 42 | 140 | 159 | 3.3 | 3.8 | 1.1 | 0.9 | 1.19 | Unknown |
| S100A7 | 6278 | 76 | 168 | 288 | 2.2 | 3.8 | 1.7 | 0.6 | 2.31 | Response to reactive oxygen species |
| KMO | 8564 | 27 | 107 | 99 | 3.9 | 3.6 | 0.9 | 1.1 | 0.89 | Metabolic process |
| EFNA1 | 1942 | 278 | 1973 | 985 | 7.1 | 3.5 | 0.5 | 2.0 | 0.42 | Negative regulation of transcription from RNA polymerase II promoter |
| FAM20C | 56975 | 148 | 528 | 525 | 3.6 | 3.5 | 1.0 | 1.0 | 0.99 | Phosphorylation |
| CXCL8 | 3576 | 41 | 2346 | 145 | 56.6 | 3.5 | 0.1 | 16.2 | 0.04 | Inflammatory cytokine |
| KMO | 8564 | 28 | 121 | 96 | 4.4 | 3.5 | 0.8 | 1.3 | 0.74 | Metabolic process |
| Mean of Normalized Expression, Duplicates | Expression Ratios | Scaled eepR | ||||||||
|---|---|---|---|---|---|---|---|---|---|---|
| Gene Symbol | Entrez Gene number | LB control | WT Serratia | eepR mutant | WT/cont | eepR/cont | eepR/WT | WT/eepR | Biological Function | |
| CTGF | 1490 | 1245 | 55 | 35 | 0.04 | 0.03 | 0.64 | 1.6 | −1.02 | Cartilage condensation |
| RP4-813F11.4 | --- | 146 | 19 | 13 | 0.13 | 0.09 | 0.69 | 1.5 | −1.05 | Unknown |
| AOC3 | 8639 | 84 | 16 | 8 | 0.19 | 0.10 | 0.51 | 2.0 | −1.11 | Cell adhesion |
| SERPINE1 | 5054 | 81 | 42 | 9 | 0.52 | 0.11 | 0.22 | 4.7 | −1.86 | Regulation of mRNA stability |
| TXNIP | 10628 | 2659 | 64 | 320 | 0.02 | 0.12 | 5.01 | 0.2 | −0.90 | Negative regulation of transcription from RNA polymerase II |
| THAP2 | 83591 | 88 | 15 | 11 | 0.17 | 0.13 | 0.74 | 1.4 | −1.05 | Nucleic acid binding |
| SLC6A13 | 6540 | 122 | 46 | 18 | 0.38 | 0.15 | 0.39 | 2.6 | −1.37 | Transport |
| RFPL3S | 10737 | 31 | 11 | 6 | 0.35 | 0.18 | 0.53 | 1.8 | −1.25 | Unknown |
| 242708_at | --- | 44 | 9 | 8 | 0.20 | 0.19 | 0.95 | 1.1 | −1.01 | Unknown |
| SLC26A7 | 115111 | 24 | 4 | 5 | 0.14 | 0.19 | 1.31 | 0.8 | −0.95 | Gastric acid secretion |
| EGR3 | 1960 | 567 | 602 | 108 | 1.06 | 0.19 | 0.18 | 5.6 | −12.90 | Positive regulation of endothelial cell proliferation |
| SERTAD4 | 56256 | 40 | 14 | 8 | 0.35 | 0.20 | 0.58 | 1.8 | −1.23 | Unknown |
| 236865_at | --- | 117 | 7 | 24 | 0.06 | 0.21 | 3.55 | 0.3 | −0.84 | Unknown |
| ARRDC4 | 91947 | 1338 | 96 | 285 | 0.07 | 0.21 | 2.97 | 0.3 | −0.85 | Temperature homeostasis |
| MYEF2 | 50804 | 37 | 5 | 8 | 0.14 | 0.23 | 1.65 | 0.6 | −0.90 | Transcription, DNA-dependent |
| RYBP | 23429 | 63 | 31 | 15 | 0.49 | 0.24 | 0.49 | 2.1 | −1.49 | Negative regulation of transcription from RNA polymerase II promoter |
| 238548_at | 238548_at | 44 | 19 | 11 | 0.43 | 0.25 | 0.59 | 1.7 | −1.31 | Unknown |
LOC100130705 | 100130705 | 67 | 29 | 17 | 0.43 | 0.26 | 0.60 | 1.7 | −1.30 | Unknown |
| CYR61 | 3491 | 5396 | 1506 | 1419 | 0.28 | 0.26 | 0.94 | 1.1 | −1.02 | Regulation of cell growth |
| ZBTB1 | 22890 | 396 | 217 | 108 | 0.55 | 0.27 | 0.50 | 2.0 | −1.61 | Transcription, DNA-dependent |
| FOS | 2353 | 425 | 496 | 117 | 1.17 | 0.28 | 0.24 | 4.2 | −4.34 | Toll-like receptor signaling pathway |
| BC034636 /// CTB-113P19.4 | --- | 53 | 18 | 15 | 0.34 | 0.28 | 0.81 | 1.2 | −1.10 | Unknown |
| ANGPTL4 | 51129 | 393 | 89 | 111 | 0.23 | 0.28 | 1.25 | 0.8 | −0.93 | Angiogenesis |
UQCRB | 7381 | 47 | 14 | 14 | 0.30 | 0.30 | 1.02 | 1.0 | −0.99 | Oxidative phosphorylation |
| C1orf52 | 148423 | 171 | 56 | 52 | 0.33 | 0.30 | 0.93 | 1.1 | −1.04 | Unknown |
| Mean of Normalized Expression, Duplicates | Expression Ratios | Scaled eepR | ||||||||
|---|---|---|---|---|---|---|---|---|---|---|
| Gene Symbol | Entrez Gene number | LB control | WT Serratia | eepR mutant | WT/cont | eepR/cont | eepR/WT | WT/eepR | Biological Function | |
| TOMM40L | 84134 | 72 | 71 | 237 | 0.99 | 3.29 | 3.33 | 0.3 | 235.4 | Transport |
| ARL11 | 115761 | 18 | 19 | 51 | 1.01 | 2.75 | 2.72 | 0.4 | 161.0 | Intracellular protein transport |
| IGFL1 | 374918 | 170 | 173 | 420 | 1.02 | 2.47 | 2.43 | 0.4 | 83.3 | Protein binding |
| 227356_at | --- | 109 | 112 | 182 | 1.02 | 1.66 | 1.63 | 0.6 | 30.8 | Unknown |
| TMEM177 | 80775 | 125 | 120 | 221 | 0.96 | 1.76 | 1.84 | 0.5 | 18.5 | Membrane |
| TRIM14 | 9830 | 221 | 212 | 376 | 0.96 | 1.70 | 1.77 | 0.6 | 17.8 | Protein binding |
| ZSCAN16 | 80345 | 54 | 52 | 97 | 0.95 | 1.78 | 1.86 | 0.5 | 17.2 | Transcription, DNA-dependent |
| RITA1 | 84934 | 80 | 75 | 157 | 0.94 | 1.97 | 2.10 | 0.5 | 15.1 | Intracellular protein transport |
| KRT34 /// LOC100653049 | 3885 /// 100653049 | 202 | 220 | 463 | 1.09 | 2.29 | 2.11 | 0.5 | 14.8 | Epidermis development |
| CTSC | 1075 | 69 | 64 | 135 | 0.93 | 1.97 | 2.11 | 0.5 | 13.7 | T cell mediated cytotoxicity |
| FAM13B | 51306 | 128 | 121 | 218 | 0.95 | 1.70 | 1.80 | 0.6 | 13.1 | Signal transduction |
| CCDC8 | 83987 | 70 | 58 | 215 | 0.83 | 3.08 | 3.73 | 0.3 | 12.1 | Negative regulation of phosphatase activity |
| KIAA1586 | 57691 | 34 | 37 | 65 | 1.08 | 1.91 | 1.77 | 0.6 | 11.9 | Nucleic acid binding |
| COG8 /// PDF | 64146 /// 84342 | 199 | 217 | 384 | 1.09 | 1.93 | 1.77 | 0.6 | 10.7 | Translation |
| MTRR | 4552 | 418 | 449 | 708 | 1.07 | 1.69 | 1.58 | 0.6 | 9.4 | Sulfur amino acid metabolic process |
| SLC35F6 | 54978 | 125 | 141 | 269 | 1.13 | 2.15 | 1.91 | 0.5 | 9.1 | Establishment of mitotic spindle orientation |
| CXCL11 | 6373 | 121 | 100 | 287 | 0.83 | 2.38 | 2.87 | 0.3 | 8.1 | Positive regulation of leukocyte chemotaxis |
| HSD17B1 | 3292 | 83 | 103 | 234 | 1.24 | 2.82 | 2.28 | 0.4 | 7.6 | Lipid metabolic process |
| LOC284926 | 284926 | 8 | 13 | 44 | 1.63 | 5.55 | 3.41 | 0.3 | 7.2 | Unknown |
| NOP56 | 10528 | 206 | 233 | 384 | 1.13 | 1.87 | 1.65 | 0.6 | 6.5 | rRNA processing |
| * FAM86B1 | *55199 | 32 | 26 | 65 | 0.82 | 2.07 | 2.51 | 0.4 | 6.1 | Unknown |
| JMJD4 | 65094 | 38 | 56 | 146 | 1.48 | 3.82 | 2.58 | 0.4 | 5.9 | Protein binding |
| PPAPDC2 | 403313 | 67 | 85 | 156 | 1.26 | 2.33 | 1.84 | 0.5 | 5.0 | Metabolic process |
| AIMP2 | 7965 | 1059 | 966 | 1505 | 0.91 | 1.42 | 1.56 | 0.6 | 4.8 | Translation |
| ZNF165 | 7718 | 184 | 220 | 358 | 1.20 | 1.95 | 1.63 | 0.6 | 4.8 | Transcription, DNA-dependent |
| Mean of Normalized Expression, Duplicates | Expression Ratios | Scaled eepR | ||||||||
|---|---|---|---|---|---|---|---|---|---|---|
| Gene Symbol | Entrez Gene number | LB control | WT Serratia | eepR mutant | WT/cont | eepR/cont | eepR/WT | WT/eepR | (eepR—cont) |(WT—cont)| | Biological Function |
| NUFIP2 | 57532 | 1790 | 1786 | 1204 | 1.00 | 0.67 | 0.67 | 1.5 | −144.7 | Protein binding |
| ZFP36L2 | 678 | 3551 | 3536 | 2305 | 1.00 | 0.65 | 0.65 | 1.5 | −83.9 | Regulation of transcription, DNA dependent |
| TUFT1 | 7286 | 1322 | 1329 | 818 | 1.01 | 0.62 | 0.62 | 1.6 | −74.7 | Protein binding |
| PARD6B | 84612 | 495 | 491 | 230 | 0.99 | 0.46 | 0.47 | 2.1 | −59.7 | Protein complex assembly |
| GPR157 | 80045 | 364 | 359 | 208 | 0.99 | 0.57 | 0.58 | 1.7 | −33.0 | Signal transduction |
| ARPC5L | 81873 | 1049 | 1062 | 602 | 1.01 | 0.57 | 0.57 | 1.8 | −32.4 | Regulation of actin filament polymerization |
| JUN | 3725 | 1312 | 1338 | 621 | 1.02 | 0.47 | 0.46 | 2.2 | −27.1 | Angiogenesis |
| DUSP6 | 1848 | 3965 | 3858 | 1638 | 0.97 | 0.41 | 0.42 | 2.4 | −21.6 | Inactivation of MAPK activity |
| CD274 | 29126 | 373 | 386 | 184 | 1.04 | 0.49 | 0.48 | 2.1 | −14.4 | Immune response |
| EGR3 | 1960 | 567 | 602 | 108 | 1.06 | 0.19 | 0.18 | 5.6 | −12.9 | Positive regulation of endothelial cell proliferation |
| 1555897_at | --- | 89 | 85 | 47 | 0.96 | 0.53 | 0.55 | 1.8 | −11.9 | Unknown |
| CHMP1B | 57132 | 220 | 227 | 145 | 1.03 | 0.66 | 0.64 | 1.6 | −11.4 | Cytokinesis |
| FHL2 | 2274 | 2117 | 2058 | 1460 | 0.97 | 0.69 | 0.71 | 1.4 | −11.3 | Negative regulation of transcription from RNA polymerase II promoter |
| E2F7 | 144455 | 1501 | 1411 | 612 | 0.94 | 0.41 | 0.43 | 2.3 | −10.0 | Negative regulation of transcription from RNA polymerase II promoter |
SLC2A14 /// SLC2A3 | 6515 /// 144195 | 358 | 342 | 203 | 0.96 | 0.57 | 0.59 | 1.7 | −9.8 | Carbohydrate metabolic process |
| PHF13 | 148479 | 631 | 661 | 347 | 1.05 | 0.55 | 0.52 | 1.9 | −9.5 | Mitotic cell cycle |
| JAG1 | 182 | 3839 | 3973 | 2726 | 1.03 | 0.71 | 0.69 | 1.5 | −8.3 | Angiogenesis |
| SERTAD1 | 29950 | 1254 | 1334 | 653 | 1.06 | 0.52 | 0.49 | 2.0 | −7.5 | Regulation of cyclin-dependent protein serine/threonine kinase activity |
| KIAA0907 | 22889 | 1868 | 1755 | 1034 | 0.94 | 0.55 | 0.59 | 1.7 | −7.4 | Unknown |
| SOS1 | 6654 | 442 | 467 | 268 | 1.06 | 0.61 | 0.58 | 1.7 | −7.1 | Apoptotic process |
| C16orf72 | 29035 | 2072 | 2169 | 1411 | 1.05 | 0.68 | 0.65 | 1.5 | −6.8 | Unknown |
| RND3 | 390 | 1928 | 1794 | 1126 | 0.93 | 0.58 | 0.63 | 1.6 | −6.0 | GTP catabolic process |
| SMAD7 | 4092 | 271 | 290 | 158 | 1.07 | 0.58 | 0.54 | 1.8 | −5.7 | Negative regulation of transcription from RNA polymerase II promoter |
| ADAMTS6 | 11174 | 171 | 187 | 86 | 1.10 | 0.50 | 0.46 | 2.2 | −5.1 | Proteolysis |
| FZD7 | 8324 | 63 | 60 | 31 | 0.89 | 0.45 | 0.50 | 2.0 | −5.0 | Wnt signaling |
| Canonical Pathway. | −log(p-Value) | Number Genes up-Regulated | Number Genes down-Regulated | Total Genes in Pathway |
|---|---|---|---|---|
| IL-6 Signaling | 8.4 | 20 | 1 | 116 |
| Toll-like Receptor Signaling | 7.9 | 16 | 1 | 72 |
| NF-kB Signaling | 7.0 | 22 | 1 | 164 |
| Colorectal Cancer Metastasis Signaling | 5.4 | 20 | 1 | 230 |
| PPAR Signaling | 5.0 | 14 | 1 | 90 |
| TREM1 Signaling | 4.9 | 12 | 1 | 69 |
| HMGB1 Signaling | 4.8 | 15 | 1 | 118 |
| Acute Phase Response Signaling | 4.6 | 18 | 1 | 166 |
| Role of Pattern Recognition Receptors in Recognition of Bacteria and Viruses | 4.2 | 13 | 1 | 118 |
| Cholecystokinin/Gastrin-mediated Signaling | 3.3 | 11 | 1 | 99 |
| B Cell Activating Factor Signaling | 3.1 | 7 | 1 | 40 |
| LXR/RXR Activation | 3.1 | 12 | 1 | 120 |
| Pancreatic Adenocarcinoma Signaling | 3.0 | 10 | 1 | 106 |
| Glioma Invasiveness Signaling | 2.8 | 7 | 1 | 57 |
| Cell Cycle: G2/M DNA Damage Checkpoint Regulation | 2.6 | 1 | 1 | 49 |
| NF-kB Activation by Viruses | 2.1 | 7 | 1 | 73 |
| NRF2-mediated Oxidative Stress Response | 2.0 | 12 | 1 | 175 |
| CXCL8 Signaling | 1.9 | 13 | 1 | |
| Tec Kinase Signaling | 1.8 | 10 | 2 | 183 |
| MIF Regulation of Innate Immunity | 1.8 | 5 | 0 | 150 |
| iNOS Signaling | 1.6 | 5 | 0 | 39 |
| Antioxidant Action of Vitamin C | 1.6 | 8 | 0 | 43 |
| PPARα/RXRα Activation | 1.5 | 12 | 0 | 91 |
| Phospholipase C Signaling | 1.3 | 13 | 1 | 165 |
Publisher’s Note: MDPI stays neutral with regard to jurisdictional claims in published maps and institutional affiliations. |
© 2021 by the authors. Licensee MDPI, Basel, Switzerland. This article is an open access article distributed under the terms and conditions of the Creative Commons Attribution (CC BY) license (https://creativecommons.org/licenses/by/4.0/).
Share and Cite
Brothers, K.M.; Harvey, S.A.K.; Shanks, R.M.Q. Transcription Factor EepR Is Required for Serratia marcescens Host Proinflammatory Response by Corneal Epithelial Cells. Antibiotics 2021, 10, 770. https://doi.org/10.3390/antibiotics10070770
Brothers KM, Harvey SAK, Shanks RMQ. Transcription Factor EepR Is Required for Serratia marcescens Host Proinflammatory Response by Corneal Epithelial Cells. Antibiotics. 2021; 10(7):770. https://doi.org/10.3390/antibiotics10070770
Chicago/Turabian StyleBrothers, Kimberly M., Stephen A. K. Harvey, and Robert M. Q. Shanks. 2021. "Transcription Factor EepR Is Required for Serratia marcescens Host Proinflammatory Response by Corneal Epithelial Cells" Antibiotics 10, no. 7: 770. https://doi.org/10.3390/antibiotics10070770
APA StyleBrothers, K. M., Harvey, S. A. K., & Shanks, R. M. Q. (2021). Transcription Factor EepR Is Required for Serratia marcescens Host Proinflammatory Response by Corneal Epithelial Cells. Antibiotics, 10(7), 770. https://doi.org/10.3390/antibiotics10070770