Article

Separation and Detection of Escherichia coli and Saccharomyces cerevisiae Using a Microfluidic Device Integrated with an Optical Fibre

1
Department of Chemical and Environmental Engineering, University Putra Malaysia, Selangor 43400, Malaysia
2
Department of Computer and Communications Engineering, University Putra Malaysia, Selangor 43400, Malaysia
3
Department of Electrical and Electronic Engineering, University Putra Malaysia, Selangor 43400, Malaysia
*
Author to whom correspondence should be addressed.
These authors contributed equally to this work.
Biosensors 2019, 9(1), 40; https://doi.org/10.3390/bios9010040
Submission received: 26 December 2018 / Revised: 3 March 2019 / Accepted: 5 March 2019 / Published: 14 March 2019

Abstract

:
This paper describes the development of an integrated system using a dry film resistant (DFR) microfluidic channel consisting of pulsed field dielectrophoretic field-flow-fractionation (DEP-FFF) separation and optical detection. The prototype chip employs the pulse DEP-FFF concept to separate the cells (Escherichia coli and Saccharomyces cerevisiae) from a continuous flow, and the rate of release of the cells was measured. The separation experiments were conducted by changing the pulsing time over a pulsing time range of 2–24 s and a flow rate range of 1.2–9.6 μ L min 1 . The frequency and voltage were set to a constant value of 1 M Hz and 14 V pk-pk, respectively. After cell sorting, the particles pass the optical fibre, and the incident light is scattered (or absorbed), thus, reducing the intensity of the transmitted light. The change in light level is measured by a spectrophotometer and recorded as an absorbance spectrum. The results revealed that, generally, the flow rate and pulsing time influenced the separation of E. coli and S. cerevisiae. It was found that E. coli had the highest rate of release, followed by S. cerevisiae. In this investigation, the developed integrated chip-in-a lab has enabled two microorganisms of different cell dielectric properties and particle size to be separated and subsequently detected using unique optical properties. Optimum separation between these two microorganisms could be obtained using a longer pulsing time of 12 s and a faster flow rate of 9.6 μ L min 1 at a constant frequency, voltage, and a low conductivity.

1. Introduction

Chip-in-a-lab commonly contains many important components including separation and sensing elements. According to a definition provided by [1,2], chip-in-a-lab requires the use of ancillary equipment and bulky supporting instrumentation such as fluidic pumps and high-current power supplies. While both chip-in-a-lab and lab-on-a-chip are categorised under micro total analysis systems, the former requires bulky equipment such as pumps while the latter uses the small size of the individual components in a chip. Many research reports on the applications of chip-in-a-lab were aimed at the separation of particle [3,4], bacteria [5,6] and cells [7,8].
The advantages of chip-in-a-lab over conventional identification are that the device can integrate and miniaturize sorting and detecting processes in a similar platform that can reduce labour, and lower volume and duration [9]. Furthermore, requiring lower volumes of reagents significantly lowers the cost, which is an important concern in clinical laboratories [10]. On the other hand, there is comprehensive research on the single system instead of the integrated system in chip-in-a-lab. This is due to the fact that it might be easier to fabricate a single system compared to an integrated system of chip-in-a-lab. However, surface modification is one of the main challenges in the fabrication of a chip-in-a-lab [11,12]. This study falls in the category of chip-in-a-lab.
Microfluidic is the manipulation of fluids at a microscale level and commonly uses electrokinetic and hydrodynamic forces to sort particles [13]. Dielectrophoresis is a branch of electrokinetics that uses microorganism/cell unique dielectric properties to yield different microorganism behaviour when subjected under non-uniform AC electric fields. On the other hand, field-flow fractionation is a separation principle that is based on the size of particles using drag flow [14]. When FFF is used in combination with DEP, the microorganism can be separated by means of different factors; such as diffusion, hydrodynamic, dielectric and other effects that eventually produces a net effect on the microorganism. This technique has a wide range of applications: it can enable efficient cell manipulation [15,16] and reduces the complexity of the LoC [17]. However, this approach is insensitive to the separation of two microorganisms with similar size and density [18,19]. Furthermore, dielectrophoresis commonly uses high frequency AC voltages which can produce Joule heating and damage the cell [20].
Meanwhile, optical techniques play a vital role in the chemical and biochemical analysis and thus, have a high possibility to be integrated in lab-on-a-chip microsystems [21,22]. In recent years, there has been an increasing interest in microsystems based on external light sources and photo-detectors [23]. A wide range of optical sensor systems have been employed for bacterial detection including high-index waveguide sensors [24], surface plasmon resonance sensors [25,26] and fibre optic techniques [27,28]. Optical methods have many advantages for a promising and reliable real-time bacterial detection. These advantages include their abilities to be miniaturised, flexibility for multiplexing [29] and producing rapid response times with high sensitivity for analyte evaluation [30]. The development of multi-analyte detection paves the way towards integrated biosensor design. High throughput analysis demands the detection of multiple analytes which suits very well with the optical method’s capabilities as mentioned earlier. Optical detection is preferred for robust and sensitive chip-in-a-lab because of the limitations of electrochemical and mechanical techniques. Previous development of chip-in-a-lab systems which contained electrochemical and optical based methods often suffered from drawbacks such as the complexity of integration and the lack of sensitivity [31,32]. However, on another note, others have reported that it can easily be miniaturized and incorporated into microfluidic systems using a simple design [33,34]. Zinoviev and co-workers showed that a microfluidic device based on integrated Bimodal Waveguides (BiMW) can be produced with a simplified fabrication process by neglecting the need for a reference arm [35].
This work aims to fabricate a chip-in-a-lab to produce a particle fractionation and detection system. The device employs an interdigitated microelectrode and embedded fibre optics for particle separation and detection. The device employs DEP-FFF and photonics technology for the fractionation and detection of microorganism inside a microfluidic device respectively. Furthermore, the functionality of the chip-in-a-lab was verified experimentally using S. cerevisiae and E. coli. In this study, the performance of the integrated device was characterized in terms of the comparison of the rate of release and the percentage of cumulative absorbance. The study offers some fresh insights into the potential of the chip-in-a-lab as a biosensor with a cheap and user-friendly device with a less complicated fabrication.

2. Materials and Methods

2.1. Preparation of Microorganism

E. coli (strain BL21) strains were grown overnight in Luria-Bertani (LB) Miller broth and on LB Miller agar at 37 in a shaker at 150 rpm. After the inoculation process, the solution was transferred and centrifuged three times at 8000 rpm for 3 min using a high-speed centrifuge (Model D-37520 Osterode, Kendro Heraeus, Germany). The supernatant was removed and replaced with distilled water after each centrifugation process. The centrifugation process was necessary to remove unwanted particles and to obtain a low and stable value of low conductivity.
Dry yeast (S. cerevisiae) was used as the source of S. cerevisiae yeasts. An amount of 0.1 g of yeast powder was dissolved in 10 mL of distilled water (DI) water and kept in a water bath for 30 min to produce the live yeast solution. The live yeast solution was centrifuged at 8000 rpm for 3 min using a high-speed centrifuge. The supernatant was discharged and the pallets were resuspended by pipetting 10 mL of DI water. This procedure was repeated three times to eliminate unwanted particles and to reach a low and stable value of low conductivity. The number of cells was 2.25 × 10 8 cells/ m L measured by a standard haemocytometer technique.

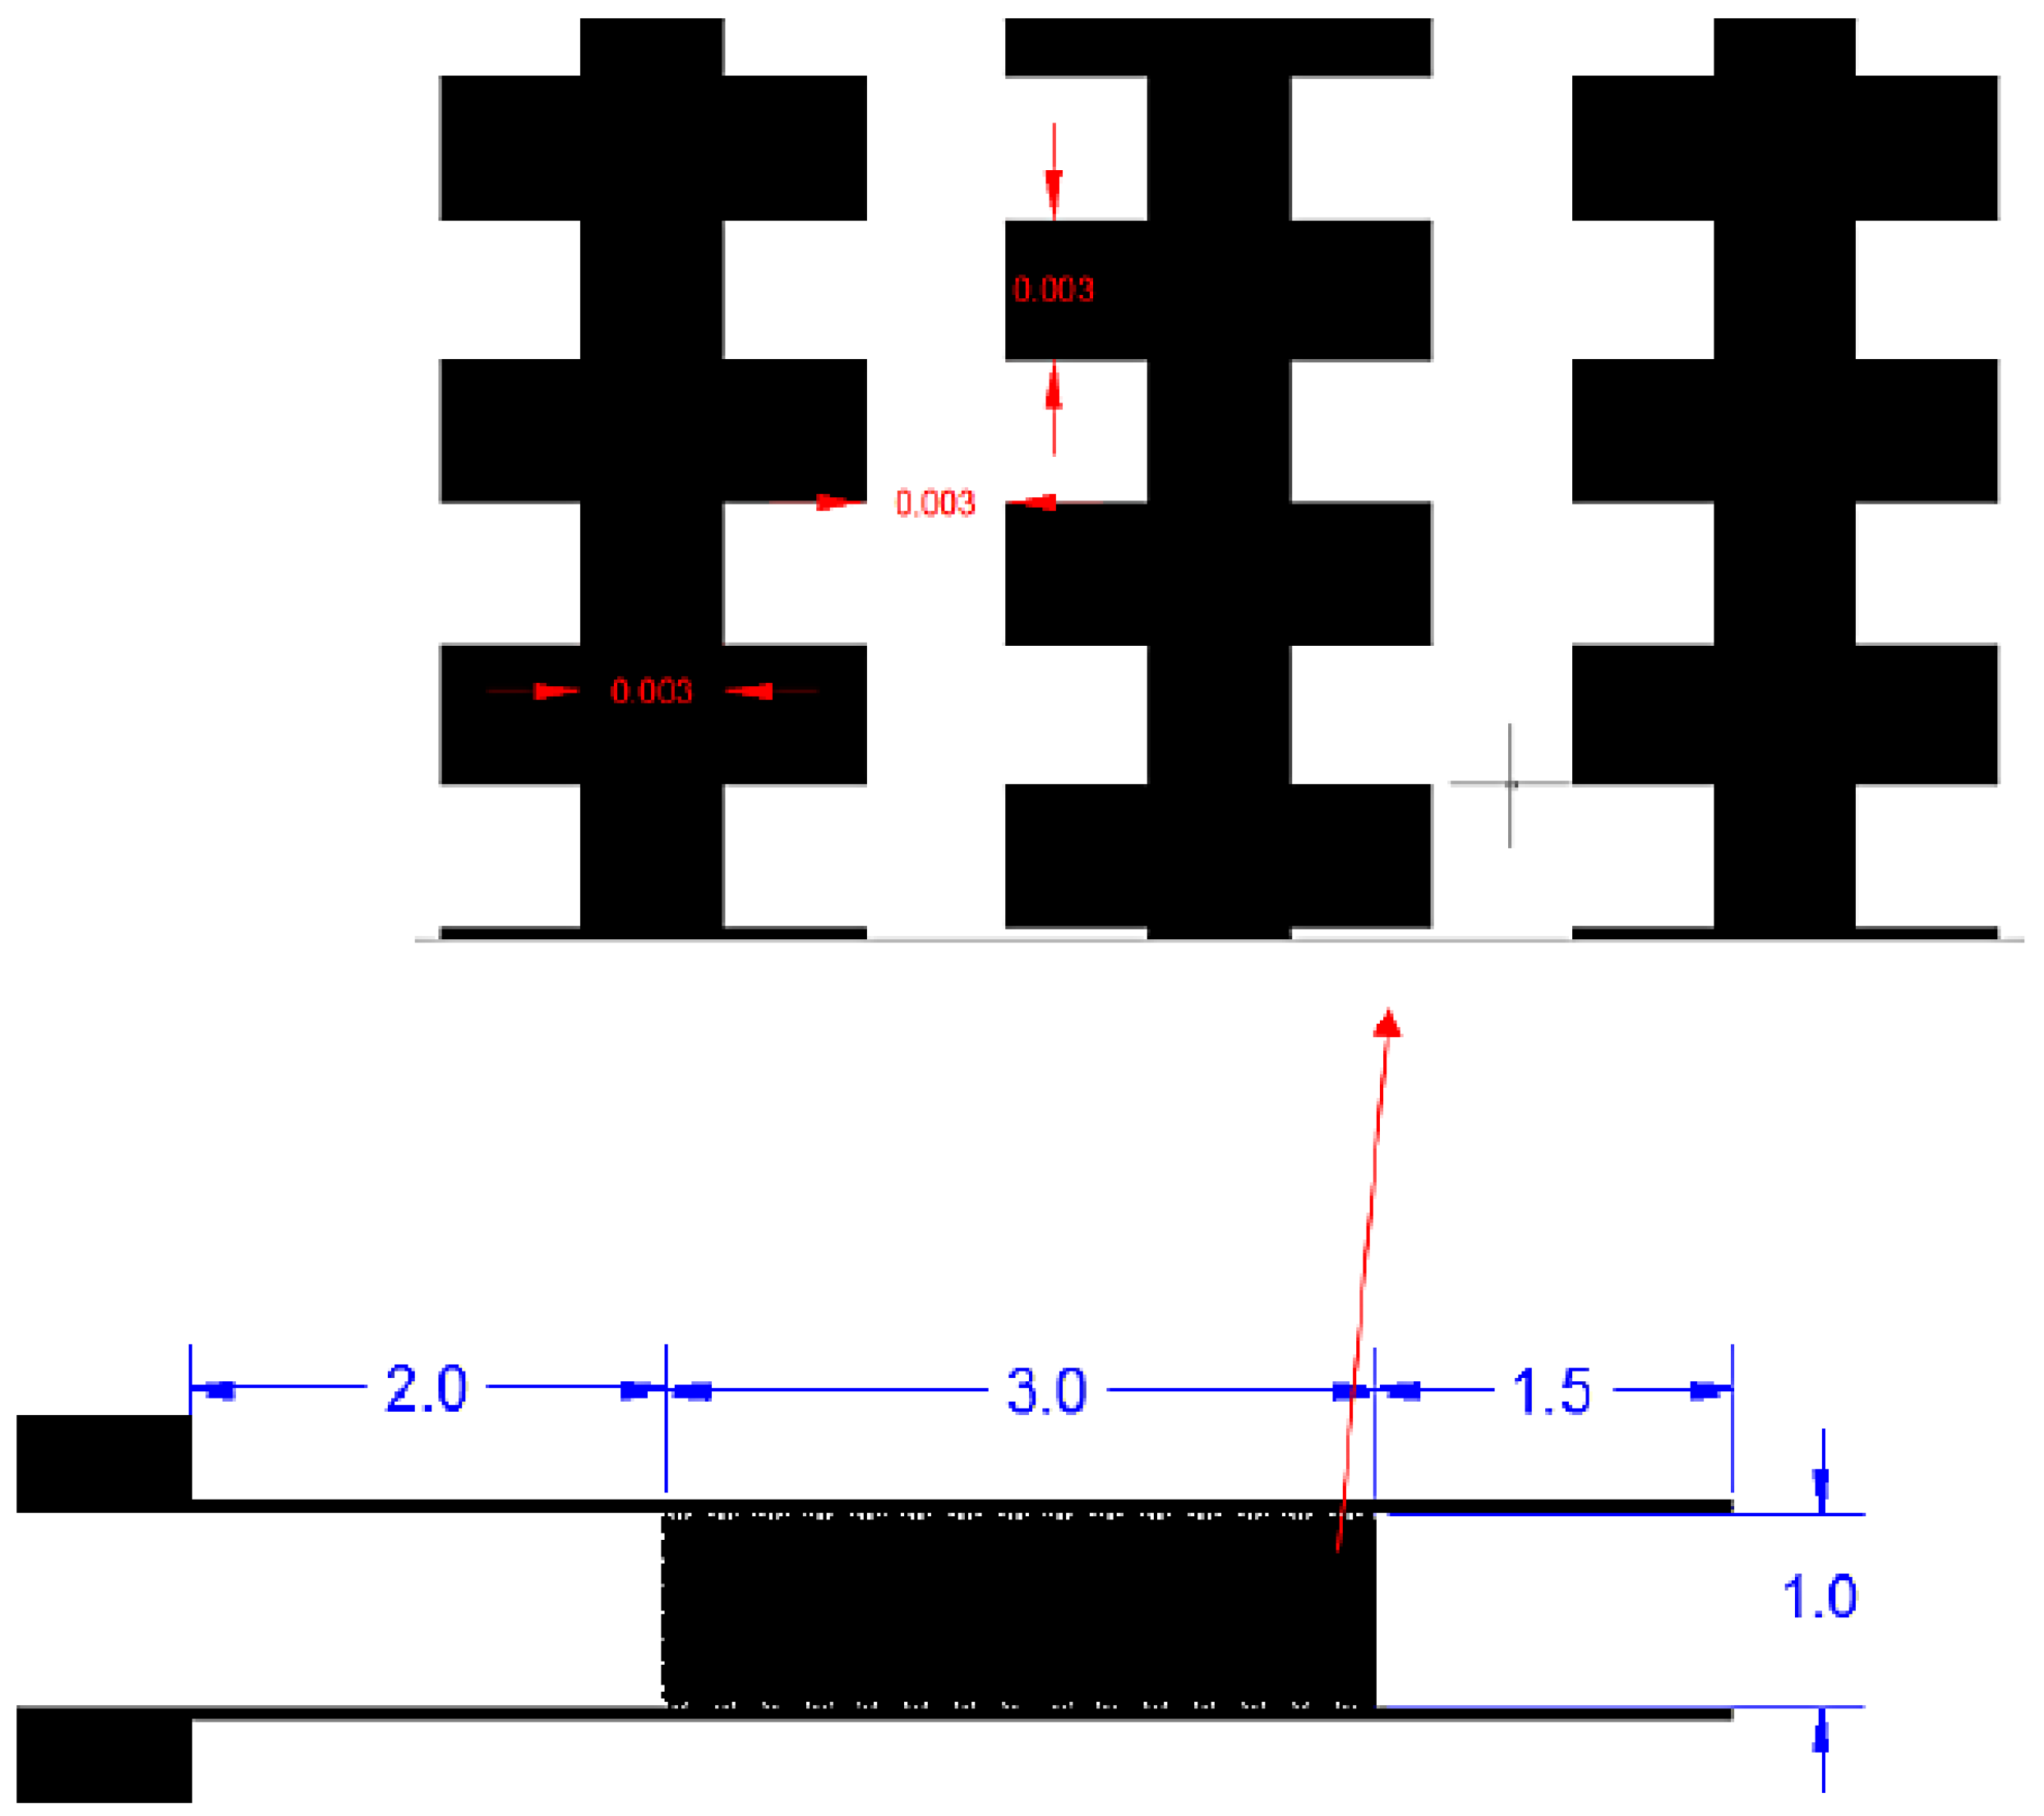
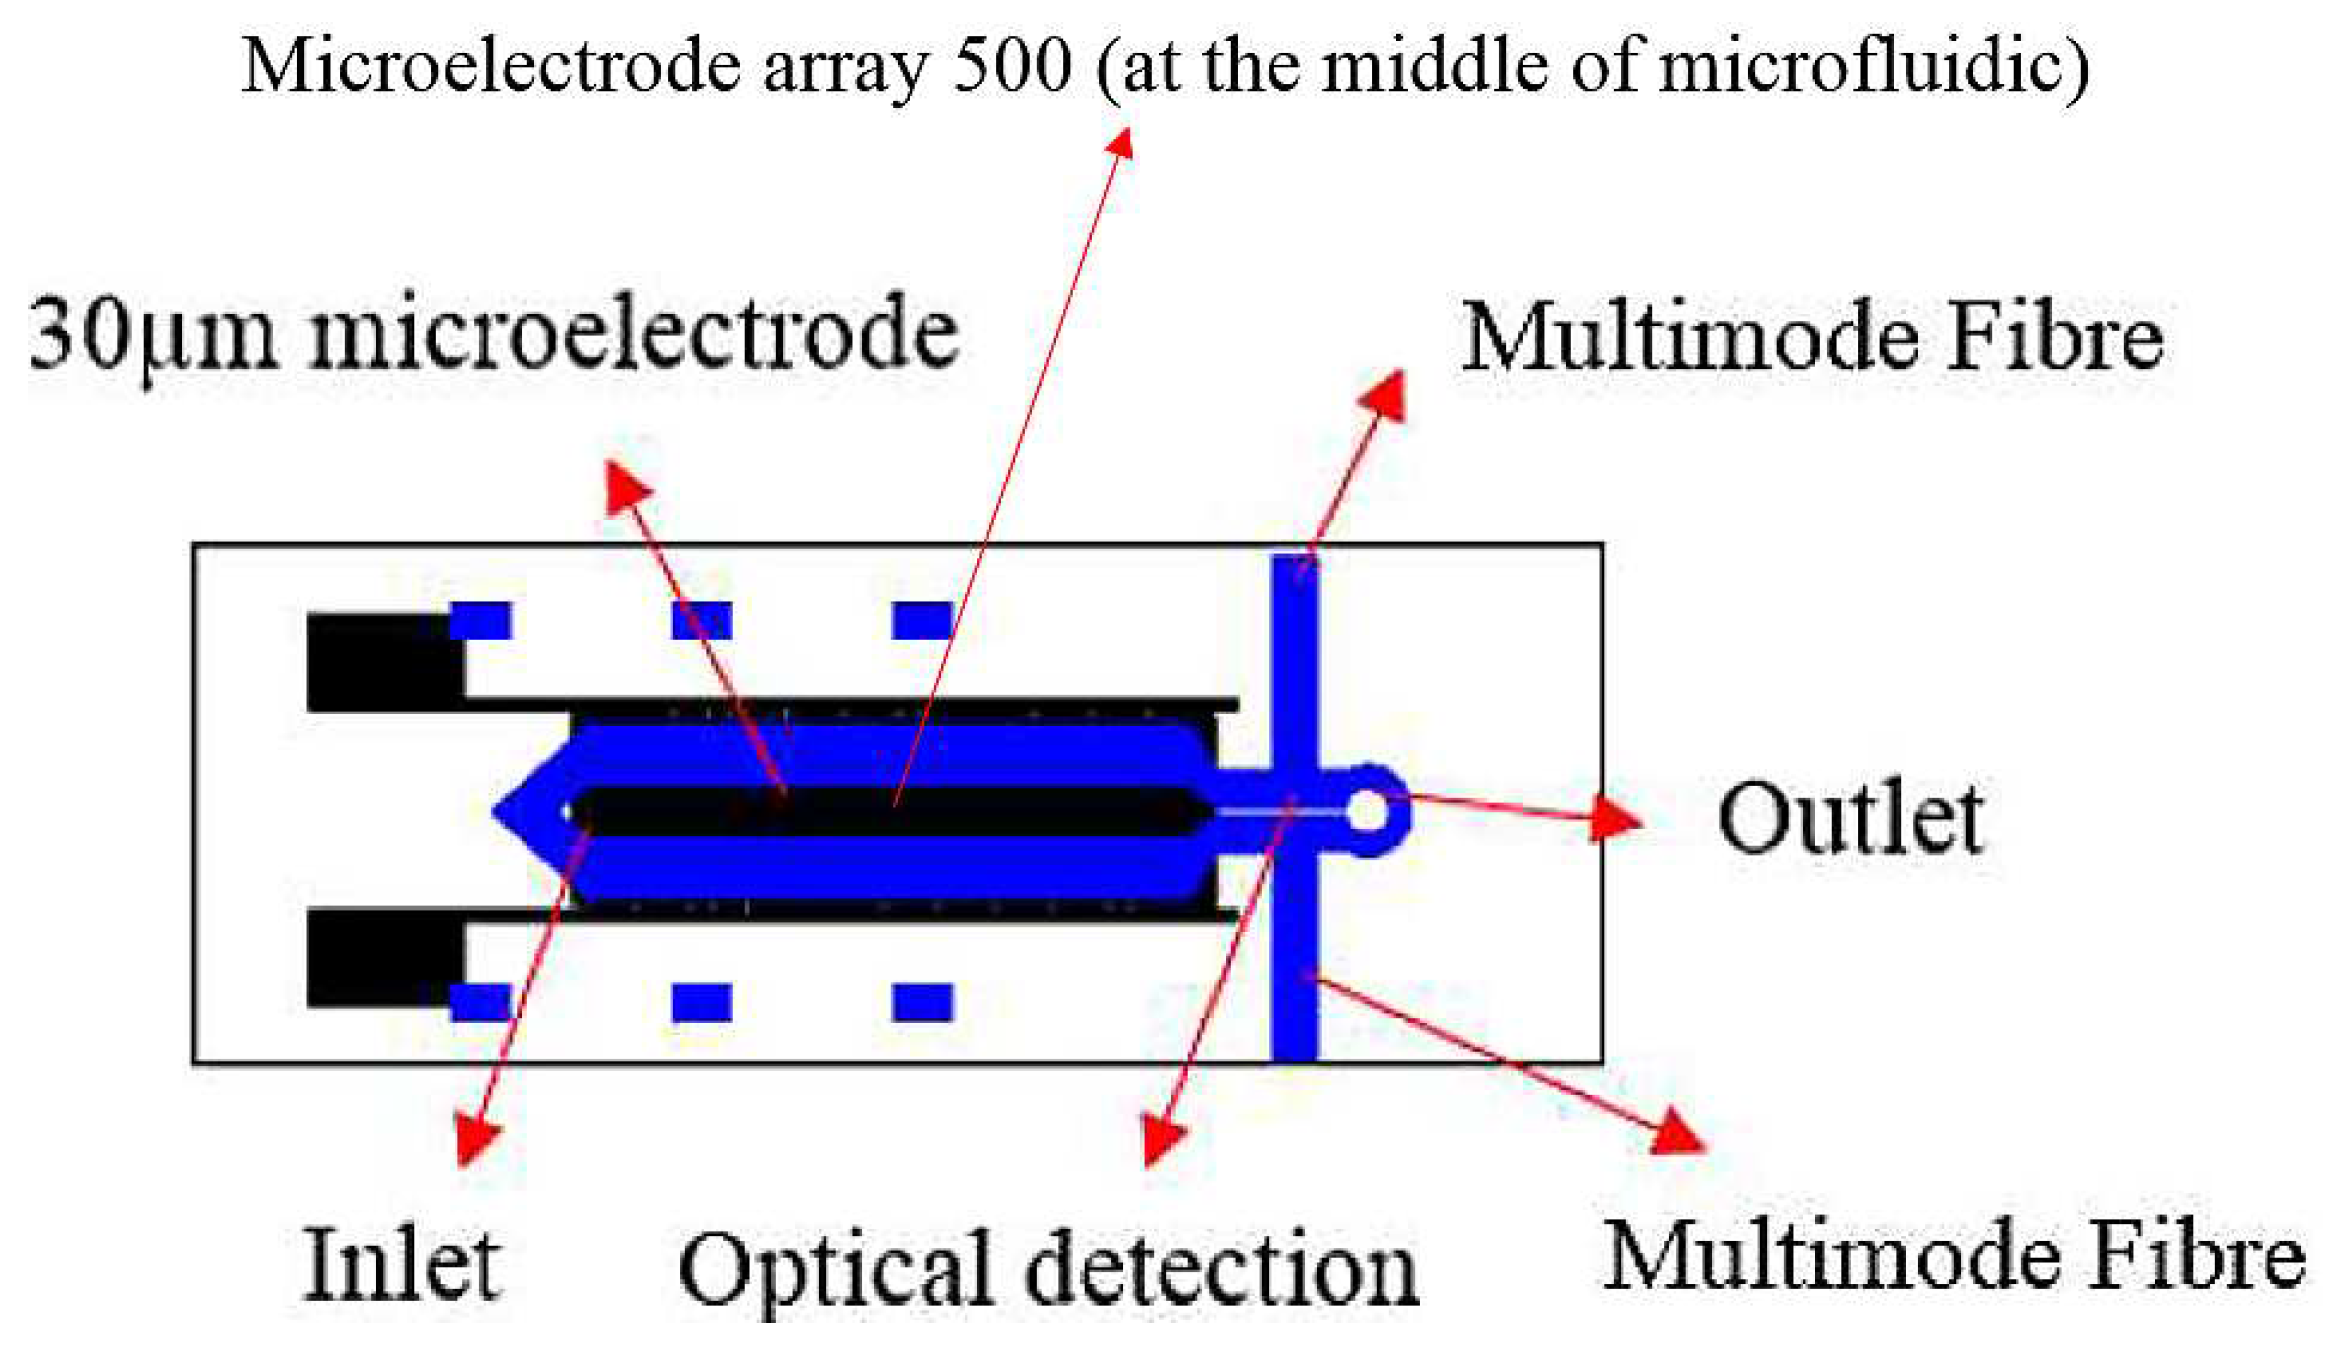
2.2. Design and Fabrication of the Chip-in-a-Lab

The microelectrode system was constructed using photolithography fabrication techniques. All the equipment and facilities were located at Telekom Research and Development Sdn Bhd, Cyberjaya, Selangor, Malaysia. The microelectrode was designed using the AutoCAD 2007 program (Figure 1). The size of the interdigitated castellated microelectrode and the gap between the arrays of microelectrodes was designed to be 30 μ m due to the limitation of the fabrication machine. Meanwhile, a microelectrode of 250 n m in height, 1 c m in width was formed by deposition of titanium (Ti) and gold (Au).
The interdigitated microelectrodes were fabricated on a glass substrate ( 24.0 m m × 60.0 m m × 3.0 m m ). The commonly used AZ 1518 positive photoresist was used as the etching mask in this work. A standard photolithographic process was adopted to fabricate 30 μ m sized microelectrodes.
The microfluidic channel was fabricated on a glass substrate using dry film resist (DFR) (Ordyl Alpha 940) by soft lithography. The microfluidic fabrication was prepared according to the procedure used by [36,37]. For the patterning processes, microstructures were designed in the Autocad program and fabricated on a negative mask (Figure 2).
The design of the microfluidics was produced on DFR using transparencies printed by a high resolution printer as a photomask. The microfluidic channel was designed and fabricated on two glass substrates (one substrate had a microelectrode fabricated on it from the previous experiment) using a photolithography method. Based on the design, the inlet and outlet holes were drilled using a Dremel tool with a diamond drill bit. The design of the channel was divided into two parts; namely; separation and detection and contained one inlet and one outlet to allow the fluid to flow into and out of the channel.

2.3. Alignment of Multimode Fibre Pigtail for Optical Detection

In this work, the author used a ST multimode fibre pigtail as the transduction platform. The fibre core and cladding diameters were 62.5 μ m and 125.0 μ m respectively. The multimode pigtail was purchased from Ingellen Technology Co (Shenzhen, China). Initially, the multimode pigtail was cut using a fibre cleaver (FC-6RS, Sumitomo Electric, Osaka, Japan) in typically 5 c m lengths. Then, the thin plastic coatings of the bare fibres were stripped off with a fibre stripper. Once the cleaving process was finished, the fibres were cleaned with a Kimwipe soaked in ethanol. The fibres were then inserted and secured in placed on the DFR.
Fibre alignment was performed by measuring the transmittance output from the input multimode pigtail. Aligning the output multimode pigtail directly to the input multimode pigtail and bringing the two ends together as close as possible served as the base calibration factor for any power losses incurred by the multimode pigtail ends. The multimode pigtail output then was observed in real time using the transmittance spectra. By fine-tuning using a ball bearing vertical linear stage (Model MVN50, Newport Corporation, Irvine, CA, USA) and observing the corresponding transmittance spectra, precise alignment could be accomplished when the reading was tuned to the maximum value. The alignment used in this study is shown in Figure 3.
Once the multimode pigtail alignments were finished, these substrates were set to face each other. They were clipped at the end to prevent any movement. After clipping, the substrates were placed in the oven. The substrates were conditioned at 200 C for 1 h prior to the curing process. If the channel had leakage after the bonding process, UV glue was used to cover the area that leaked. The UV glue was applied at the side of the glass. The microfluidic was then exposed to UV light in an UV exposure machine for about 20 s to cure the UV glue. Finally, a channel with a height of 125 μ m , width up to 0.2 c m and integrated with 30 μ m microelectrode and fibre optic multimode pigtail was fabricated.

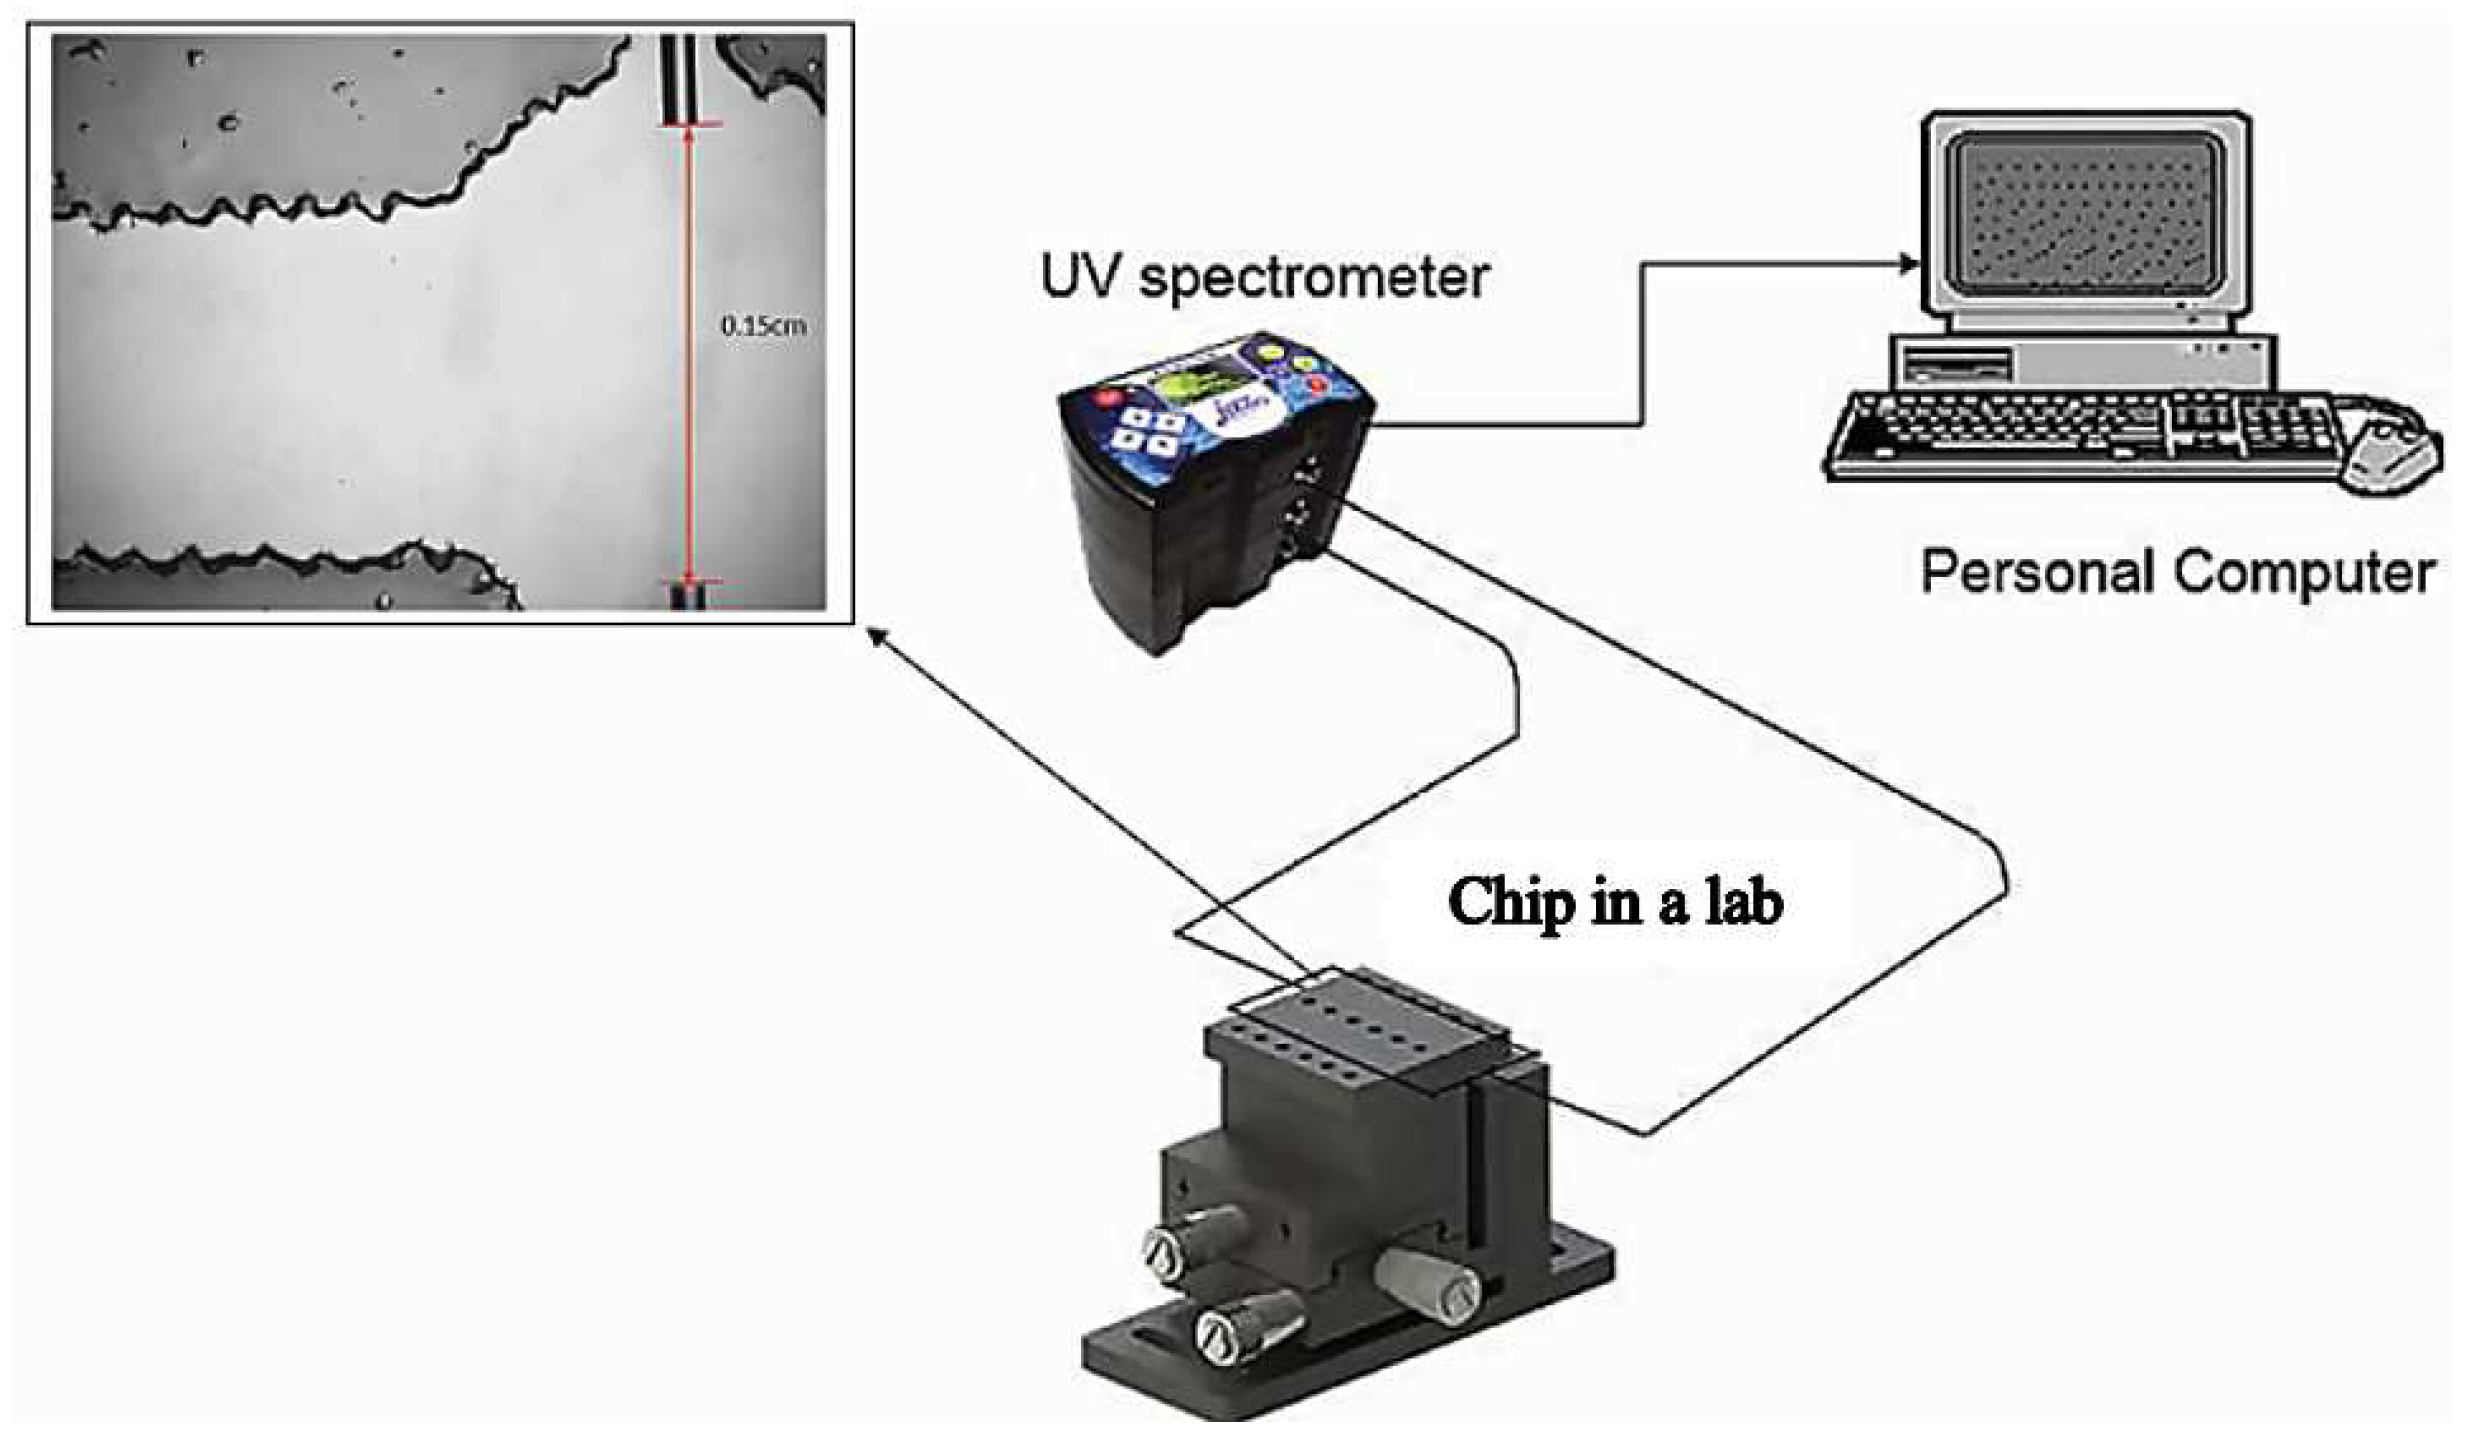
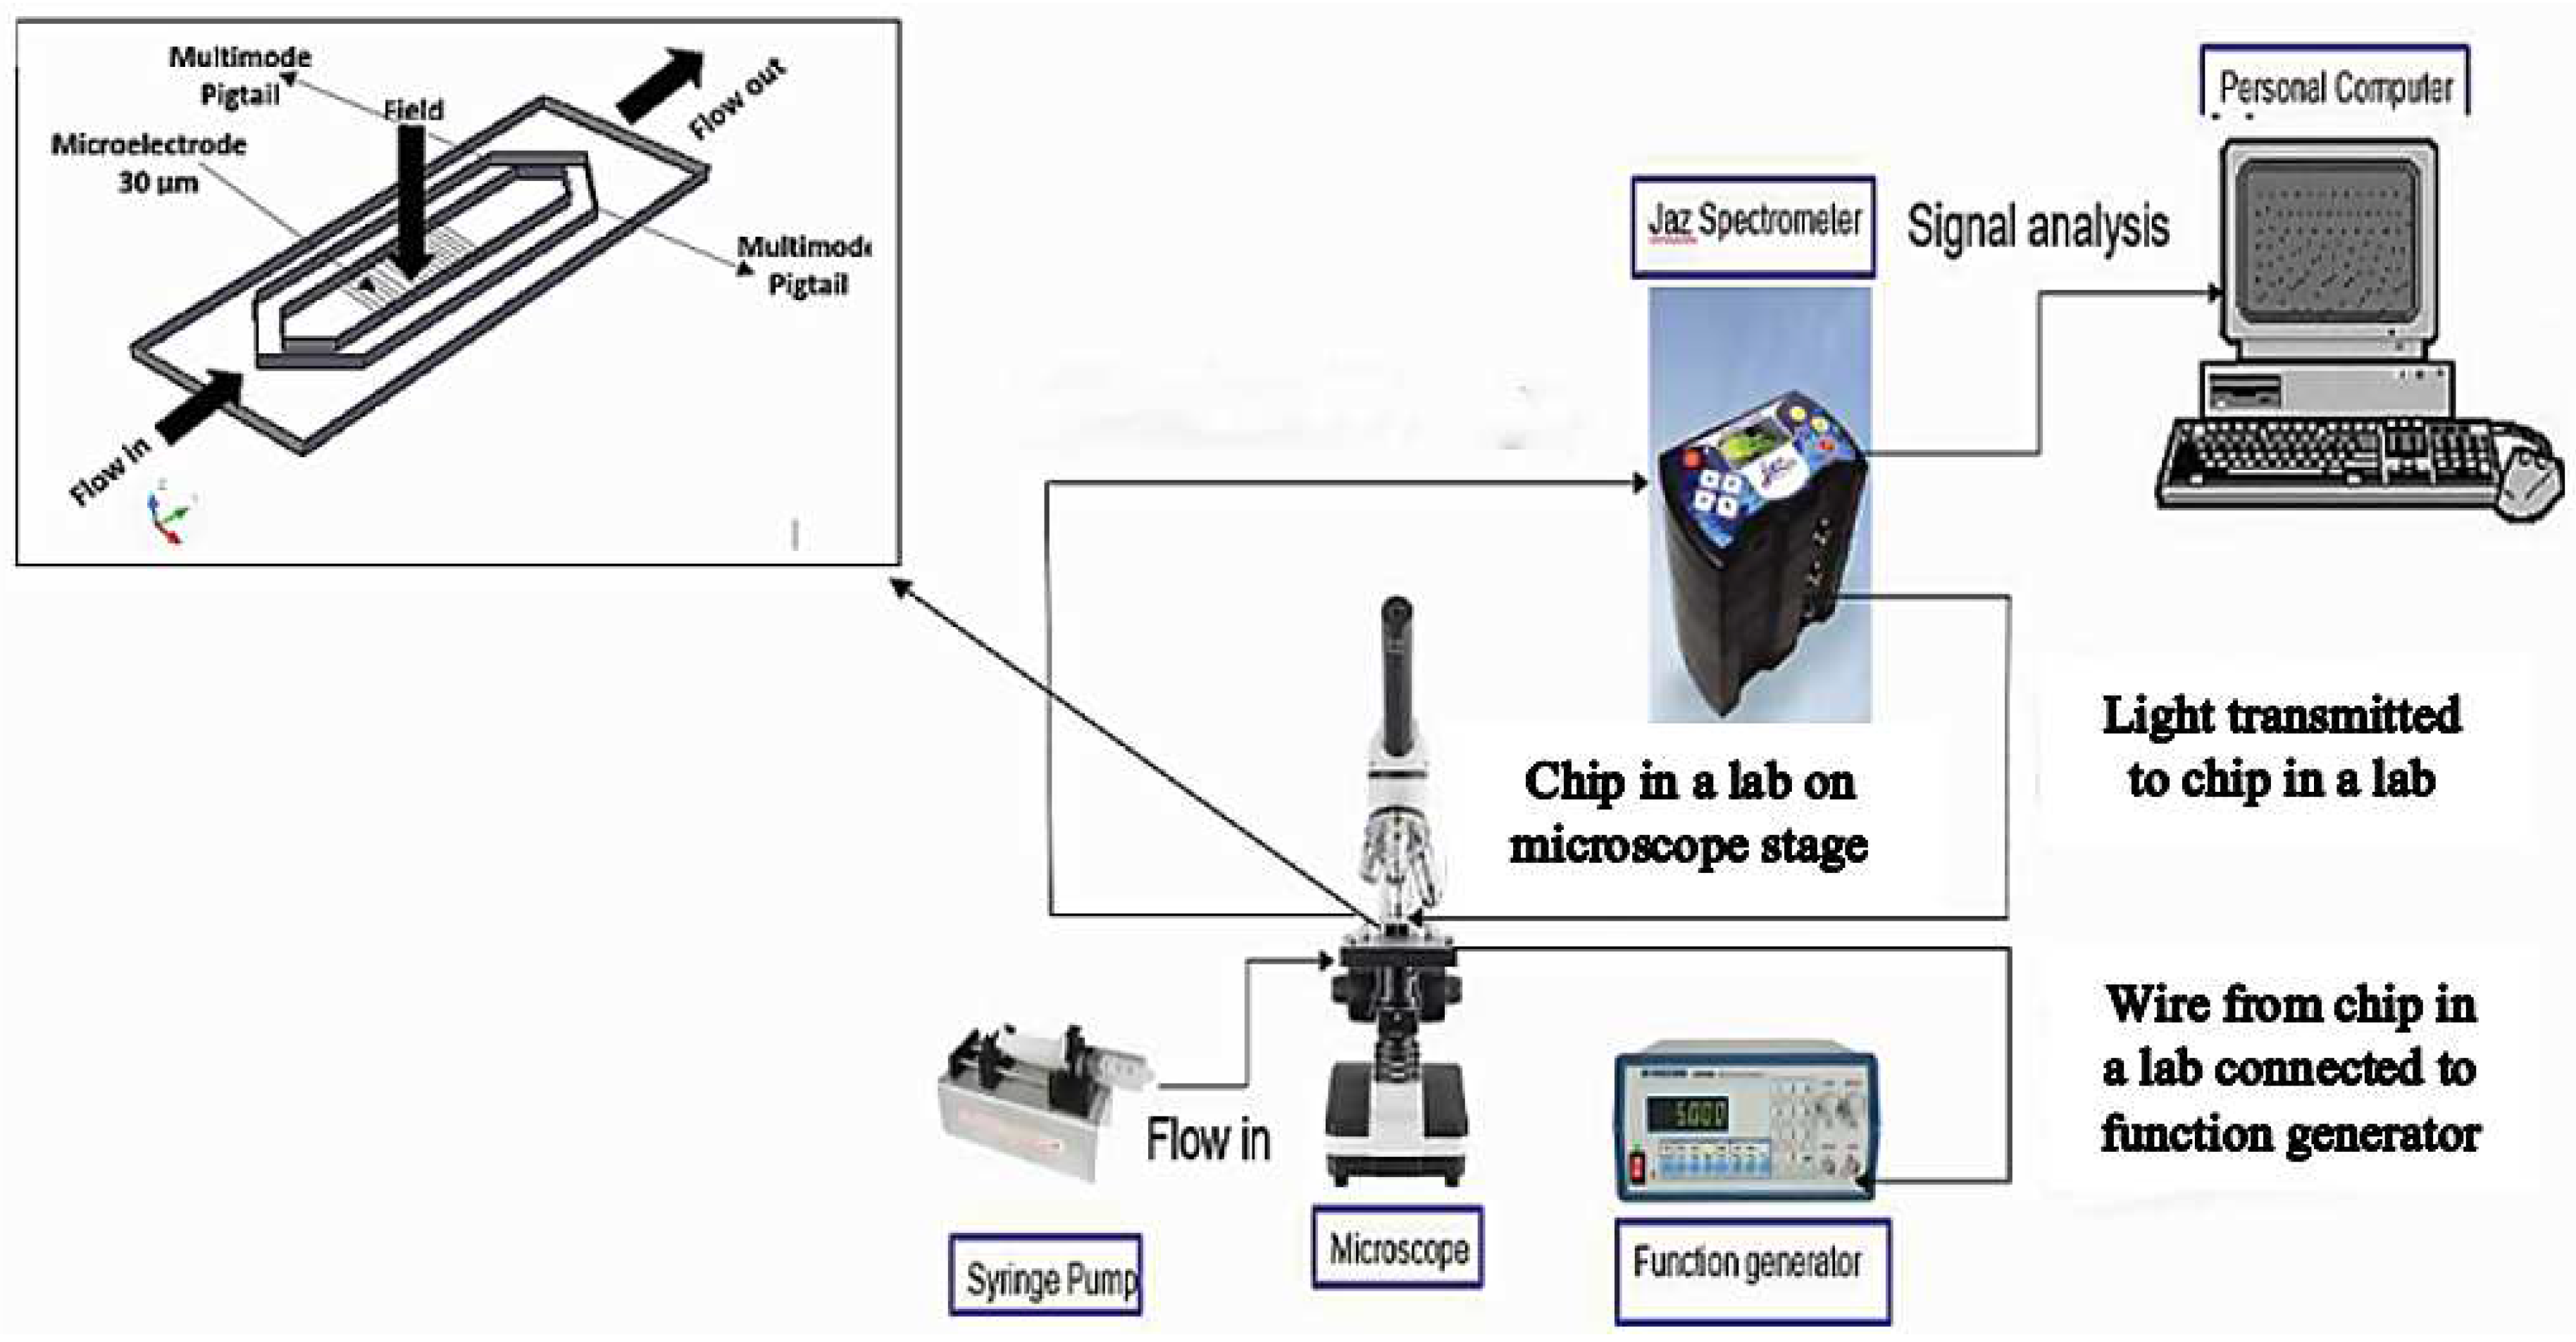
2.4. Experimental Setup

The experimental setup for the chip-in-a-lab is shown in Figure 4. After sample preparation, a low concentration of bacterial and yeast cells with an OD of 0.3 and 0.5 respectively were inserted into the microfluidic using a syringe and a BASI pump (Model MD-1001, Bioanalytical Systems Inc., West Lafayette, IN, USA).
At the beginning of DEP-FFF separation, a 1 M Hz signal with a voltage of 14 V pk-pk was applied to the microelectrode using a waveform generator (Model 33500B Series, Agilent, Santa Clara, CA, USA). The cells were attracted to the microelectrode and photographed by the CCD camera. The cells that were not captured at the microelectrode were then flushed out to the optical detection channel. After 30 min, a pulsed DEP-FFF separation was carried out by using a waveform generator under continuous fluid flow. The pulsing times and flow rates were varied as shown in Table 1.
Afterwards, the sample was injected into the optical detection channel. The UV–Vis spectra were measured on a computer-controlled UV-Vis spectrometer (JAZ Spectrometer, Ocean Optic, Largo, FL, USA) using multimode pigtails as transmitter and receiver. The data was extracted and displayed on a personal computer.

3. Results and Discussion

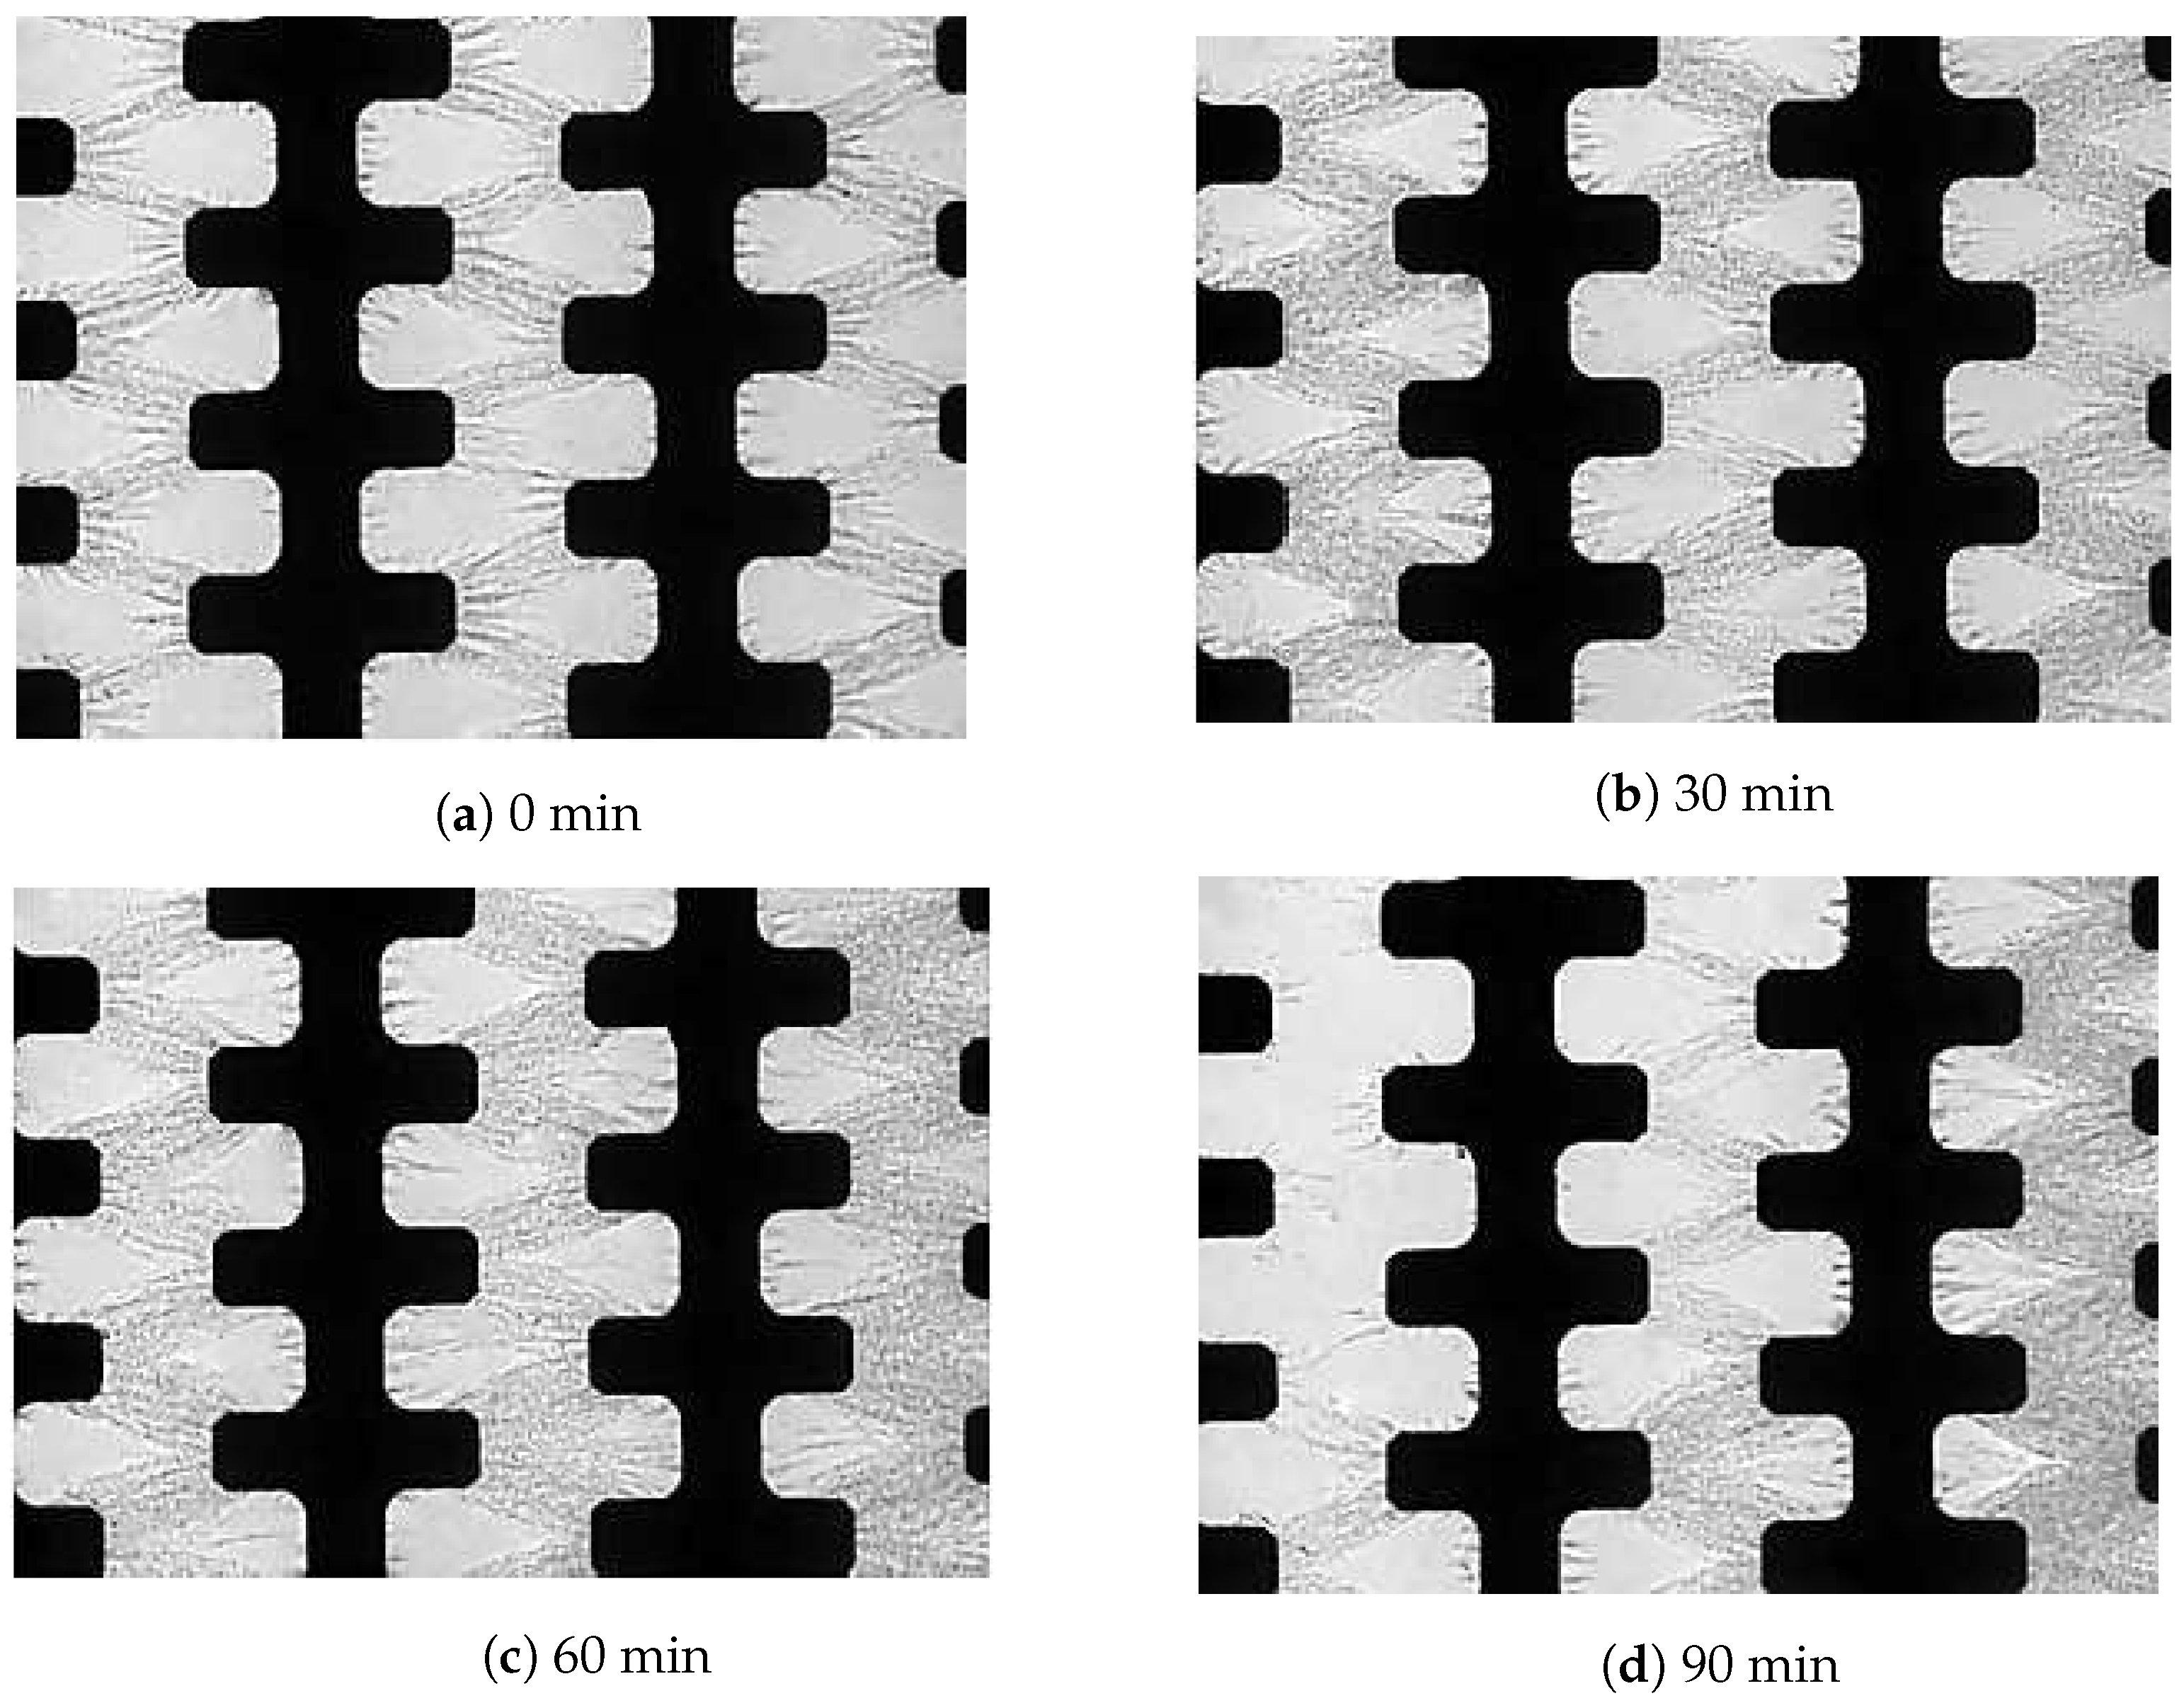
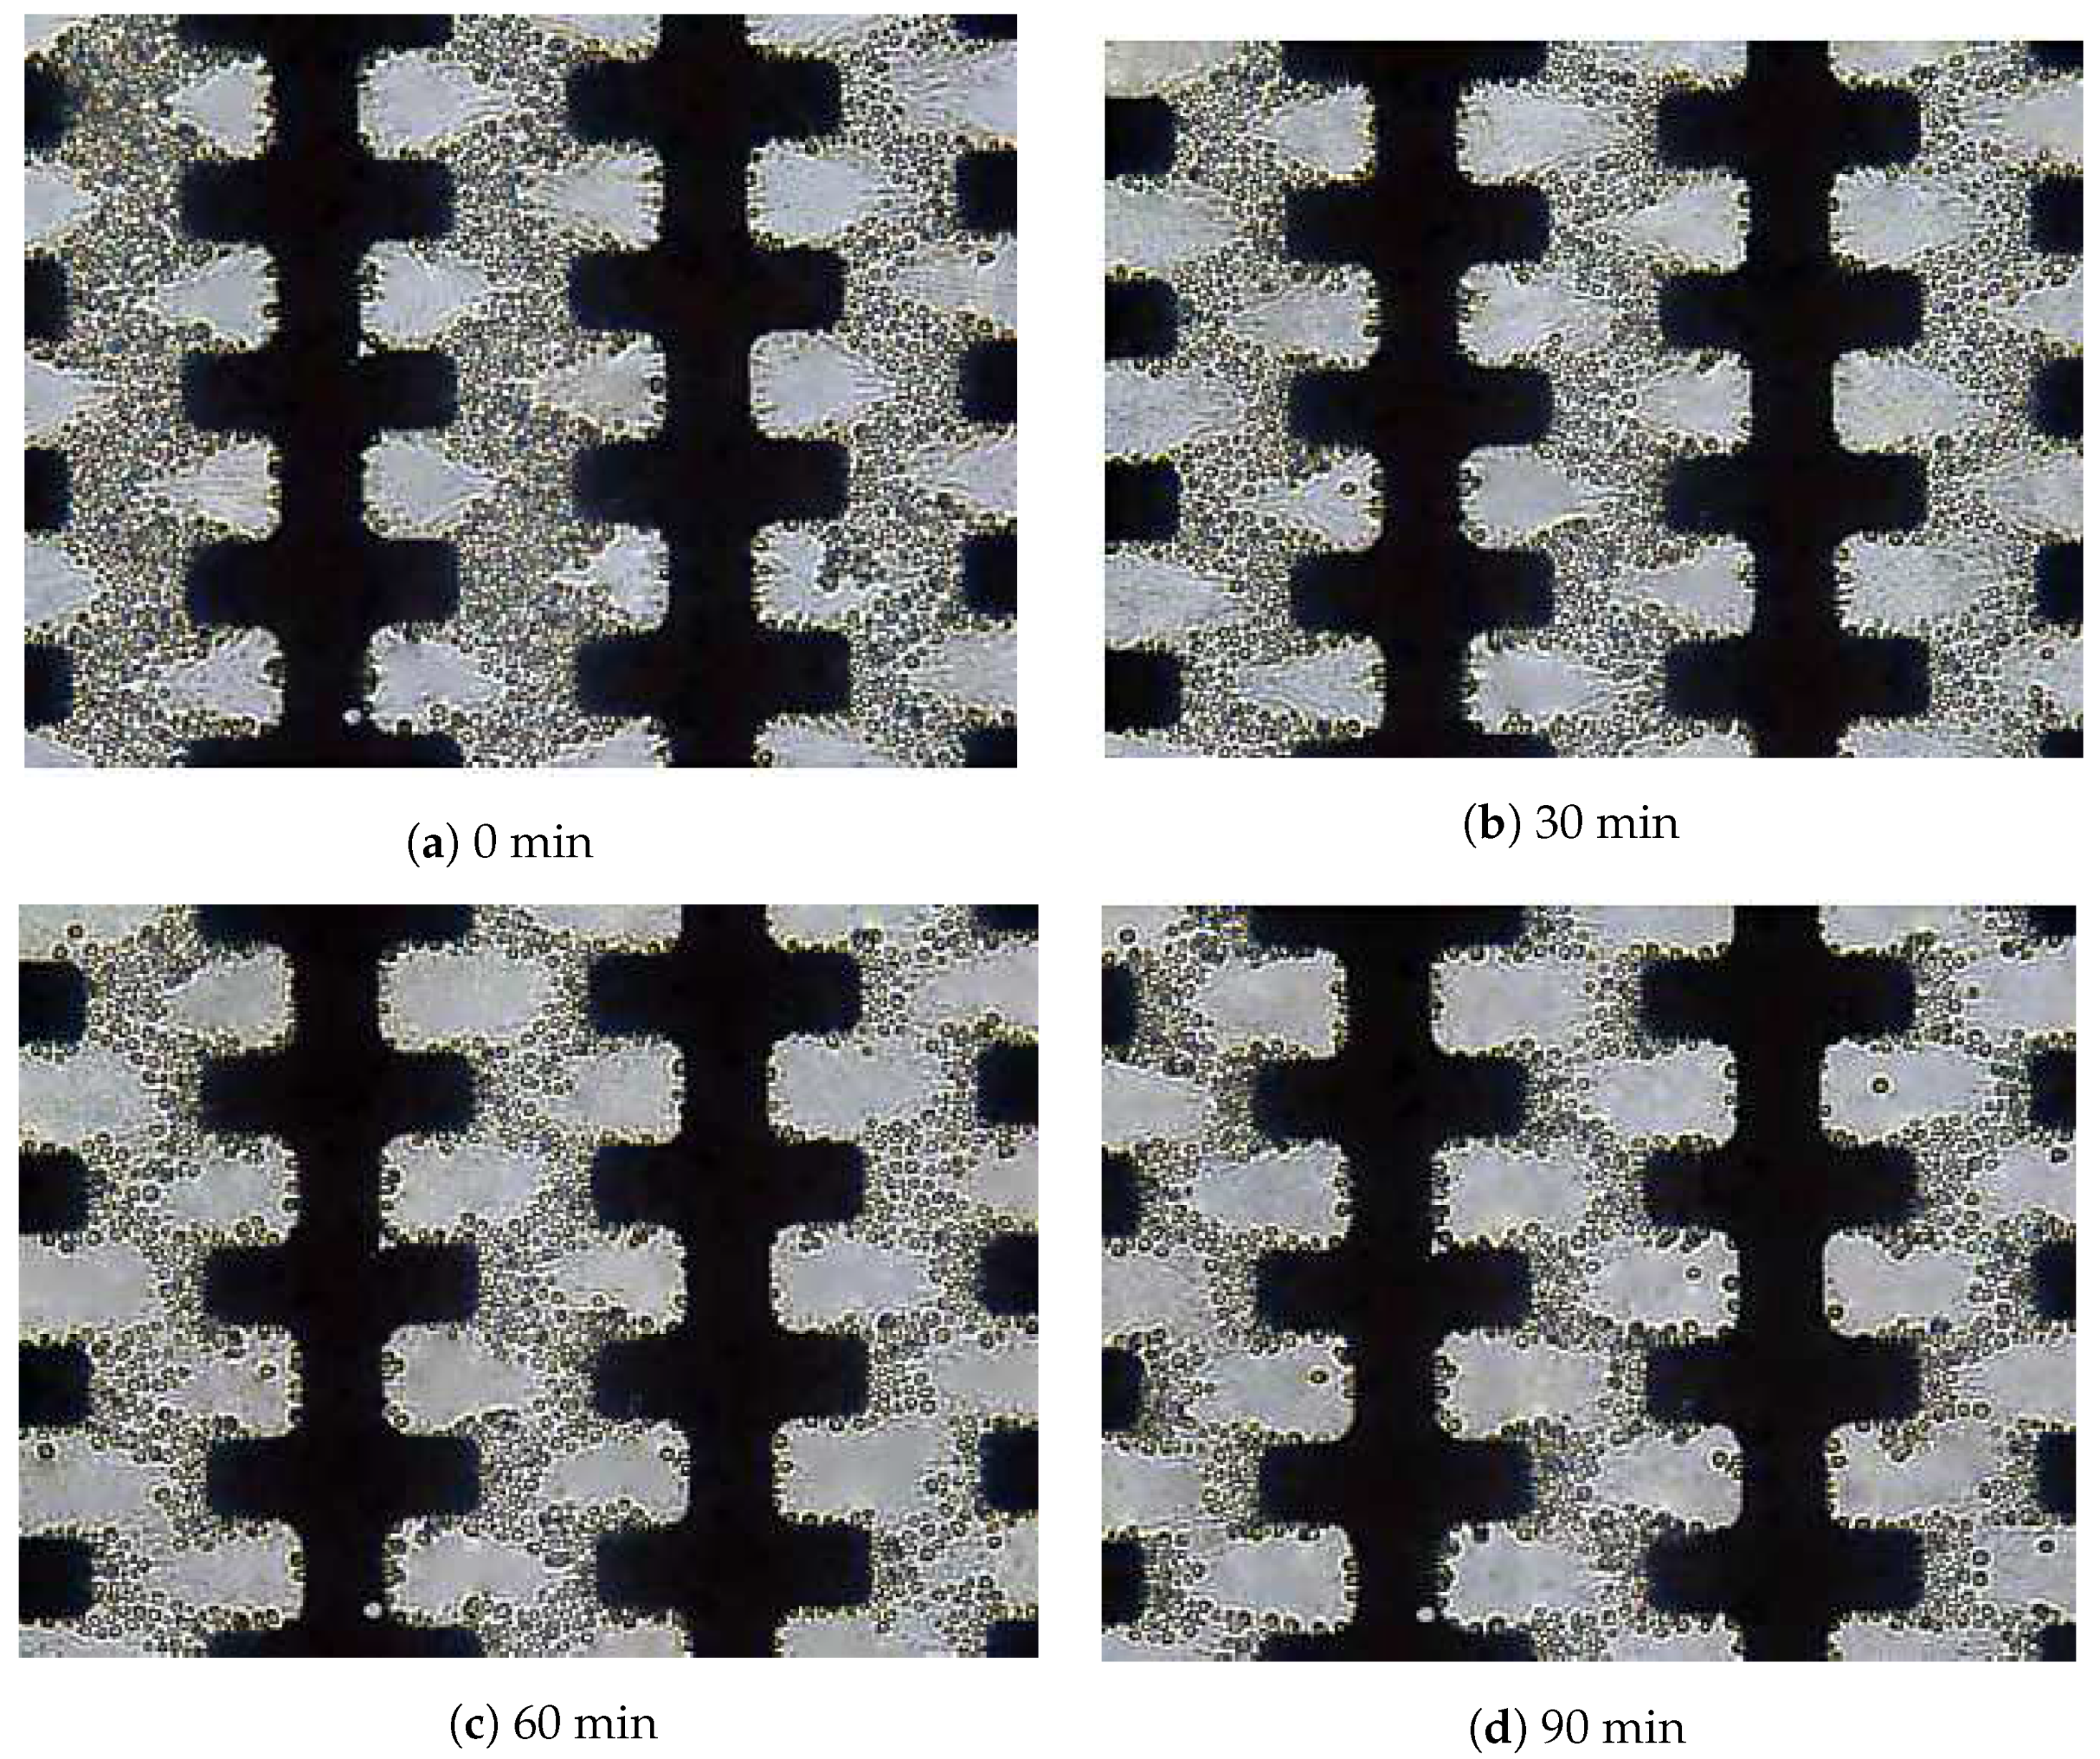
3.1. Pulsed DEP-FFF Separation at Different Pulsing Times

To compare the difference between the rate of release and the percentage of cumulative absorbance, the separation of E. coli and S. cerevisiae were attempted using a pulse DEP-FFF technique in a separate experiment. In these experiments, the E. coli cells (OD600 of 0.3) and S. cerevisiae (OD600 of 0.5) were loaded into the channel. After appropriate voltage signals were applied to the microelectrodes, the cells would be attracted to the microelectrode by DEP forces.

3.1.1. Escherichia coli

Figure 5 presents the results obtained from the DEP-FFF experiment to separate E. coli under an AC electric field of 1 M Hz and 14 V pk-pk. At this conditions, E. coli cells travelled from the inlet and moved through the main channel by the effect of positive DEP and FFF as predicted [38,39].
At high frequency, low medium conductivity and high voltage, E. coli cells were strongly attracted to the microelectrode. In this work, the mechanism of the separation was achieved through pulsed DEP steps applied throughout the separation channel. During the application of AC electric field, the cells experienced DEP force, drag force, diffusion and gravitational force. All these forces acted upon the cells and produced a net forward effect to assist the movement of the cells towards the end of channel. On the other hand, when the electric field was switched off, the cell movement is determined only by the net effect from drag flow, gravity and diffusion. During this phase, FFF which is hydrodynamics plays the main role to control the cell movement or separation by controlling the dispersion and diffusion of the cells in the microfluidic channel. Hence, it is very important to determine the most optimum combination of time and flowrate that can result in a good separation.
Within 5–10 s after the exposure to the electric field, the cells were attracted to the microelectrode array 500 (refer to Figure 2), and fractionation was initiated (Figure 5a). Based on the colour contrast measurement, a reduced concentration of 10% E. coli cells were still attracted to the microelectrode after 90 min of separation time (Figure 5d). Two polarised particles come close to each other and undergo an attractive force to create a pearl chain. Normally a pearl chain is observed near an electrode edge where the strength of the electric field is the highest. The results obtained agreed with the previous work carried out by Suehiro and co-workers [40]. These results are due to the particle-particle interactions and therefore lead to being sterically trapped by other particle types surrounding them. These results match those observed in earlier studies [17].

3.1.2. Saccharomyces cerevisiae

The experiment was performed using S. cerevisiae to determine their pulsing time-related behaviour. The distilled water was allowed to fill up and stabilised in the microchannel after about 5 min while the chosen flow rate was controlled by a syringe pump, as shown in Table 1. The concentrations of S. cerevisiae cells attracted to the microelectrode for a different pulsing time are shown in Figure 6. Again S. cerevisiae cells were attracted to microelectrodes and formed pearl chain formation as E. coli cells due to a positive DEP response as anticipated earlier and conformed to previous findings [41,42].
The result observed notable differences in DEP behaviour between S. cerevisiae and E. coli. For example, S. cerevisiae cells attracted to the microelectrode was progressively reduced as compared with E. coli cells response (compare Figure 6 with Figure 5). Only after 60 min of exposure to the high flow rate of 9.6 μ L min 1 and a pulsing time of 12 s caused the S. cerevisiae cells to start to be released from the microelectrode. As can be seen in Figure 6d, most of the S. cerevisiae cells were still attracted to the microelectrode as compared to E. coli cells (compare Figure 6d and Figure 5d).
E. coli is a single-celled prokaryote of 1–3 μ m in size that has no nucleus and membrane-bound organelles, while S. cerevisiae is a unicellular eukaryote of of 5–10 μ m in size that has cell membrane and membrane bound organelles. With major difference in their cell structure and cell components, a difference in their dielectric properties is inevitable. At the application of electric field, several types of polarisation occur such as space-charge, orientation, ionic and electronics that arises from different parts of the cells structure or components (such as membrane morphologies, organelles, internal conductivities, and size) to give unique cell dielectric properties and behaviour [43]. This is in agreement with similar findings reported by other researchers [44,45,46]. Eventually, different dielectric properties resulted in different DEP and net forces acting on the cells that lead to different cell movement towards end of channel. Furthermore, the smaller size of E. coli cell facilitates it to travel faster and be eluted earlier based on FFF principles compared to S. cerevisiae.

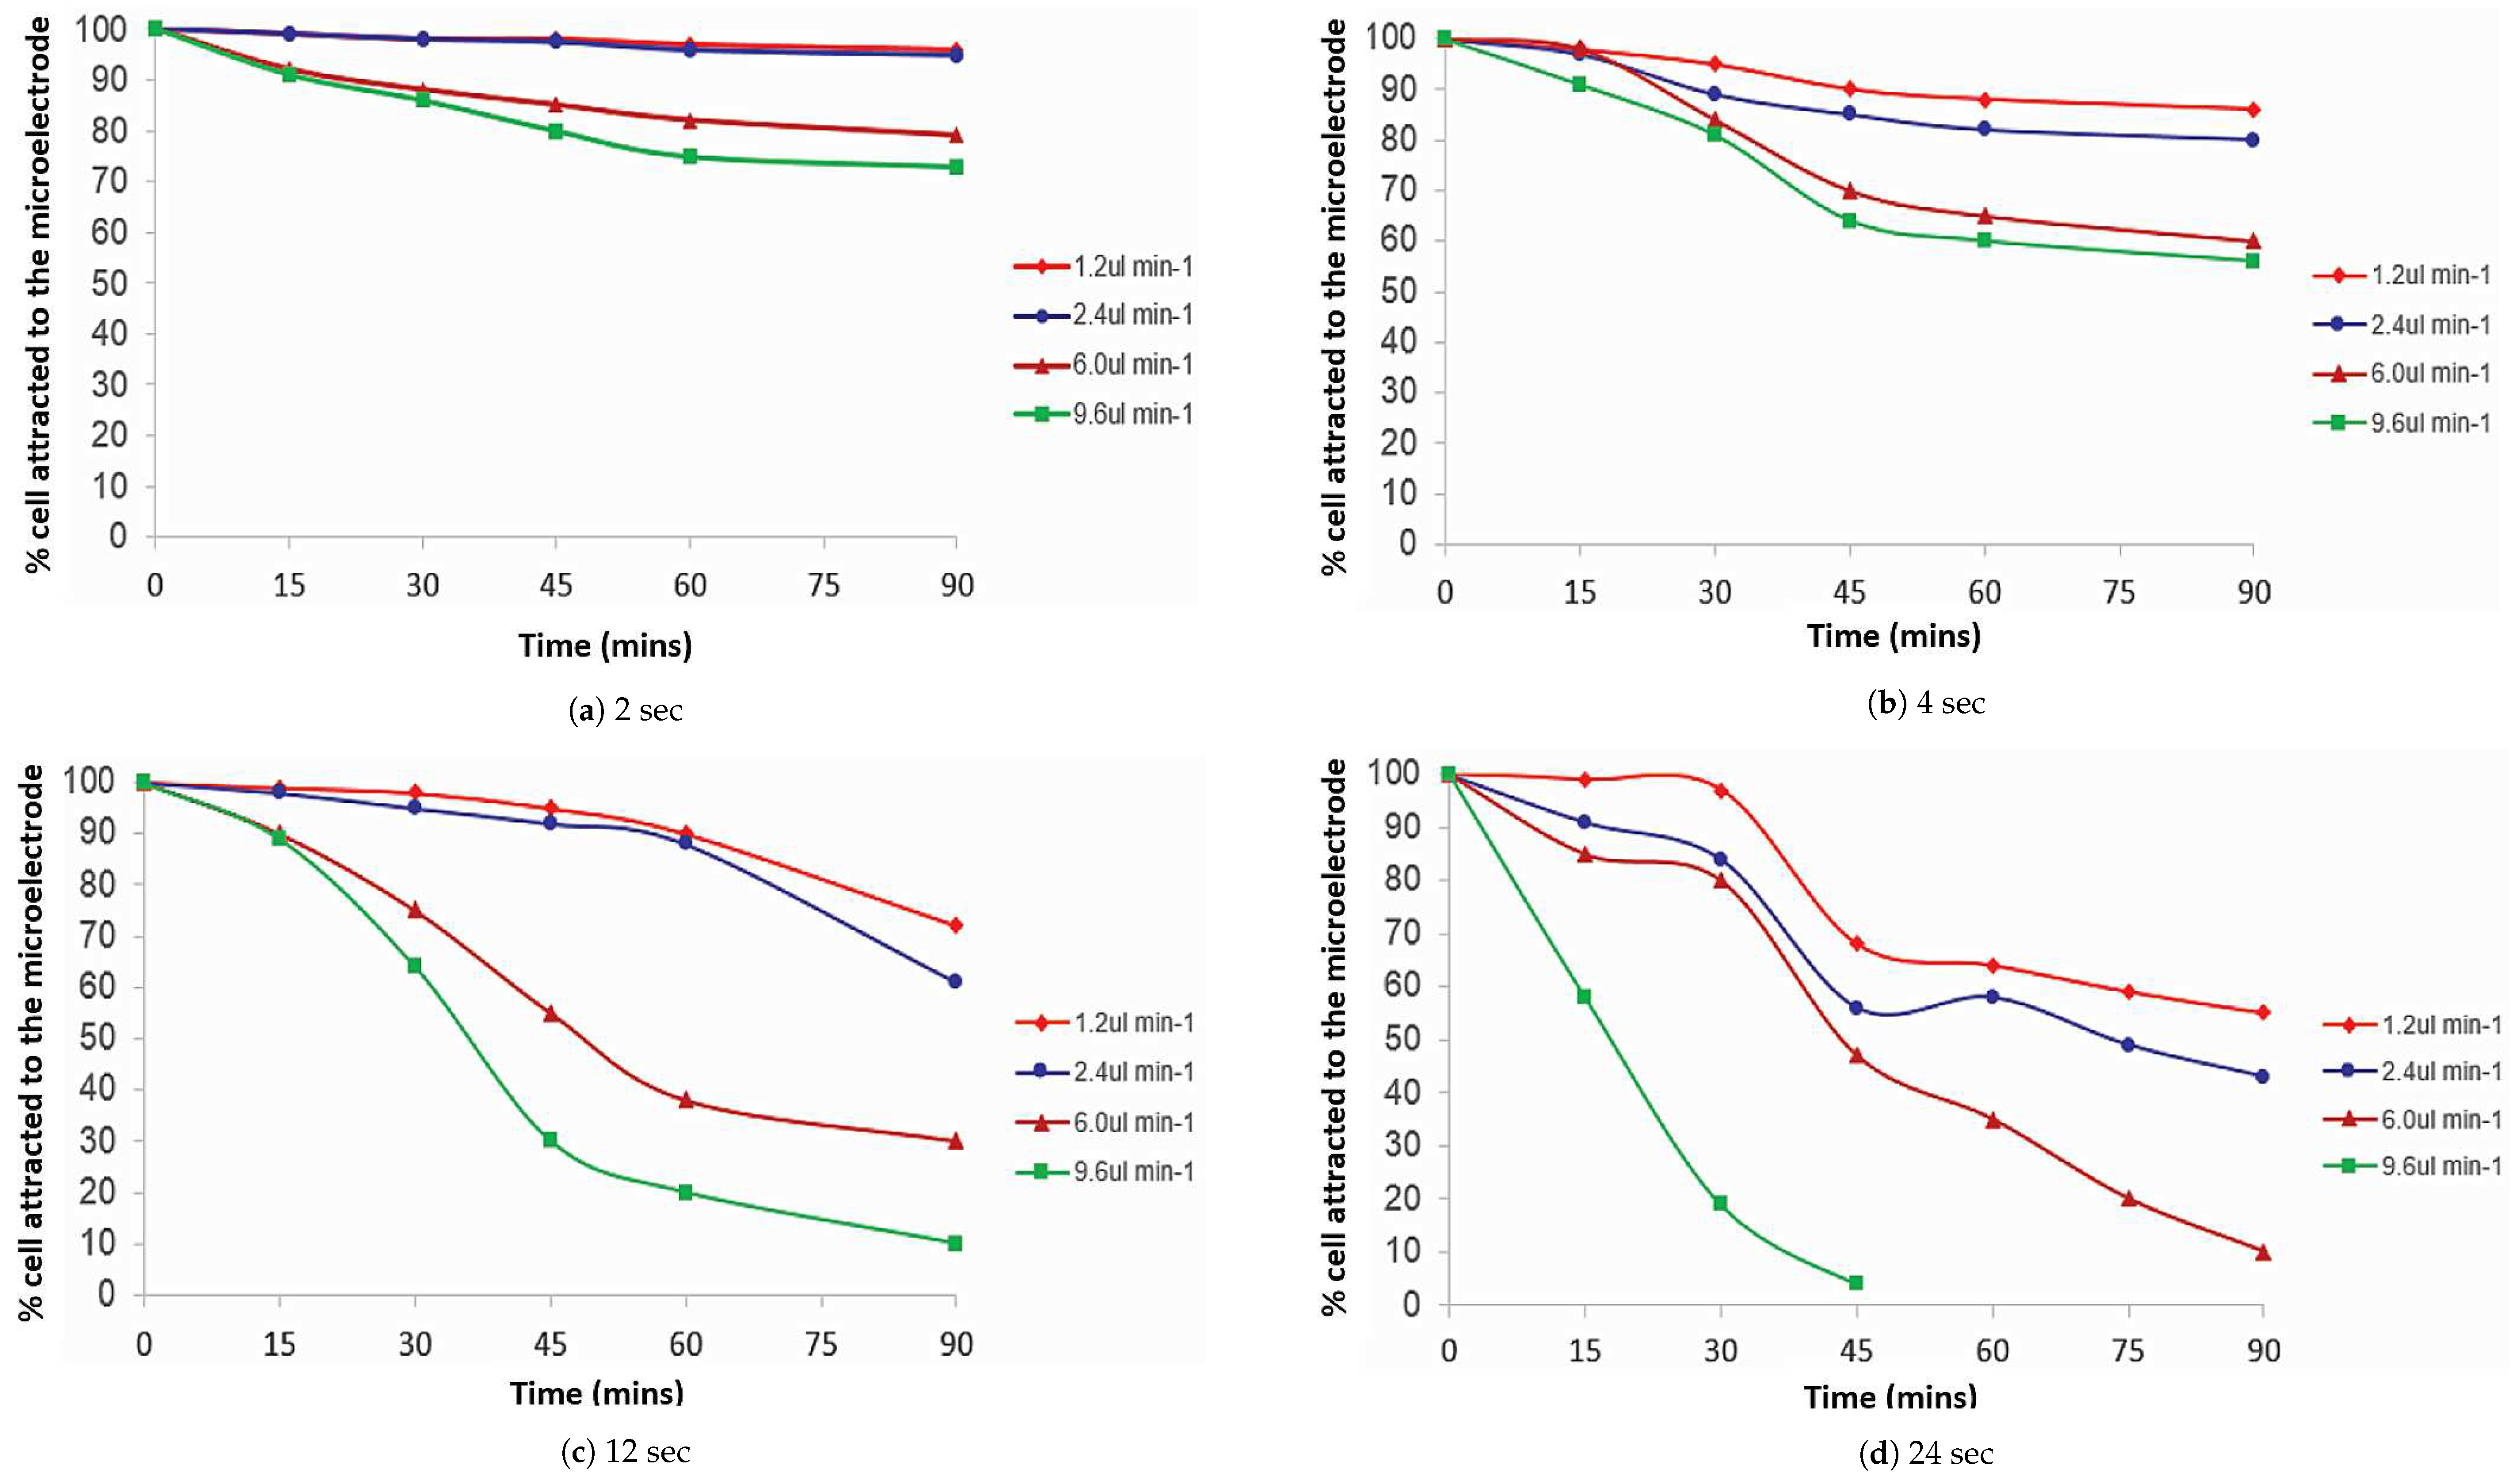
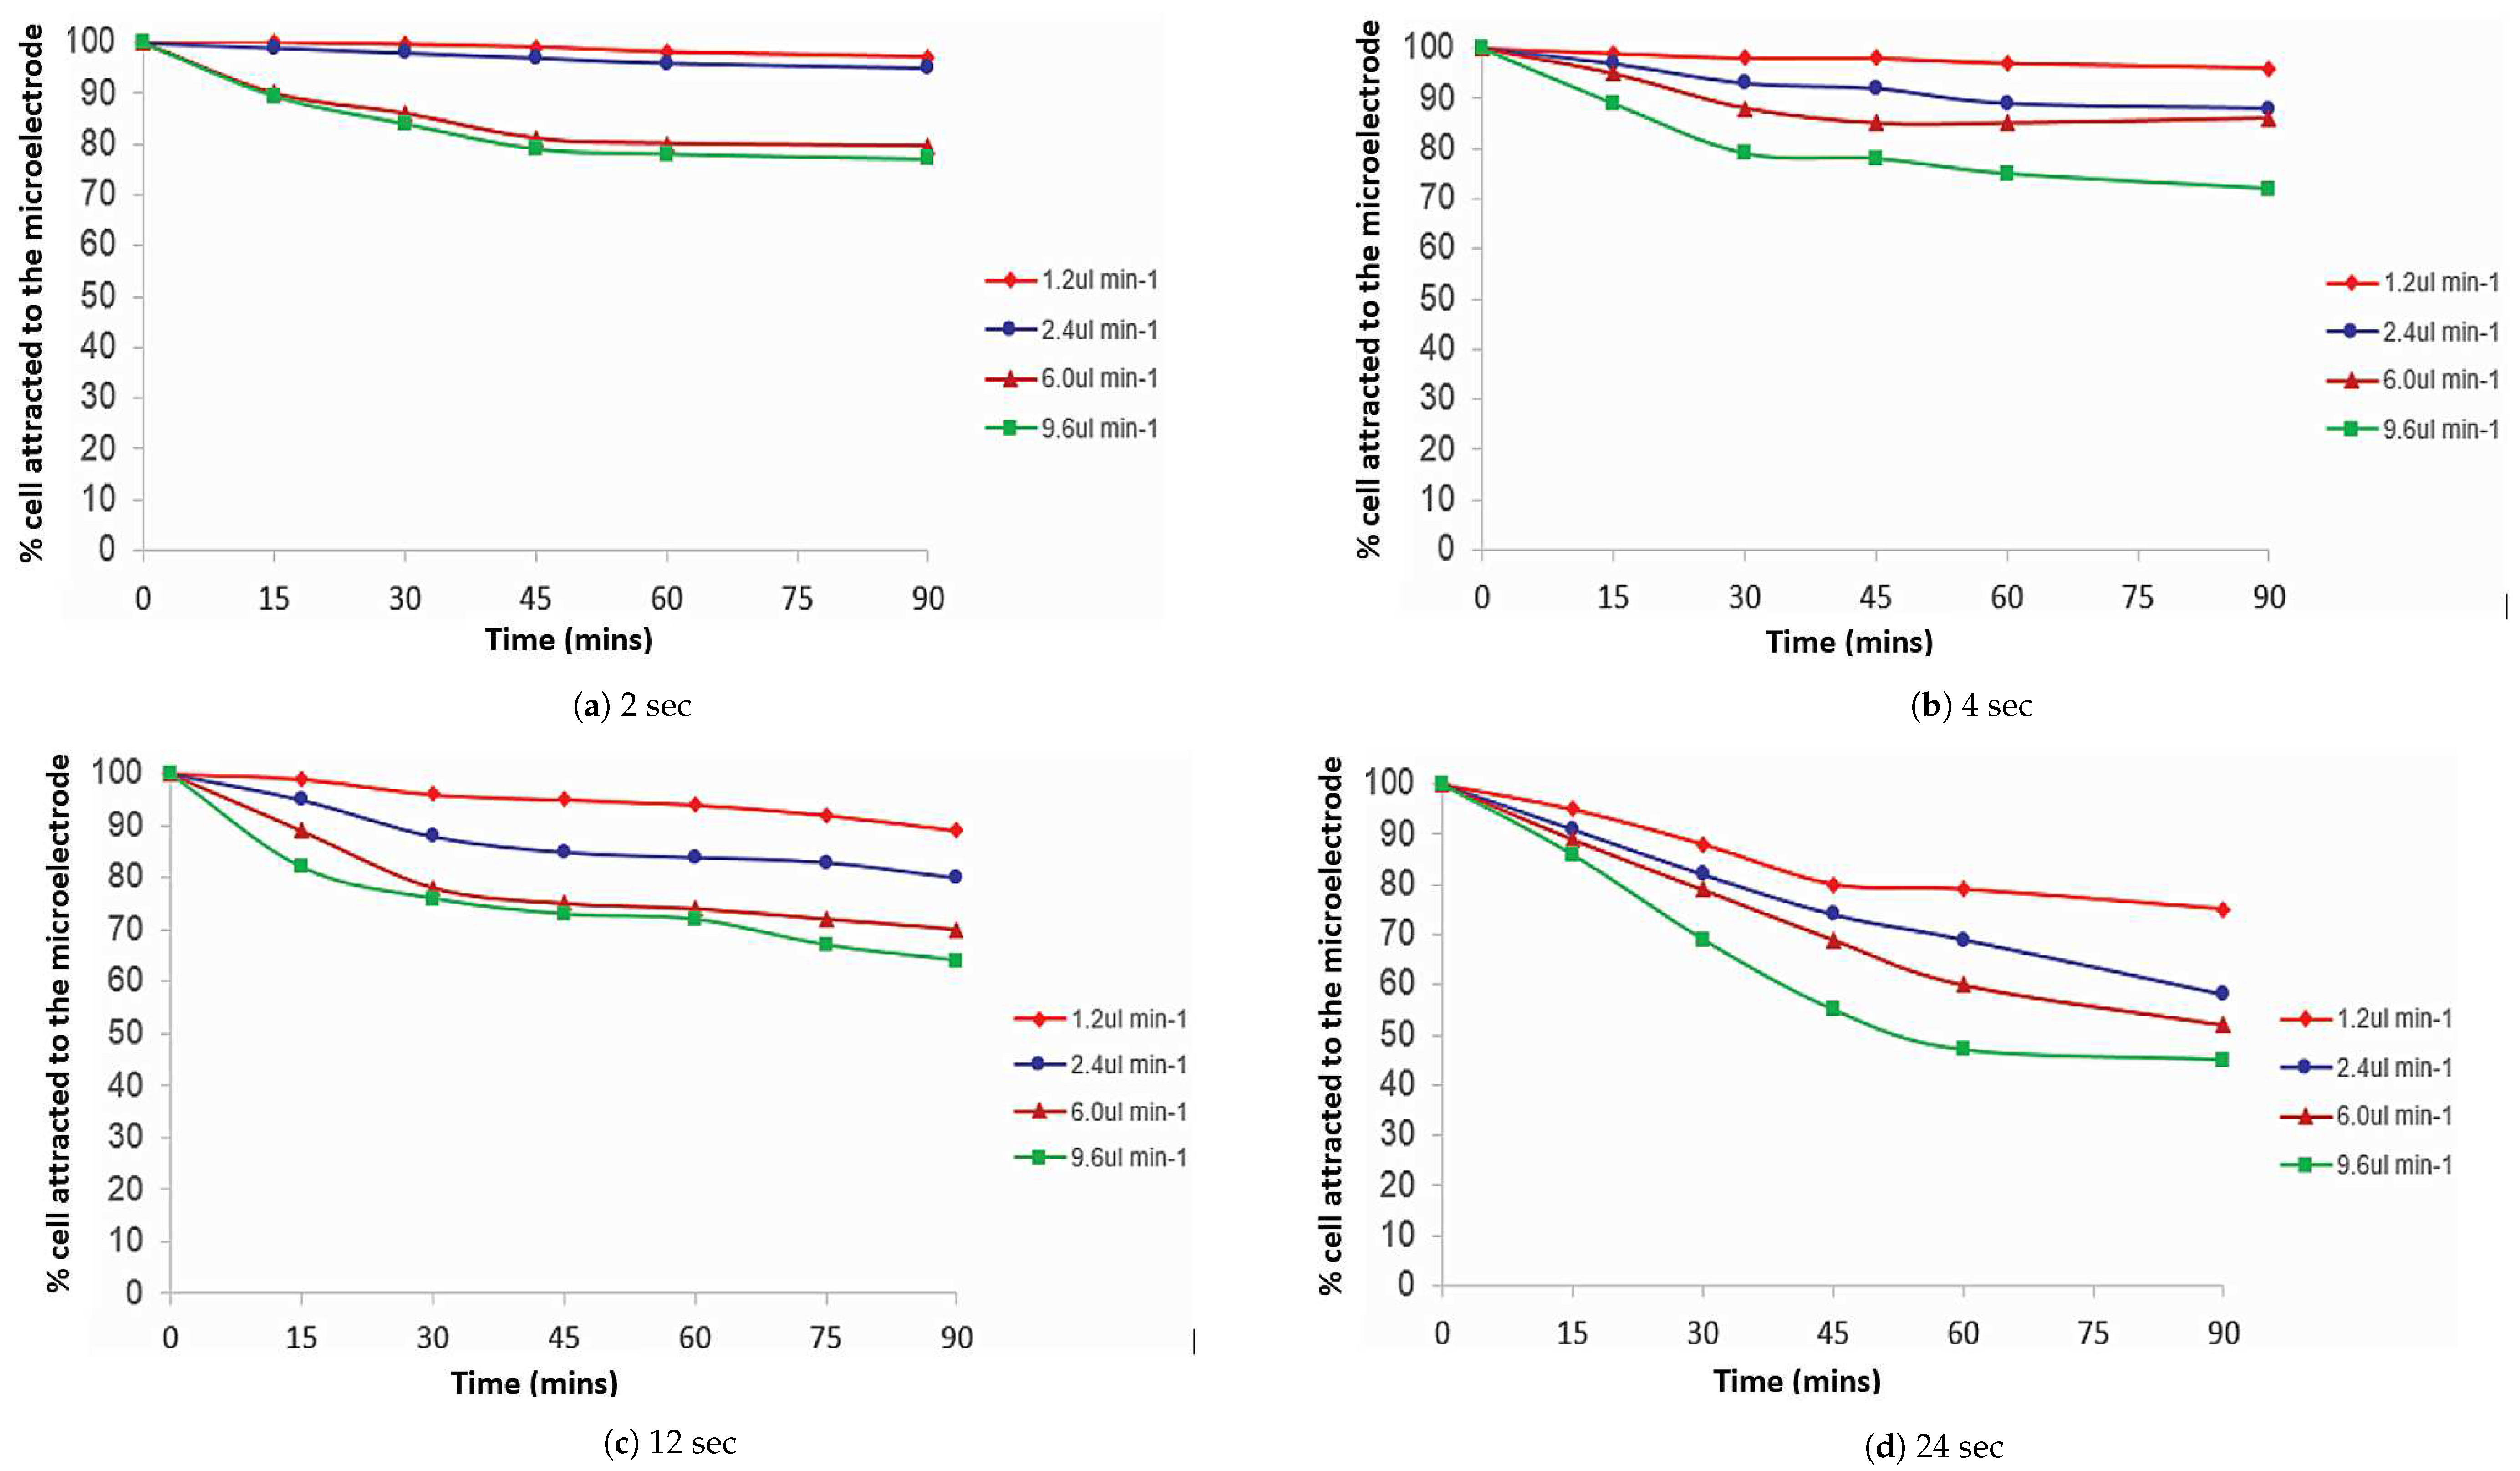
3.2. Percentage of Cells Attracted to the Microelectrode Using Colour Contrast

Here the results are described based on the results obtained from the experiments in the DEP separation. From the previous experiment, the images of cells attracted to the microelectrode were captured by a CCD camera and analysed using the program ImageJ software. Image analysis was prepared according to the procedure used by other researchers [47]. The total area (pixels) of the cells attracted was measured and plotted on a graph. The graph was plotted as a percentage of cells retained at the microelectrode as a function of the time taken to release the cells from the microelectrode. The figures below show the result of the percentage of cells attracted to the microelectrode using colour contrast at the different pulsing time and flow rate.

3.2.1. Escherichia coli

Figure 7 presents the percentage of E. coli cells attracted to the microelectrode as a function of time, comparing the pulsing time applied with the variation of flow rate. Initially, Figure 7a shows a large amount of E. coli cells adhering to the surface of the microelectrode at a pulsing time of 2 s and a flow rate of 1.2 μ L min 1 . After 90 min, a gradual decrease in the number of cells attracted to the microelectrode was observed.
The figure also shows E. coli cells attracted to the microelectrode at a rapid pulsing time of 2 s and faster flow rate of 9.6 μ L min 1 . However, only 28% of the cells were released from the microelectrode after 90 min of separation time. The percentage of E. coli attracted to the microelectrode is given in Figure 7a where the use of different flow rates and a pulsing time of 24 s are shown. The figure shows that the cells attracted to the microelectrode was reduced when the flow rate was increased. The cells attracted to the microelectrode at a flow rate of 9.6 μ L min 1 reduced by approximately 65% from the cells at the slow flow rate of 1.2 μ L min 1 .

3.2.2. Saccharomyces cerevisiae

Figure 8 shows the percentage of S. cerevisiae cells attracted to the microelectrodes with the variation of pulsing time and flow rates as a function of separation time. The results presented were obtained from the image analysis of the previous experiment.
In Figure 8a, the S. cerevisiae cells showed a similar trend to the E. coli cells for a pulsing time of 2 s. After 90 min, more than 90% of the cells still remained attracted to the microelectrode at a slower flow rate of 2.4 μ L min 1 . Nevertheless, at a faster flow rate ( 9.6 μ L min 1 ) only 75% of the cells remained attracted to the microelectrode after 90 min of separation time. The percentage of cells attached versus separation time for a longer pulsing time (24 s) is shown in Figure 8d. It can be seen that 80% of cells were still attracted to the microelectrode at a flow rate of 1.2 μ L min 1 after 90 min of separation time. At a higher flow rate (9.6 μ L min 1 ), the number of cells attracted to the microelectrode was reduced and plateaued towards the end of the experiment.

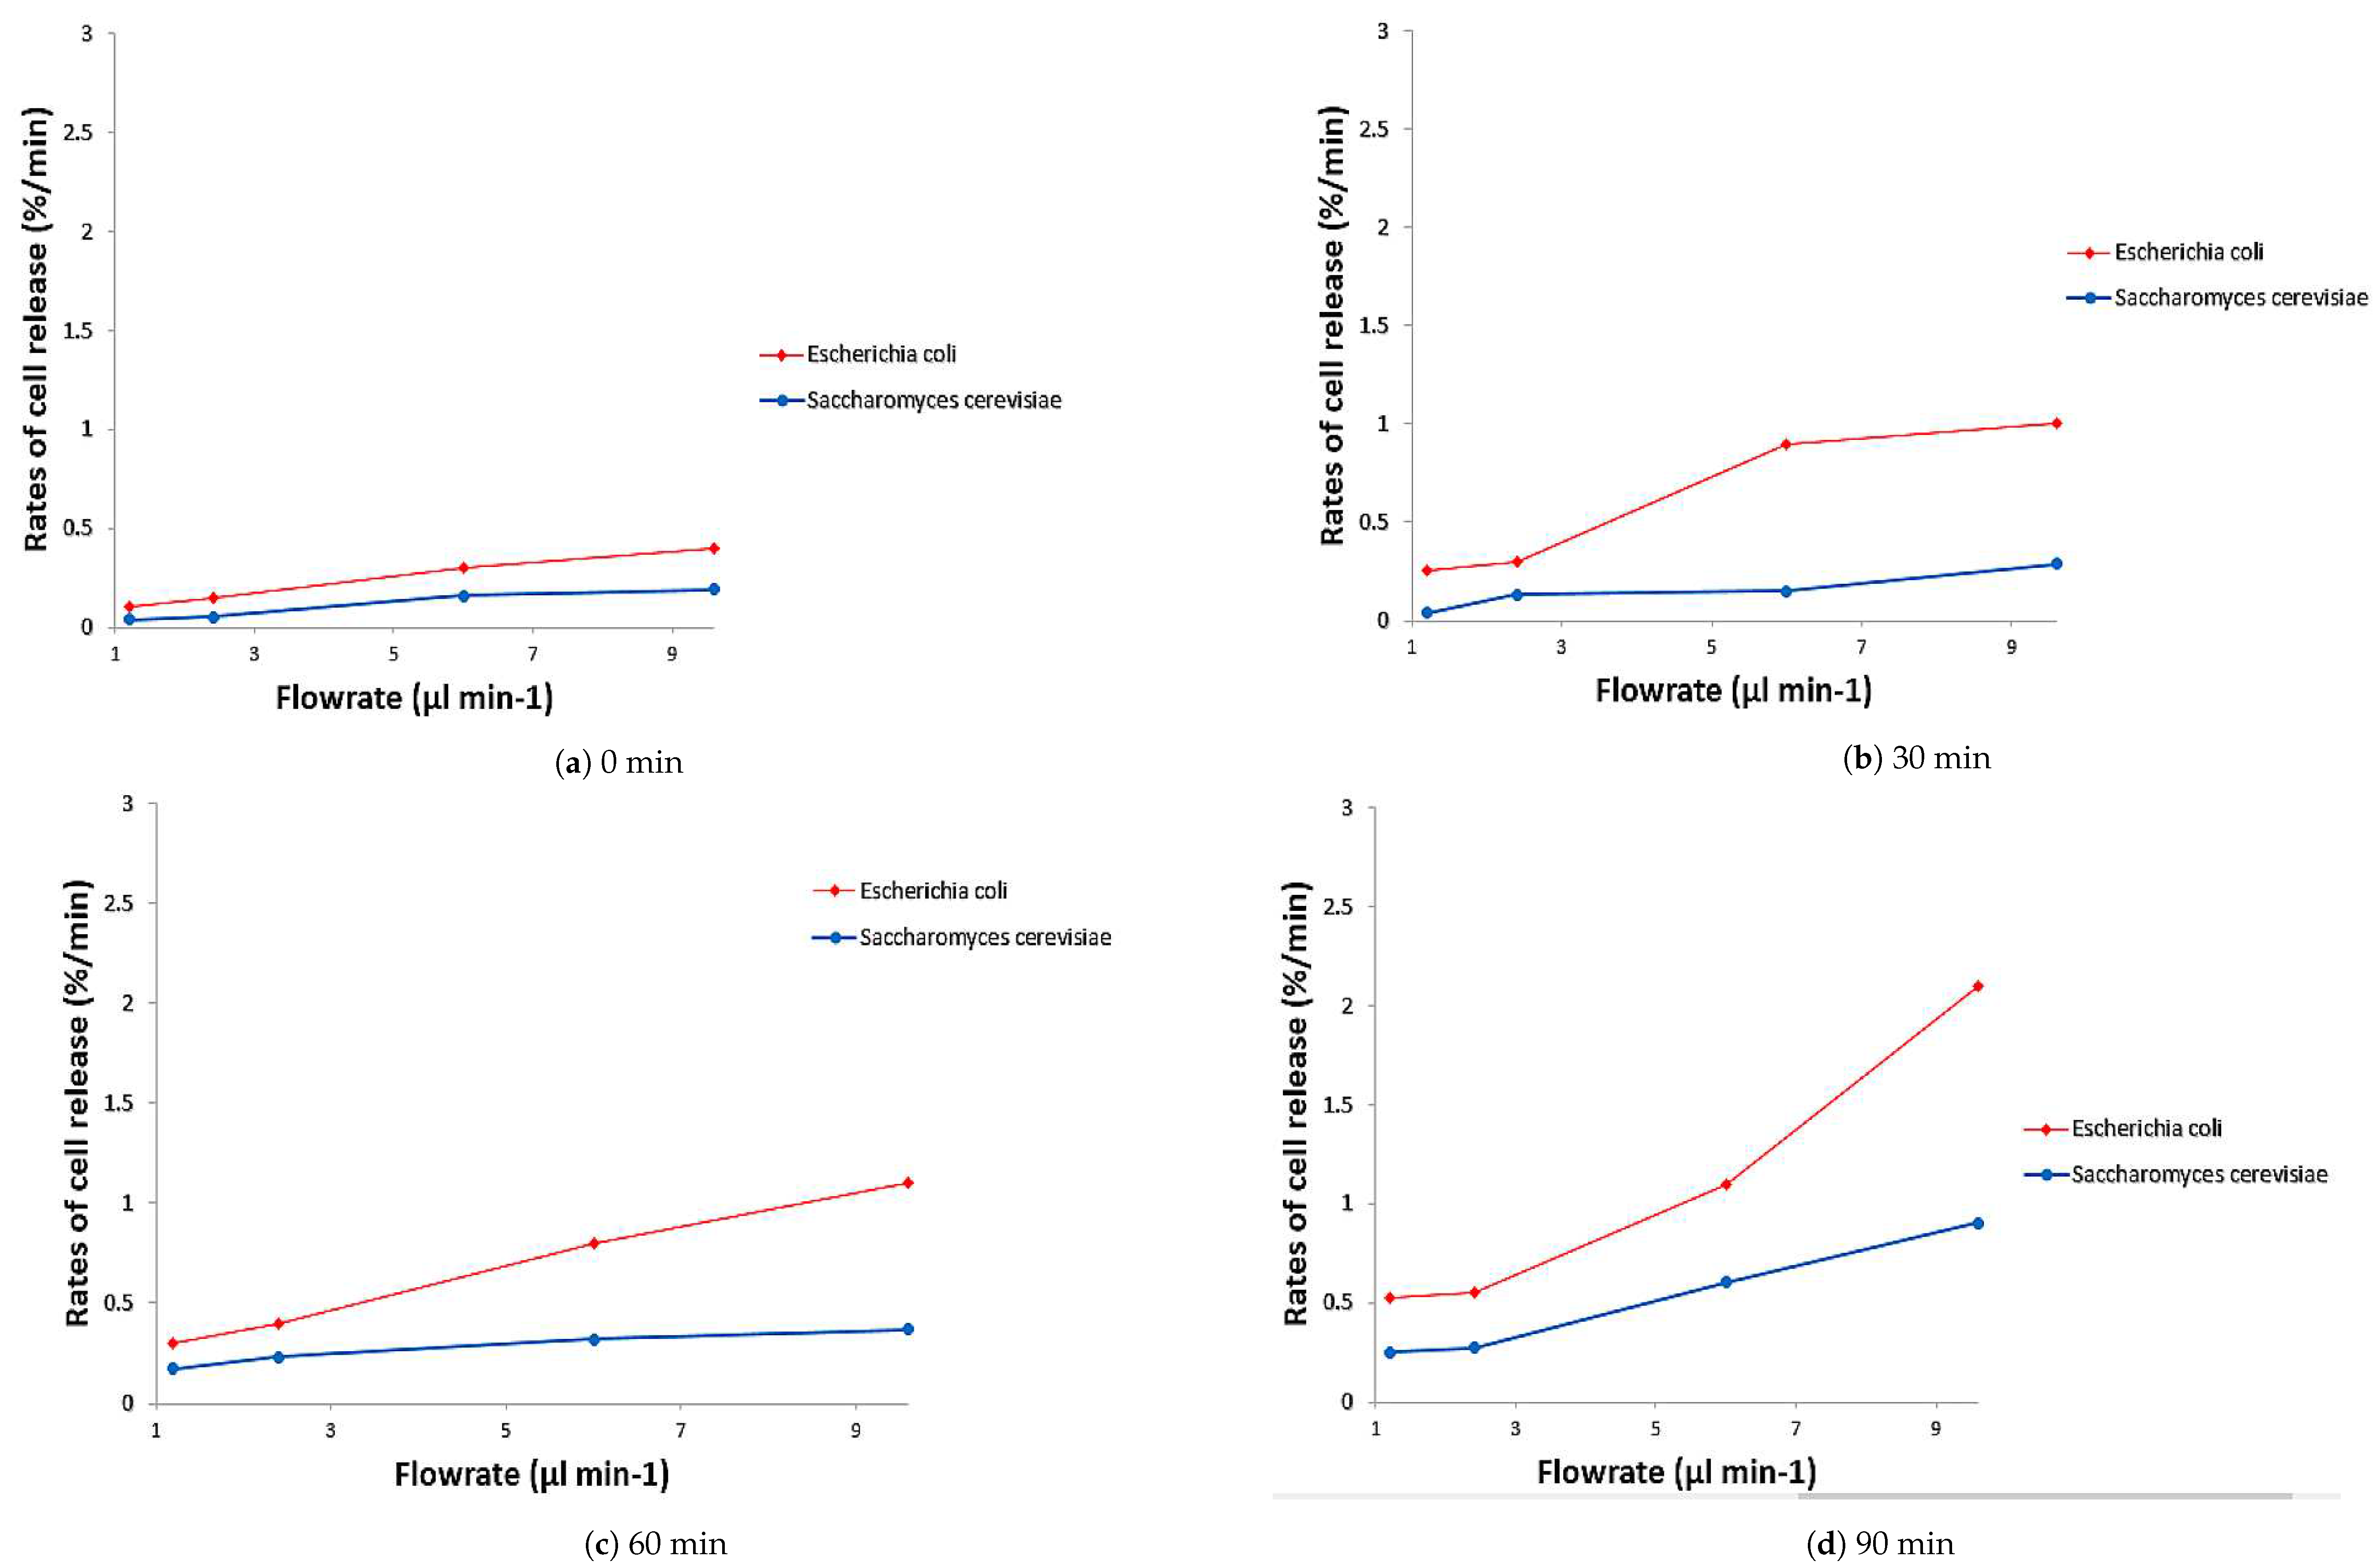
3.3. Comparison of the Rate Release of Escherichia coli and Saccharomyces cerevisiae Cells from the Microelectrode

The trends for comparison of the rate of release of E. coli and S. cerevisiae cells from the microelectrode are shown in Figure 9. There was little difference in the rate of release for both microorganisms at a pulsing time of 2 s as shown in Figure 9a. At this short pulsing time, both microorganisms were unable to achieve significant movement in the channel. The cells were seen to be collected again to the microelectrodes before it can move further away from its starting location.
With DEP-FFF applied, the rate of release of E. coli and S. cerevisiae cells increased slowly over the entire 90 min measurement duration (Figure 9a). More importantly, the rate of release of E. coli at around 0.3 %/min was 50% higher than that of S. cerevisiae. A similar pattern of rate of release was seen at a pulsing time of 12 s (Figure 9c). As evident from the figure, the rate of release demonstrated the highest difference rate of release at 0.6 %/min and E. coli exhibited almost double the rate of release compared to S. cerevisiae at a flow rate of 9.6 μ L min 1 . A different pattern was correlated between the flow rate and rate of cell release that was found when using a constant pulsing time of 24 s (Figure 9d). Interestingly, the results showed that the difference of the rate of cell release between two microorganisms increased dramatically 133% at the flow rate of 9.6 μ L min 1 . E. coli cells generally have a higher rate of release than S. cerevisiae cells, meaning that the E. coli cells could be eluted first from the microfluidic. This was a direct indication that the two microorganisms could be separated into essentially pure populations. In contrast, the rate of cell release for both microorganisms showed a significant difference at the pulsing time of 4 s, 12 s and 24 s.

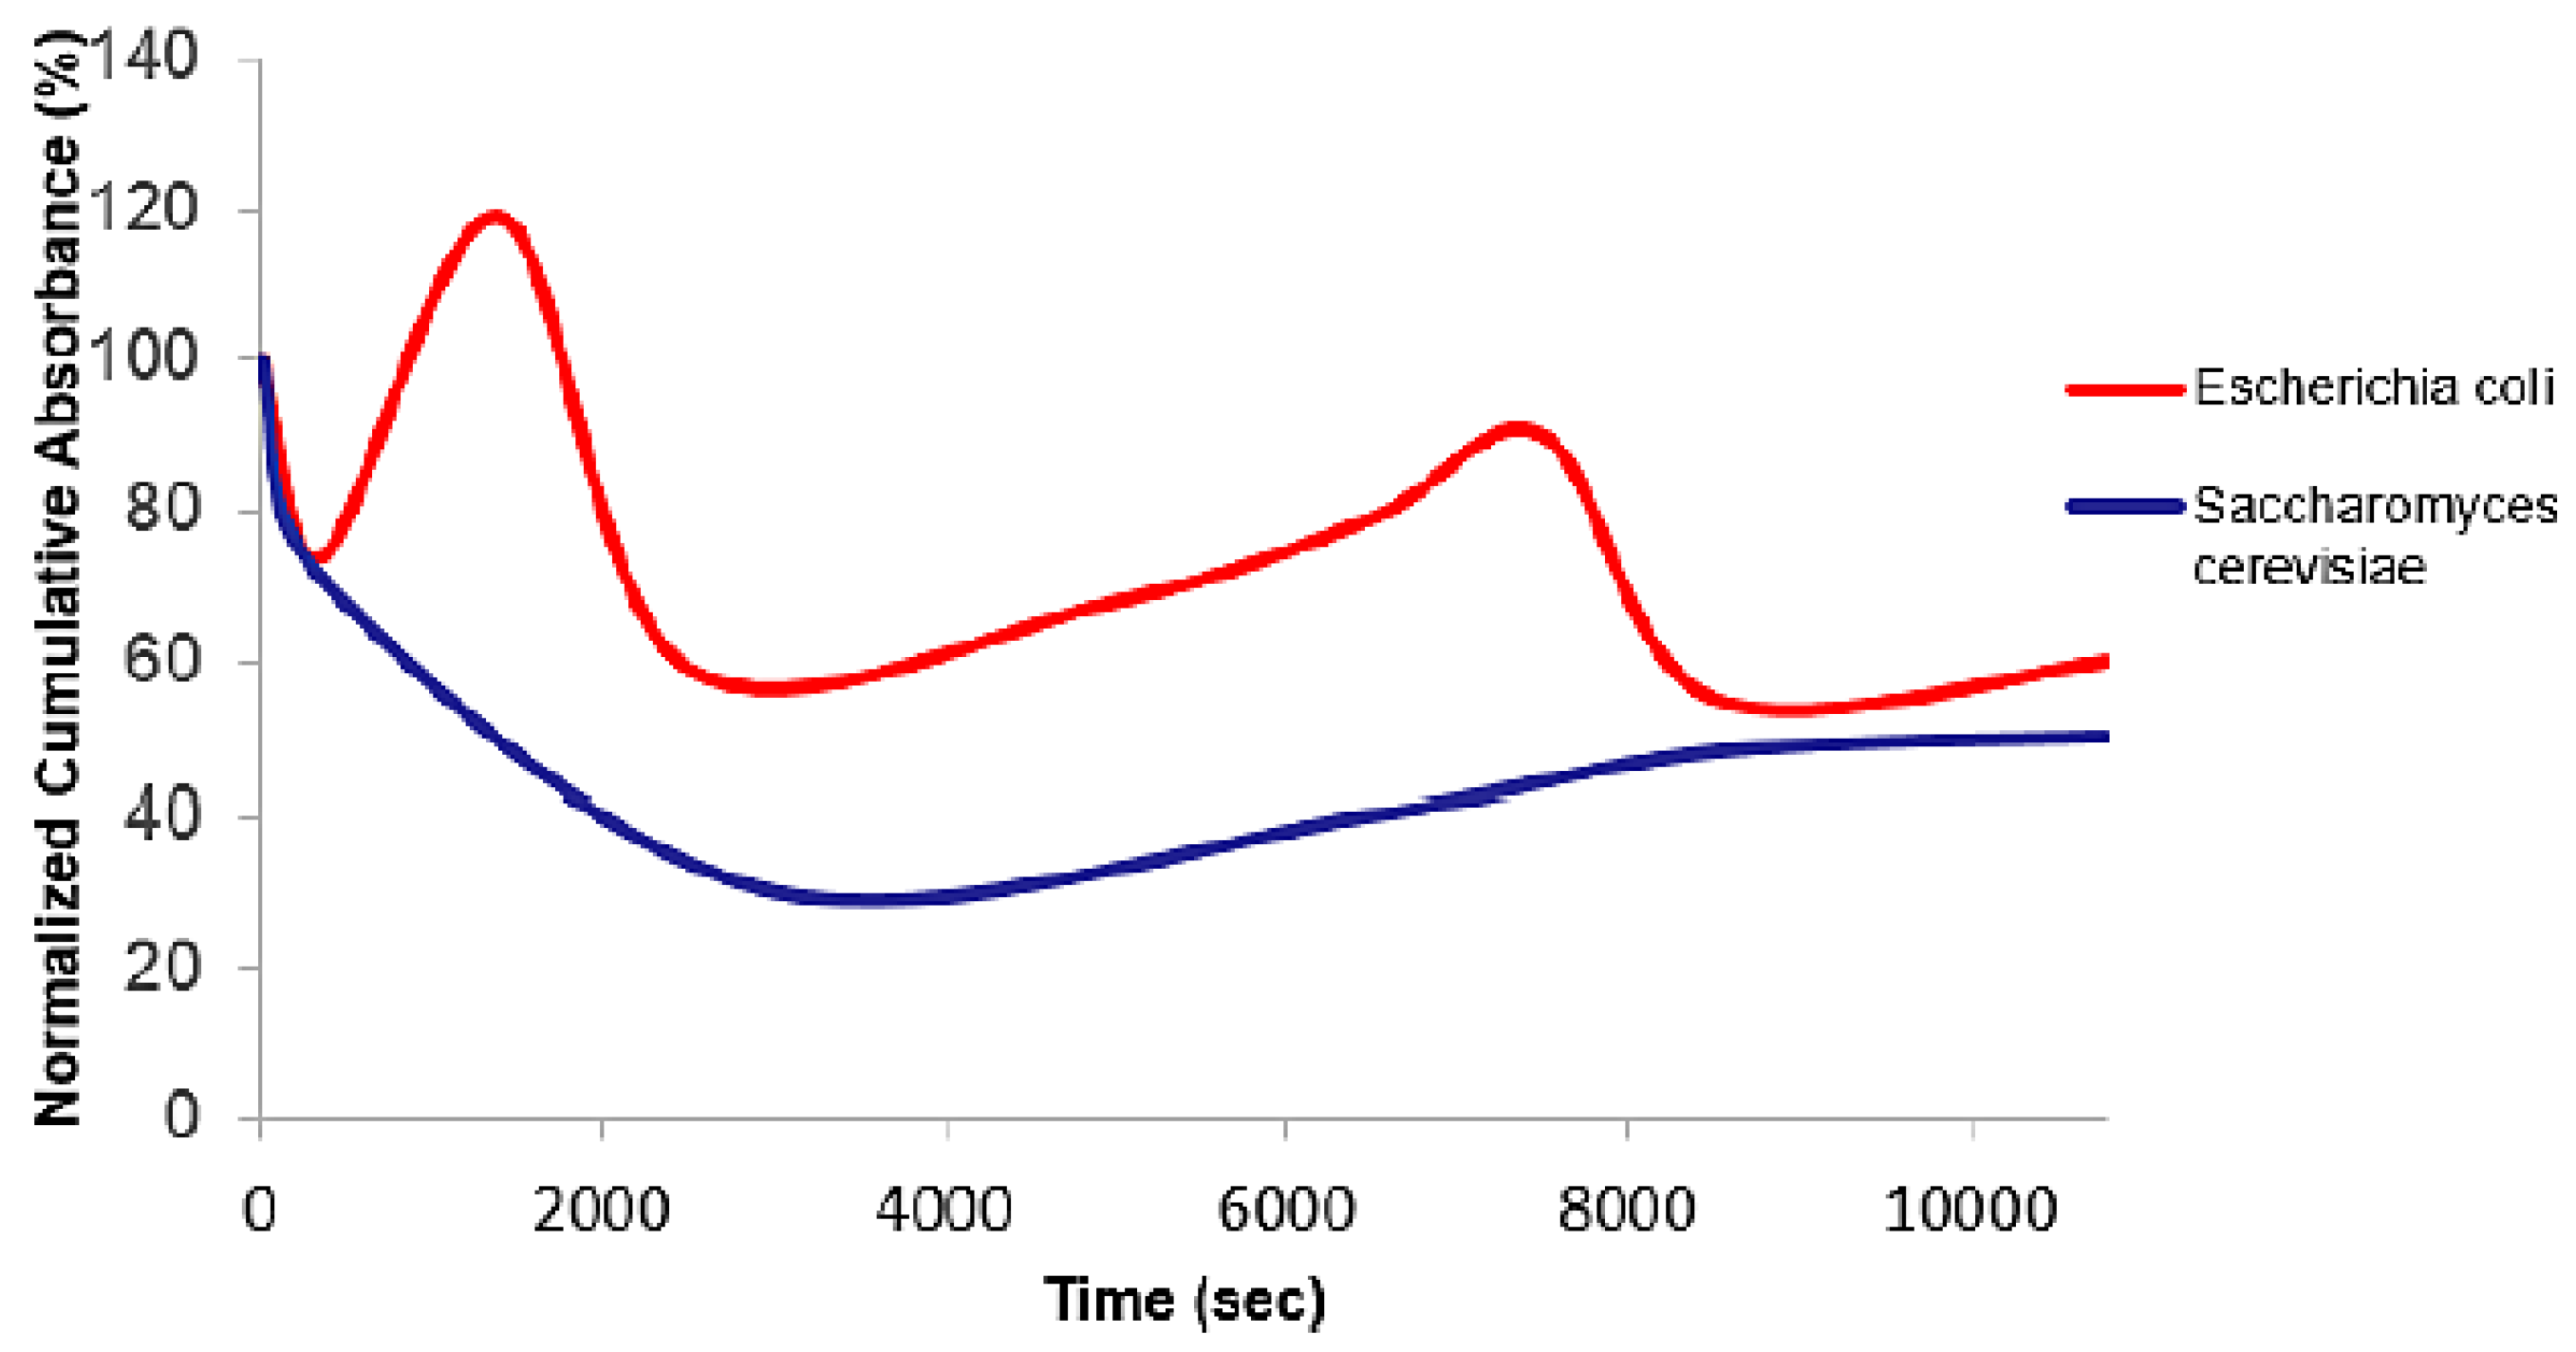
3.4. Comparison of the Percentage of Cumulative Absorbance of Escherichia coli and Saccharomyces cerevisiae Cells

The experiment was performed on a suspension of mixed cells of E. coli and S. cerevisiae. A low concentration of E. coli (optical density of 0.3) and S. cerevisiae (optical density of 0.5) were introduced into the microfluidic. The corresponding concentrations were 8.0 × 10 6 cells/ m L and 8.6 × 10 6 cells/ m L for the E. coli and S. cerevisiae cells respectively. The S. cerevisiae cells were introduced first into the microfluidic and then followed by the E. coli cells. At the same time, the electric field at a frequency of 1 M Hz with a voltage of 14 V pk-pk was applied to separate these microorganisms. The DEP behaviour of the cells and the cumulative absorbance at a pulsing time of 12 s and a flow rate of 9.6 μ L min 1 were recorded based on two wavelength range, which were 310 ± 10 n m for E. coli [48] and 435 ± 10 n m for S. cerevisiae [49].
Figure 10 shows the S. cerevisiae and E. coli cells attracted to the microelectrode. From this figure it can be seen that the S. cerevisiae and E. coli cells exhibited a positive DEP response at 1 M Hz frequency and 14 V pk-pk. It was apparent that the S. cerevisiae cells attracted more strongly to the microelectrode compared to the E. coli cells as explained earlier. Initially, the mixture of cells was attracted to the microelectrode immediately after the electric field was applied (Figure 10a). The cell concentration was found to increase gradually after 15 min (Figure 10b), followed by a continuous increase up until 60 min (Figure 10c,d). There were still more than 90% of the cells attracted to the microelectrode after 60 min of separation time.
Figure 11 shows the percentage of cumulative absorbance of E. coli and S. cerevisiae cells that passed through the detection channel as a function of time. During the earlier phase of DEP-FFF separation process, many cells were attracted to the microelectrode while some of unattracted ones pass directly through to the fibre optic detection channel. At this instance, the absorbance measurement for that cell is low since it detects a small amount of cells in the detection channel. From the previous experiment, E. coli cells generally have a higher rate of release than the S. cerevisiae cells and tend to be eluted first from the channel (Figure 9). These experiments confirmed that E. coli cells released quickly from the microelectrode array and is subsequently detected with high absorbance value during the earlier period of experiments compared to S. cerevisiae cells. At the same time, S. cerevisiae cells have a low rate of release because the cells are attracted to the microelectrode array and hence should have a low absorbance value. The absorbance of both microorganisms rapidly decreased over the first few seconds until it reached 70% of the cumulative absorbance at 400 s. The cumulative absorbance of E. coli cells rose to 120% at 1000 s while the cumulative absorbance of the S. cerevisiae cells gradually dropped to nearly 30% until 3000 s of separation time. There was a sharp drop in the cumulative measurement for the E. coli cells until it reached 59% at 2500 s and this was followed by a more gradual increase over the next few minutes until 7500 s before decreasing again. The cumulative absorbance of the S. cerevisiae cells gradually increased to 43% until 10,000 s. This result suggests that the separation of microorganisms were more efficient when the difference between the percentages of cumulative absorbance was greater.

4. Discussion

These two microorganisms were chosen because of their difference in effective particle conductivity and cell size. The effective particle conductivity for E. coli and S. cerevisiae were 412 μ S/ c m and 16 μ S/ c m respectively [50]. Each cell was levitated at certain height because of the differences in the dielectric properties [51]. S. cerevisiae has a cell size of 8 to 10 μ m in diameter while the cell size of E. coli was 1 to 2 μ m in diameter. As can be seen, the E. coli cells were eluted first, and then the S. cerevisiae cells were eluted later. S. cerevisiae tends to be denser compared to E. coli and equilibrated nearer to the channel floor where the eluate flows slowly [52]. The E. coli cells were levitated higher into the faster moving regions of the eluate.
Furthermore, this result may be explained by the fact that E. coli and S. cerevisiae cells were different in shape and this led to the polarisation difference. These results appear to be consistent with other research [53]. When the pulsed DEP was applied, the polarisation discontinued and the charges changed to their original pattern of distribution. The time for the cells to revert to the original pattern of distribution depended on the kind of polarisation and cell size. The larger cell size had a slower change compared to the smaller cells [54].
In this investigation, it has been shown that two microorganisms can be isolated and detected using a chip-in-a-lab. This study successfully isolated the suspension of microorganisms such as E. coli and S. cerevisiae by exploiting the cell dielectric properties using the DEP-FFF method without the need for antibodies or other labelling procedures for separation and detection. These results were better than any reported separation because it was impractical to separate cells with similar sizes [55]. The most interesting finding was that it was possible to separate two nearly identical microorganisms in a suspension. The mechanism for separation of similar size microorganism demonstrated in a previous study involves a nano-orifice based DC-DEP microfluidic device [55]. An advantage of this method is that it uses only low electric potential applied locally. However, the method requires the adjustment of electric conductivity of the suspending medium and it is impractical in real-life applications.
The free space fibre optics approach appears promising in the detection of microorganisms. The study suggests that the highest separation between two microorganisms could be obtained by using a longer pulsing time of 12 s and a faster flow rate of 9.6 μ L min 1 at a constant frequency, voltage and low conductivity. This was thought to be due to the different dielectric properties of the microorganisms, thus the microorganisms had a different rate of release. A UV spectrometer through a cumulative absorbance graph showed evidence that the separation occurred between the two microorganisms. Finally, this device provides a convenient method for possible applications of the biosensor.

5. Conclusions

The design and fabrication of a chip-in-a-lab device for separation and detection have been presented. A separation system has been designed to separate microorganisms in a lab on chip device using the pulsed field DEP-FFF mechanism. An optical system has been designed capable of detecting a microorganism moving within a device using light scattering. Chip in a lab allows for batch-mode experiments which are flexible and when staining or antibody modification was unnecessary, thus making the chip attractive in various applications. On the other hand, the development of integrated microsystems remains one of the most difficult challenges. The experimental results obtained in this study verified that different microorganisms could be simultaneously separated and detected using the chip-in-a-lab. The fabrication methods described in this paper could be used to further develop miniaturized particle diagnostic systems where detecting and/or sorting of cells is required. Future studies will focus on enhancing the separation time by reducing the number of microelectrode arrays and use a fibre insertion guide and mini lens to improve the performance of fibre optic detection.

Author Contributions

All the authors made substantive contributions to the supervision and all endorse the results and conclusions.

Funding

This research was funded by Malaysia Ministry of Science, Technology and Innovation (MOSTI) for funding this project (SF-02-01-04-SF1214) and Majlis Amanah Rakyat (MARA) for providing financial assistance.

Acknowledgments

We would like to thank Zalini Yunus from Science and Technology Research Institute for Defence, Malaysia Ministry of Defence, Malaysia and Ashaari Yusof from TM R&D, Malaysia for providing the assistance needed for this research.

Conflicts of Interest

The authors declare no conflict of interest and the funders had no role in the design of the study; in the collection, analyses, or interpretation of data; in the writing of the manuscript, or in the decision to publish the results.

Abbreviations

The following abbreviations are used in this manuscript:
DFRDry Film Resist
DEP-FFFDielectrophoresis-Field-Flow Fractionation
PDMSPolydimethylsiloxane

References

  1. Mohammed, M.I.; Haswell, S.; Gibson, I. Lab-on-a-chip or Chip-in-a-lab: Challenges of Commercialization Lost in Translation. Procedia Technol. 2015, 20, 54–59. [Google Scholar] [CrossRef] [Green Version]
  2. Neužil, P.; Campos, C.D.M.; Wong, C.C.; Soon, J.B.W.; Reboud, J.; Manz, A. From chip-in-a-lab to lab-on-a-chip: Towards a single handheld electronic system for multiple application-specific lab-on-a-chip (ASLOC). Lab Chip 2014, 14, 2168–2176. [Google Scholar] [CrossRef] [PubMed]
  3. Kasukurti, A.; Eggleton, C.D.; Desai, S.A.; Disharoon, D.I.; Marr, D.W.M. A simple microfluidic dispenser for single-microparticle and cell samples. Lab Chip 2014, 14, 4673–4679. [Google Scholar] [CrossRef] [Green Version]
  4. Khashan, S.A.; Dagher, S.; Alazzam, A. Microfluidic multi-target sorting by magnetic repulsion. Microfluid. Nanofluidics 2018, 22, 64. [Google Scholar] [CrossRef]
  5. Lee, W.; Kwon, D.; Choi, W.; Jung, G.Y.; Au, A.K.; Folch, A.; Jeon, S. 3D-printed microfluidic device for the detection of pathogenic bacteria using size-based separation in helical channel with trapezoid cross-section. Sci. Rep. 2015, 5, 7717. [Google Scholar] [CrossRef] [PubMed]
  6. Ngamsom, B.; Esfahani, M.M.; Phurimsak, C.; Lopez-Martinez, M.J.; Raymond, J.C.; Broyer, P.; Patel, P.; Pamme, N. Multiplex sorting of foodborne pathogens by on-chip free-flow magnetophoresis. Anal. Chim. Acta 2016, 918, 69–76. [Google Scholar] [CrossRef]
  7. Bayrac, A.T.; Sefah, K.; Parekh, P.; Bayrac, C.; Gulbakan, B.; Oktem, H.A.; Tan, W. In vitro selection of DNA aptamers to glioblastoma multiforme. ACS Chem. Neurosci. 2011, 2, 175–181. [Google Scholar] [CrossRef] [PubMed]
  8. Schmid, L.; Weitz, D.A.; Franke, T. Sorting drops and cells with acoustics: Acoustic microfluidic fluorescence-activated cell sorter. Lab Chip 2014, 14, 3710–3718. [Google Scholar] [CrossRef]
  9. Lee, S.; Kim, H.; Lee, W.; Kim, J. Microfluidic-based cell handling devices for biochemical applications. J. Micromech. Microeng. 2018, 28, 123001. [Google Scholar] [CrossRef]
  10. Pop, P.; Alistar, M.; Stuart, E.; Madsen, J. Fault-Tolerant Digital Microfuidic Biochips; Springer International Publishing: Cham, Switzerland, 2015. [Google Scholar]
  11. Guo, X. Surface plasmon resonance based biosensor technique: A review. J. Biophotonics 2012, 5, 483–501. [Google Scholar] [CrossRef] [PubMed]
  12. Tawil, N.; Sacher, E.; Mandeville, R.; Meunier, M. Surface plasmon resonance detection of E. coli and methicillin-resistant S. aureus using bacteriophages. Biosens. Bioelectron. 2012, 37, 24–29. [Google Scholar] [CrossRef] [PubMed]
  13. Liu, C.H. Bubble-Actuated Microfluidic Switch. In Encyclopedia of Microfluidics and Nanofluidics; Li, D., Ed.; Springer: New York, NY, USA, 2015; pp. 221–237. [Google Scholar]
  14. Kim, Y.B.; Yang, J.S.; Moon, M.H. Investigation of steric transition with field programming in frit inlet asymmetrical flow field-flow fractionation. J. Chromatogr. 2018, 1576, 131–136. [Google Scholar] [CrossRef] [PubMed]
  15. Chung, J.; Chen, Y.; Kim, S.J. High-density impedance-sensing array on complementary metal-oxide-semiconductor circuitry assisted by negative dielectrophoresis for single-cell-resolution measurement. Sens. Actuators B Chem. 2018, 266, 106–114. [Google Scholar] [CrossRef]
  16. Mohammad, K.; Buchanan, D.A.; Braasch, K.; Butler, M.; Thomson, D.J. CMOS single cell dielectrophoresis cytometer. Sens. Actuators Chem. 2017, 249, 246–255. [Google Scholar] [CrossRef]
  17. Lewpiriyawong, N.; Yang, C. Dielectrophoresis field-flow fractionation for continuous-flow separation of particles and cells in microfluidic devices. In Advances in Transport Phenomena; Springer: Cham, Switzerland, 2014; pp. 29–62. [Google Scholar]
  18. Cheng, I.F.; Chang, H.C.; Hou, D.; Chang, H.C. An integrated dielectrophoretic chip for continuous bioparticle filtering, focusing, sorting, trapping, and detecting. Biomicrofluidics 2007, 1, 021503. [Google Scholar] [CrossRef] [PubMed] [Green Version]
  19. Didar, T.F.; Tabrizian, M. Adhesion based detection, sorting and enrichment of cells in microfluidic Lab-on-Chip devices. Lab Chip 2010, 10, 3043–3053. [Google Scholar] [CrossRef]
  20. Srinivasan, V.; Pamula, V.K.; Fair, R.B. An integrated digital microfluidic lab-on-a-chip for clinical diagnostics on human physiological fluids. Lab Chip 2004, 4, 310–315. [Google Scholar] [CrossRef]
  21. Temiz, Y.; Lovchik, R.D.; Kaigala, G.V.; Delamarche, E. Lab-on-a-chip devices: How to close and plug the lab? Microelectron. Eng. 2015, 132, 156–175. [Google Scholar] [CrossRef]
  22. Yeow, J.T.; Wan, W. Lab-on-Chip devices for separation-based detection. In Encyclopedia of Microfluidics and Nanofluidics; Li, D., Ed.; Springer: New York, NY, USA, 2015; pp. 1570–1580. [Google Scholar]
  23. Nasseri, B.; Soleimani, N.; Rabiee, N.; Kalbasi, A.; Karimi, M.; Hamblin, M.R. Point-of-care microfluidic devices for pathogen detection. Biosens. Bioelectron. 2018. [Google Scholar] [CrossRef]
  24. Kim, N.; Kim, W.Y. Measurement of polyphenol oxidase activity using optical waveguide lightmode spectroscopy-based immunosensor. Food Chem. 2015, 169, 211–217. [Google Scholar] [CrossRef] [PubMed]
  25. Syal, K.; Wang, W.; Shan, X.; Wang, S.; Chen, H.Y.; Tao, N. Plasmonic imaging of protein interactions with single bacterial cells. Biosens. Bioelectron. 2015, 63, 131–137. [Google Scholar] [CrossRef] [PubMed]
  26. Eser, E.; Ekiz, O.Ö.; Çelik, H.; Sülek, S.; Dana, A.; Ekiz, H.İ. Rapid Detection of Foodborne Pathogens by Surface Plasmon Resonance Biosensors. Int. J. Biosci. Biochem. Bioinform. 2015, 5, 329. [Google Scholar]
  27. Wandermur, G.; Rodrigues, D.; Allil, R.; Queiroz, V.; Peixoto, R.; Werneck, M.; Miguel, M. Plastic optical fiber-based biosensor platform for rapid cell detection. Biosens. Bioelectron. 2014, 54, 661–666. [Google Scholar] [CrossRef]
  28. Zibaii, M.I.; Latifi, H.; Saeedian, Z.; Chenari, Z. Nonadiabatic tapered optical fiber sensor for measurement of antimicrobial activity of silver nanoparticles against Escherichia coli. J. Photochem. Photobiol. Biol. 2014, 135, 55–64. [Google Scholar] [CrossRef]
  29. Nicolini, A.M.; Fronczek, C.F.; Yoon, J.Y. Droplet-based immunoassay on a ‘sticky’nanofibrous surface for multiplexed and dual detection of bacteria using smartphones. Biosens. Bioelectron. 2015, 67, 560–569. [Google Scholar] [CrossRef] [PubMed]
  30. Kumar, N.; Hu, Y.; Singh, S.; Mizaikoff, B. Emerging biosensor platforms for the assessment of water-borne pathogens. Analyst 2018, 143, 359–373. [Google Scholar] [CrossRef] [PubMed]
  31. Wu, J.; Gu, M. Microfluidic sensing: State of the art fabrication and detection techniques. J. Biomed. Opt. 2011, 16, 080901. [Google Scholar] [CrossRef] [PubMed]
  32. Ng, A.H.; Uddayasankar, U.; Wheeler, A.R. Immunoassays in microfluidic systems. Anal. Bioanal. Chem. 2010, 397, 991–1007. [Google Scholar] [CrossRef] [PubMed]
  33. Han, K.N.; Li, C.A.; Seong, G.H. Microfluidic chips for immunoassays. Annu. Rev. Anal. Chem. 2013, 6, 119–141. [Google Scholar] [CrossRef]
  34. Duval, D.; González-Guerrero, A.B.; Dante, S.; Osmond, J.; Monge, R.; Ledesma, L.J.F.; Zinoviev, K.E.; Domínguez, C.; Lechuga, L.M. Nanophotonic lab-on-a-chip platforms including novel bimodal interferometers, microfluidics and grating couplers. Lab Chip 2012, 12, 1987–1994. [Google Scholar] [CrossRef] [PubMed]
  35. Zinoviev, K.E.; González-Guerrero, A.B.; Domínguez, C.; Lechuga, L.M. Integrated bimodal waveguide interferometric biosensor for label-free analysis. J. Light. Technol. 2011, 29, 1926–1930. [Google Scholar] [CrossRef]
  36. Kamuri, F.; Abidin, Z.Z.; Yunus, N.A.M.; Hamidon, M.N.; Yaacob, M.H.; Kamarudin, S.; Zhukhi, S.Z. Optimization on the preparation of microfluidic channel using dry film resist. In Proceedings of the 2015 International Conference on Smart Sensors and Application (ICSSA), Kuala Lumpur, Malaysia, 26–28 May 2015; pp. 11–15. [Google Scholar]
  37. Gauri, S.; Abidin, Z.Z.; Kamuri, M.F.; Mahdi, M.A.; Md Yunus, N.A. Detection of Aeromonas hydrophila using fiber optic microchannel sensor. J. Sens. 2017. [Google Scholar] [CrossRef]
  38. Markx, G.H.; Huang, Y.; Zhou, X.F.; Pethig, R. Dielectrophoretic characterization and separation of microorganisms. Microbiology 1994, 140, 585–591. [Google Scholar] [CrossRef]
  39. Markx, G.H.; Pethig, R. Dielectrophoretic separation of cells: Continuous separation. Biotechnol. Bioeng. 1995, 45, 337–343. [Google Scholar] [CrossRef]
  40. Suehiro, J.; Hamada, R.; Noutomi, D.; Shutou, M.; Hara, M. Selective detection of viable bacteria using dielectrophoretic impedance measurement method. J. Electrost. 2003, 57, 157–168. [Google Scholar] [CrossRef]
  41. Wang, Z.; Hansen, O.; Petersen, P.K.; Rogeberg, A.; Kutter, J.P.; Bang, D.D.; Wolff, A. Dielectrophoresis microsystem with integrated flow cytometers for online monitoring of sorting efficiency. Electrophoresis 2006, 27, 5081–5092. [Google Scholar] [CrossRef] [PubMed]
  42. Markx, G.H.; Talary, M.S.; Pethig, R. Separation of viable and non-viable yeast using dielectrophoresis. J. Biotechnol. 1994, 32, 29–37. [Google Scholar] [CrossRef]
  43. Fernandez, R.E.; Rohani, A.; Farmehini, V.; Swami, N.S. Microbial analysis in dielectrophoretic microfluidic systems. Anal. Chim. Acta 2017, 966, 11–33. [Google Scholar] [CrossRef] [PubMed]
  44. Alder, G.M.; Arnold, W.M.; Bashford, C.L.; Drake, A.F.; Pasternak, C.A.; Zimmermann, U. Divalent cation-sensitive pores formed by natural and synthetic melittin and by Triton X-100. Biochim. Biophys. Acta-Biomembr. 1991, 1061, 111–120. [Google Scholar] [CrossRef]
  45. Freitag, R.; Schügerl, K.; Arnold, W.M.; Zimmermann, U. The effect of osmotic and mechanical stresses and enzymatic digestion on the electro-rotation of insect cells (Spodoptera frugiperda). J. Biotechnol. 1989, 11, 325–335. [Google Scholar] [CrossRef]
  46. Sukhorukov, V.L.; Arnold, W.M.; Zimmermann, U. Hypotonically induced changes in the plasma membrane of cultured mammalian cells. J. Membr. Biol. 1993, 132, 27–40. [Google Scholar] [CrossRef] [PubMed]
  47. Hesselman, M.C.; Odoni, D.I.; Ryback, B.M.; De Groot, S.; Van Heck, R.G.A.; Keijsers, J.; Kolkman, P.; Nieuwenhuijse, D.; Van Nuland, Y.M.; Sebus, E.; et al. A multi-platform flow device for microbial (co-) cultivation and microscopic analysis. PLoS ONE 2012, 7, e36982. [Google Scholar] [CrossRef] [PubMed]
  48. Bharadwaj, R.; Sai, V.V.R.; Thakare, K.; Dhawangale, A.; Kundu, T.; Titus, S.; Verma, P.K.; Mukherji, S. Evanescent wave absorbance based fiber optic biosensor for label-free detection of E. coli at 280 nm wavelength. Biosens. Bioelectron. 2011, 26, 3367–3370. [Google Scholar] [CrossRef] [PubMed]
  49. Bercu, M.; Zhou, X.; Lee, A.C.; Poenar, D.P.; Heng, C.K.; Tan, S.N. Spectral characterization of yeast cells with an epitaxy-based UV-Vis optical sensor. Biomed. Microdevices 2006, 8, 177–185. [Google Scholar] [CrossRef] [PubMed]
  50. Markx, G.H.; Dyda, P.A.; Pethig, R. Dielectrophoretic separation of bacteria using a conductivity gradient. J. Biotechnol. 1996, 51, 175–180. [Google Scholar] [CrossRef]
  51. Wang, X.B.; Huang, Y.; Gascoyne, P.R.; Becker, F.F. Dielectrophoretic manipulation of particles. IEEE Trans. Ind. Appl. 1997, 33, 660–669. [Google Scholar] [CrossRef]
  52. Shim, S.; Stemke-Hale, K.; Noshari, J.; Becker, F.F.; Gascoyne, P.R. Dielectrophoresis has broad applicability to marker-free isolation of tumor cells from blood by microfluidic systems. Biomicrofluidics 2013, 7, 011808. [Google Scholar] [CrossRef] [Green Version]
  53. Boedo, S. Formation of dynamic reconfigurable electric field gradients in thin lubricant films through transient elastohydrodynamic squeeze film action. Tribol. Int. 2017, 116, 329–337. [Google Scholar] [CrossRef]
  54. Polniak, D.V.; Goodrich, E.; Hill, N.; Lapizco-Encinas, B.H. Separating large microscale particles by exploiting charge differences with dielectrophoresis. J. Chromatogr. 2018, 1545, 84–92. [Google Scholar] [CrossRef] [PubMed]
  55. Zhao, K.; Li, D. Continuous separation of nanoparticles by type via localized DC-dielectrophoresis using asymmetric nano-orifice in pressure-driven flow. Sens. Actuators B Chem. 2017, 250, 274–284. [Google Scholar] [CrossRef]
Figure 1. Interdigitated castellated microelectrode mask design with width and length of 1 c m and nearly 3 c m respectively.
Biosensors 09 00040 g001
Figure 2. A schematic diagram of the integrated Lab on Chip system.
Biosensors 09 00040 g002
Figure 3. Fibre alignment setup using UV spectrometer and ball bearing vertical linear stages.
Biosensors 09 00040 g003
Figure 4. Experimental setup for integrated lab on chip.
Biosensors 09 00040 g004
Figure 5. After 90 min of separation time, the E. coli concentration reduced significantly from the microelectrodes array 500 at a low conductivity σ m of 40 μ S/ c m , pulsing time of 12 s and a high fluid flow of 9.6 μ L min 1 . The flow direction was from left to right.
Biosensors 09 00040 g005
Figure 6. After 90 min of separation time, the S. cerevisiae concentration reduced gradually from the microelectrodes array 500 at a low conductivity σ m of 40 μ S/ c m , a pulsing time of 12 s and a high fluid flow of 9.6 μ L min 1 . The flow direction was from left to right.
Biosensors 09 00040 g006
Figure 7. Percentage of E. coli cells attracted to the microelectrode as a function of time, comparing the pulsing time applied with the variation of flow rate.
Biosensors 09 00040 g007
Figure 8. Percentage of S. cerevisiae cells attracted to the microelectrode as a function of time, comparing the pulsing time applied with the variation of flow rate.
Biosensors 09 00040 g008
Figure 9. Comparison of the rate of release of E. coli and S. cerevisiae cells from the microelectrode at different flow rates and pulsing times.
Biosensors 09 00040 g009
Figure 10. After 60 min of separation time, the mixture of E. coli and S. cerevisiae concentrations were still attracted to the microelectrodes at a low conductivity σ m of 40 μ S/ c m , pulsing time of 12 s and a high fluid flow 9.6 μ L min 1 . The frequency applied was 1 M Hz with a voltage of 14 V pk-pk. The flow direction was from left to right.
Biosensors 09 00040 g010
Figure 11. The percentage of cumulative absorbance of E. coli and S. cerevisiae cells that passed through the detection channel as a function of time at the pulsing time of 12 s applied with a flow rate of 9.6 μ L min 1 .
Biosensors 09 00040 g011
Table 1. Flow rates and pulsing times used in the experiments.
Flow Rate ( μ L/min)Pulsing Time (s)
1.22
4
12
24
2.42
4
12
24
6.02
4
12
24
9.62
4
12
24

