The Effect of 3-Thiopheneacetic Acid in the Polymerization of a Conductive Electrotextile for Use in Biosensor Development


Abstract
:1. Introduction
2. Experimental
2.1. Materials
2.2. Synthesis
2.3. Characterizations
2.3.1. Scanning Electron Microscopy and Energy Dispersive Spectroscopy
2.3.2. FTIR Analysis
2.3.3. Electrical Resistivity
2.3.4. Avidin Attachment and Fluorescent Output
3. Results and Discussion
3.1. Results

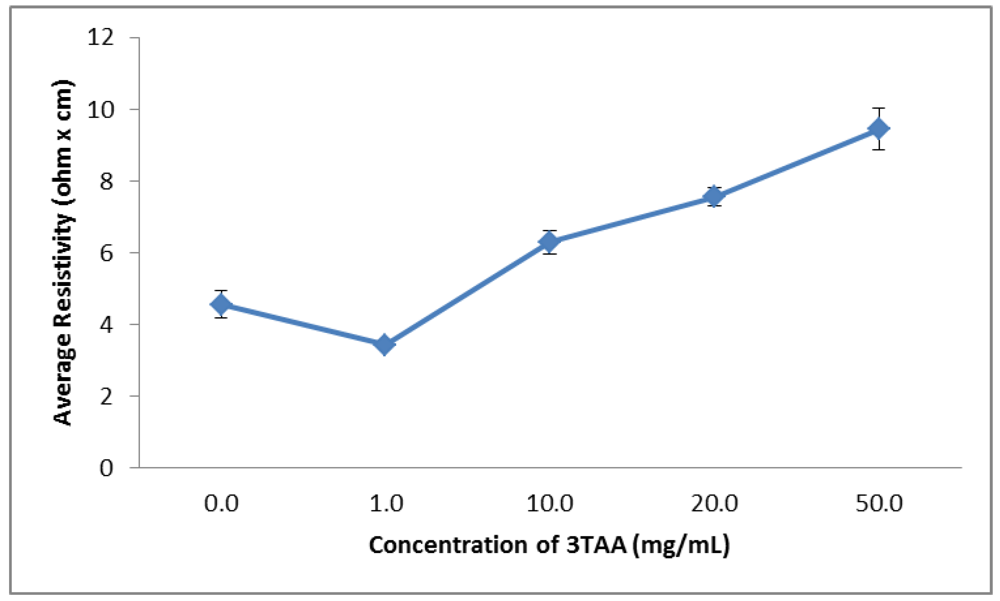
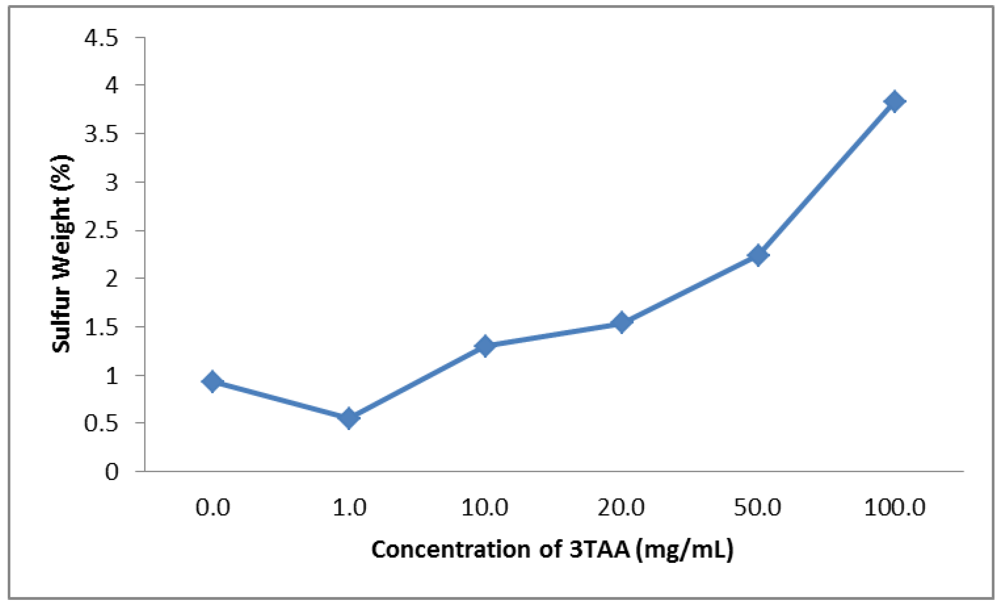
| Concentration of 3TAA(mg/mL) | Average Resistivity(Ω∙cm) | Sulfur Weight(%) | Average Fluorescent Output(RFU) |
|---|---|---|---|
| 0 | 4.6 ± 0.4 | 0.93 | 1.0287 ± 0.0205 |
| 1 | 3.4 ± 0.1 | 0.55 | 1.3870 ± 0.1344 |
| 10 | 6.3 ± 0.3 | 1.30 | 1.4770 ± 0.1875 |
| 20 | 7.6 ± 0.2 | 1.54 | 1.2677 ± 0.1071 |
| 50 | 9.4 ± 0.6 | 2.24 | 1.6453 ± 0.2408 |
| 100 | 1,587.4 ± 429.9 | 3.83 | 3.9623 ± 1.3675 |
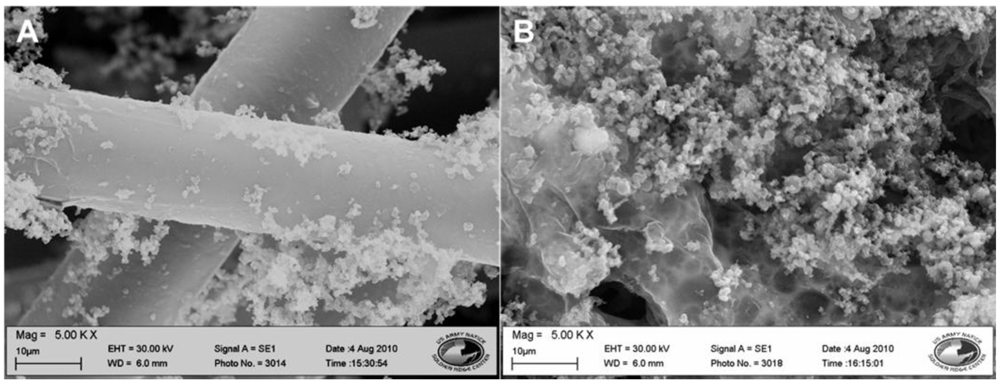
3.1.1. SEM Analysis
3.1.2. Electrical Resistivity

3.1.3. Elemental Weight Percent
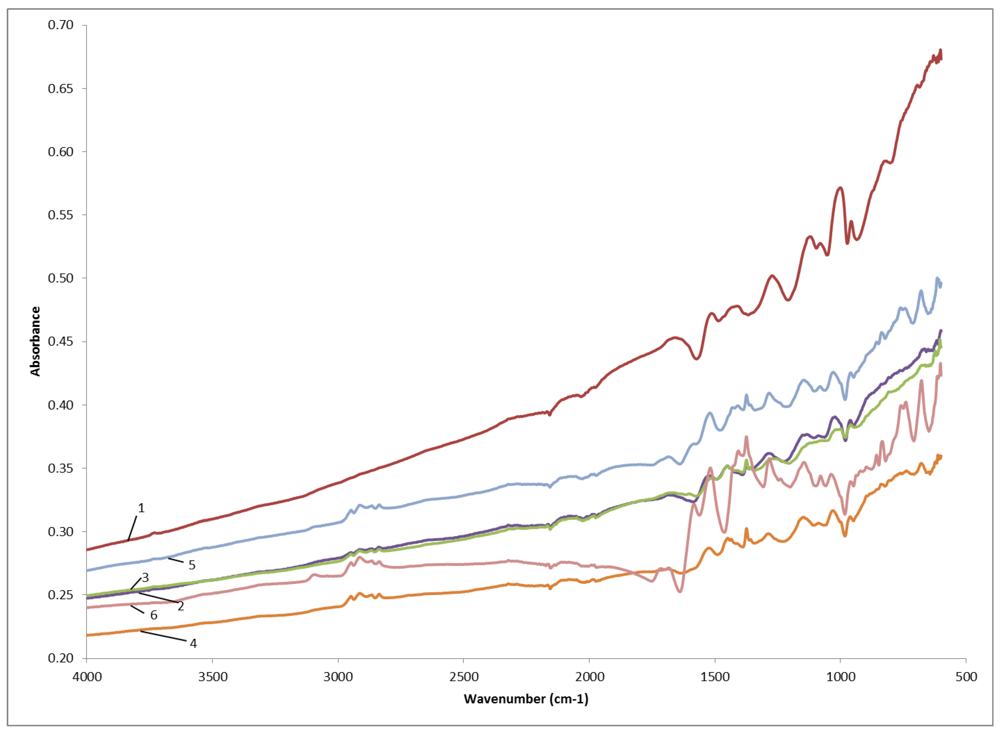
3.1.4. FTIR

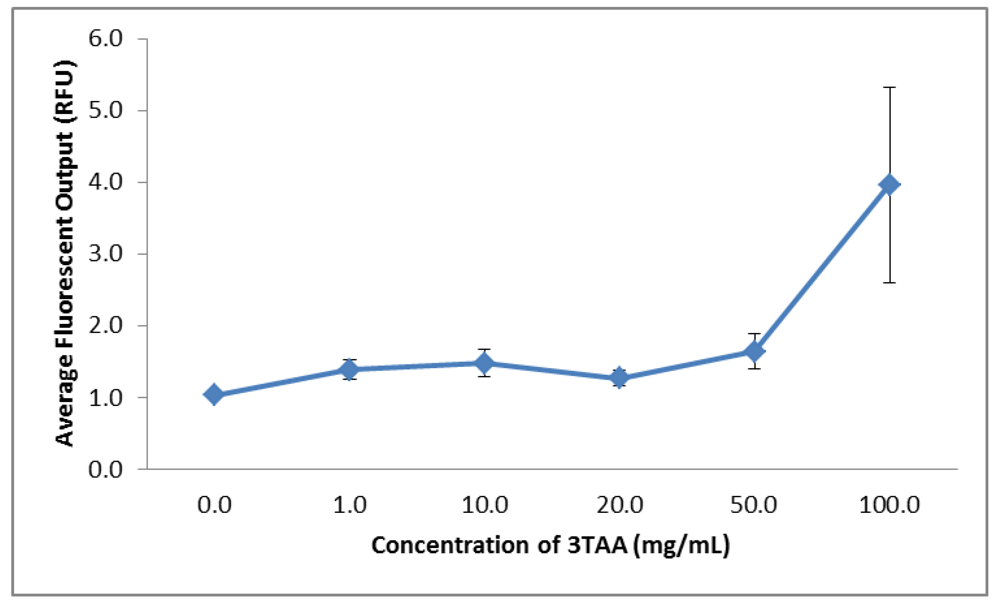
3.1.5. Fluorescence
3.2. Discussion
4. Conclusions
Acknowledgments
Conflict of Interest
References
- Wang, J. Analytical Electrochemistry, 2nd ed.; John Wiley & Sons: New York, NY, USA, 2000; Volume XVI, p. 209. [Google Scholar]
- Alocilja, E.C.; Radke, S.M. Market analysis of biosensors for food safety. Biosens. Bioelectron. 2003, 18, 841–846. [Google Scholar] [CrossRef]
- Swain, A. Biosensors: A new realism. Ann. Biol. Clin. 1992, 50, 175–179. [Google Scholar]
- Warsinke, A. Biosensors for Food Analysis. In Frontiers in Biosensorics II: Practical Applications, 1st ed.; Scheller, F.W., Schubert, F., Fedrowitz, J., Eds.; Birkhauser Basel: Basel, Switzerland, 2000; pp. 121–140. [Google Scholar]
- Munoz-Berbel, X.; Godino, N.; Laczka, O.; Baldrich, E.; Munoz, F.X.; Del Campo, J. Impedance-Based Biosensors for Pathogen Detection. In Principles of Bacterial Detection: Biosensors, Recognition Receptors and Microsystems; Zourob, M., Elwary, S., Turner, A., Eds.; Springer Science + Business Media LLC: New York, NY, USA, 2008; pp. 341–371. [Google Scholar]
- Gregory, R.V.; Kimbrell, W.C.; Kuhn, H.H. Electrically conductive non-metallic textile coatings. J. Ind. Textil. 1991, 20, 167–175. [Google Scholar] [CrossRef]
- Heisey, C.L.; Wightman, J.P.; Pittman, E.H.; Kuhn, H.H. Surface and adhesion properties of polypyrrole-coated textiles. Textil. Res. J. 1993, 63, 247–256. [Google Scholar] [CrossRef]
- Kuhn, H.H.; Kimbrell, W.C. Method for Making Electrically Conductive Textile Materials. U.S. Patent 5,030,508, July 1991. [Google Scholar]
- Kuhn, H.H.; Kimbrell, W.C.; Fowler, J.E.; Barry, C.N. Properties and applications of conductive textiles. Synthetic Met. 1993, 57, 3707–3712. [Google Scholar] [CrossRef]
- Granato, F.; Scampicchio, M.; Bianco, A.; Mannino, S.; Bertarelli, C.; Zerbi, G. Disposable electrospun electrodes based on conducting nanofibers. Electroanalysis 2008, 20, 1374–1377. [Google Scholar] [CrossRef]
- McGraw, S.K.; Anderson, M.J.; Alocilja, E.C.; Marek, P.J.; Senecal, K.J.; Senecal, A.G. Antibody immobilization on conductive polymer coated nonwoven fibers for biosensors. Sens. Transducers J. 2011, 13, 142–149. [Google Scholar]
- Senecal, A.; Magnone, J.; Marek, P.; Senecal, K. Development of functional nanofibrous membrane assemblies towards biological sensing. React. Funct. Polym. 2008, 68, 1429–1434. [Google Scholar] [CrossRef]
- McGraw, S.; Alocilja, E.; Senecal, A.; Senecal, K. Synthesis of a functionalized polypyrrole coated electrotextile for use in biosensors. Biosensors 2012, 2, 465–478. [Google Scholar] [CrossRef]
- McGraw, S.K.; Alocilja, E.; Senecal, K.; Senecal, A. A resistance based biosensor that utilizes conductive microfibers for microbial pathogen detection. OJAB 2012, 1, 36–43. [Google Scholar] [CrossRef]
- Vaddiraju, S.; Seneca, K.; Gleason, K.K. Novel strategies for the deposition of –COOH functionalized conducting copolymer films and the assembly of inorganic nanoparticles on conducting polymer platforms. Adv. Funct. Mater. 2008, 18, 1929–1938. [Google Scholar] [CrossRef]
© 2013 by the authors; licensee MDPI, Basel, Switzerland. This article is an open access article distributed under the terms and conditions of the Creative Commons Attribution license (http://creativecommons.org/licenses/by/3.0/).
Share and Cite
McGraw, S.K.; Alocilja, E.; Senecal, A.; Senecal, K. The Effect of 3-Thiopheneacetic Acid in the Polymerization of a Conductive Electrotextile for Use in Biosensor Development. Biosensors 2013, 3, 286-296. https://doi.org/10.3390/bios3030286
McGraw SK, Alocilja E, Senecal A, Senecal K. The Effect of 3-Thiopheneacetic Acid in the Polymerization of a Conductive Electrotextile for Use in Biosensor Development. Biosensors. 2013; 3(3):286-296. https://doi.org/10.3390/bios3030286
Chicago/Turabian StyleMcGraw, Shannon K., Evangelyn Alocilja, Andre Senecal, and Kris Senecal. 2013. "The Effect of 3-Thiopheneacetic Acid in the Polymerization of a Conductive Electrotextile for Use in Biosensor Development" Biosensors 3, no. 3: 286-296. https://doi.org/10.3390/bios3030286
APA StyleMcGraw, S. K., Alocilja, E., Senecal, A., & Senecal, K. (2013). The Effect of 3-Thiopheneacetic Acid in the Polymerization of a Conductive Electrotextile for Use in Biosensor Development. Biosensors, 3(3), 286-296. https://doi.org/10.3390/bios3030286