Article

Genetically Encoded Fluorescent Biosensors Enable Noninvasive Real-Time Visualization of Nitrate Dynamics in Intact Living Plants


by
Li Zhang
1,
Qing Xu
1,
Changxu Wang
1,
Jinfeng Wang
1,
Jing Yue
1,
Yin Lu
1,
Guangle Zhang
1,
Lixue Yuan
1,
Yonghua Wang
1,2,3,
Bo Yu
1,2,3,* and
Guozhang Kang
1,2,3,*
1
The National Engineering Research Center for Wheat, Henan Agricultural University, Zhengzhou 450046, China
2
The State Key Laboratory of High-Efficiency Production of Wheat-Maize Double Cropping, Henan Agricultural University, Zhengzhou 450046, China
3
Functional Crop Engineering Center in Henan Province, Henan Agricultural University, Zhengzhou 450046, China
*
Authors to whom correspondence should be addressed.
Biosensors 2026, 16(5), 243; https://doi.org/10.3390/bios16050243
Submission received: 20 March 2026 / Revised: 19 April 2026 / Accepted: 23 April 2026 / Published: 26 April 2026

Abstract

Nitrate (NO3) serves as a pivotal molecule with dual functions in nutrient supply and signaling during plant growth and development. Precise monitoring of its spatiotemporal dynamics in planta is therefore essential for dissecting the regulatory mechanisms underlying plant nitrogen metabolism. However, conventional nitrate detection methods suffer from inherent limitations, including destructive sampling, insufficient spatiotemporal resolution, and an inability to achieve real-time whole-plant monitoring. Here, we report a genetically encoded nitrate biosensor, designated NitNRCL1, constructed using a split firefly luciferase complementation system. Functional validation in both prokaryotic and eukaryotic systems demonstrates that NitNRCL1 responds to changes in nitrate availability and generates stable chemiluminescent signals in bacteria and diverse plant species. Importantly, NitNRCL1 enables non-invasive, real-time, and whole-plant monitoring of nitrate levels in living plants. Using NitNRCL1, we successfully imaged the spatiotemporal dynamics of nitrate signaling in Arabidopsis thaliana. Collectively, our findings establish NitNRCL1 as a robust and novel tool for investigating nitrate transport, signaling, and metabolic pathways in plants. This biosensor advances our mechanistic understanding of plant nitrate biology and provides a technical foundation for breeding nitrogen-use-efficient crops and developing precision fertilization strategies.

1. Introduction

Nitrate (NO3) serves as the primary form of inorganic nitrogen absorbed by plants, exhibiting rapid root uptake and representing the preferred nitrogen source for the majority of crop species. As an indispensable macronutrient, NO3 participates in the biosynthesis of critical biomolecules including chlorophyll, amino acids, proteins, and nucleic acids, thereby directly modulating photosynthetic efficiency and crop productivity [1]. Furthermore, optimal endogenous NO3 concentrations facilitate the acquisition of other mineral nutrients such as phosphorus and potassium, ultimately enhancing plant nutrient use efficiency. Beyond its role as a fundamental nutritional substrate, NO3 functions as a pivotal signaling molecule governing global plant growth and developmental programs, characterized by three hallmark properties: rapid transient responsiveness, metabolic independence, and genome-wide transcriptional reprogramming [2,3]. Distinct physiological responses are triggered in planta within seconds to 1 h following NO3 application [4]. Recent advances employing biosensor technology and in vivo real-time imaging have revealed that calcium ions and cytokinins synergistically mediate long-distance nitrogen signaling between plant roots and shoots, enabling precise coordination of whole-plant nitrogen use efficiency and holistic growth trajectories [5,6]. As an irreplaceable metabolite with dual nutritional and signaling functionalities in plants [7], NO3 executes unique and non-redundant physiological roles.
Plant NO3 uptake constitutes a tightly regulated, spatiotemporally coordinated active metabolic process encompassing three sequential steps: uptake, translocation, and assimilation, which relies on an intact transmembrane transport cascade spanning from the rhizosphere soil to the interior of plant cells [3,8]. The concentration of NO3 in soil solution fluctuates drastically across a broad range from micromolar to millimolar levels [9]. To adapt to this wide concentration spectrum, plants have evolved two functionally distinct NO3 transport systems mediated by evolutionarily conserved transporter families: the NRT1/NPF family and the NRT2 family. Specifically, the high-affinity NO3 transport system (HATS) displays a Michaelis constant (K) of approximately 50 μM, whereas the low-affinity NO3 transport system (LATS) exhibits a K of roughly 5–12 mM [10,11]. These two systems collectively enable plants to efficiently acquire NO3 across the entire physiologically relevant concentration range. Following cellular uptake, NO3 undergoes long-distance root-shoot translocation and subsequent reallocation via the cyclic vascular network, with upward transport through the xylem and downward redistribution through the phloem [3,12,13]. Subcellular partitioning of NO3 directly dictates its assimilation efficiency: the vacuole acts as the primary NO3 storage compartment, accounting for 60–80% of total cellular NO3 content [14], while the cytoplasm serves as the exclusive site for NO3 metabolism [15]. Dynamic homeostasis between these two compartments is maintained by tonoplast-localized NO3 transporters, which stabilize cytoplasmic NO3 concentrations at 1–5 mM [15,16] to precisely match the catalytic activity requirements of nitrate reductase. Despite substantial progress in dissecting the core molecular mechanisms and regulatory networks underlying plant NO3 uptake, the spatiotemporal dynamic crosstalk between NO3 uptake and utilization, diverse environmental signals, and downstream chemical signaling cascades remains poorly understood.
Conventional NO3 detection techniques, including colorimetry [17], ion chromatography (IC) [18], radioisotope tracing [19], and high-performance liquid chromatography-tandem mass spectrometry (HPLC-MS) [20], enable accurate quantitative data but are destructive to plant specimens and lack the spatiotemporal resolution required to monitor dynamic NO3 fluctuations in living plants. In vivo detection approaches such as ion-selective microelectrode (ISME) analysis offer micrometer-scale high spatial resolution [21], yet fail to effectively capture the spatiotemporal dynamics of NO3 levels in biological samples.
Fluorescence resonance energy transfer (FRET)-based biosensors enable optical probing of biological tissues with high spatiotemporal resolution, leveraging their exceptional subcellular resolution and millisecond-scale response kinetics [22]. However, this technology is intrinsically reliant on microscopic imaging and high-intensity excitation illumination, rendering long-term in vivo monitoring and whole-plant detection of plant samples challenging. To circumvent this limitation and satisfy the pressing need for real-time, whole-plant, high-resolution monitoring of NO3 dynamics in planta, we developed a genetically encoded NO3 biosensor, designated NitNRCL1, which employs split firefly luciferase (Fluc) as a signal transducer [23]. Designed for non-invasive, longitudinal imaging at the whole-plant scale, NitNRCL1 enables precise, direct, and reversible detection of NO3 within the physiological concentration range of living plants, without inducing tissue damage or perturbing endogenous metabolic processes. This novel biosensor provides a robust methodological framework for dissecting the intricate molecular and physiological mechanisms governing plant NO3 metabolism, as well as exploring the interplay between NO3 utilization, environmental signaling, and plant growth regulation.

2. Materials and Methods

2.1. DNA Constructs

The construction of the sensor expression vector has been described [24]. In this study, the coding sequence of the cyanobacterial NrtA protein (PDB ID: 2G29) was optimized for plant codon usage bias and synthesized by Tsingke Biotechnology Co., Ltd. (Beijing, China). The constructs were inserted into the prokaryotic expression vector pCold II via conventional homologous recombination, harboring the 6 × Histidine tag for the purification of the recombinant fusion protein. The correct reading frame of the sensor was confirmed by sequencing analysis (Supplemental Figure S1).

2.2. NO3 Detection Analysis of Purified Sensors

The amplification of the NitNRCL1 biosensor was performed in E. coli DH5α, and the E. coli Rosetta (DE3) strain was used for protein production. Cells were induced by 0.3 mM Isopropyl β-D-1-thiogalactopyranoside (IPTG) when OD600 reached 0.6, and proteins were expressed at 16 °C for 20 h in the Luria–Bertani (LB) medium. Thereafter, the culture was pelleted down by centrifugation at 4000× g for 20 min at 4 °C. The pellet was resuspended in 20 mM Tris-Cl pH 8.0 buffer for cell lysis using ultrasonication by following the reported method [25]. Biosensors were purified by metal affinity chromatography [26]. The insoluble cellular debris was cleared by centrifugation (4000× g for 20 min), and the cleared supernatant was subjected to Ni-NTA chromatography. Subsequently, bound protein was eluted by elution buffer (20 mM Tris-Cl and 250 mM Imidazole, pH 8.0). The eluted sensor protein was stored at 4 °C until further use.
To determine the ligand-binding specificity of the NitNRCL1 biosensor protein, the interaction of purified protein with nitrate and other related metabolites, including KCl, KNO3, Gly-Gly, (NH4)2SO4, and K2SO4 (each at 5 mM), was investigated. Experiments were performed in a 96-well plate, where 180 μL of the diluted sensor protein and 20 μL of each ligand were added to each well. After incubating the reaction system at room temperature for 5 min, 10 mM ATP and 10 μg·mL−1 D-luciferin potassium salt were added to initiate the luminescence reaction. Subsequently, the luminescence signal of each well was detected using a Synergy HTX multimode microplate reader (BioTek Instruments, Inc., Winooski, VT, USA), with an integration time of 1 s per well. Three technical replicates were performed for each treatment.
To analyze the binding affinity (Kd) of the NitNRCL1 biosensor protein, the ligand titration curve experiment was performed [23]. This affinity assay was performed in a 96-well plate. In each well, a mixture of 180 μL of NitNRCL1 biosensor protein and 20 μL of nitrate solution with varying concentration ranges (nM to mM) were used. The luminescence signal changes in the reaction system were detected using the aforementioned method to plot the ligand titration curve and determine the binding constant. All analyses were achieved in triplicates.

2.3. Quantitative Detection of Nitrate in Living Cells

The NitNRCL1 biosensor was transformed into E. coli Rosetta (DE3). A single colony was cultured in LB medium containing 100 μg/mL ampicillin at 37 °C until OD600 reached 0.6. Protein expression was induced with 0.3 mM IPTG at 16 °C in the dark for 18 h. The culture was incubated at 4 °C for protein. The expressed bacterial culture was resuspended in 20 mM Tris-Cl buffer (pH 8.0) for further analysis. The luminescent signal was detected using a microplate reader according to the aforementioned method. Each well contained 180 μL of resuspended cells harboring the NitNRCL1 biosensor and 20 μL of different treatment solutions. The bacterial culture was also used for automated luminescence chemical imaging.

2.4. Generating Arabidopsis Transgenic Lines

The NitNRCL1 plants were generated as previously described [27,28,29]. In brief, the NitNRCL1 gene was cloned into the pCAMBIA1302 vector. Transgenic homozygous NitNRCL1 lines were obtained in the Col-0 background by floral dipping. Subsequently, PCR identification was performed using the primers detailed in Supplementary Table S1. Arabidopsis ecotype Columbia (Col-0) was used as the wild type (WT). Plants were grown in soil or on Petri dishes containing 1/2 MS medium at 23/20 °C, under a 16 h/8 h light/dark photoperiod, 60% RH, and a light intensity of 200 μmol m−2 s−1. Seeds were sown on soil/MS media, placed at 4 °C for 4 days in the dark, and then transferred to growth rooms. Transgenic Arabidopsis plants were subjected to different NO3 deficient treatments as required before detection. Wheat and rice transformation for NitNRCL1 was performed by Biorun Bioscience Co., Ltd., Wuhan, China.

2.5. CCD Imaging and LUC Activity Measurement

1 mM luciferin was sprayed onto leaves, and the materials were kept in the dark for 5 min to quench the fluorescence. A low-light cooled CCD imaging apparatus (Tanon 5200, Tanon Science & Technology Co., Ltd., Shanghai, China) was used to capture the LUC image. The camera was cooled to −20 °C and relative LUC activity was measured as described. An exposure time of 3 min with 2 × 2 binning was used for all images taken [30].

2.6. Image Processing and Analysis

Image processing and pixel intensity were quantified using Fiji software (version 1.54f, http://fiji.sc/, accessed on 19 March 2026). Mean gray values of regions of interest (ROIs) within the root meristem region were calculated as follows: Background was subtracted from all measured intensities as generated ROIs where there was no plant material.

3. Results

3.1. Design and Optimization of NO3 Biosensors

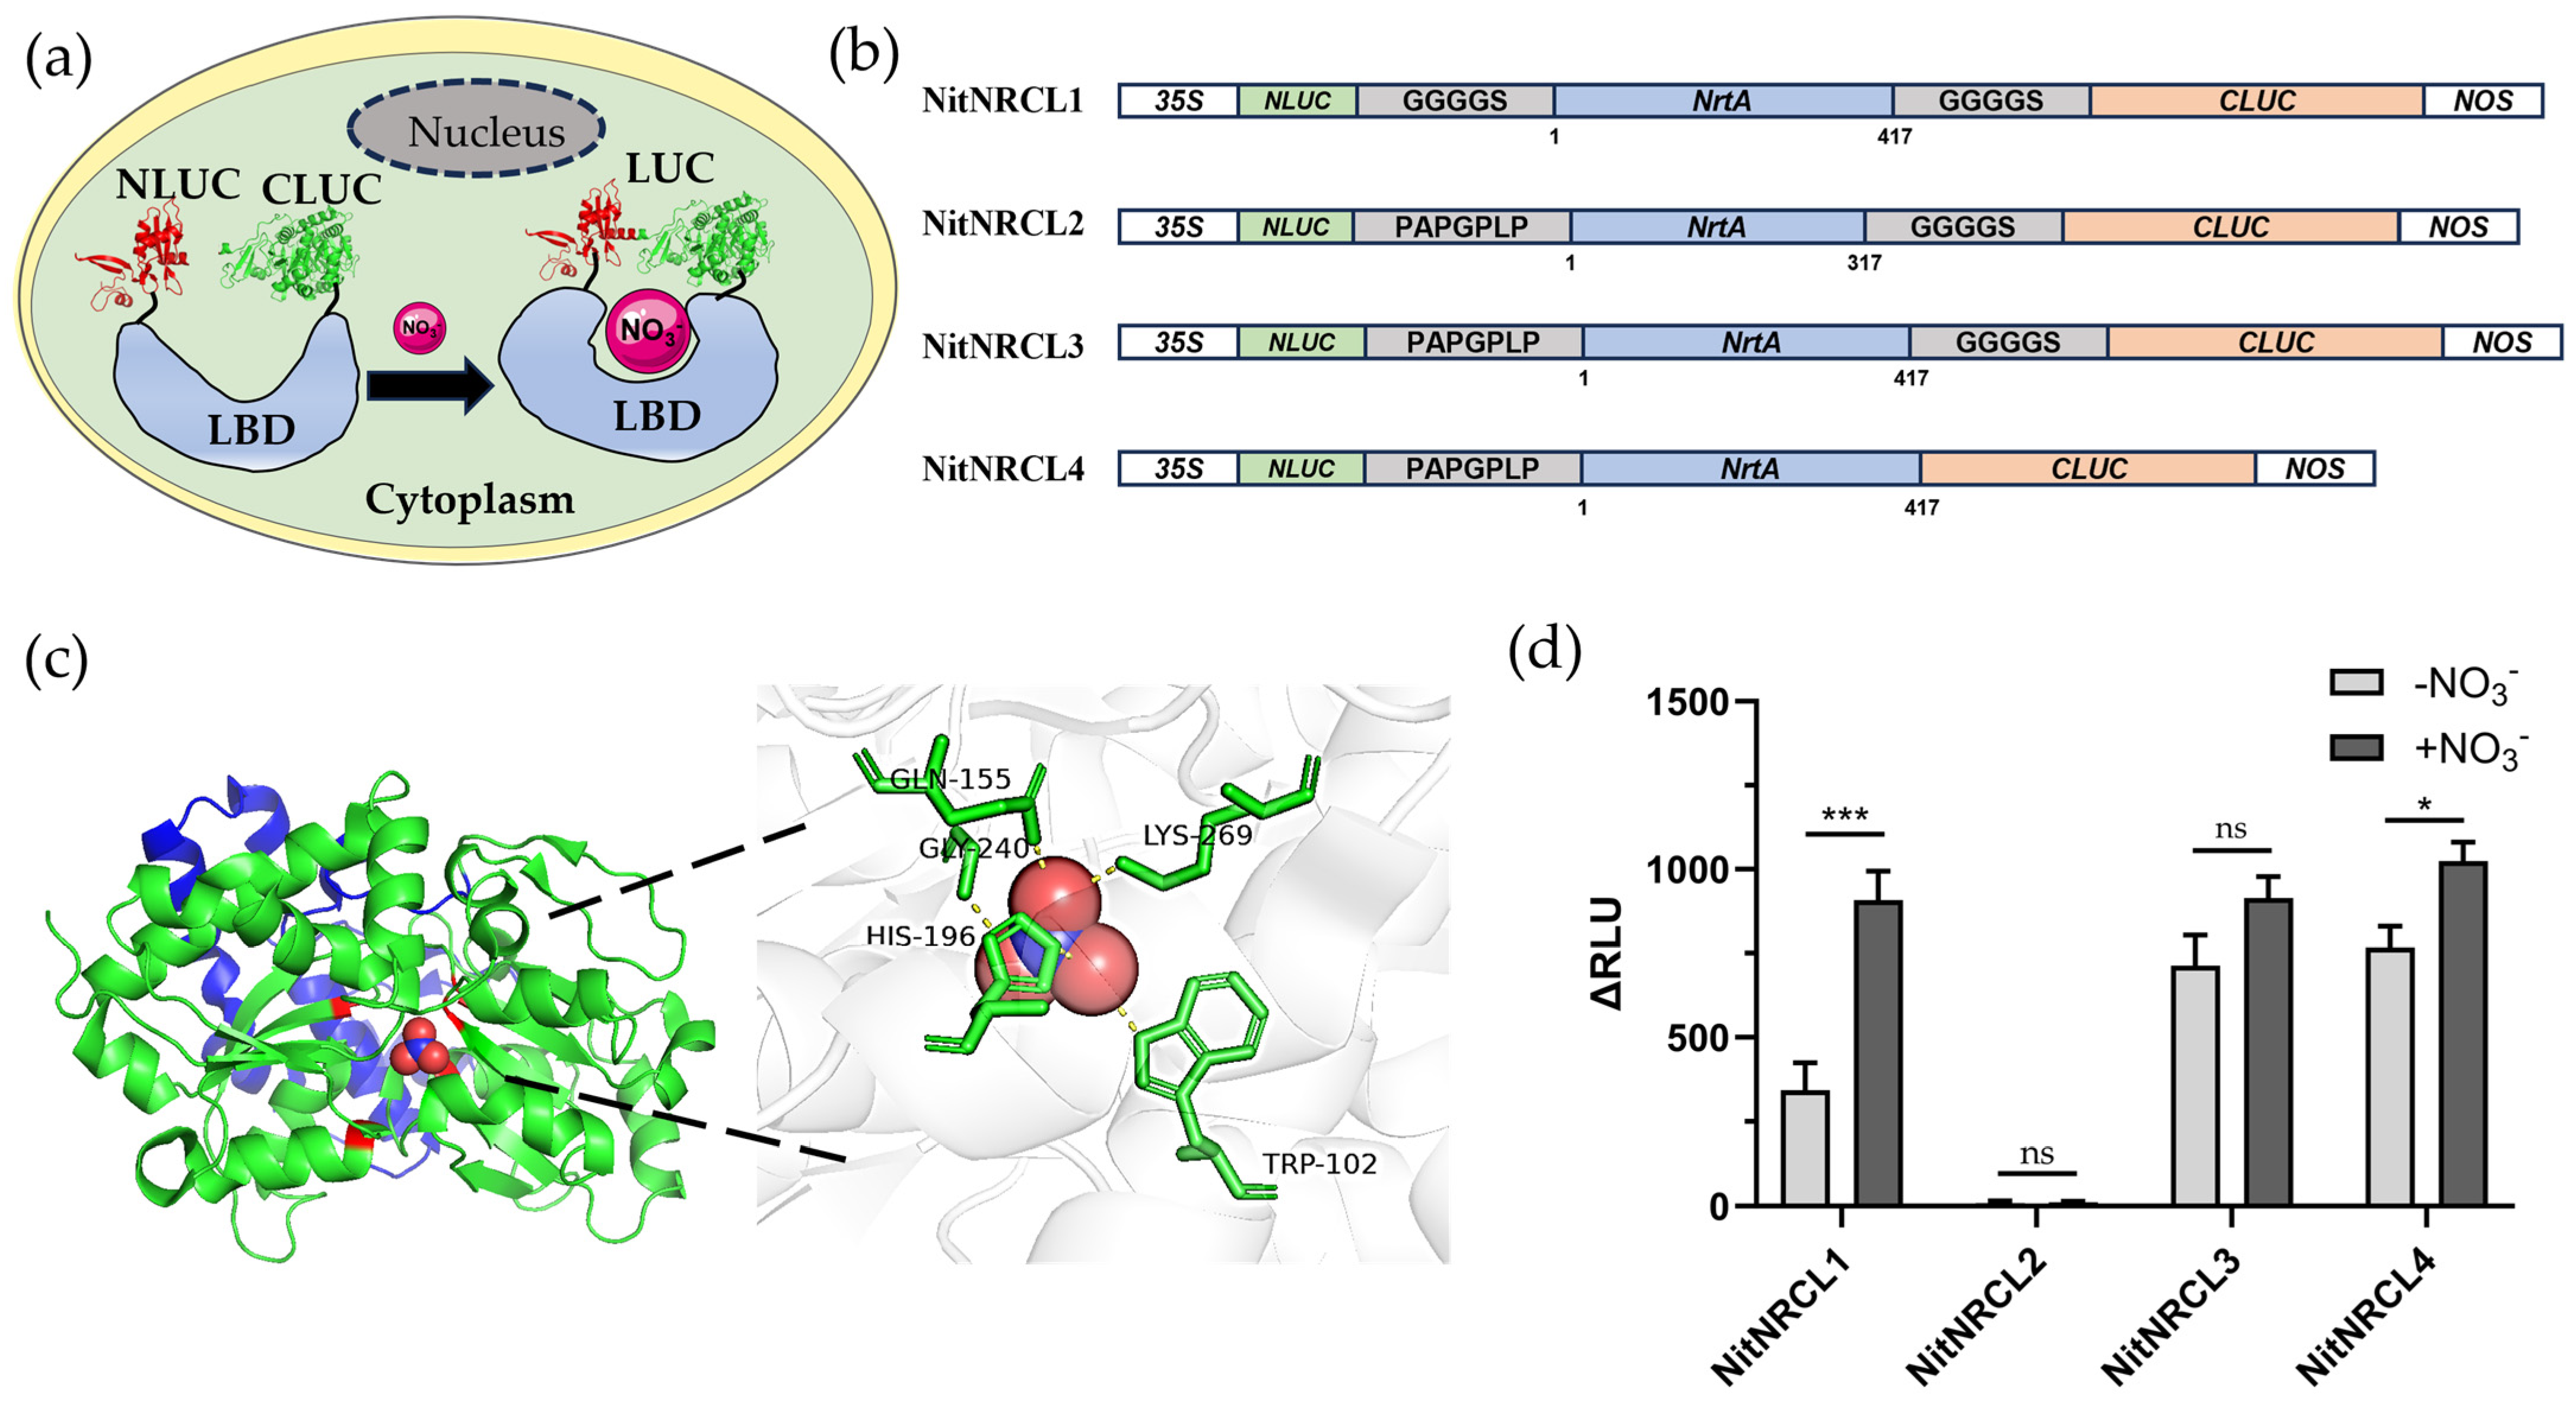
To achieve real-time visual monitoring of NO3 in living plants, we constructed a NO3-specific biosensor based on the split firefly luciferase complementation system. The core design rationale of the biosensor is as follows: the NO3 recognition domain (LBD) is inserted between split luciferase fragments (NLuc/CLuc) (Figure 1a). Upon binding to NO3, the recognition domain undergoes a conformational shift, which drives the complementation and reconstitution of luciferase fragments, thereby restoring catalytic activity and generating a chemiluminescent signal. Members of the bacterial periplasmic binding protein (PBP) superfamily exhibit high-specificity binding affinity for small-molecule ligands, and have been exploited to develop diverse biosensors for detecting analytes including glucose [31], glutamate [32], maltose [33], glutamine [34], Zn2+ [35], and phosphate [36]. In this study, the cyanobacterium-derived NrtA protein was selected as the NO3 recognition domain. Crystal structure analysis reveals that NrtA adopts a C-clamp conformation, with the NO3 binding pocket situated between two structural domains. The oxygen atoms of NO3 form two hydrogen bonds with Gly240, one hydrogen bond with Gln155 (2.9 Å), one hydrogen bond with Lys269 (2.8 Å), two hydrogen bonds with His196 (3.0 Å), and an additional hydrogen bond with Trp102 (2.8 Å) of NrtA (Figure 1c). Each NrtA protein specifically binds one NO3 molecule, establishing this domain as a bona fide NO3 binding pocket [37]. Sequence analysis further revealed that a 100-amino-acid extension at the C-terminus of NrtA (comprising an α-helix and two antiparallel β-strands) likely provides structural support for the binding pocket or participates in ligand-induced conformational rearrangements. Multiple candidate biosensors were designed with varying linker lengths and insertion positions (Figure 1b), and these constructs were screened using a prokaryotic expression system. The results demonstrated that the linker architecture is indispensable for efficient firefly luciferase reconstitution: in the presence of NO3, the NitNRCL1 biosensor (sequence information provided in Supplemental Figure S1) exhibited the most pronounced upregulation of luciferase activity (Figure 1d). Concurrently, these findings corroborate that the C-terminal structural extension of NrtA likely stabilizes the NO3 binding pocket and contributes to conformational dynamics associated with solute recognition and binding [38].

3.2. Selectivity and Kinetic Assays of the NitNRCL1

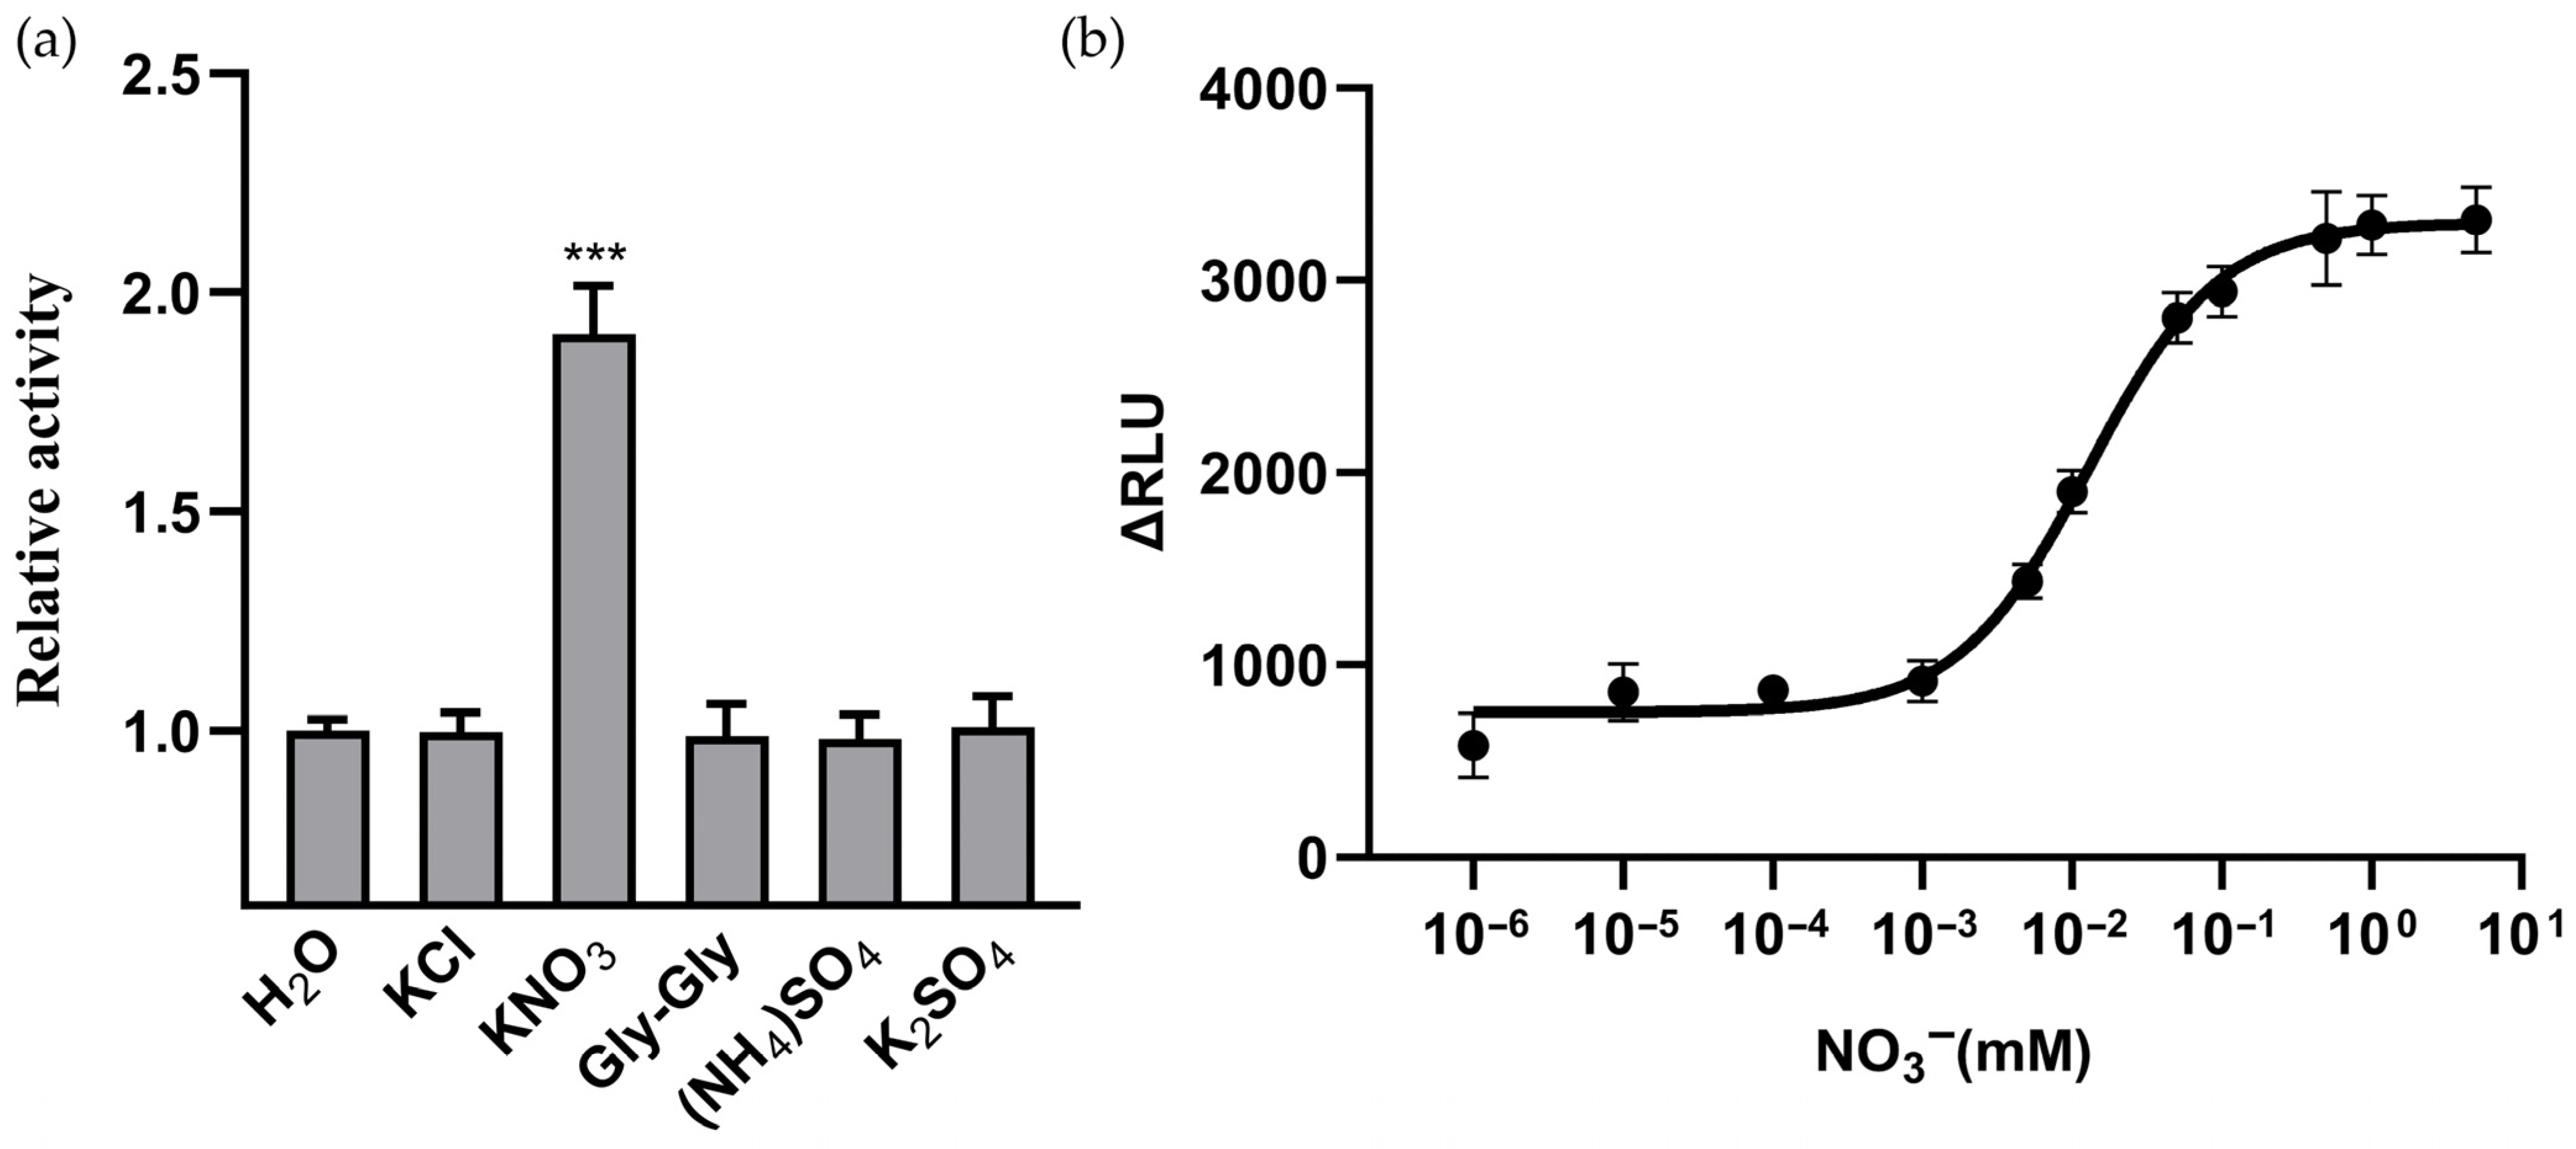
To further assess the specificity of NitNRCL1 toward NO3, purified NitNRCL1 protein was incubated with 5 mM solutions of various anionic compounds, and the luminescence intensity of the sensor protein was measured using a 96-well microplate reader, with water treatment serving as the control group. The luminescence activity of NitNRCL1 was significantly elevated in the presence of NO3 relative to all other tested ions, confirming the high specificity of this biosensor for NO3 (Figure 2a). Using purified NitNRCL1 protein, we determined its standardized kinetic parameters in the presence of 5 mM NO3, and found that the response signal reached a plateau at 5 min (Figure S2). To determine the dissociation constant (Kd) of NitNRCL1, changes in relative luminescence units (ΔRLU) were analyzed across a gradient of NO3 concentrations spanning nanomolar to millimolar ranges (Figure 2b). Fitting of the resultant sigmoidal curve yielded a Kd value of approximately 12.90 μM (R2 = 0.9816), with the maximum signal response observed at 5 mM NO3; this affinity profile is consistent with the high sensitivity of the parental NrtA protein toward NO3 [38]. These results demonstrate that NitNRCL1 is capable of quantifying NO3 concentrations in aqueous solutions and reporting dynamic fluctuations in NO3 levels in real time.

3.3. Characterization of NitNRCL1 for NO3 Detection in Living Prokaryotic Cells

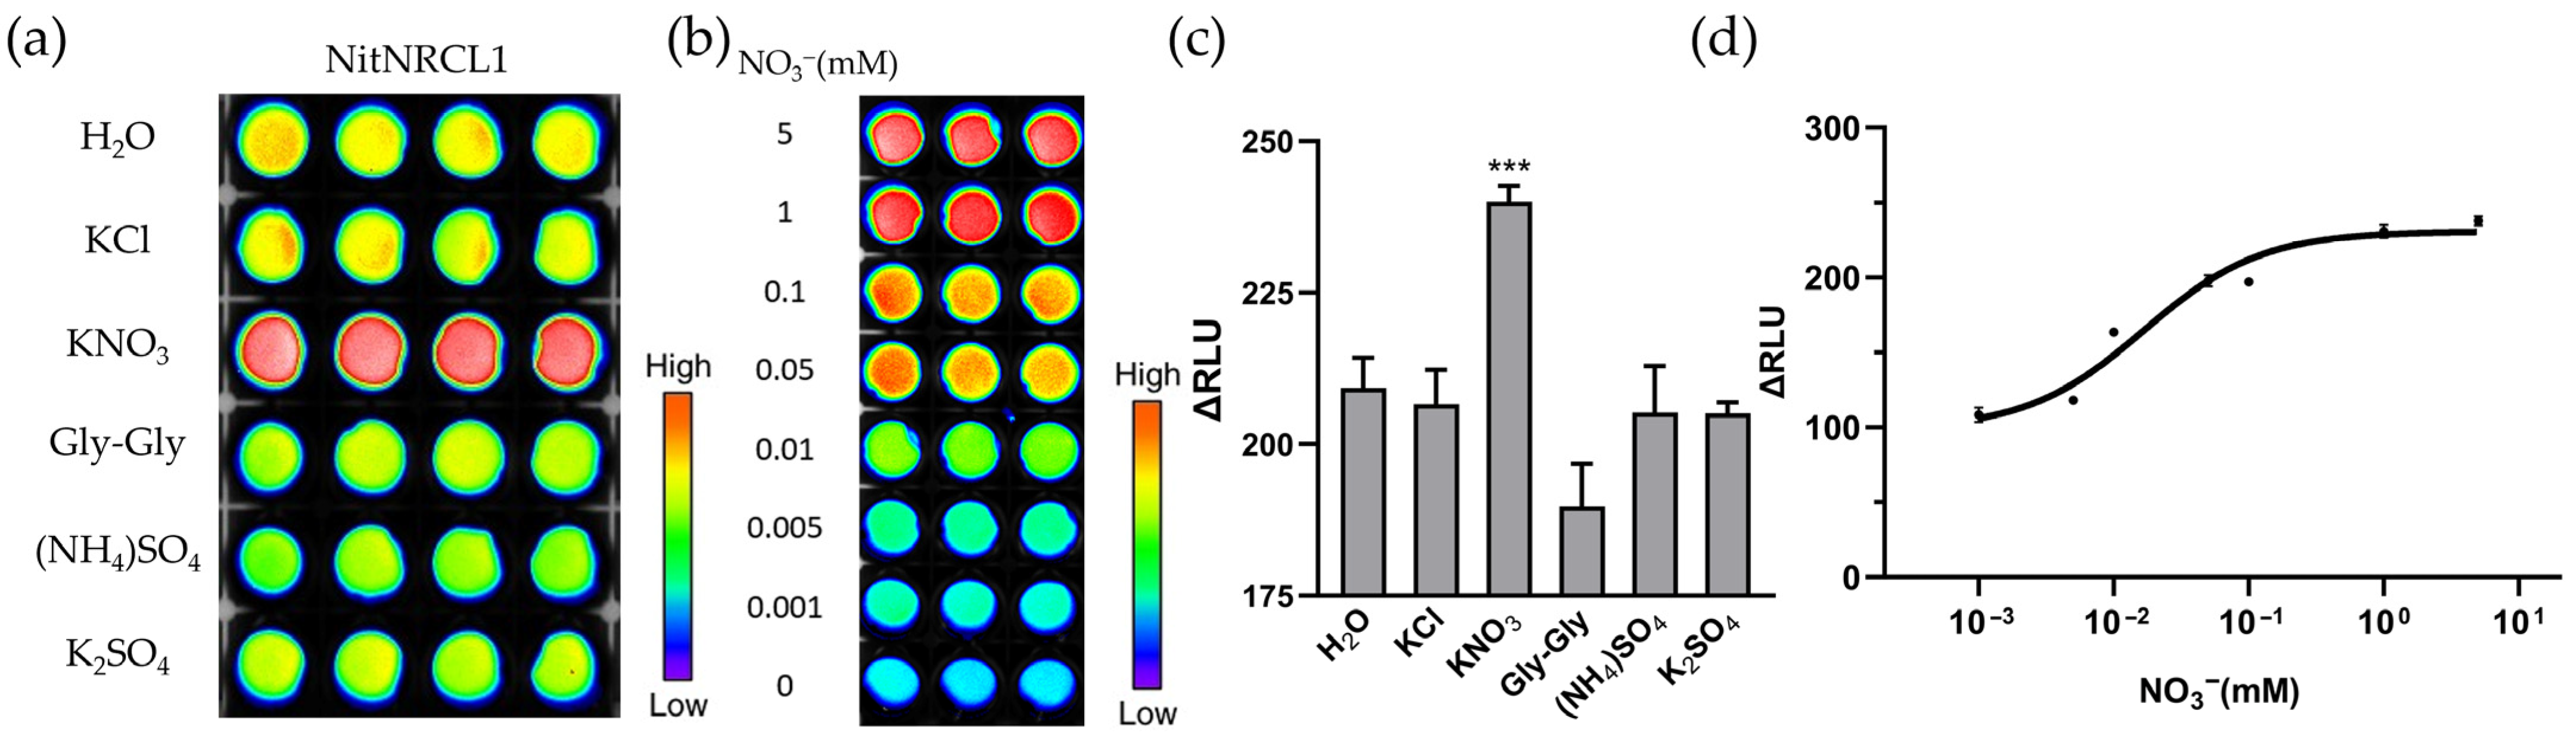
To validate the specificity and concentration-dependent responsiveness of NitNRCL1 toward NO3 in living prokaryotic cells, the biosensor was heterologously expressed in Escherichia coli Rosetta (DE3) cells. Chemiluminescent imaging was performed on Rosetta cell suspensions expressing NitNRCL1 following treatment with 5 mM solutions of various test compounds, confirming that the biosensor retains strict specificity for NO3 in the intracellular environment of living bacteria (Figure 3a). In addition, we found that live cells expressing NitNRCL1 showed no obvious response to nitrite (Figure S3). Statistical analysis of relative luminescence activity revealed a highly significant signal response in the NO3-treated group compared with all other compound treatments (Figure 3c). Exposure of NitNRCL1-expressing Rosetta cells to increasing concentrations of NO3 resulted in a corresponding dose-dependent increase in luminescence signal intensity (Figure 3b). Quantification of ΔRLU values from Figure 3b further demonstrated a strong positive correlation between NO3 concentration and luminescence intensity in bacterial suspensions, with signal intensity gradually escalating alongside rising NO3 levels (Figure 3d). Collectively, these assays verify that NitNRCL1 can specifically bind to intracellular NO3 and enable quantitative detection of NO3 in living cells.

3.4. Expression and NO3 Responsiveness of the Biosensor in Plants

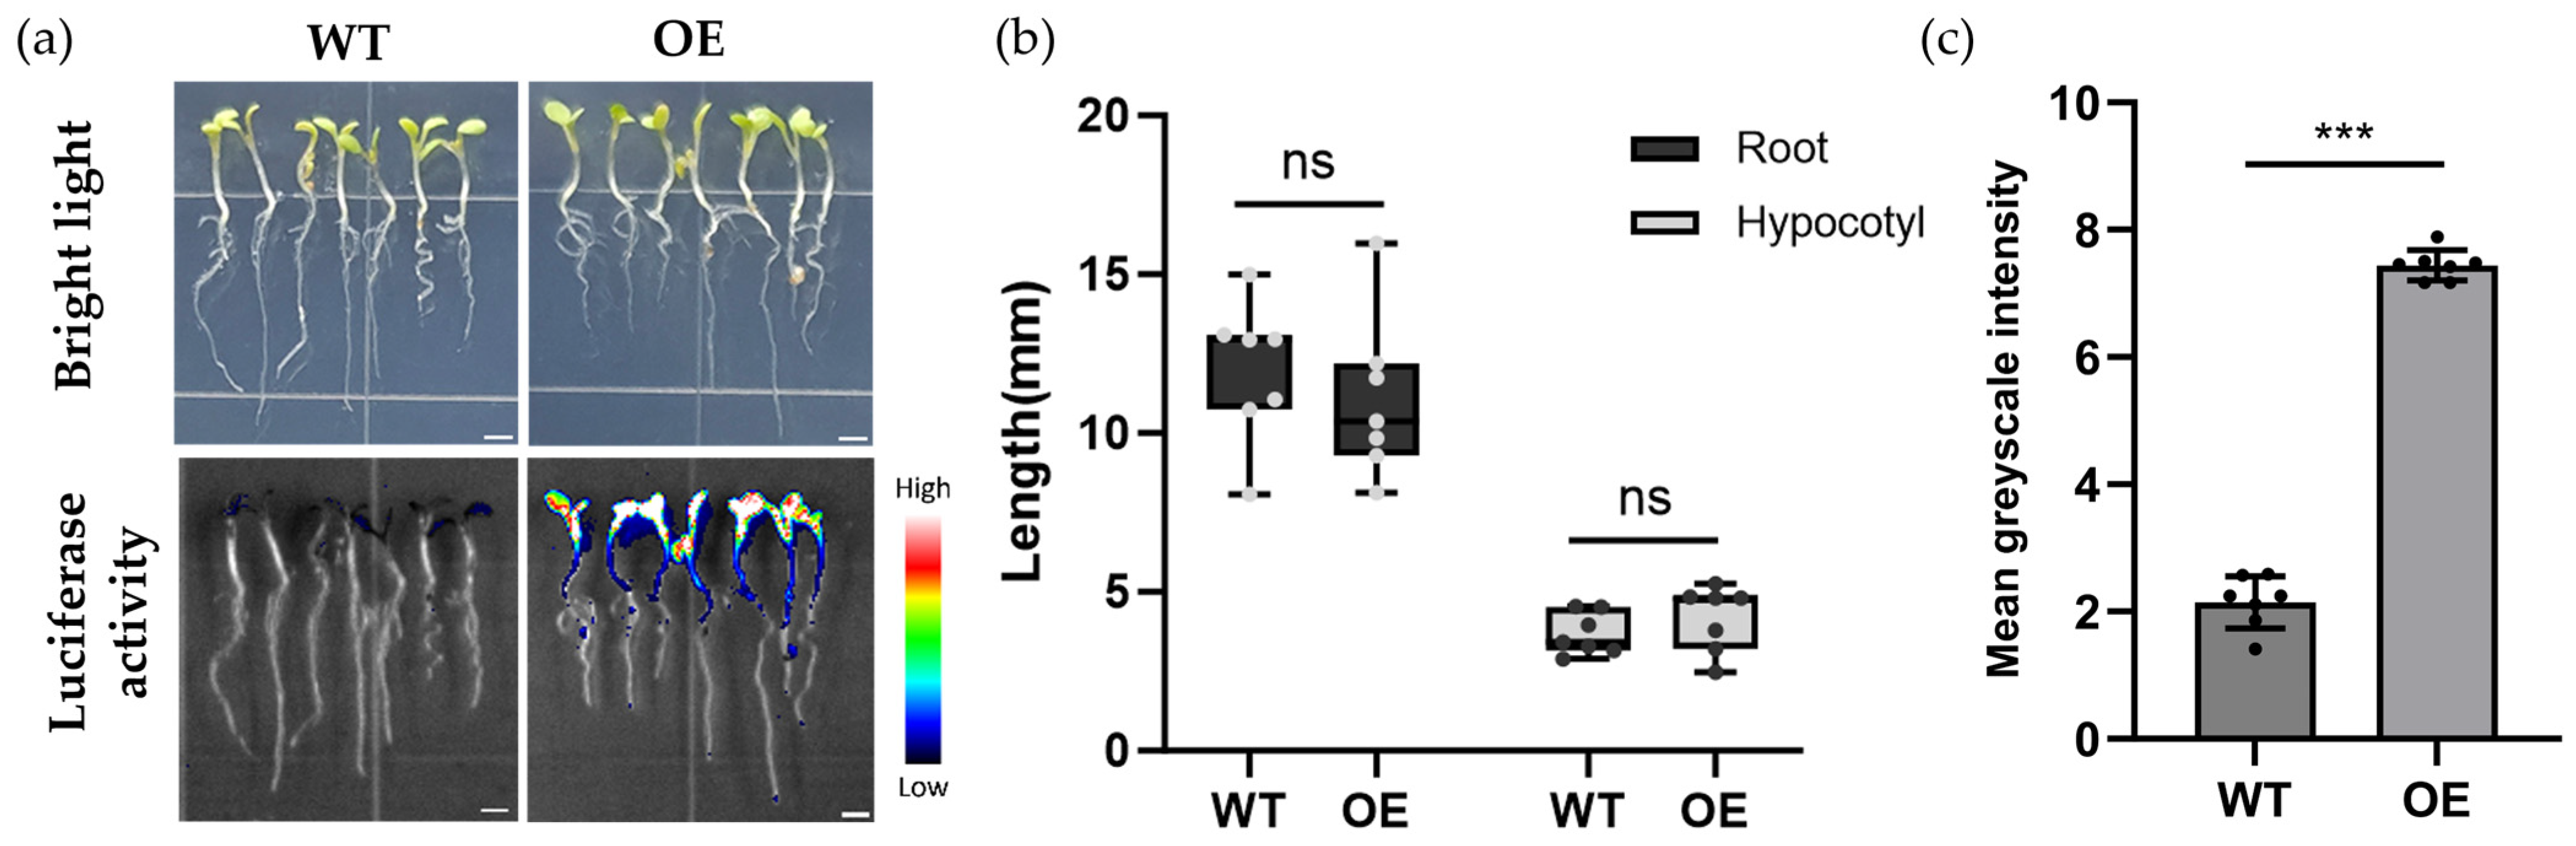
To evaluate the expression efficiency and functionality of NitNRCL1 in plant cells, Arabidopsis thaliana, tobacco leaves, and carrot callus stably transformed with NitNRCL1 were treated with NO3. Results confirmed that NitNRCL1 is fully expressed and retains NO3 responsiveness in diverse plant systems (Figure 4a, Figures S4 and S5). We identified 10 independent NitNRCL1 transgenic Arabidopsis lines (Figure S6), selected four of them for absolute quantitative qPCR analysis (Figure S7), and used these lines to verify the function of NitNRCL1 in Arabidopsis. All four lines showed a good response to NO3 (Figure S8). To establish a stable platform for in planta NO3 monitoring, transgenic Arabidopsis lines constitutively expressing NitNRCL1 (OE) were generated via Agrobacterium-mediated transformation. No significant differences in root length, hypocotyl length, or overall vegetative phenotype were observed between OE lines and wild-type (Col-0) plants (Figure 4b), indicating that biosensor expression does not perturb normal plant growth and development. Chemiluminescent detection revealed robust, stable luminescence signals in transgenic Arabidopsis seedlings grown on nitrogen-replete medium, whereas no detectable signal was observed in wild-type plants (Figure 4c), verifying stable expression and strong NO3 responsiveness of the biosensor in transgenic plants.

3.5. Functional Validation of NitNRCL1 in Plants

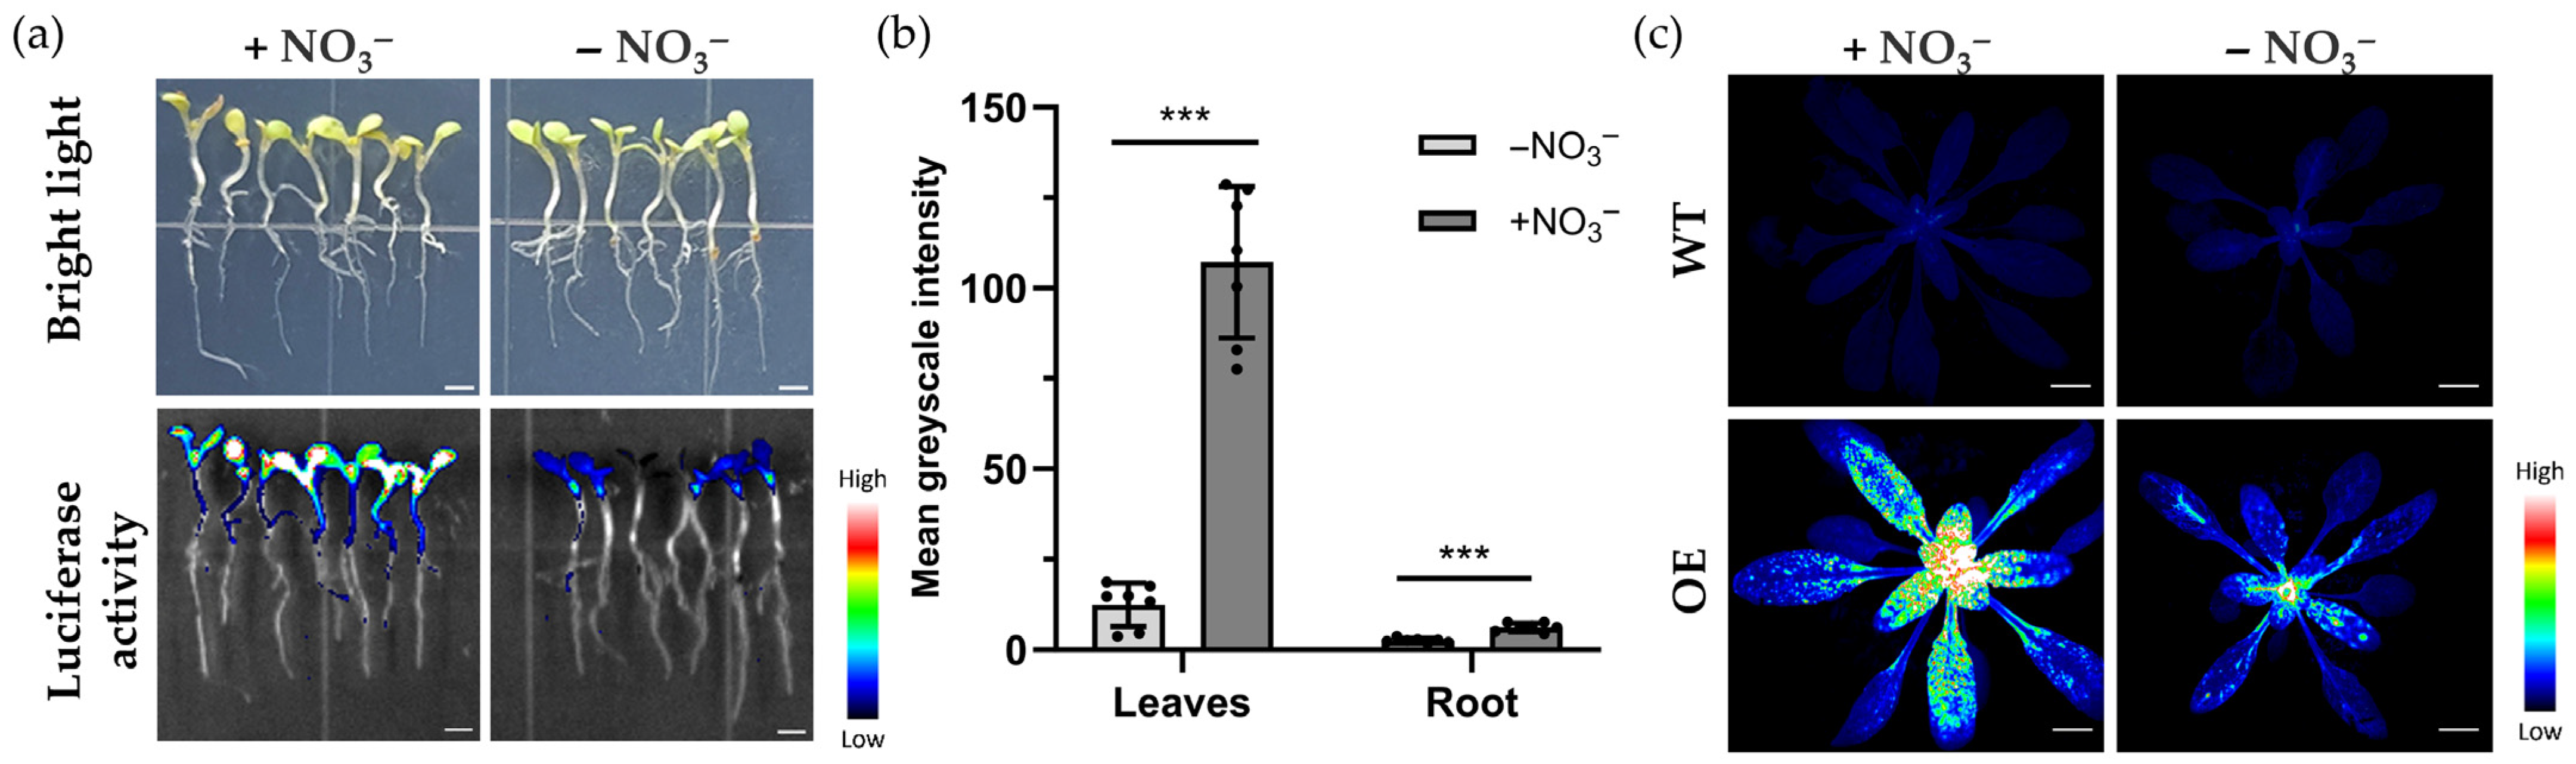
To characterize the NO3 responsiveness of NitNRCL1 in transgenic plants, OE Arabidopsis seedlings were subjected to differential nitrogen treatments. Seedlings grown on NO3-supplemented medium for 7 days exhibited intense, widespread chemiluminescent signals in aerial tissues following 10 mM KNO3 treatment for 10 min, whereas only faint, localized signals were detected in the NO3-deprived control group (Figure 5a). Gray value quantification confirmed that signal intensity was significantly higher in both leaves and roots of the NO3-treated group relative to the control, with leaf signals exceeding those in roots (Figure 5b). To assess the broad applicability of NitNRCL1 across crop species, the biosensor was heterologously expressed and functionally validated in wheat and rice, demonstrating reliable NO3 detection capacity in these monocot crops (Figure S9). Subcellular localization of NitNRCL1 in wheat protoplasts revealed that it is localized in the cytoplasm (Figure S10). Furthermore, analysis of 21-day-old soil-grown plants revealed no detectable luminescence signals in wild-type Arabidopsis under either NO3-replete or NO3-deprived conditions. In contrast, OE plants displayed intense, uniform chemiluminescent signals in leaves under NO3 supplementation, with significantly stronger signals in young leaves relative to mature leaves. Under NO3 deprivation, leaf signals were drastically attenuated, with only faint signals retained in young tissues (Figure 5c). These findings confirm that NitNRCL1 specifically responds to NO3 across distinct developmental stages in plants, with signal distribution closely aligning with the tissue-specific allocation patterns of endogenous NO3 [39], establishing a robust tool for in vivo monitoring of plant nitrogen status.

3.6. Dynamic Monitoring of Nitrate Uptake and Translocation in Plants Under Low-Nitrogen Stress

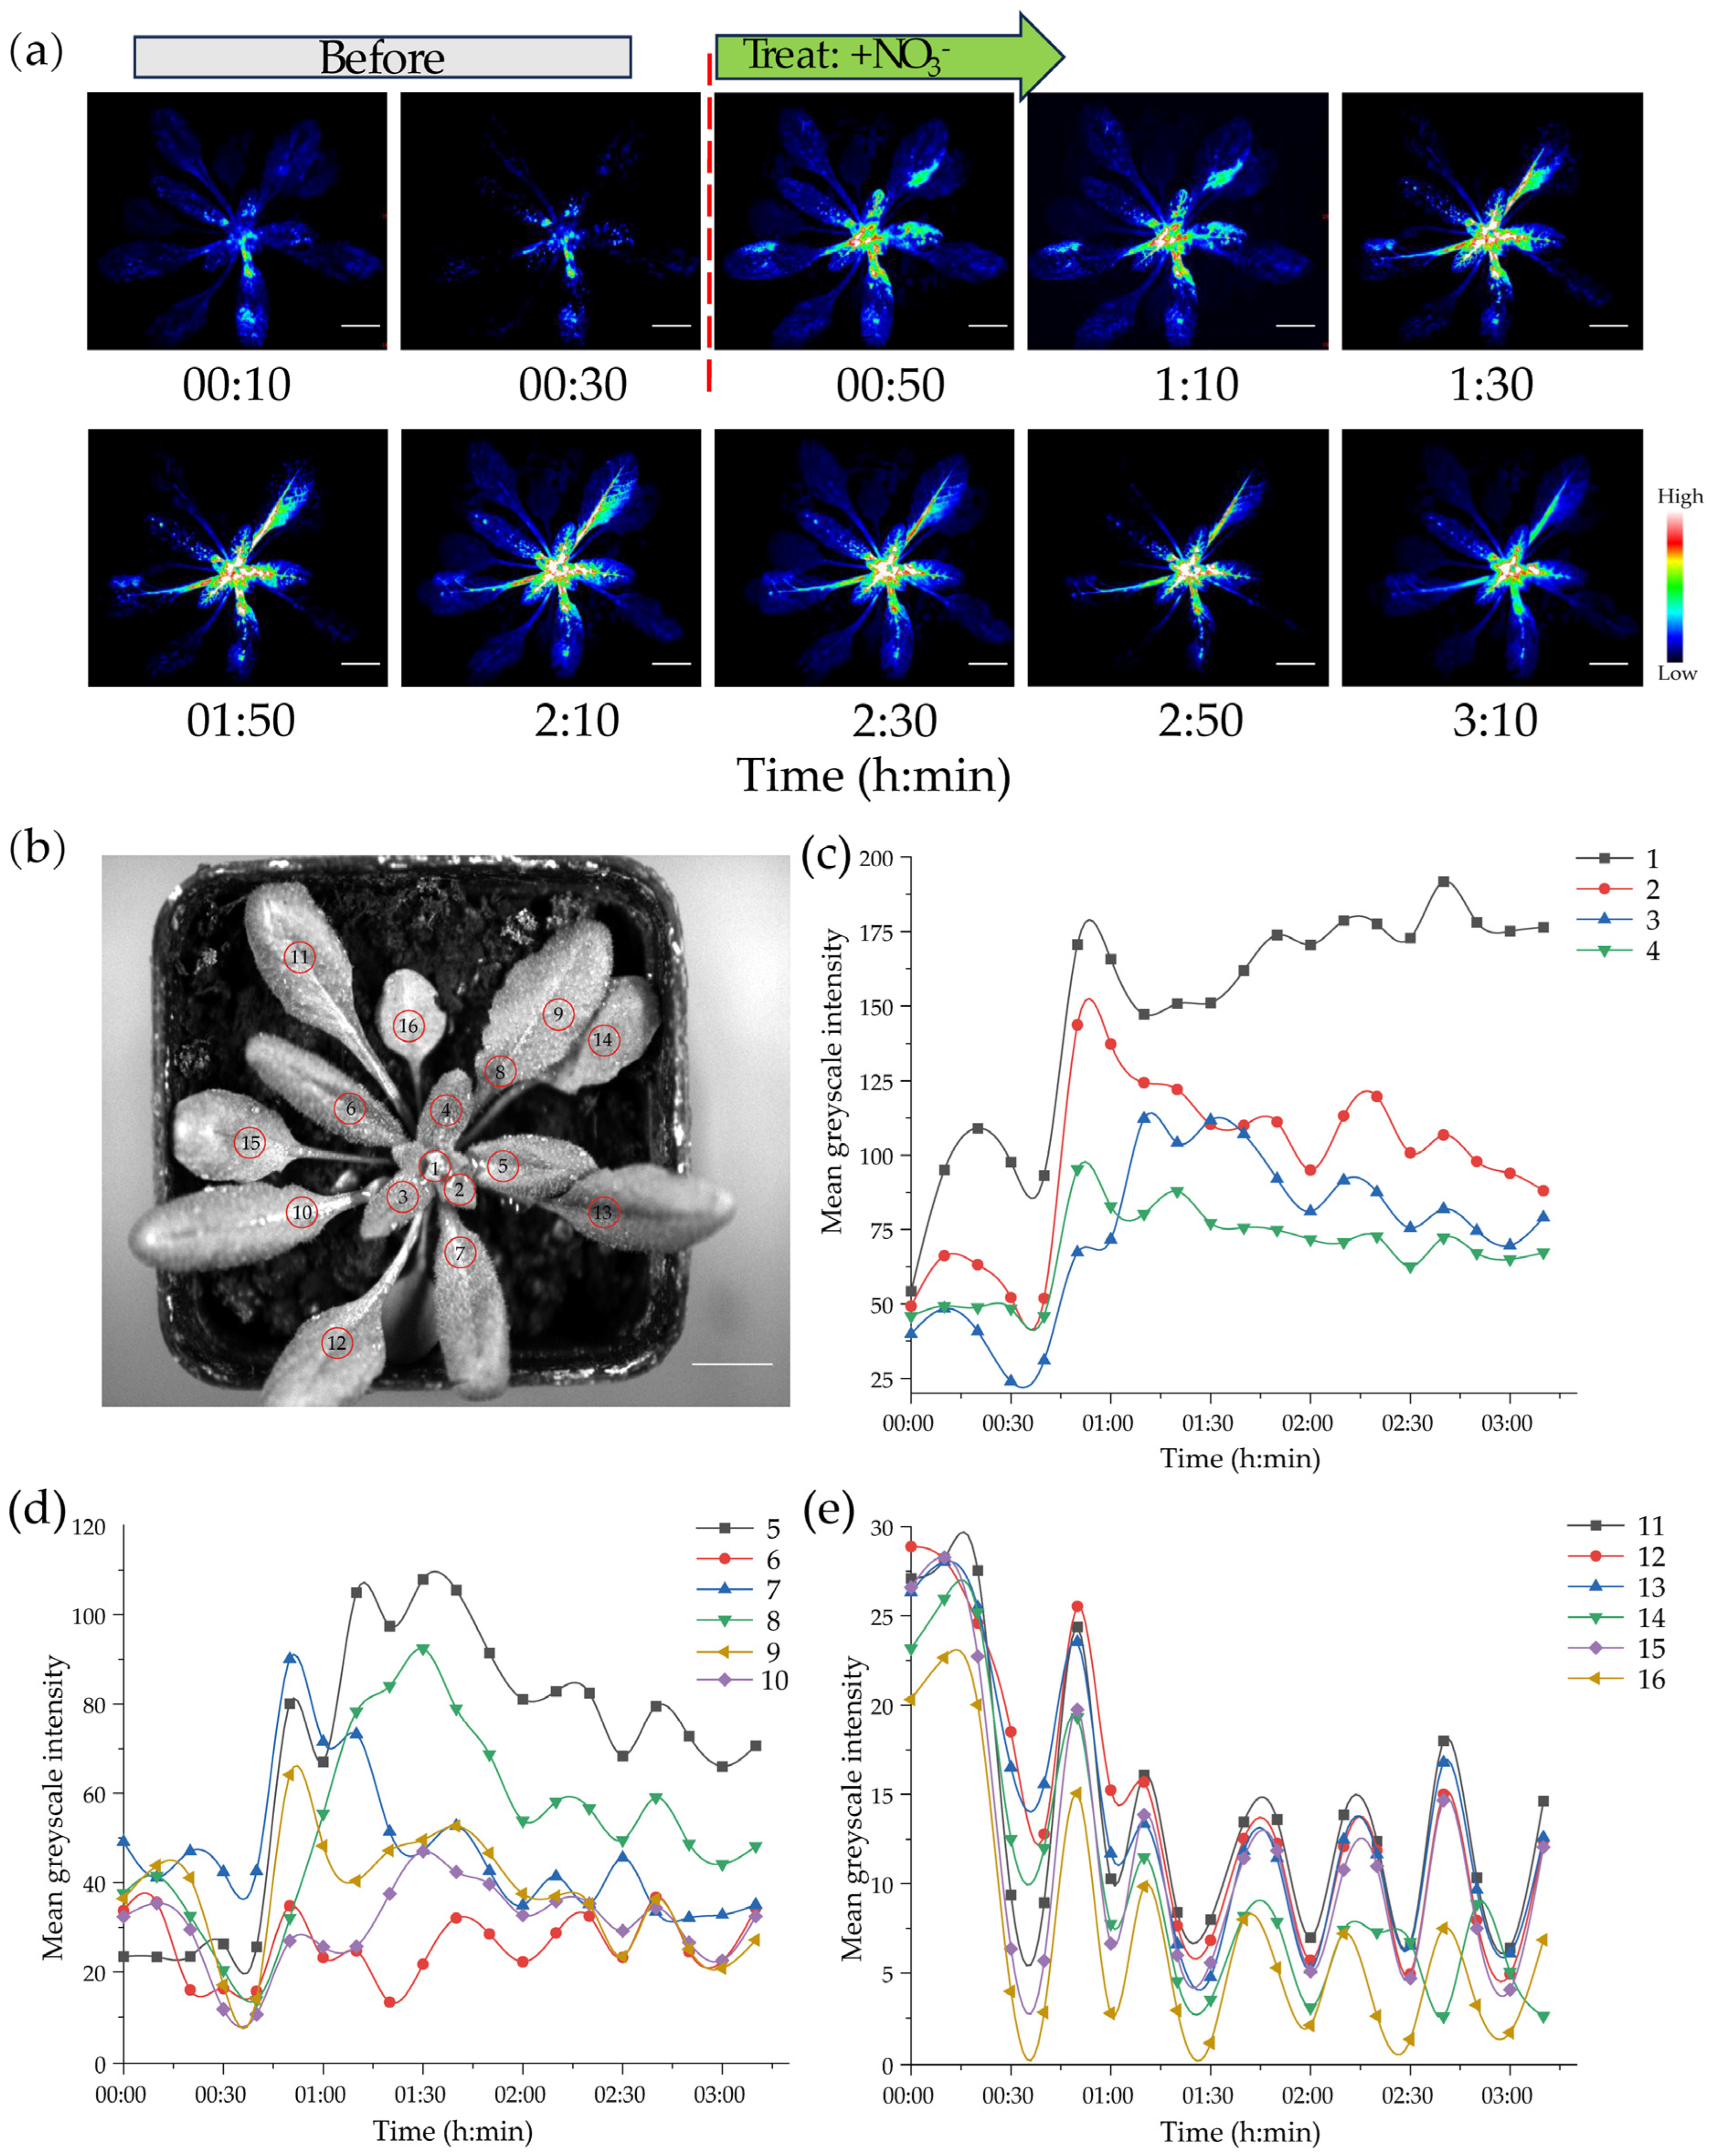
To evaluate the suitability of NitNRCL1 for spatiotemporal monitoring of NO3 distribution in living plants, 14-day-old OE Arabidopsis seedlings were subjected to 7 days of nitrogen starvation, followed by in vivo live imaging to track the dynamic uptake and translocation of NO3 in aerial tissues. Nitrogen-starved OE plants exhibited weak, spatially restricted luminescence signals prior to NO3 resupply. Upon treatment with 10 mM KNO3 (+NO3), luminescence intensity increased dramatically over time, accompanied by a distinct, orderly signal propagation pattern (Figure 6a). Initial signals emerged exclusively in the shoot apical meristem, young leaves, and vascular veins—representing high-intensity signals in young conductive tissues—reflecting the physiological priority of NO3 allocation to developing tissues [40]. Subsequently, NO3 signals spread rapidly along the leaf vascular system and gradually extended into mature leaf tissues, forming a centripetal gradient distribution consistent with long-distance translocation routes mediated by the vascular network [39]. After 2 h of NO3 treatment, signals stabilized across all leaf tissues but retained clear tissue specificity, with significantly higher intensity in young leaves than mature leaves, indicative of differential NO3 partitioning between tissue types. This dynamic pattern aligns perfectly with the physiological mechanisms of NO3 transport in plants, demonstrating that NitNRCL1 enables high-spatiotemporal-resolution tracking of the entire NO3 uptake-to-translocation cascade.
To quantify temporal changes in NO3 levels across nitrogen-starved OE Arabidopsis discrete leaf regions, 16 zones of interest (ROIs) were marked on seedling leaves (Figure 6b), and time-intensity curves of luminescence signals were generated for each ROI (Figure 6c–e). Following NO3 resupply, luminescence signals in young leaf zones (1–4) peaked rapidly within 10 min, whereas peak signal occurrence in mature leaf zones (11–16) was markedly delayed by 30–60 min. The variation in leaves 5–10 is intermediate between that of juvenile and mature leaves. Quantitative tracing of NO3 signals in planta partially reflects the source-to-sink allocation pattern of nitrogen nutrients in plants [41]. Existing literature confirms that long-distance NO3 transport in plants is predominantly mediated by the xylem vascular system [42,43,44], a mechanism fully consistent with the dynamic signal propagation patterns observed with NitNRCL1. All ROIs exhibited consistent kinetic trends, further validating NitNRCL1 as a reliable tool for quantitative and real-time tracing of endogenous NO3 in plants. Gray value-based quantitative analysis enables precise kinetic monitoring of NO3 translocation, providing a powerful asset for studying plant nitrogen dynamics. To verify whether NitNRCL1 transgenic plants can reversibly detect NO3, we sprayed leaves of NitNRCL1 transgenic Arabidopsis plants with 10 mM NO3 for reversible NO3 detection assays. The results showed that NitNRCL1 exhibited good repeatable detection characteristics (Figure S11).

4. Discussion

As a core macronutrient and pivotal signaling molecule governing plant growth and development, the spatiotemporal dynamic allocation of NO3 is a central focus for elucidating nitrogen use efficiency in plants. Conventional detection methods are limited by destructive sampling or localized monitoring, failing to meet the demand for real-time, whole-plant dynamic tracking of endogenous NO3. Through multi-system validation in prokaryotic and eukaryotic hosts, this study demonstrates that the split-luciferase biosensor NitNRCL1, engineered using the cyanobacterial NrtA protein, achieves accurate, specific, and dynamic tracing of NO3 in planta. This novel tool opens new avenues for dissecting the complex regulatory networks underlying NO3 uptake, translocation, and assimilation in plant nitrogen metabolism.
In recent years, FRET-based fluorescent biosensors have revolutionized ion monitoring in plants, with several NO3 sensors developed including NitraMeter3.0 [45], mCitrine-NLP7 [46], FLIP-NT [37], NiTrac-NPF1.3 [47], and NiTrac1 [48]; these tools offer exceptional spatial resolution and non-invasive measurement capabilities. Compared with these existing sensors, the defining advantage of NitNRCL1 lies in its capacity for whole-plant dynamic NO3 monitoring. Compared with these existing sensors, NitNRCL1 in this study not only maintains high spatial resolution and non-invasive detection but also enables dynamic monitoring of whole-plant NO3 levels, allowing simultaneous multi-site assessment of differential NO3 uptake and translocation across distinct organs and tissues. As demonstrated by dynamic tracking of NO3 in NitNRCL1 transgenic Arabidopsis following nitrogen deprivation, the NO3 signal initially accumulates in young developing leaves and vascular conducting tissues [40,45,46,47,48,49] and subsequently radiates from leaf veins into the surrounding mesophyll cells [50,51], thereby reflecting, to a certain extent, the transport and partitioning patterns of nitrogen nutrients within the plant [41,42,43,44]. This capability forms a robust complement to FRET-based sensors that operate at cellular or subcellular resolution. A detailed performance comparison of NitNRCL with existing NO3 biosensors is available in Supplementary Data (Table S2).
Functional assays confirm that NitNRCL1 is stably expressed and faithfully responds to NO3 across all developmental stages of Arabidopsis, without inducing abnormal phenotypic alterations in transgenic plants. Critically, the chemiluminescent output of NitNRCL1 eliminates the need for complex fluorescence microscopy equipment, making it uniquely suited for whole-plant macroscopic imaging and high-throughput screening. This feature positions NitNRCL1 as a precision tool for functional validation of nitrogen-use-efficiency genes and accelerated crop molecular breeding.
Despite its exceptional application potential, NitNRCL1 has avenues for further optimization. The current sensor response time (approximately 10 min to peak signal) precludes capture of the rapid, second-scale transient responses mediated by nitrate transporters. Notably, wild-type plants were used as background controls in this study; however, the lack of mechanistic controls based on mutants unable to bind NO3 imposes limitations on demonstrating that the observed signal specifically depends on the interaction of NO3 with the NrtA domain. Additionally, heterologous expression efficiency and signal stability in monocot crops such as rice and wheat require enhancement via codon optimization and replacement with crop-specific promoters. Future directions include directed evolution of the NrtA protein to accelerate conformational switching, integration with other independent detection techniques to enable absolute quantification of nitrate concentrations, fusion of subcellular localization signals to generate organelle-specific NO3 sensors, and integration of multi-biosensor designs to enable simultaneous monitoring of NO3 with calcium, cytokinins, and other signaling molecules. Furthermore, coupling NitNRCL1 with near-infrared luciferase technology to develop portable detection devices will facilitate the translation of precise NO3 tracing from laboratory research to field-scale in situ monitoring, providing critical technical support for precision fertilization and sustainable agricultural development.

5. Conclusions

In summary, this study successfully developed a split-luciferase-based genetically encoded NO3 biosensor, NitNRCL1. Multi-level validation in prokaryotic and eukaryotic systems confirms that NitNRCL1 exhibits high specificity, a broad concentration-response range, and excellent biocompatibility, enabling real-time, whole-plant dynamic monitoring of NO3 in Arabidopsis. This biosensor not only provides a novel platform for dissecting the molecular mechanisms governing NO3 uptake, translocation, and assimilation, but also delivers technical support for the development of nitrogen-use-efficient crop varieties and precision fertilization strategies. Future optimization of NitNRCL1—including enhanced NO3 responsiveness, crop-specific engineering, and multi-signal integration—will further expand its utility in plant nitrogen metabolism research and sustainable agriculture, offering innovative solutions to mitigate nitrogen pollution and improve crop productivity.

Supplementary Materials

The following supporting information can be downloaded at: https://www.mdpi.com/article/10.3390/bios16050243/s1, This PDF file includes: Figure S1: Amino acid sequence of the NitNRCL1 sensor; Figure S2: In vitro kinetic characterization of the NitNRCL1 sensor; Figure S3: Response of the NitNRCL1 sensor to nitrate and nitrite in living Escherichia coli cells; Figure S4: PCR identification of the NitNRCL1 sensor gene in diverse plant materials; Figure S5: Functional validation of the NitNRCL1 sensor in diverse plant materials; Figure S6: PCR identification of positive transgenic Arabidopsis thaliana plants; Figure S7: Absolute quantification of transcripts encoding the NitNRCL1 sensor in transgenic Arabidopsis thaliana overexpression lines; Figure S8: Response of transgenic Arabidopsis thaliana lines with varying expression levels to nitrate; Figure S9: Functional validation of the NitNRCL1 sensor in rice and wheat; Figure S10: Subcellular localization of NitNRCL1 in wheat protoplasts; Figure S11: Reversibility of nitrate detection in transgenic Arabidopsis thaliana plants expressing NitNRCL1; Table S1: List of primers used in this study; Table S2: Comparison of NitNRCL1 with existing nitrate biosensors.

Author Contributions

Conceptualization, Y.L., G.Z., L.Y., Y.W., B.Y. and G.K.; methodology, L.Z., Q.X., C.W., J.W., J.Y., Y.L., G.Z., L.Y., Y.W., B.Y. and G.K.; software, L.Z.; validation, Q.X., C.W., J.W., J.Y., Y.L., G.Z., L.Y. and Y.W.; formal analysis, L.Z., Y.L., G.Z., L.Y. and Y.W.; investigation, C.W. and Y.W.; resources, Q.X., C.W., J.W., J.Y., B.Y. and G.K.; data curation, L.Z., Q.X., C.W., J.W., J.Y., Y.L., G.Z., L.Y. and Y.W.; writing—original draft preparation, L.Z., Q.X., J.W., J.Y., Y.L., G.Z., L.Y. and Y.W.; writing—review and editing, L.Z., Q.X., C.W., J.W., J.Y., Y.L., G.Z., L.Y., Y.W. and B.Y.; visualization, Q.X.; supervision, B.Y. and G.K.; project administration, B.Y. and G.K.; funding acquisition, B.Y. and G.K.; All authors have read and agreed to the published version of the manuscript.

Funding

This research was funded by the National Natural Science Foundation of China (32401739), the Postgraduate Education Reform and Quality Improvement Project of Henan Province (YJS2024JD18) and Key Project of Henan Provincial Scientific and Technological Research and Development Program Joint Fund (252301420022).

Institutional Review Board Statement

Not applicable.

Informed Consent Statement

Not applicable.

Data Availability Statement

All data needed to evaluate the conclusions in the paper are present in the paper and/or the Supplementary Materials. Further inquiries can be directed to the corresponding authors.

Acknowledgments

During the preparation of this manuscript, the authors used Doubao (version 2.2.3) for the purposes of spelling and grammar checking. The authors have reviewed and edited the output and take full responsibility for the content of this publication.

Conflicts of Interest

The authors declare no conflicts of interest.

Abbreviations

The following abbreviations are used in this manuscript:
IPTGIsopropyl β-D-1-thiogalactopyranoside
LBDLigand-binding domain
NLucN-terminal luciferase fragment
CLucC-terminal luciferase fragment
PBPPeriplasmic binding protein
KdDissociation constant
ΔRLUChange in relative luminescence units
OD600Optical density at 600 nm
Ni-NTANickel-nitrilotriacetic acid
WTWild type
OENitNRCL1 overexpression lines in Arabidopsis
Col-0Columbia-0
MSMurashige and Skoog medium
CCDCharge-coupled device
ROIRegion of interest
KmMichaelis constant

References

  1. Liu, X.; Hu, B.; Chu, C. Nitrogen assimilation in plants: Current status and future prospects. J. Genet. Genom. 2022, 49, 394–404. [Google Scholar] [CrossRef] [Scilit] [PubMed]
  2. Fredes, I.; Moreno, S.; Diaz, F.P.; Gutierrez, R.A. Nitrate signaling and the control of Arabidopsis growth and development. Curr. Opin. Plant Biol. 2019, 47, 112–118. [Google Scholar] [CrossRef] [Scilit]
  3. Gao, Y.; Qi, S.; Wang, Y. Nitrate signaling and use efficiency in crops. Plant Commun. 2022, 3, 100353. [Google Scholar] [CrossRef] [Scilit]
  4. Ho, C.H.; Lin, S.H.; Hu, H.C.; Tsay, Y.F. CHL1 functions as a nitrate sensor in plants. Cell 2009, 138, 1184–1194. [Google Scholar] [CrossRef] [Scilit]
  5. Sakakibara, H. Cytokinin biosynthesis and transport for systemic nitrogen signaling. Plant J. 2021, 105, 421–430. [Google Scholar] [CrossRef] [Scilit]
  6. Liu, K.-H.; Niu, Y.; Konishi, M.; Wu, Y.; Du, H.; Chung Hoo, S.; Li, L.; Boudsocq, M.; McCormack, M.; Maekawa, S.; et al. Discovery of nitrate-CPK-NLP signalling in central nutrient-growth networks. Nature 2017, 545, 311–316. [Google Scholar] [CrossRef] [Scilit]
  7. Vidal, E.A.; Alvarez, J.M.; Araus, V.; Riveras, E.; Brooks, M.D.; Krouk, G.; Ruffel, S.; Lejay, L.; Crawford, N.M.; Coruzzi, G.M.; et al. Nitrate in 2020: Thirty years from transport to signaling networks. Plant Cell 2020, 32, 2094–2119. [Google Scholar] [CrossRef] [Scilit]
  8. Xuan, W.; Beeckman, T.; Xu, G. Plant nitrogen nutrition: Sensing and signaling. Curr. Opin. Plant Biol. 2017, 39, 57–65. [Google Scholar] [CrossRef] [Scilit]
  9. Zhang, G.B.; Meng, S.; Gong, J.M. The expected and unexpected roles of nitrate transporters in plant Abiotic Stress Resistance and Their Regulation. Int. J. Mol. Sci. 2018, 19, 3535. [Google Scholar] [CrossRef] [Scilit] [PubMed]
  10. Parker, J.L.; Newstead, S. Molecular basis of nitrate uptake by the plant nitrate transporter NRT1.1. Nature 2014, 507, 68–72. [Google Scholar] [CrossRef] [Scilit] [PubMed]
  11. Orsel, M.; Chopin, F.; Leleu, O.; Smith, S.J.; Krapp, A.; Daniel-Vedele, F.; Miller, A.J. Characterization of a two-component high-affinity nitrate uptake system in Arabidopsis. Physiology and protein-protein interaction. Plant Physiol. 2006, 142, 1304–1317. [Google Scholar] [CrossRef] [Scilit] [PubMed]
  12. Ota, R.; Ohkubo, Y.; Yamashita, Y.; Ogawa-Ohnishi, M.; Matsubayashi, Y. Shoot-to-root mobile CEPD-like 2 integrates shoot nitrogen status to systemically regulate nitrate uptake in Arabidopsis. Nat. Commun. 2020, 11, 641. [Google Scholar] [CrossRef] [Scilit] [PubMed]
  13. Ball, S.; Colleoni, C.; Cenci, U.; Raj, J.N.; Tirtiaux, C. The evolution of glycogen and starch metabolism in eukaryotes gives molecular clues to understand the establishment of plastid endosymbiosis. J Exp Bot. 2011, 62, 1775–1801. [Google Scholar] [CrossRef] [Scilit] [PubMed]
  14. Demes, E.; Besse, L.; Cubero-Font, P.; Satiat-Jeunemaitre, B.; Thomine, S.; De Angeli, A. Dynamic measurement of cytosolic pH and [NO3] uncovers the role of the vacuolar transporter AtCLCa in cytosolic pH homeostasis. Proc. Natl. Acad. Sci. USA 2020, 117, 15343–15353. [Google Scholar] [CrossRef] [Scilit] [PubMed]
  15. Zhen, R.G.; Koyro, H.W.; Leigh, R.A.; Tomos, A.D.; Miller, A.J. Compartmental nitrate concentrations in barley root cells measured with nitrate-selective microelectrodes and by single-cell sap sampling. Planta 1991, 185, 356–361. [Google Scholar] [CrossRef] [Scilit]
  16. Zhang, C.; Demes-Causse, E.; Li, X.; Guo, Z.; Zhao, H.; Cao, H.; Song, Y.; Mu, L.; Zhang, K.; Zhang, J.; et al. The Maize ZmbHLH118 transcription factor regulates vacuolar nitrate loading by the NO3 transporter ZmCLCa. Adv. Sci. 2026, 13, e20219. [Google Scholar] [CrossRef] [Scilit]
  17. Mooshammer, M.; Wanek, W.; Hämmerle, I.; Fuchslueger, L.; Hofhansl, F.; Knoltsch, A.; Schnecker, J.; Takriti, M.; Watzka, M.; Wild, B.; et al. Adjustment of microbial nitrogen use efficiency to carbon: Nitrogen imbalances regulates soil nitrogen cycling. Nat. Commun. 2014, 5, 3694. [Google Scholar] [CrossRef] [Scilit]
  18. Green, L.C.; Wagner, D.A.; Glogowski, J.; Skipper, P.L.; Wishnok, J.S.; Tannenbaum, S.R. Analysis of nitrate, nitrite, and [15N] nitrate in biological fluids. Anal. Biochem. 1982, 126, 131–138. [Google Scholar] [CrossRef] [Scilit]
  19. Hao, C.K.; Dungait, J.A.J.; Shang, W.H.; Hou, R.X.; Gong, H.R.; Yang, Y.F.; Lambers, H.; Yu, P.; Delgado-Baquerizo, M.; Xu, X.L.; et al. Conservation agriculture raises crop nitrogen acquisition by amplifying plant-microbe synergy under climate warming. Nat. Commun. 2025, 16, 11067. [Google Scholar] [CrossRef] [Scilit] [PubMed]
  20. Cookson, S.J.; Williams, L.E.; Miller, A.J. Light-dark changes in cytosolic nitrate pools depend on nitrate reductase activity in Arabidopsis leaf cells. Plant Physiol. 2005, 138, 1097–1105. [Google Scholar] [CrossRef] [Scilit] [PubMed]
  21. Henriksen, G.H.; Raman, D.R.; Walker, L.P.; Spanswick, R.M. Measurement of Net Fluxes of ammonium and nitrate at the surface of barley roots using ion-selective microelectrodes: II. Patterns of uptake along the root axis and evaluation of the microelectrode Flux estimation technique. Plant Physiol. 1992, 99, 734–747. [Google Scholar] [CrossRef] [Scilit]
  22. Woo, S.G.; Moon, S.J.; Kim, S.K.; Kim, T.H.; Lim, H.S.; Yeon, G.H.; Sung, B.H.; Lee, C.H.; Lee, S.G.; Hwang, J.H.; et al. A designed whole-cell biosensor for live diagnosis of gut inflammation through nitrate sensing. Biosens. Bioelectron. 2020, 168, 112523. [Google Scholar] [CrossRef] [Scilit]
  23. Taneoka, A.; Sakaguchi-Mikami, A.; Yamazaki, T.; Tsugawa, W.; Sode, K. The construction of a glucose-sensing luciferase. Biosens. Bioelectron. 2009, 25, 76–81. [Google Scholar] [CrossRef] [Scilit]
  24. Jones, A.M.; Grossmann, G.; Danielson, J.; Sosso, D.; Chen, L.Q.; Ho, C.H.; Frommer, W.B. In vivo biochemistry: Applications for small molecule biosensors in plant biology. Curr. Opin. Plant Biol. 2013, 16, 389–395. [Google Scholar] [CrossRef] [Scilit]
  25. Khan, P.; Prakash, A.; Hague, M.A.; Islam, A.; Hassan, M.I.; Ahmad, F. Structural basis of urea-induced unfolding: Unraveling the folding pathway of hemochromatosis factor E. Int. J. Biol. Macromol. 2016, 91, 1051–1061. [Google Scholar] [CrossRef] [Scilit] [PubMed]
  26. Kielkopf, C.L.; Bauer, W.; Urbatsch, I.L. Purification of polyhistidine-tagged proteins by immobilized metal affinity chromatography. Cold Spring Harb. Protoc. 2020, 2020, 102194. [Google Scholar] [CrossRef] [Scilit] [PubMed]
  27. Ursache, R.; Fujita, S.; Dénervaud Tendon, V.; Geldner, N. Combined fluorescent seed selection and multiplex CRISPR/Cas9 assembly for fast generation of multiple Arabidopsis mutants. Plant Methods 2021, 17, 111. [Google Scholar] [CrossRef] [Scilit] [PubMed]
  28. Sparkes, I.A.; Runions, J.; Kearns, A.; Hawes, C. Rapid, transient expression of fluorescent fusion proteins in tobacco plants and generation of stably transformed plants. Nat. Protoc. 2006, 1, 2019–2025. [Google Scholar] [CrossRef] [Scilit]
  29. Liu, M.S.; Huang, T.K.; Wang, Y.C.; Wang, S.C.; Wu, C.H.; Kuo, C.H.; Lai, E.M. Floral stage optimization and immune evasion enhance Agrobacterium-mediated genome editing in Arabidopsis. New Phytol. 2026, 249, 2125–2139. [Google Scholar] [CrossRef] [Scilit]
  30. Chen, H.M.; Zou, Y.; Shang, Y.L.; Lin, H.Q.; Wang, Y.J.; Cai, R.; Tang, X.Y.; Zhou, J.M. Firefly luciferase complementation imaging assay for protein-protein interactions in plants. Plant Physiol. 2008, 146, 323–324. [Google Scholar] [CrossRef] [Scilit]
  31. Wang, J.; Carmon, K.S.; Luck, L.A.; Suni, I.I. Electrochemical impedance biosensor for glucose detection utilizing a periplasmic E. coli receptor protein. Electrochem. Solid-State Lett. 2005, 8, H61. [Google Scholar] [CrossRef] [Scilit]
  32. Okumoto, S.; Looger, L.L.; Micheva, K.D.; Reimer, R.J.; Smith, S.J.; Frommer, W.B. Detection of glutamate release from neurons by genetically encoded surface-displayed FRET nanosensors. Proc. Natl. Acad. Sci. USA 2005, 102, 8740–8745. [Google Scholar] [CrossRef] [Scilit]
  33. Gilardi, G.; Zhou, L.Q.; Hibbert, L.; Cass, A.E. Engineering the maltose binding protein for reagentless fluorescence sensing. Anal. Chem. 1994, 66, 3840–3847. [Google Scholar] [CrossRef] [Scilit]
  34. Wada, A.; Mie, M.; Aizawa, M.; Lahoud, P.; Cass, A.E.G.; Kobatake, E. Design and construction of glutamine binding proteins with a self-adhering capability to unmodified hydrophobic surfaces as reagentless fluorescence sensing devices. J. Am. Chem. Soc. 2003, 125, 16228–16234. [Google Scholar] [CrossRef] [Scilit]
  35. Dwyer, M.A.; Looger, L.L.; Hellinga, H.W. Computational design of a Zn2+ receptor that controls bacterial gene expression. Proc. Natl. Acad. Sci. USA 2003, 100, 11255–11260. [Google Scholar] [CrossRef] [Scilit]
  36. Salins, L.L.; Deo, S.K.; Daunert, S. Phosphate binding protein as the biorecognition element in a biosensor for phosphate. Sens. Actuators B Chem. 2004, 97, 81–89. [Google Scholar] [CrossRef] [Scilit] [PubMed]
  37. Fatima, U.; Ameen, F.; Soleja, N.; Khan, P.; Almansob, A.; Ahmad, A. A fluorescence resonance energy transfer-based analytical tool for nitrate quantification in Living Cells. ACS Omega 2020, 5, 30306–30314. [Google Scholar] [CrossRef] [Scilit] [PubMed]
  38. Koropatkin, N.M.; Pakrasi, H.B.; Smith, T.J. Atomic structure of a nitrate-binding protein crucial for photosynthetic productivity. Proc. Natl. Acad. Sci. USA 2006, 103, 9820–9825. [Google Scholar] [CrossRef] [Scilit]
  39. Ruffel, S.; Del Rosario, J.; Lacombe, B.; Rouached, H.; Gutiérrez, R.A.; Coruzzi, G.M.; Krouk, G. Nitrate sensing and signaling in plants: Comparative insights and nutritional interactions. Annu. Rev. Plant Biol. 2025, 76, 25–52. [Google Scholar] [CrossRef] [Scilit]
  40. Kiba, T.; Feria-Bourrellier, A.B.; Lafouge, F.; Lezhneva, L.; Boutet-Mercey, S.; Orsel, M.; Bréhaut, V.; Miller, A.; Daniel-Vedele, F.; Sakakibara, H.; et al. The Arabidopsis nitrate transporter NRT2.4 plays a double role in roots and shoots of nitrogen-starved plants. Plant Cell 2012, 24, 245–258. [Google Scholar] [CrossRef] [Scilit]
  41. Drechsler, N.; Zheng, Y.; Bohner, A.; Nobmann, B.; von Wirén, N.; Kunze, R.; Rausch, C. Nitrate-dependent control of shoot K homeostasis by the nitrate transporter1/peptide transporter family member NPF7.3/NRT1.5 and the stelar K+ outward rectifier SKOR in Arabidopsis. Plant Physiol. 2015, 169, 2832–2847. [Google Scholar] [CrossRef] [Scilit] [PubMed]
  42. Lin, S.H.; Kuo, H.F.; Canivenc, G.; Lin, C.S.; Lepetit, M.; Hsu, P.K.; Tillard, P.; Lin, H.L.; Wang, Y.Y.; Tsai, C.B.; et al. Mutation of the Arabidopsis NRT1.5 nitrate transporter causes defective root-to-shoot nitrate transport. Plant Cell 2008, 20, 2514–2528. [Google Scholar] [CrossRef] [Scilit]
  43. Aluko, O.O.; Kant, S.; Adedire, O.M.; Li, C.Z.; Yuan, G.; Liu, H.B.; Wang, Q. Unlocking the potentials of nitrate transporters at improving plant nitrogen use efficiency. Front. Plant Sci. 2023, 14, 1074839. [Google Scholar] [CrossRef] [Scilit]
  44. Chen, K.E.; Chen, H.Y.; Tseng, C.S.; Tsay, Y.F. Improving nitrogen use efficiency by manipulating nitrate remobilization in plants. Nat. Plants 2020, 6, 1126–1135. [Google Scholar] [CrossRef] [Scilit] [PubMed]
  45. Chen, Y.N.; Cartwright, H.N.; Ho, C.H. In vivo visualization of nitrate dynamics using a genetically encoded fluorescent biosensor. Sci. Adv. 2022, 8, eabq4915. [Google Scholar] [CrossRef] [Scilit] [PubMed]
  46. Liu, K.H.; Liu, M.; Lin, Z.; Wang, Z.-F.; Chen, B.; Liu, C.; Guo, A.; Konishi, M.; Yanagisawa, S.; Wagner, G.; et al. NIN-like protein 7 transcription factor is a plant nitrate sensor. Science 2022, 377, 1419–1425. [Google Scholar] [CrossRef] [Scilit] [PubMed]
  47. Chen, Y.N.; Ho, C.H. Concept of Fluorescent Transport activity biosensor for the characterization of the Arabidopsis NPF1.3 Activity of Nitrate. Sensors 2022, 22, 1198. [Google Scholar] [CrossRef] [Scilit] [PubMed]
  48. Ho, C.H.; Frommer, W.B. Fluorescent sensors for activity and regulation of the nitrate transceptor CHL1/NRT1.1 and oligopeptide transporters. eLife 2014, 3, e01917. [Google Scholar] [CrossRef] [Scilit]
  49. Tang, Z.; Fan, X.; Li, Q.; Feng, H.; Miller, A.J.; Shen, Q.; Xu, G. Knockdown of a Rice stelar nitrate transporter alters long-distance translocation but not root influx. Plant Physiol. 2012, 160, 2052–2063. [Google Scholar] [CrossRef] [Scilit]
  50. Fan, S.C.; Lin, C.S.; Hsu, P.K.; Lin, S.H.; Tsay, Y.F. The Arabidopsis nitrate transporter NRT1.7, expressed in phloem, is responsible for source-to-sink remobilization of nitrate. Plant Cell 2009, 21, 2750–2761. [Google Scholar] [CrossRef] [Scilit]
  51. Li, Y.G.; Ouyang, J.; Wang, Y.Y.; Hu, R.; Xia, K.F.; Duan, J.; Wang, Y.Q.; Tsay, Y.F.; Zhang, M.Y. Disruption of the rice nitrate transporter OsNPF2.2 hinders root-to-shoot nitrate transport and vascular development. Sci. Rep. 2015, 5, 9635. [Google Scholar] [CrossRef] [Scilit] [PubMed]
Figure 1. Design and Optimization of the NO3 Biosensor NitNRCL1. (a) Structural model of the NO3-bound biosensor: NO3 binding to the ligand-binding domain (LBD) triggers a conformational shift, driving the complementation of luciferase fragments (NLuc and CLuc) and restoration of enzymatic activity. (b) Structural design schematics of distinct candidate NO3 biosensors. (c) Three-dimensional structural model of the NrtA protein (PDB ID: 2G29), with a stick model depicting the NO3 binding interface and key interacting residues. (d) Screening of candidate biosensor responsiveness to NO3. Luciferase activity was measured as the change in relative light units (RLU) using a microplate reader before and after NO3 supplementation. NitNRCL1 displayed the maximal induction of firefly luciferase activity. (*** p < 0.001, * p < 0.05, ns p ≥ 0.05, Student’s t-test) Error bars represent the mean ± standard deviation from n = 3 biological replicates.
Biosensors 16 00243 g001
Figure 2. In Vitro Functional Validation of the NitNRCL1 Biosensor. (a) Specificity assay: Relative activity of purified NitNRCL1 protein following incubation with diverse analyte compounds. The concentrations of KCl, KNO3, Gly-Gly, (NH4)2SO4, and K2SO4 are all 5 mM. Only the NO3 treatment groupwas significantly different from the control (*** p < 0.001, Student’s t-test). (b) Bioluminescence response of NitNRCL1 to increasing concentrations of NO3, fitted to the Hill equation, Kd = 12.90 µM (R2 = 0.9816). NO3 concentrations are indicated in the figure. Data represent the means ± SD of six biological replicates. ΔRLU, change in relative luminescence units.
Biosensors 16 00243 g002
Figure 3. Responsiveness of NitNRCL1 Expressed in Living E. coli Rosetta Cells. (a) Specificity assessment of NitNRCL1 in living cells: Rosetta cells expressing NitNRCL1 were treated with 5 mM of the indicated compounds, and chemiluminescent signals were captured. Tested compounds are labeled in the figure. (b) Sensitivity assessment of NitNRCL1 in living cells: Rosetta cells expressing NitNRCL1 were treated with gradient concentrations of NO3, and luminescence signals were recorded. NO3 concentrations are indicated in the figure. (c) Statistical analysis of relative luminescence activity changes induced by the indicated compounds in panel. Only the NO3 treatment group was significantly different from the control (*** p < 0.001, Student’s t-test). (d) Dose-response curve of ΔRLU values from panel B, fitted to the Hill equation. All values represent the means ± standard deviations (SD) of three biological replicates (n = 3). Kd = 16.69µM, R2 = 0.9674. ΔRLU, change in relative luminescence units.
Biosensors 16 00243 g003
Figure 4. Expression of NitNRCL1 in Transgenic Plants. (a) Phenotypic analysis (upper panel) of 7-day-old wild-type (Col-0) and transgenic Arabidopsis (OE) seedlings grown on 1/2 MS medium, and corresponding chemiluminescent signals (lower panel) induced by 10 mM NO3 treatment. Scale bar, 2 mm. (b) Statistical analysis of root and hypocotyl lengths of 7-day-old Arabidopsis seedlings; ns indicates no significant difference (p ≥ 0.05). (c) Statistical analysis of the mean gray values of chemiluminescent signals in 7-day-old Arabidopsis seedlings. Data represent the means ± SD (n = 7, *** p < 0.001, Student’s t-test).
Biosensors 16 00243 g004
Figure 5. Functional Validation of NitNRCL1 in Transgenic Arabidopsis thaliana. (a) Chemiluminescent imaging of OE Arabidopsis seedlings under NO3-replete (10 mM KNO3) and NO3-deprived conditions. Scale bar, 2 mm. (b) Statistical analysis of the mean gray values in leaves and roots. All values represent the means ± SD (n = 7; *** p < 0.001, Student’s t-test). (c) Chemiluminescent imaging of wild-type and OE Arabidopsis under NO3-replete and NO3-deprived conditions. Scale bar, 10 mm.
Biosensors 16 00243 g005
Figure 6. Dynamic Monitoring of NO3 Uptake and Translocation in Transgenic Arabidopsis via NitNRCL1. (a) In vivo live imaging tracking of NO3 signals in OE Arabidopsis seedlings. Following 7 days of nitrogen starvation, continuous luminescence monitoring was initiated 30 min prior to treatment with 10 mM KNO3 (+NO3), with signal dynamics recorded post-treatment. Time points are denoted in h:min. Before, pre-NO3 treatment; +NO3, post-NO3 treatment. Scale bar, 10 mm. (b) Schematic of 16 marked leaf zones of interest (red circles) for spatial quantitative gray value analysis, with zones 1–4 designated as young central leaves, zones 5–10 as expanding leaves, and zones 11–16 as mature peripheral leaves. Scale bar, 10 mm. (ce) Time-mean gray value curves depicting luminescence intensity changes in each marked ROI over time, with the timing of NO3 application indicated.
Biosensors 16 00243 g006
Disclaimer/Publisher’s Note: The statements, opinions and data contained in all publications are solely those of the individual author(s) and contributor(s) and not of MDPI and/or the editor(s). MDPI and/or the editor(s) disclaim responsibility for any injury to people or property resulting from any ideas, methods, instructions or products referred to in the content.