Article

Rapid Detection of VOCs from Pocket Park Surfaces for Health Risk Monitoring Using SnO2/Nb2C Sensors

1
College of Mechanical Engineering, Yangzhou University, Yangzhou 225127, China
2
School of Architecture and Fine Art, Dalian University of Technology, Dalian 116024, China
*
Author to whom correspondence should be addressed.
Biosensors 2025, 15(7), 457; https://doi.org/10.3390/bios15070457 (registering DOI)
Submission received: 30 May 2025 / Revised: 4 July 2025 / Accepted: 11 July 2025 / Published: 15 July 2025

Abstract

The organic volatile compound gases (VOCs) emitted by the rubber running tracks in the park pose a threat to human health. Currently, the challenge lies in how to detect the VOC gas concentration to ensure it is below the level that is harmful to human health. This study developed a low-power acetone gas sensor based on SnO2/Nb2C MXene composites, designed for monitoring acetone gas in pocket park rubber tracks at room temperature. Nb2C MXene was combined with SnO2 nanoparticles through a hydrothermal method, and the results showed that the SnO2/Nb2C MXene composite sensor (SnM-2) exhibited a response value of 146.5% in detecting 1 ppm acetone gas, with a response time of 155 s and a recovery time of 295 s. This performance was significantly better than that of the pure SnO2 sensor, with a 6-fold increase in response value. Additionally, the sensor exhibits excellent selectivity against VOCs, such as ethanol, formaldehyde, and isopropanol, with good stability (~20 days) and reversibility (~50). It can accurately recognize acetone gas concentrations and has been successfully used to simulate rubber track environments and provide accurate acetone concentration data. This study provides a feasible solution for monitoring VOCs in rubber tracks and the foundation for the development of low-power, high-performance, and 2D MXene gas sensors.

1. Introduction

With the acceleration of urbanization, pocket parks, as scarce public spaces in high-density urban areas, have increased in number year by year. However, the release of volatile organic compounds (VOCs), including acetone, from plastic tracks under high temperatures poses a severe threat to children’s health. As a common additive in plastic materials, acetone can cause various health problems when exposed to high concentrations over long periods, including central nervous system depression, respiratory irritation, eye and skin damage, and even potential liver and kidney dysfunction [1]. Additionally, acetone is highly flammable, and when it reaches a certain concentration in the air, it can initiate explosions or fires, posing a potential risk to industrial safety and public spaces [2]. Therefore, monitoring and control of acetone release from plastic tracks were crucial for safeguarding public health.
In recent years, chemical resistance-type gas sensors have achieved advancements in acetone monitoring [3]. Zheng designed a Pt@In2O3 composite material with an eggshell-like structure based on metal oxide In2O3, achieving high-performance detection of acetone gas [4]. The material showed a response value of up to 57.1 for 100 ppm acetone at 300 °C, with response and recovery times of only 1 s and 44 s, respectively, and a detection limit as low as 0.5 ppm. Hu successfully achieved ppb-level acetone detection by preparing a porous Co3O4 nanosheet array derived from MOFs and assembling it onto SnO2 nanofibers [5]. The sensor showed a response value of 16.7 for acetone at 200 °C, with response and recovery times of 4 s and 39 s, respectively. Despite significant advancements in existing technologies, issues such as high working temperatures and insufficient selectivity still prevent them from meeting the application of outdoor park health monitoring.
SnO2 is a typical wide-bandgap (3.6 eV) n-type metal oxide semiconductor [6,7]. Due to its excellent chemical stability, low cost, and inherent sensitivity toward reducing gases, it became a fundamental material in gas sensing technology [8,9,10,11]. Its sensing mechanism primarily involves the adsorption-desorption process between target gas molecules and the oxygen species (O, O2) pre-adsorbed on the SnO2 surface. This process induces changes in carrier density through electron exchange, thereby leading to a variation in resistance. However, the performance of the original SnO2-based sensors was often affected by the severe agglomeration of nanoparticles, which decreases the available active sites and restricts gas diffusion pathways. The layered structure, tunable surface functionality, excellent conductivity, and high specific surface area of MXenes provided an ideal platform for anchoring SnO2 nanoparticles [12,13]. Specifically, MXenes exhibited a synergistic effect on the sensing performance due to their inherent gas response properties, showing enhanced selectivity to polar molecules. Wu developed a Ni3(HITP)2/Nb2C MXene heterostructure for ppb-level ethanol detection [14]. Zhou successfully used plasma-functionalized Nb2CTx MXene for NH3 detection [15]. Moreover, MXenes can operate efficiently at room temperature, making them suitable for the development of low-power gas sensors and avoiding the energy consumption issues of traditional materials that require high-temperature heating [16,17,18,19,20].
In this work, we employed a heterojunction coupling strategy to develop new sensing materials for acetone monitoring. Using an improved hydrothermal synthesis method, SnO2 nanoparticles were successfully loaded onto Nb2C MXene nanosheets to prepare SnO2/Nb2C MXene composite materials. Experimental results showed that the SnO2/Nb2C MXene composite sensor (SnM-2) exhibited high response (146.5%) for 1 ppm acetone gas detection, with relatively fast response and recovery times (155/295 s), significantly outperforming pure SnO2-based sensors (response value was 6 times higher, response speed improved by 15%). This was attributed to the layered structure of MXenes, which mitigated the reduced effective surface area of SnO2 nanoparticles caused by aggregation, and the formed heterojunction significantly enhanced the overall performance of the composite material. Moreover, in simulated rubber track environment experiments, the sensor effectively detected acetone gas concentrations and successfully inferred the decay period of acetone gas in the rubber track (decaying to 1 ppm after 5 days), providing a feasible solution for gas release monitoring in sports field materials.

2. Materials and Methods

2.1. Materials

The pentahydrate tin chloride (SnCl4·5H2O), hydrazine hydrate (N2H4·H2O), 49% hydrofluoric acid (HF), and 20 wt% tetramethylammonium hydroxide (TMAOH) solution were all purchased from Shanghai McLin Biotech Co., Ltd. (Shanghai, China). The 400 mesh MAX phase (Nb2AlC) powder was purchased from Jilin Eleven Technology Co., Ltd. (Jilin, China). Deionized water was used throughout the experiments.

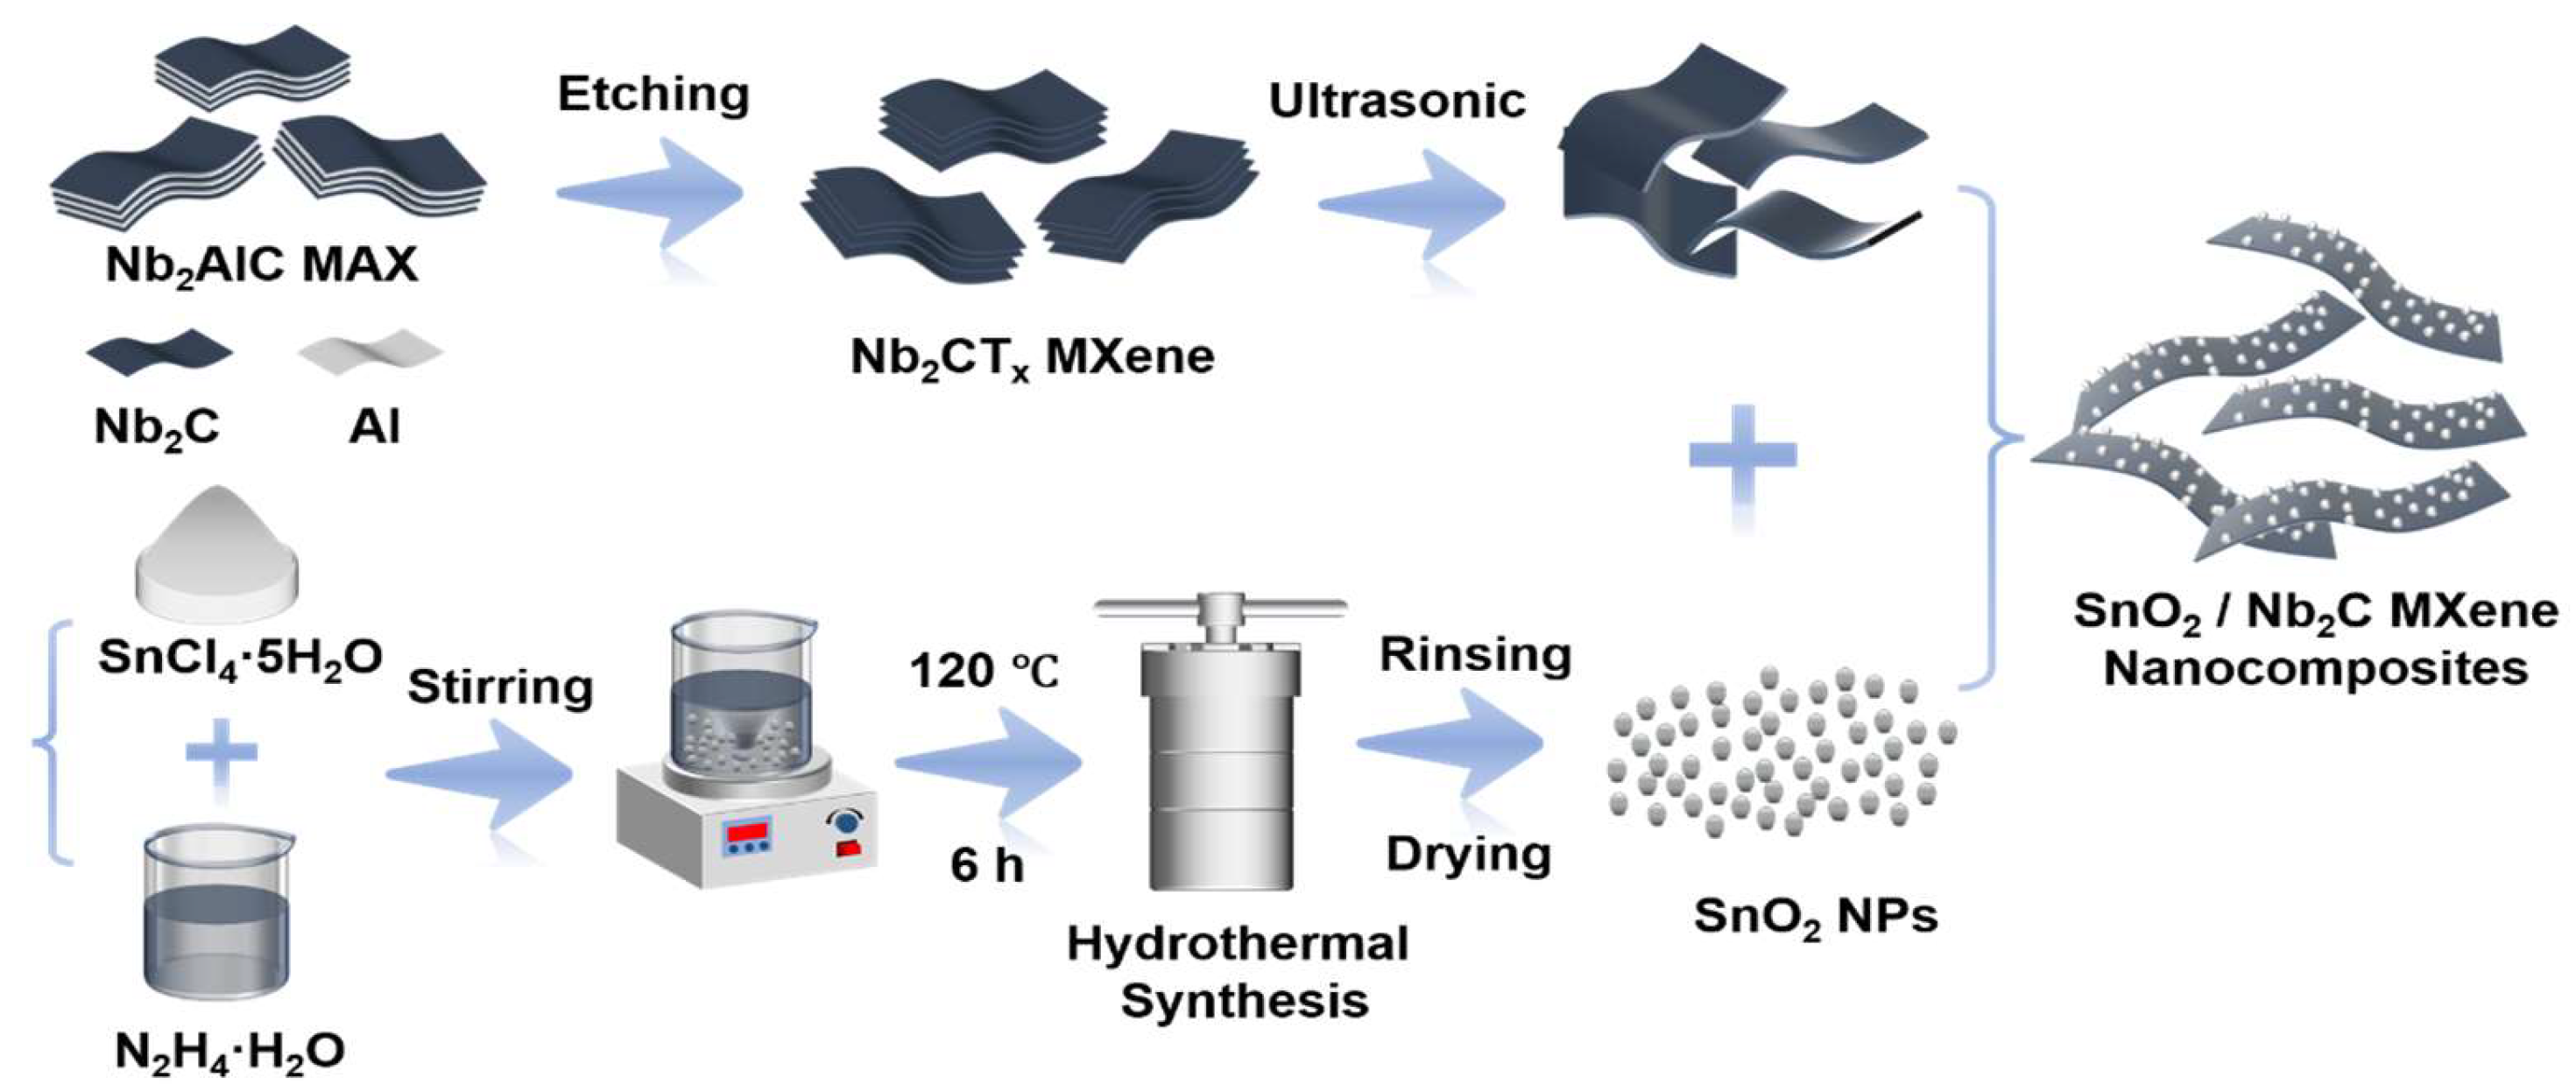
2.2. Synthesis of Nb2C MXene

Nb2C MXene was synthesized via HF etching of the Nb2AlC MAX phase precursor. In a PTFE beaker, 30 mL of 49% HF was added. Then, 2 g of Nb2AlC powder was slowly added to the beaker, with stirring at 500 rpm. The reaction was carried out at 50 °C for 72 h. After the reaction, the slurry was centrifuged and washed with deionized water multiple times until the pH of the supernatant reached 6–7. The resulting viscous precipitate was then added to 50 mL of 20 wt% TMAOH solution and stirred at room temperature for 24 h. After stirring, the precipitate was centrifuged twice at 8500 rpm with deionized water. Subsequently, the mixture was centrifuged at 3500 rpm for 30 min. Finally, the supernatant containing a few-layer Nb2C MXene was collected.

2.3. Synthesis of SnO2 Nanoparticles

Nanoparticles were synthesized via a hydrothermal method. First, 1.12 g of SnCl4·5H2O and 0.64 g of hydrazine hydrate (N2H4·H2O) were dissolved in 160 mL of deionized water. After stirring for 10 min, a white slurry formed, suggesting the formation of SnO2 intermediates during the reaction between N2H4 and SnCl4. This solution was then transferred to a 200 mL PTFE-lined autoclave. The autoclave was sealed and maintained at 120 °C for 6 h, then allowed to cool to room temperature naturally. Post-reaction, the solution was centrifuged and filtered. The resulting precipitate was washed with ethanol and deionized water, then dried in an oven at 60 °C for 1 h to obtain SnO2 nanoparticles.

2.4. Synthesis of SnO2/Nb2C MXene

Composite materials were prepared by mixing Nb2C MXene and SnO2 nanoparticles at different mass ratios to prepare the composite material. Specifically, three composite materials (SnM-1, SnM-2, and SnM-3) were obtained by mixing 100 mg of SnO2 nanoparticles with 10 mg, 20 mg, and 30 mg of Nb2C MXene, respectively. The mixture was ultrasonically dispersed in ethanol for 2 h. The mixture was then transferred to a hydrothermal reactor and reacted at 120 °C for 6 h to promote the integration of Nb2C MXene and SnO2 nanoparticles. After the reaction, the mixture was washed and dried to obtain the three SnM-n (n = 1, 2, 3) composites.

2.5. Preparation of Gas Sensors

The four composite materials, SnO2, SnM-1, SnM-2, and SnM-3, were each suspended in an ethanol solution. After ultrasonic dispersion, the suspension was drop-coated on the Pt electrode (the size of the Pt electrode was 2 mm × 2 mm) and then dried in an oven at 60 °C for 6 h to form the sensitive layer of the gas sensor. After the sensitive layer was dried, the sensor was completed and ready for testing.

2.6. Gas Sensitivity Testing

Gas sensitivity measurements were performed using an SD101 gas sensor testing device (Huachuang Ruike, China). The device consists of three parts: the gas sensitivity testing module, a static testing chamber, and data acquisition software. Two pairs of sensors coated with SnM-1, SnM-2, SnM-3, and SnO2 gas-sensitive materials were inserted into the slots of the gas sensitivity testing module. The gas channel leading to the static testing chamber was independently controlled by a mass flow controller (MFC). In this setup, the gas flow rate was precisely set to 200 sccm (standard cubic centimeters per minute), using pure air as the balancing gas. After the sensors stabilized in air, the target gas was introduced into the static testing chamber to evaluate the sensors’ gas sensitivity performance. During testing, the data acquisition software (HCRK-SD101 V2.3) displayed the time variation of the sensor’s resistance.
For the performance of the sensing material, the gas sensor response was defined as:
Response = R a R g R g   ×   100 %
where Ra is the sensor resistance in air, and Rg is the resistance in the target gas. The time taken for the sensor to reach 90% of the total resistance change during the response and recovery phases is called the response time and recovery time, respectively.

2.7. Characterization Methods

To investigate the overall morphology of MXenes and composite materials, field emission scanning electron microscopy (FE-SEM, Hitachi S-4800, Hitachi High-Tech Corporation, Hitachi City, Japan) was used for morphological analysis, and EDS realizes micro-area component analysis through characteristic X-ray energy dispersion. This time, FE-SEM combined with an SDD detector (energy resolution < 125 eV) was used, configured with 20.0 kV acceleration voltage, 10 nA beam current, and 60 s/frame counting time, and the quantitative accuracy was ensured by Filter Fit fitting and the Proza correction model. Additionally, X-ray diffraction (XRD, D8 ADVANCE, Bruker Corporation, Karlsruhe, Germany) was employed to study the phase and crystal structure of the materials. To examine the band structure and surface state of the materials, X-ray photoelectron spectroscopy (XPS, Thermo Fisher Science, ESALAB 250Xi, Manchester, UK) was used. During the spectrum acquisition process, a constant analyzer energy mode was applied. For high-resolution scans of specific elements, the pass energy was set to 20 eV with a step size of 0.05 eV, while the pass energy for survey scans was 100 eV with a step size of 1 eV.

3. Results and Discussions

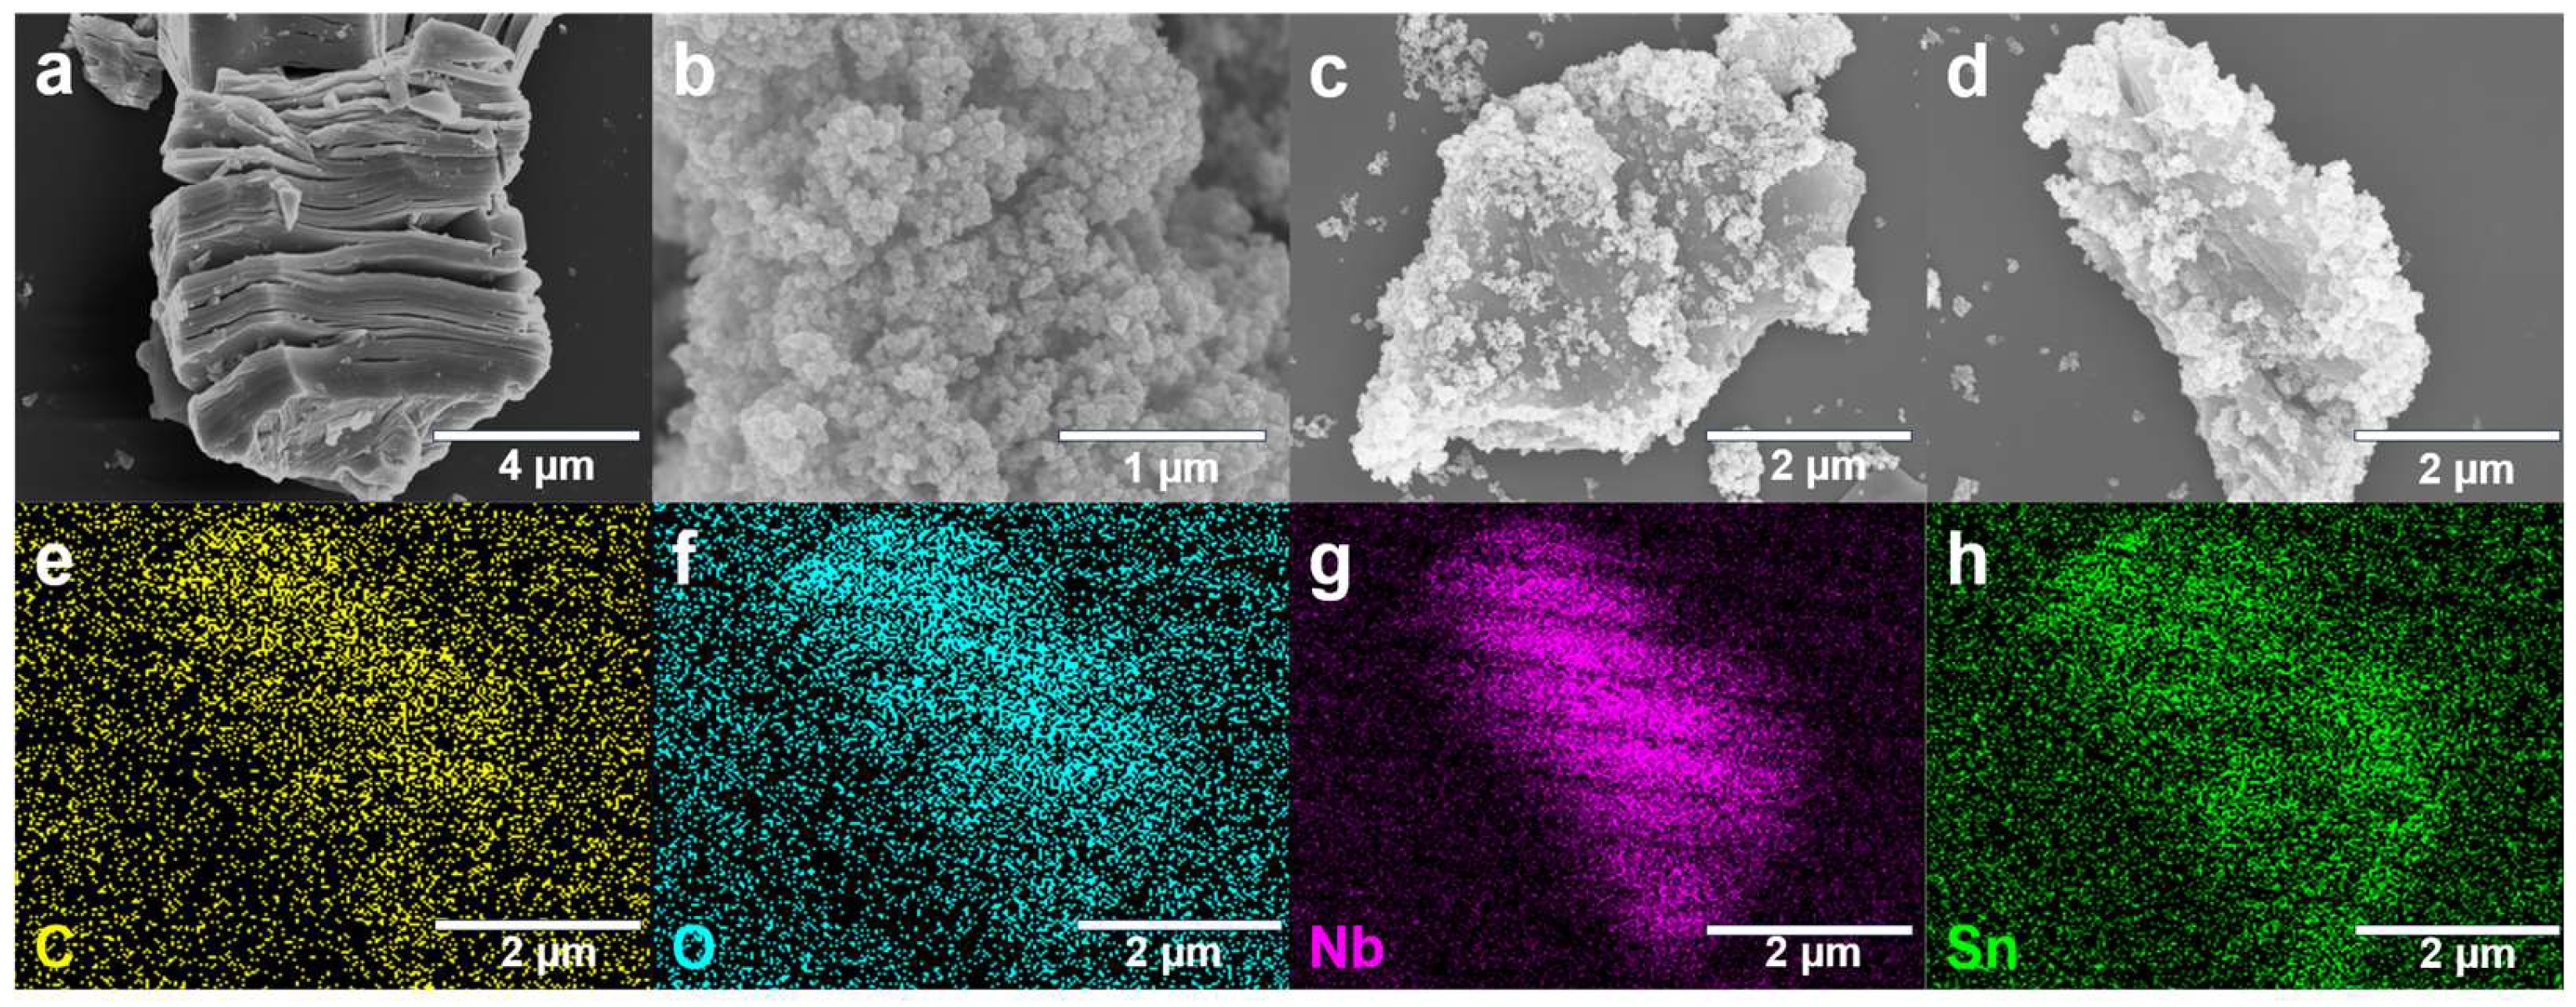
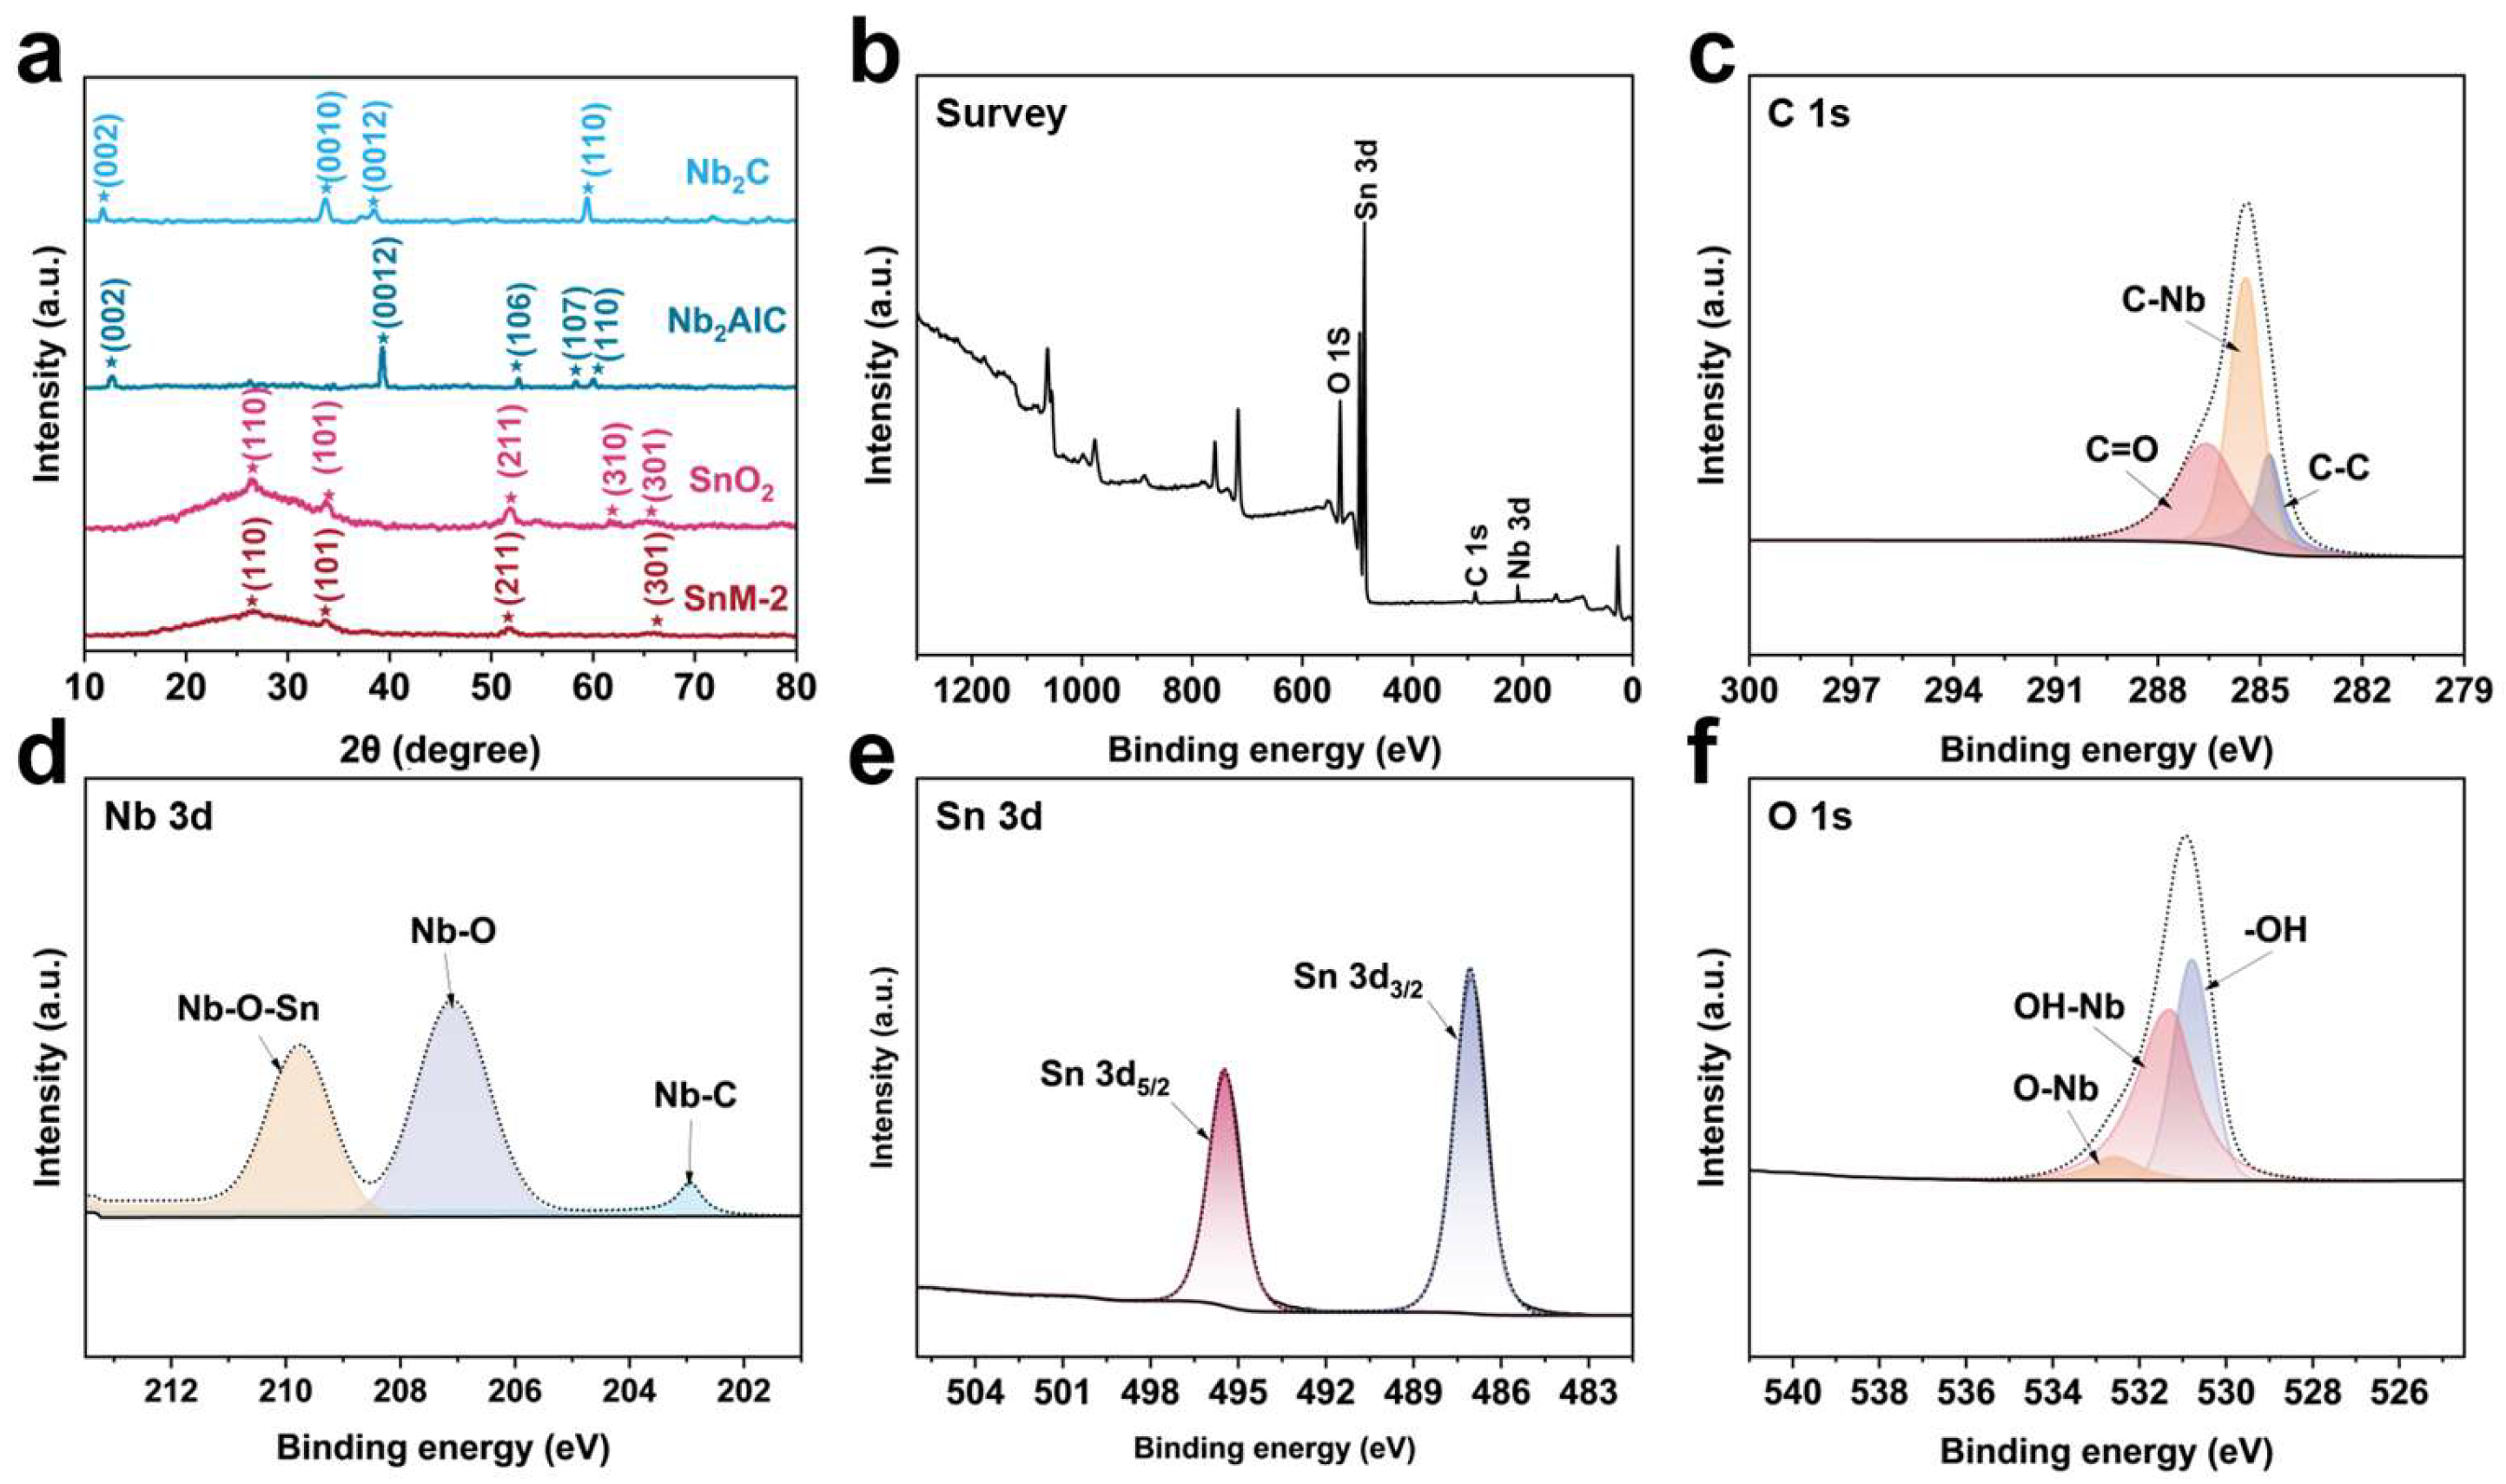
3.1. Morphology and Structural Characterization

The synthesis process of the SnO2/MXene nanocomposite material is illustrated in Figure 1. The process first involved selectively etching Nb2AlC MAX phase to prepare highly conductive Nb2CTx MXene nanosheets [21]. Then, under hydrothermal conditions, the MXene nanosheets were integrated with SnO2 precursors via a hydrothermal reaction. This stepwise synthesis strategy effectively constructed a hierarchical composite system of SnO2 nanoparticles and the MXene layered structure, thereby enhancing the interface contact between the two and providing a platform for charge transfer and gas molecule adsorption.
The scanning electron microscopy (SEM) images of the composite material’s morphology are shown in Figure 2a–c. Figure 2a shows that after hydrothermal treatment, Nb2C MXene exhibited a typical “accordion” layered structure, with thin nanosheets in a loosely stacked state [22]. This structure increased the material’s specific surface area, facilitating the diffusion and adsorption of gas molecules. Figure 2b indicates that SnO2 nanoparticles were approximately spherical, with a uniform particle size distribution, though mild aggregation of nanoparticles was observed. Figure 2c presents the microscopic morphology of the SnO2/MXene composite material: after the introduction of the Nb2CTx MXene skeleton, some SnO2nanoparticles are anchored on the surface of the MXene nanosheets, effectively preventing the aggregation of SnO2, but based on the mass ratio of 100 mg SnO2 to 20 mg MXene, there are still a small amount of incompletely bound SnO2 free particles. This structural feature can effectively promote charge transfer and enhance the adsorption and reactive activity of gas molecules on the composite material’s surface.
Figure 2d–h illustrates the energy dispersive spectroscopy (EDS) element mapping analysis of the composite material. The elements of C and Nb were distributed uniformly within the MXene substrate region, while the elements of Sn and O were concentrated in the SnO2 nanoparticle area, indicating that SnO2 had been successfully loaded onto the MXene surface and was distributed evenly. The uniform distribution of all elements demonstrated the homogeneous distribution within the composite structure, a crucial element in ensuring the stability and repeatability of the gas sensor’s response.
Figure 3a shows the XRD patterns of Nb2CTx MXene, Nb2AlC MAX, SnO2, and SnM-2 composites. For Nb2C MXene, clear diffraction peaks corresponding to the (002), (0010), (0012), and (110) planes were observed, respectively. The prominent and sharp (0010) peak indicates a high degree of crystallinity along the c-axis, which is a hallmark of its layered structure. The presence of the (002) peak further confirms the ordered stacking of the MXene layers, while the (110) peak appearing at a higher angle reflects the lattice constant along the c-axis and exhibits crystallographic anisotropy. In contrast, the Nb2AlC MAX phase exhibits a clear XRD pattern with peak positions that are significantly different from those of Nb2C MXene, indicating that the Al layer has been successfully etched and a MXene with an increased interlayer spacing has been formed. For the SnM-2 composite material composed of SnO2 and Nb2C MXene, the XRD pattern mainly shows the characteristic peaks of SnO2, such as (110), (101), (211), (310), and (301), which are consistent with its crystal structure. In addition, due to the low content of MXene in the composite sample, the diffraction peak of SnO2 is obvious, and the peak position of MXene is not well displayed [23,24].
To analyze the surface chemical states of the SnO2/MXene composite material, XPS characterization was conducted (Figure 3b–f). The survey spectrum (Figure 3b) shows the presence of elements such as Sn, Nb, O, and C, which correspond to the constituent elements of MXene (Nb, C) and SnO2 (Sn, O), indicating the successful synthesis of the SnO2/MXene composite [25]. The C 1s spectrum (Figure 3c), after multi-peak fitting, was decomposed into chemical states of C-Nb, C=O, and C-C. Among these, the C-Nb peak had a lower binding energy, indicating the formation of a strong chemical bond between the carbon and niobium atoms, which is a typical carbon–niobium bond in MXene materials. The appearance of the C=O peak could be related to oxidation or the adsorption of oxygen on the sample surface. The C-C peak corresponds to the carbon atoms between the MXene layers, reflecting the presence of carbon atoms in the layered structure of MXene. The Nb 3d spectrum (Figure 3d) revealed the chemical environments of Nb-C, Nb-O-Sn, and Nb-O. The Nb-C peak had a lower binding energy, indicating the formation of a stable chemical bond between niobium and carbon atoms, further confirming the presence of the MXene structure. The Nb-O-Sn peak indicated that there was an oxygen-mediated interaction between Nb and Sn, likely due to the composite formation between SnO2 and Nb2CTx, which resulted in the formation of Nb-O-Sn chemical bonds. The Nb-O peak corresponded to the oxidized state of niobium atoms, indicating that some niobium atoms had bonded with oxygen [26]. The Sn 3d spectrum (Figure 3e) consisted of two peaks, Sn3d5/2 and Sn3d3/2, with a binding energy difference of approximately 8.4 eV between them, suggesting that the Sn element exists in a single chemical state, namely Sn4+ ions, which is consistent with the chemical state of Sn in SnO2, further confirming the presence of SnO2 and its chemical state in the composite material. The O 1s spectrum (Figure 3f), after fitting, identified functional groups such as O-Nb, OH-Nb, and -OH. The O-Nb peak corresponded to oxygen atoms bonded with niobium, reflecting the presence of oxygen atoms in Nb2CTx. The OH-Nb peak indicated the presence of niobium hydroxyl groups, possibly related to the hydroxylation of the MXene surface. The -OH peak likely corresponded to water molecules or hydroxyl free radicals adsorbed on the sample surface [27].
Based on the XRD and XPS analysis results, it can be inferred that there is a strong interaction between SnO2 and Nb2CTx in the SnO2/Nb2CTx MXene composite material. The XRD analysis confirmed the successful fabrication of the MXene layered structure. The XPS analysis revealed the presence of various chemical states and functional groups on the composite material’s surface, especially the interaction between SnO2 and Nb2CTx. This interaction, along with the rich functional groups on the material’s surface, significantly affects the gas-sensing performance of the composite material, providing a theoretical basis for further optimization of its properties.
In addition, the study provided further explanations for the XRD analysis and supplemented the Brunauer-Emmett-Teller (BET) specific surface area test to enhance the characterization of the material structure. The relevant experimental data and patterns are presented in Figures S1 and S2 of the Supporting Information.

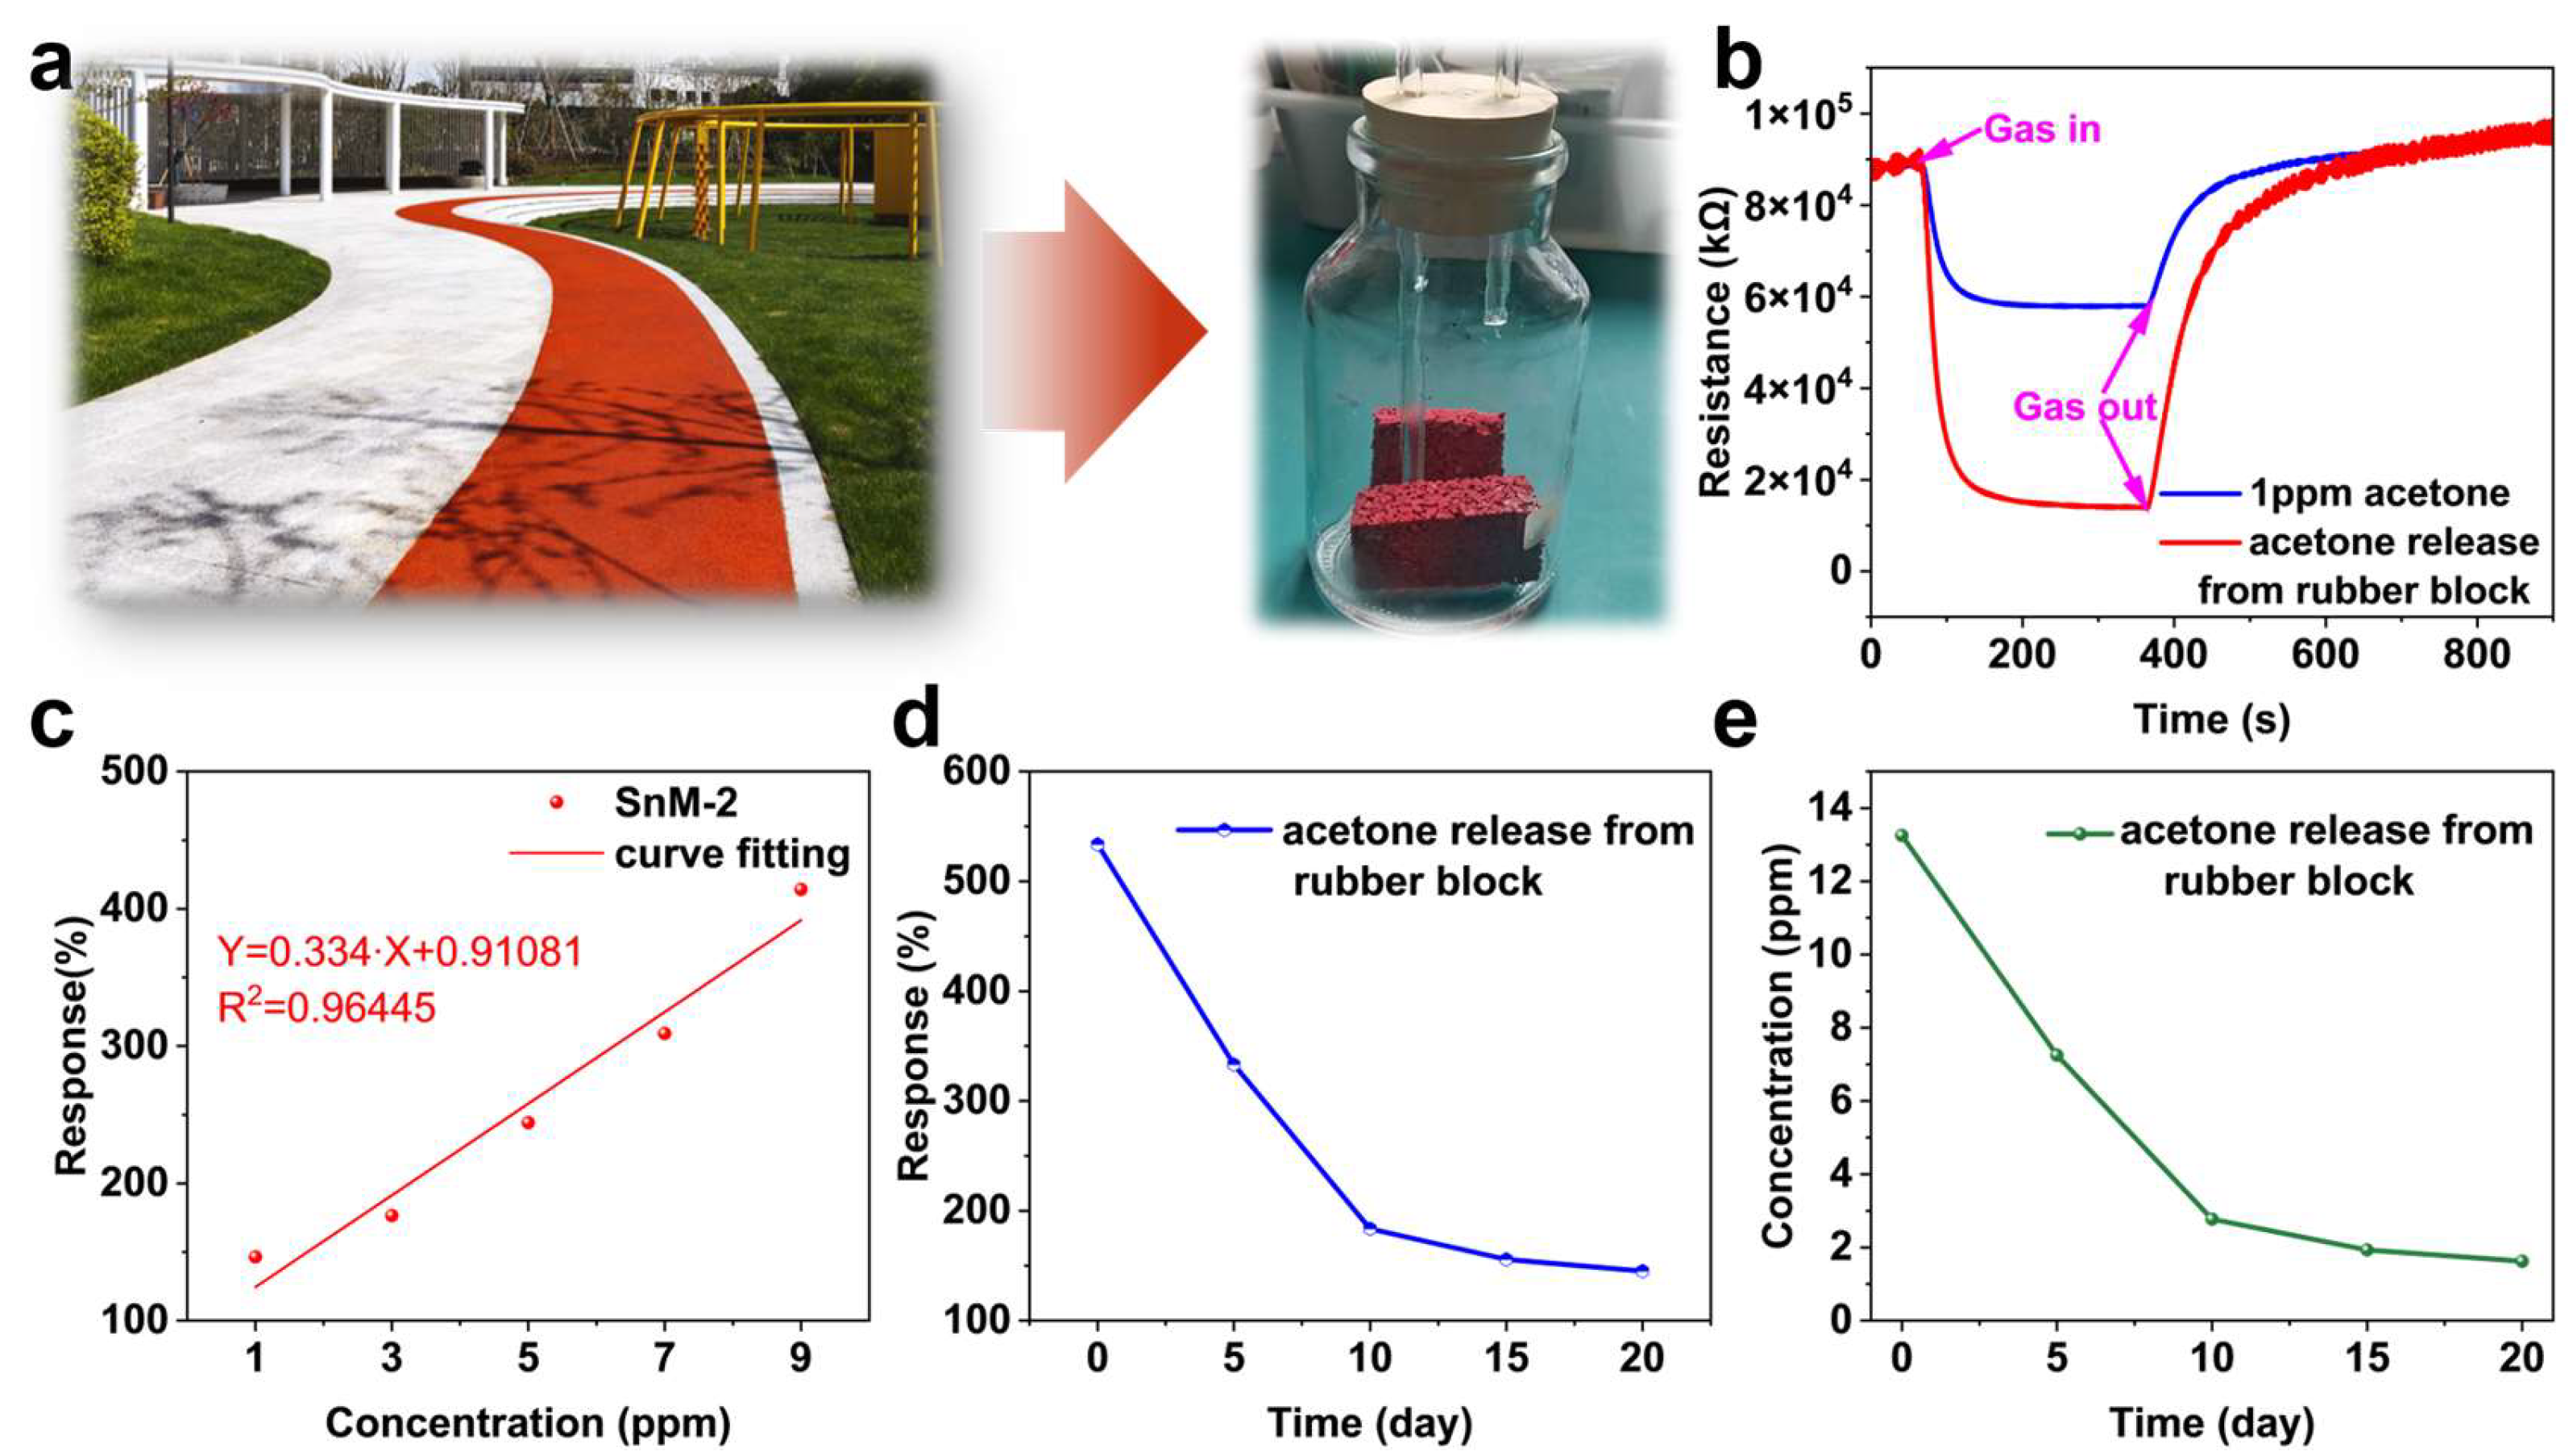
3.2. Performance of Gas Sensors

In this study, the response intensity of SnO2, SnM-1, SnM-2, and SnM-3 sensors to 1 ppm acetone at room temperature was evaluated. Figure 4a presents the dynamic sensor response transients of the four sensors to 1 ppm acetone at room temperature. The response values of the SnM-n (n = 1, 2, 3) sensors were considerably higher than those of the SnO2 sensor, indicating that the gas-sensing performance of the composite material was enhanced after the introduction of the MXene framework. Concurrently, the SnM-2 sensor demonstrated the most abbreviated response time (approximately 155 s) and recovery time (295 s, Figure 4b), accompanied by a response value of 146.5% (Figure 4c). Conversely, the response times of SnO2, SnM-1, and SnM-3 were prolonged to 180, 200, and 210 s, respectively, accompanied by corresponding increases in recovery times to 310, 320, and 330 s. This discrepancy suggested that the SnM-2 sensor exhibited superior dynamic response characteristics compared to the other sensors.
Furthermore, the response–recovery curves of the four sensors to 1–9 ppm acetone gas and the relationship between response values and concentration were examined (Figure 4d,e). As the acetone concentration increased, the response values of all sensors increased linearly, and the SnM-n (n = 1, 2, 3) series sensors showed a faster rise compared to the pure SnO2 sensor, indicating superior performance in acetone detection. Among the sensors examined, the SnM-2 sensor demonstrated the most substantial change in response, suggesting an increased gas sensitivity. The response to this stimulus was contingent upon the concentration of acetone and was the result of a combined effect of SnO2 and MXene. The stability of SnO2 served as a foundation for sensing applications, while the incorporation of MXene dopants enhanced the material’s overall performance. This phenomenon has been demonstrated to increase the number of active sites and enhance the electron transport path. Appropriate amounts of MXene mitigated the issues associated with excessive amounts of the material, which had been shown to prolong electron transport pathways. This equilibrium guaranteed optimal responsiveness and amplified the sensor’s signal to the acetone concentration.
We tested the cyclic stability of the four sensors to see if they could work well in real applications (Figure 4f). In multiple cycles of testing with 1 ppm acetone gas, the sensors demonstrated stable performance with no significant decay. The mean response values were 24.58%, 44.16%, 144.53%, and 31.21%, respectively. To assess the long-term stability of the sensors, they were exposed to 1 ppm acetone at room temperature for a period of 30 days (Figure 4g). After 30 days, the response values of the sensors demonstrated no significant decay. These findings indicated that the sensors exhibited exceptional long-term stability and longevity. The enhanced performance could be attributed to the stable effect of SnO2 and the superior electron transport properties of MXene. As illustrated in Figure 4h,i, these sensors demonstrated optimal temperature ranges and selectivity outcomes. The SnM-2 sensor demonstrated the highest response values from 25 °C to 50 °C, indicating its optimal performance for acetone detection within this temperature range. The SnM-2 sensor demonstrated notable selectivity for acetone gas. Notably, the response value of the sensor was found to be significantly higher than that of other gases, including ethanol, formaldehyde, and isopropanol, under conditions involving complex gas environments. This observation underscored the sensor’s notable resistance to interference from diverse gas compositions. Meanwhile, compared with other acetone gas sensors listed in Table 1, our SnM-2 sensor has many advantages in detecting acetone, especially in terms of sensitivity and low actual detection concentration.
Humidity is also an important factor affecting the gas-sensitive response. For this reason, we evaluated the effect of relative humidity (RH) levels from 20% to 80% on the sensing performance of 10 ppm acetone at room temperature. Figure S3 shows the gas-sensitive responses of SnO2, SnM-3, SnM-2, and SnM-1 sensors at different RH levels. As the RH increases, the gas-sensitive response values of all sensors show a downward trend, which is mainly due to the competitive adsorption of water molecules and acetone gas molecules on the active sites on the surface of the material. Specifically, at 20% relative humidity, the SnM-2 material exhibits the highest response value (about 412%), while the response value of SnO2 is the lowest (about 75%). It is worth noting that the SnM-2 sensor exhibits good moisture resistance, and the response value remains at 340% at 80% RH, which is much higher than the 60% of the pure SnO2 sensor. The results show that after the introduction of the Nb2CTx MXene skeleton, the SnM-2 sensor can maintain good gas-sensing properties even in a high-humidity environment [20].
In summary, the SnO2 nanoparticle gas sensor modified with Nb2C MXene exhibited good performance in acetone gas detection and can be used for practical environmental monitoring.

3.3. Application

To systematically evaluate the volatilization characteristics of acetone in rubber tracks, this study conducted simulation experiments using newly prepared rubber blocks (Figure 5a). The experimental materials used were red granular rubber samples, which were processed and placed in a custom-sealed container to replicate the slow-release process of acetone under real-world conditions [34,35]. The variation in acetone release was monitored using the SnM-2 sensor. The SnM-2 sensor continuously monitored the acetone gas released from the rubber block, recording the sensor’s resistance changes, which were then converted into acetone concentration values to quantitatively assess the acetone release.
Figure 5b presents the response curves of the sensor to 1 ppm of acetone gas and acetone gas released from the rubber block. It can be observed that the resistance curve of acetone gas from the newly prepared rubber block exhibits significant variation. This not only indicates that the acetone content in the newly prepared rubber block is relatively high but also demonstrates the applicability of the SnM-2 sensor in environmental monitoring. Figure 5c shows the response values of the SnM-2 sensor to different concentrations of acetone gas and their linear fit line. The experimental results indicate a good linear relationship between the sensor’s response values and acetone concentration, with the linear equation Y = 0.334·X + 0.91081 and R2 = 0.96445. This suggests that the SnM-2 sensor has excellent linearity and quantitative analysis capabilities within its detection range, enabling it to accurately reflect changes in acetone gas concentration and enable quantitative assessment of the acetone release from the rubber block.
Additionally, we tracked the variation in response values of the rubber block sample releasing acetone gas over 20 days (Figure 5d). The results indicated that the acetone release exhibited a three-stage decay characteristic: the initial stage (0–5 days) showed a rapid release rate, the middle stage (5–15 days) exhibited a slower decay, and the final stage (15–20 days) reached a stable level. Subsequently, based on the linear response characteristics of the SnM-2 sensor, we inverted the data to calculate the acetone gas concentration change curve over the 20 days (Figure 5e). The calculation results showed that the rubber block initially released a higher concentration, which gradually decreased over time. This trend was consistent with the response value changes observed in Figure 5c, further verifying the reliability of the sensor data. By monitoring the release behavior of acetone gas, this approach provides a theoretical basis for assessing the acetone release from newly constructed rubber tracks and formulating appropriate control measures.

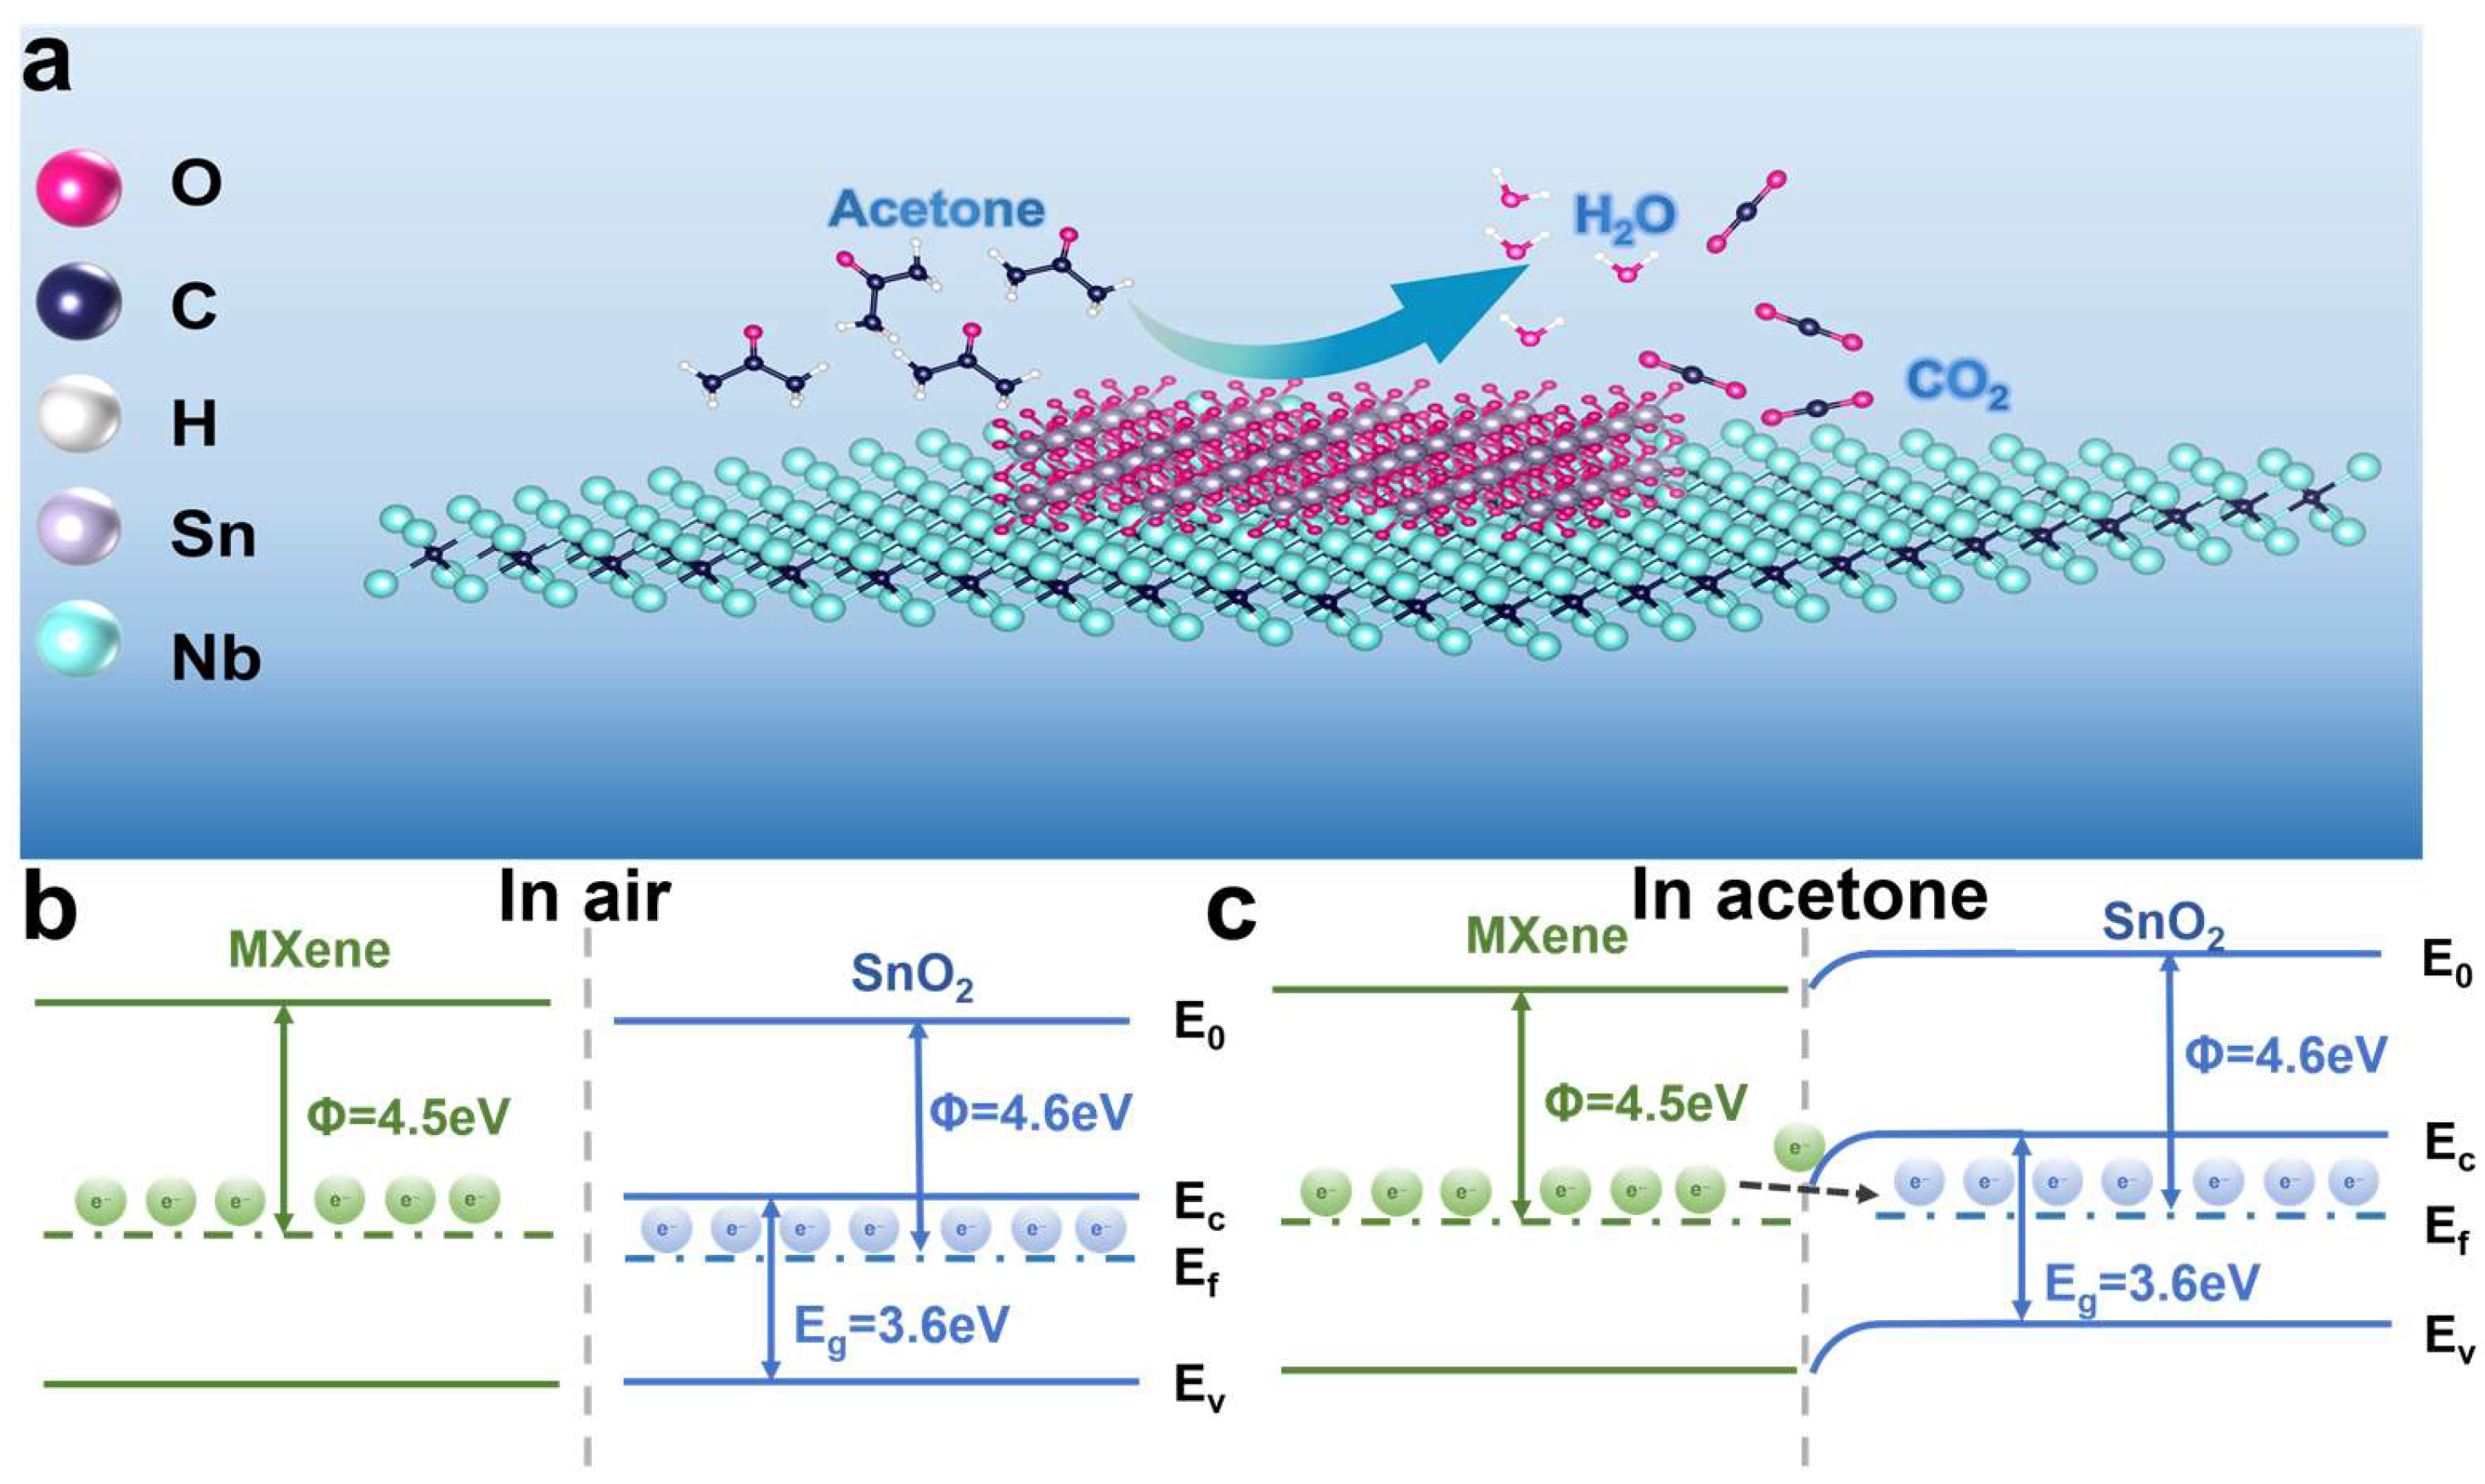
3.4. Gas Sensing Mechanism

In this study, the sensing mechanism of the SnM-2 sensor for acetone gas was based on the sensing principle of n-type metal oxide semiconductor materials, which mainly involved the adsorption of gas molecules on the material’s surface, redox reactions, and electron transport processes (Figure 6). In air, oxygen molecules adsorbed onto the surface of the SnM-2 sensor and captured electrons from the conduction band of SnO2, forming oxygen ions (O, O2), as shown in Equations (2)–(4):
O 2 ( gas ) O 2 ( ads )
O 2 ( gas ) + e O 2 ( ads )
O 2 ( ads ) + e 2 O ( ads )  
These oxygen ions form an electron-depleted layer on the material’s surface, leading to an increase in the sensor’s resistance [36,37]. When the SnM-2 sensor was exposed to acetone gas, the adsorbed oxygen ions underwent redox reactions with acetone molecules, as shown in Equation (5):
CH 3 CO CH 3 ( gas ) + 8 O ( ads ) 3 CO 2 ( gas ) + 3 H 2 O ( gas ) + 8 e
In this reaction process, acetone molecules were oxidized, releasing electrons back into the conduction band of SnO2. The injection of these electrons reduced the electron-depleted layer, leading to a decrease in the sensor’s resistance. When the sensor was exposed to air again, oxygen molecules re-adsorbed onto the material’s surface, and the sensor’s resistance gradually returned to its original value.
The excellent sensing performance of the SnM-2 sensor can be attributed to three main factors. First, the introduction of the Nb2C MXene framework increased the material’s specific surface area and effectively prevented the aggregation of SnO2 nanoparticles, thereby exposing more active sites [38]. These active sites provided more adsorption space for gas molecules and facilitated the desorption process of the gas molecules. Additionally, the rich functional groups on the MXene surface (such as -O, -OH, and -F) served as adsorption sites, further enhancing the tunability and variability of surface electrons through hydrogen bonding or electronic interactions, thus improving the sensing response. These functional groups interacted with acetone gas molecules, enhancing the adsorption and desorption processes of acetone molecules on the material’s surface, thereby increasing the sensor’s sensitivity to acetone [39,40].
Second, the heterojunction interface formed between MXene and SnO2 plays a crucial role in enhancing the sensing performance. The heterojunction effect at the SnO2 and MXene interface leads to electron accumulation and depletion, forming a Schottky barrier. Specifically, due to the work function difference (SnO2: 4.6 eV; Nb2C MXene: 4.5 eV), electrons migrate from the lower work function MXene to the higher work function SnO2, forming a Schottky barrier at the interface that enhances charge separation and transport in Figure 6b,c [41,42]. The electron distribution at this interface undergoes significant changes, creating a charge-depleted region and forming the Schottky barrier. When the sensor is exposed to acetone gas, acetone molecules react with the oxygen species on the sensor surface, releasing the captured electrons. These electrons quickly enter the conduction band, leading to a significant decrease in the material’s resistance and a considerable increase in the response speed. After gas desorption, the released electrons quickly return to the interface, causing the resistance to rise and the recovery speed to improve significantly [43,44]. This mechanism allows the heterojunction structure between SnO2 and MXene to significantly accelerate both the response and recovery speeds [45,46,47].
Finally, the electronic transport path was optimized by appropriately doping MXene, preventing excessive MXene from causing an overextension of the electron transport path, which could affect efficient electron transfer. By properly controlling the amount of MXene doping, the optimal response speed and sensing performance could be ensured. In summary, these factors synergistically contributed to enhancing the acetone gas sensing performance of the SnO2/Nb2C MXene sensor.

4. Conclusions

This study successfully developed a gas-sensing material based on SnO2/Nb2C MXene heterojunction, enabling low-power environmental monitoring of pocket park rubber tracks. Through the strategic integration of MXene nanosheets, a unique heterojunction interface structure was constructed within the composite material. This structure not only significantly enhances the density of active sites on the material’s surface but also optimizes the electron transport path. Compared to pure SnO2 sensors, the SnM-2 composite sensor exhibited a 146.5% response value for 1 ppm acetone detection, with response/recovery times reduced to 155 s/295 s, a 6-fold increase in sensitivity, and good linear response to acetone gas at different concentrations. Furthermore, the sensor demonstrated reliable performance in simulated rubber track environment experiments and successfully inferred a decay period of 5 days to reach 1 ppm, providing a feasible solution for gas release risk assessment of sports field materials.

Supplementary Materials

The following supporting information can be downloaded at: https://www.mdpi.com/article/10.3390/bios15070457/s1, Figure S1: XRD patterns of Nb2CTx MXene, Nb2AlC MAX, SnO2, and SnM-2; Figure S2: (a) Nitrogen isotherms and (b) pore size distribution curves of SnO2 and SnM-2; Figure S3: The relationship between response values and RH, measured at 10 ppm acetone, under a humidity range of 20–80% RH; Table S1. Properties comparison of acetone sensors.

Author Contributions

Conceptualization, L.G.; data curation, S.H.; investigation, H.H.; methodology, H.H.; resources, Y.X.; software, Y.L.; supervision, Y.X.; writing—original draft, P.W. and Y.L.; writing—review and editing, L.G. and S.H. All authors have read and agreed to the published version of the manuscript.

Funding

This work was supported by the Ministry of Education of the People’s Republic of China Humanities and Social Sciences Foundation (Project No. 23YJC890045), the Natural Science Foundation of Jiangsu Province (Project No. BK20230593), and the Yangzhou Science and Technology Plan Project (YZ2023246).

Institutional Review Board Statement

Not applicable.

Informed Consent Statement

Not applicable.

Data Availability Statement

Data availability All data included in this study are available upon request by contact with the corresponding author.

Conflicts of Interest

The authors declare no conflicts of interest.

References

  1. Wu, X.; Li, N.; Ji, H.; Zhang, H.; Bu, J.; Zhang, X.; Qian, S.; Yang, Y.; Han, B.; Wang, H.; et al. Determination and Analysis of Harmful Components in Synthetic Running Tracks from Chinese Primary and Middle Schools. Sci. Rep. 2019, 9, 12743. [Google Scholar] [CrossRef]
  2. Park, S.; Lim, Y.; Oh, D.; Ahn, J.; Park, C.; Kim, M.; Jung, W.; Kim, J.; Kim, I.-D. Steering Selectivity in the Detection of Exhaled Biomarkers over Oxide Nanofibers Dispersed with Noble Metals. J. Mater. Chem. A 2023, 11, 3535–3545. [Google Scholar] [CrossRef]
  3. Zhang, L.; Zhou, M.; Meng, F.; Bai, J.; Wang, D.; Tang, M.; Wu, Z. Recent Advances in Chemiresistive Gas Sensor for Acetone Detection: Focus on Room Temperature. TrAC Trends Anal. Chem. 2025, 187, 118213. [Google Scholar] [CrossRef]
  4. Zheng, Z.; Chi, H.; Wu, J.; Zhang, L.; Huang, D.; Ye, Z.; Jiang, J.; Zhu, L. Advanced Yolk-Shell Pt@In2O3 Nanoreactor: Achieving Selective and Ppb-Level Acetone Detection. Sens. Actuators B Chem. 2025, 434, 137599. [Google Scholar] [CrossRef]
  5. Hu, J.; Wang, F.; Yu, J.; Hong, Z.; Zhang, W.; Li, H.-J.; Lai, Z.; Wang, D.; Deng, Y.; Li, G. MOF-Derived Porous Co3O4 Nanosheets Array Assembled on SnO2 Nanofibers for Humidity-Resistant High Efficiency Acetone Detection. Chin. Chem. Lett. 2025, 36, 110863. [Google Scholar] [CrossRef]
  6. Cai, X.; Zhang, P.; Wei, S.-H. Revisit of the Band Gaps of Rutile SnO2 and TiO2: A First-Principles Study. J. Semicond. 2019, 40, 092101. [Google Scholar] [CrossRef]
  7. Wang, W.; Cao, J.; Wang, D.; Zhang, R.; Zhang, Y.; Zhao, L. Insight into SnO2-Based Gas-Sensitive Materials and Readout Circuits for Semiconductor Gas Sensors. Nano Mater. Sci. 2025, 7, 2589–9651. [Google Scholar] [CrossRef]
  8. Aleksanyan, M.; Sayunts, A.; Shahkhatuni, G.; Simonyan, Z.; Kananov, D.; Khachaturyan, E.; Papovyan, R.; Michalcová, A.; Kopecký, D. SnO2/MWCNTs Nanostructured Material for High-Performance Acetone and Ethanol Gas Sensors. ACS Omega 2025, 10, 7283–7294. [Google Scholar] [CrossRef]
  9. Xu, H.; Zhong, H.; Hu, J.; Rong, X.; Zhang, W.; Wang, Y.; Li, S.; Li, G.; Wang, D. Facile Engineering of Metal–Organic Framework Derived SnO2@NiO Core–Shell Nanocomposites Based Gas Sensor toward Superior VOCs Sensing Performance. Chem. Eng. J. 2024, 501, 157692. [Google Scholar] [CrossRef]
  10. Li, J.; Xian, J.; Wang, W.; Cheng, K.; Zeng, M.; Zhang, A.; Wu, S.; Gao, X.; Lu, X.; Liu, J.-M. Ultrafast Response and High-Sensitivity Acetone Gas Sensor Based on Porous Hollow Ru-Doped SnO2 Nanotubes. Sens. Actuators B Chem. 2022, 352, 131061. [Google Scholar] [CrossRef]
  11. Zhang, Z.; Zhao, Z.; Chen, C.; Wu, L. Chemiresistive Gas Sensors Made with PtRu@SnO2 Nanoparticles for Machine Learning-Assisted Discrimination of Multiple Volatile Organic Compounds. ACS Appl. Mater. Interfaces 2024, 16, 67944–67958. [Google Scholar] [CrossRef]
  12. Kim, S.J.; Koh, H.-J.; Ren, C.E.; Kwon, O.; Maleski, K.; Cho, S.-Y.; Anasori, B.; Kim, C.-K.; Choi, Y.-K.; Kim, J.; et al. Metallic Ti3C2Tx MXene Gas Sensors with Ultrahigh Signal-to-Noise Ratio. ACS Nano 2018, 12, 986–993. [Google Scholar] [CrossRef]
  13. Choi, J.; Kim, Y.-J.; Cho, S.-Y.; Park, K.; Kang, H.; Kim, S.J.; Jung, H.-T. In Situ Formation of Multiple Schottky Barriers in a Ti3C2 MXene Film and Its Application in Highly Sensitive Gas Sensors. Adv. Funct. Mater. 2020, 30, 2003998. [Google Scholar] [CrossRef]
  14. Wu, X.; Niu, M.; Tian, X.; Peng, X.; Buenconsej, P.J.S.; Wu, X.; Wang, Y.; Ji, W.; Li, Y.; Qiao, J.; et al. Solution-Processable Ni3(HITP)2/MXene Heterostructures for Ppb-Level Gas Detection. J. Mater. Chem. A 2024, 12, 17382–17394. [Google Scholar] [CrossRef]
  15. Zhou, T.; Zhang, P.; Yu, Z.; Tao, M.; Zhou, D.; Yang, B.; Zhang, T. Light-Driven, Ultra-Sensitive and Multifunctional Ammonia Wireless Sensing System by Plasmonic-Functionalized Nb2CTx MXenes towards Smart Agriculture. Nano Energy 2023, 108, 108216. [Google Scholar] [CrossRef]
  16. Yang, Z.; Jiang, L.; Wang, J.; Liu, F.; He, J.; Liu, A.; Lv, S.; You, R.; Yan, X.; Sun, P.; et al. Flexible Resistive NO2 Gas Sensor of Three-Dimensional Crumpled MXene Ti3C2Tx/ZnO Spheres for Room Temperature Application. Sens. Actuators B Chem. 2021, 326, 128828. [Google Scholar] [CrossRef]
  17. Li, D.; Liang, H.; Zhang, Y. MXene-Based Gas Sensors: State of the Art and Prospects. Carbon 2024, 226, 119205. [Google Scholar] [CrossRef]
  18. Wu, P.; Zhao, X.; Ding, Y.; Huang, Y.; Lin, D.; Xie, L.; Li, Z.; Zhu, Z.; Zhao, H.; Lan, M. Self-Assembled Multilayer Nb2C MXene/MnFe2O4 Electrochemical Sensor with Schottky Junctions for the Detection of Acetaminophen and Dopamine. Colloids Surf. Physicochem. Eng. Asp. 2023, 667, 131377. [Google Scholar] [CrossRef]
  19. Ren, W.; Luan, J.; Yin, L.; Chen, H.; Wang, C.; Zhang, P.; Cui, G.; Lv, L. Ultrasensitive Room-Temperature NO2 Gas Sensor Based on MXene–Cu2O Composites. ACS Sens. 2025, 10, 3579–3588. [Google Scholar] [CrossRef]
  20. Wang, P.; Guo, S.; Zhao, Y.; Hu, Z.; Tang, Y.; Zhou, L.; Li, T.; Li, H.-Y.; Liu, H. WO3 Nanoparticles Supported by Nb2CTx MXene for Superior Acetone Detection under High Humidity. Sens. Actuators B Chem. 2024, 398, 134710. [Google Scholar] [CrossRef]
  21. Yuan, Z.; Wang, L.; Li, D.; Cao, J.; Han, W. Carbon-Reinforced Nb2CTx MXene/MoS2 Nanosheets as a Superior Rate and High-Capacity Anode for Sodium-Ion Batteries. ACS Nano 2021, 15, 7439–7450. [Google Scholar] [CrossRef]
  22. Liu, X.; Zhang, H.; Shen, T.; Sun, J. Flexible Resistive NO2 Gas Sensor of SnO2@Ti3C2Tx MXene for Room Temperature Application. Ceram. Int. 2024, 50, 2459–2466. [Google Scholar] [CrossRef]
  23. Liu, Y.-T.; Zhang, P.; Sun, N.; Anasori, B.; Zhu, Q.-Z.; Liu, H.; Gogotsi, Y.; Xu, B. Self-Assembly of Transition Metal Oxide Nanostructures on MXene Nanosheets for Fast and Stable Lithium Storage. 2018, 30, 1707334. Adv. Mater. 2018, 30, 1707334. [Google Scholar] [CrossRef] [PubMed]
  24. Abid, M.Z.; Rafiq, K.; Aslam, A.; Jin, R.; Hussain, E. Scope, Evaluation and Current Perspectives of MXene Synthesis Strategies for State of the Art Applications. J. Mater. Chem. A 2024, 12, 7351–7395. [Google Scholar] [CrossRef]
  25. Wang, L.P.; Leconte, Y.; Feng, Z.; Wei, C.; Zhao, Y.; Ma, Q.; Xu, W.; Bourrioux, S.; Azais, P.; Srinivasan, M.; et al. Novel Preparation of N-Doped SnO2 Nanoparticles via Laser-Assisted Pyrolysis: Demonstration of Exceptional Lithium Storage Properties. Adv. Mater. 2017, 29, 1603286. [Google Scholar] [CrossRef]
  26. Zhu, Z.; Xing, X.; Feng, D.; Li, Z.; Tian, Y.; Yang, D. Highly Sensitive and Fast-Response Hydrogen Sensing of WO3 Nanoparticles via Palladium Reined Spillover Effect. Nanoscale 2021, 13, 12669–12675. [Google Scholar] [CrossRef]
  27. Zhu, X.; Li, J.; Chang, X.; Gao, W.; Chen, X.; Niu, S.; Sun, S. Room Temperature Gas Sensors for NH3 Detection Based on SnO2 Films and Lamellar-Structured Ti3C2Tx MXene Heterojunction Nanocomposites. Appl. Surf. Sci. 2024, 660, 159976. [Google Scholar] [CrossRef]
  28. Yuan, K.; Wang, C.-Y.; Zhu, L.-Y.; Cao, Q.; Yang, J.-H.; Li, X.-X.; Huang, W.; Wang, Y.-Y.; Lu, H.-L.; Zhang, D.W. Fabrication of a Micro-Electromechanical System-Based Acetone Gas Sensor Using CeO2 Nanodot-Decorated WO3 Nanowires. ACS Appl. Mater. Interfaces 2020, 12, 14095–14104. [Google Scholar] [CrossRef]
  29. Zhang, D.; Liu, A.; Chang, H.; Xia, B. Room-Temperature High-Performance Acetone Gas Sensor Based on Hydrothermal Synthesized SnO2-Reduced Graphene Oxide Hybrid Composite. RSC Adv. 2014, 5, 3016–3022. [Google Scholar] [CrossRef]
  30. Zhang, Y.; Jia, C.; Kong, Q.; Fan, N.; Chen, G.; Guan, H.; Dong, C. ZnO-Decorated In/Ga Oxide Nanotubes Derived from Bimetallic In/Ga MOFs for Fast Acetone Detection with High Sensitivity and Selectivity. ACS Appl. Mater. Interfaces 2020, 12, 26161–26169. [Google Scholar] [CrossRef]
  31. Wu, M.; He, M.; Hu, Q.; Wu, Q.; Sun, G.; Xie, L.; Zhang, Z.; Zhu, Z.; Zhou, A. Ti3C2 MXene-Based Sensors with High Selectivity for NH3 Detection at Room Temperature. ACS Sens. 2019, 4, 2763–2770. [Google Scholar] [CrossRef]
  32. Jaisutti, R.; Lee, M.; Kim, J.; Choi, S.; Ha, T.-J.; Kim, J.; Kim, H.; Park, S.K.; Kim, Y.-H. Ultrasensitive Room-Temperature Operable Gas Sensors Using p-Type Na:ZnO Nanoflowers for Diabetes Detection. ACS Appl. Mater. Interfaces 2017, 9, 8796–8804. [Google Scholar] [CrossRef]
  33. Yang, J.; Liu, J.; Xu, Y.; Li, X.; Wu, J.; Han, Y.; Wang, Z.; Zhang, X. Enhanced Selective Acetone-Sensing Performance of Hierarchical Hollow SnO2/α-Fe2O3 Microcubes. J. Mater. Chem. C 2019, 7, 11984–11990. [Google Scholar] [CrossRef]
  34. Xu, J.; Fan, X.; Xu, K.; Wu, K.; Liao, H.; Zhang, C. Ultrasensitive Chemiresistive Gas Sensors Based on Dual-Mesoporous Zinc Stannate Composites for Room Temperature Rice Quality Monitoring. Nano-Micro Lett. 2025, 17, 115. [Google Scholar] [CrossRef] [PubMed]
  35. Xie, S.; Wan, Z.; Chen, H.; Li, J.; Na, E.; Wang, F.; Gao, R.; Wu, Y.; Wang, S.; Li, G.-D. Triethylamine Gas Sensor Based on Au-Functionalized CdGa2O4 for the Practical Detection of Fish Freshness. Sens. Actuators B Chem. 2025, 440, 137891. [Google Scholar] [CrossRef]
  36. Kou, X.; Meng, F.; Chen, K.; Wang, T.; Sun, P.; Liu, F.; Yan, X.; Sun, Y.; Liu, F.; Shimanoe, K.; et al. High-Performance Acetone Gas Sensor Based on Ru-Doped SnO2 Nanofibers. Sens. Actuators B Chem. 2020, 320, 128292. [Google Scholar] [CrossRef]
  37. Xie, Q.; Ding, Y.; Wang, Q.; Song, P. Fabrication of 1D/2D In2O3 Nanofibers/Ti3C2Tx MXene Composites for High Performance Detection of Trimethylamine at Low Temperature. Sens. Actuators B Chem. 2024, 405, 135338. [Google Scholar] [CrossRef]
  38. Liu, Y.; Zhang, Y.; Cao, J.; Qin, C.; Wang, Y. SnO2/NiO/Al2O3 Heterojunction Driven Charge Transfer for High-Temperature Hydrogen Detection. Chem. Eng. J. 2025, 510, 161847. [Google Scholar] [CrossRef]
  39. Shin, H.; Ko, J.; Park, C.; Kim, D.-H.; Ahn, J.; Jang, J.-S.; Kim, Y.H.; Cho, S.-H.; Baik, H.; Kim, I.-D. Sacrificial Template-Assisted Synthesis of Inorganic Nanosheets with High-Loading Single-Atom Catalysts: A General Approach. Adv. Funct. Mater. 2022, 32, 2110485. [Google Scholar] [CrossRef]
  40. Hu, Y.; Wang, H.; Liu, D.; Lin, G.; Wan, J.; Jiang, H.; Lai, X.; Hao, S.; Liu, X. Lychee-like ZnO/ZnFe2O4 Core-Shell Hollow Microsphere for Improving Acetone Gas Sensing Performance. Ceram. Int. 2020, 46, 5960–5967. [Google Scholar] [CrossRef]
  41. Zong, S.; Qin, C.; Bala, H.; Zhang, Y.; Wang, Y.; Cao, J. Iso-Elemental SnO/SnO2 Heterojunction Composites for Enhanced Formaldehyde Gas Sensing. Mater. Chem. Phys. 2025, 330, 130167. [Google Scholar] [CrossRef]
  42. Wang, M.; Shen, Z.; Zhao, X.; Duanmu, F.; Yu, H.; Ji, H. Rational Shape Control of Porous Co3O4 Assemblies Derived from MOF and Their Structural Effects on N-Butanol Sensing. J. Hazard. Mater. 2019, 371, 352–361. [Google Scholar] [CrossRef] [PubMed]
  43. Meng, F.; Ji, H.; Yuan, Z.; Chen, Y.; Zhang, H.; Qin, W.; Gao, H. Dynamic Measurement and Recognition Methods of SnO2 Sensor to VOCs Under Zigzag-Rectangular Wave Temperature Modulation. IEEE Sens. J. 2021, 21, 10915–10922. [Google Scholar] [CrossRef]
  44. Zhu, X.; Ola, O.; Li, C.; Gao, W.; Wang, Z.; Dai, C.; Jiang, Y.; Sun, S.; Chang, X. Highly Sensitive and Selective Detection of Ppb-Level Acetone Sensor Using WO3/Au/SnO2 Ternary Composite Gas Sensor. Ceram. Int. 2025, 51, 20094–20102. [Google Scholar] [CrossRef]
  45. Gao, D.; Gao, S.; Deng, H.; Liu, H.; Hou, D.; Lu, Q.; He, X.; Huang, S. Surface Electronic Structure Modulation of PdO/SnO2 through Loading Pd for Superior Hydrogen Sensing Performance. Chem. Eng. J. 2025, 515, 163694. [Google Scholar] [CrossRef]
  46. Qiu, C.; Zhang, H.; Li, Q.; Song, Y.; An, F.; Wang, H.; Wang, S.; Zhu, L.; Zhang, D.; Yang, Z. High Performance H2S Sensor Based on Ordered Fe2O3/Ti3C2 Nanostructure at Room Temperature. ACS Sens. 2024, 9, 5926–5935. [Google Scholar] [CrossRef]
  47. Liu, B.; Li, K.; Luo, Y.; Gao, L.; Duan, G. Sulfur Spillover Driven by Charge Transfer between AuPd Alloys and SnO2 Allows High Selectivity for Dimethyl Disulfide Gas Sensing. Chem. Eng. J. 2021, 420, 129881. [Google Scholar] [CrossRef]
Figure 1. Schematic of SnO2/MXene synthesis process.
Biosensors 15 00457 g001
Figure 2. Characterization results. (ac) Scanning electron microscope (SEM) images of (a). Nb2C MXene, (b). SnO2, (c). SnO2/MXene Nanocomposites. (dh) Elemental mapping images of C, O, Nb, and Sn.
Biosensors 15 00457 g002
Figure 3. (a) XRD patterns of Nb2CTx MXene, Nb2AlC MAX, SnO2 and SnM-2, (b) XPS full survey spectrum; XPS profiles of (c) C 1s, (d) Nb 3d, (e) Sn 3d, and (f) O 1s.
Biosensors 15 00457 g003
Figure 4. (a) The response–time (R–T) curves of four sensors exposed to 1 ppm acetone gas; (b) the response and recovery time profile of the SnM-2 sensor to 1 ppm acetone gas; (c) the dynamic response curve of the SnM-2 sensor over time; (d) the cyclic stability of the four sensors upon exposure to 1 ppm acetone gas; (e) the R–T curves of the four sensors exposed to acetone gas concentrations ranging from 1 to 9 ppm; (f) the linear relationship between sensor response and acetone concentration; (g) the long-term stability of the four sensors; (h) the optimal operating temperature range for the four sensors; (i) the selectivity of the SnM-2 sensor toward acetone gas.
Biosensors 15 00457 g004
Figure 5. (a) Rubber block samples and testing bottles; (b) response curves of SnM-2 sensor to 1 ppm acetone gas and acetone gas released from rubber block samples; (c) response values of SnM-2 sensor to acetone gas at different concentrations and its linear fitting curve; (d) response values of acetone gas released by rubber block samples over 20 days; (e) concentration variation curve of acetone gas released by rubber blocks over 20 days (calculated based on the linear fitting curve).
Biosensors 15 00457 g005
Figure 6. (a) Schematic diagram of gas-sensing mechanism and (b,c) band diagram of SnO2/MXene nanocomposites.
Biosensors 15 00457 g006
Table 1. Properties comparison of acetone sensors.
MaterialsTemperatureConcentrationResponseRes.Ref.
WO3/CeO2250 °C2.5 ppm1.7 a34 s[28]
SnO2/rGORT10 ppm21.9% b107 s[29]
ZnO/IGO300 °C100 ppm27.1 a6.8 s[30]
Ti3C2 MXeneRT10 ppm0.6% b45 s[31]
Na-doped ZnORT0.2 ppm6.55 a18 s[32]
SnO2/Fe2O3270 °C200 ppm9.3 a6 s[33]
SnO2/Nb2CTxRT1 ppm146.5% b155 sThis work
a The response was calculated by Ra/Rg or Rg/Ra. b The response was calculated by ΔR/R0 × 100%.
Disclaimer/Publisher’s Note: The statements, opinions and data contained in all publications are solely those of the individual author(s) and contributor(s) and not of MDPI and/or the editor(s). MDPI and/or the editor(s) disclaim responsibility for any injury to people or property resulting from any ideas, methods, instructions or products referred to in the content.

