Article

A SERS Sensor Prepared via Electrostatic Self-Assembly of Ta4C3@AgNP Nanocomposites for Detection of Ziram

1
College of Science, China Jiliang University, Hangzhou 310018, China
2
College of Optical and Electronic Technology, China Jiliang University, Hangzhou 310018, China
*
Authors to whom correspondence should be addressed.
Biosensors 2025, 15(7), 426; https://doi.org/10.3390/bios15070426
Submission received: 8 May 2025 / Revised: 27 June 2025 / Accepted: 1 July 2025 / Published: 3 July 2025
(This article belongs to the Special Issue Surface-Enhanced Raman Scattering in Biosensing Applications)

Abstract

MXenes are a class of two-dimensional materials exhibiting excellent surface-enhanced Raman scattering (SERS) performance. Currently, the SERS studies of MXenes have been primarily focused on those with M2X and M3X2 structural motifs. In order to expand the SERS sensing application based on MXenes, in this paper, a SERS sensor made of Ta4C3@AgNP nanocomposite material was fabricated by electrostatic self-assembly. Tests such as different concentrations of R6G probe molecules showed that the minimum detection limit of this SERS sensor was 10−8 M, demonstrating excellent sensitivity. When different test areas are selected, the relative error of intensity under the same wave number is less than 10.7%, showing good repeatability and consistency. Furthermore, the Ta4C3@AgNP nanocomposite SERS sensor was used to detect the pesticide Ziram, and a quantitative model was established. Application detection indicates that this sensor has good sensitivity for the pesticide Ziram, and the minimum detection limit was 10−6 M, which exceeded national standard requirements. The findings of this study have potential application value in the fields of food safety and environmental protection.

1. Introduction

In recent years, two-dimensional materials have emerged as a frontier in materials science research due to their unique physicochemical properties and extensive application prospects. Following graphene, MXenes have emerged as a new class of two-dimensional transition-metal carbides or nitrides, quickly garnering widespread attention from both the academic and industrial sectors [1]. The MXene materials are derived from the MAX phase, which is obtained through selective etching of the A-layer elements (typically belonging to group III or IV). The general formula for MXenes is Mn+1XnTX, where M represents a transition metal, X denotes carbon or nitrogen, and TX refers to a surface termination group such as –OH, –O, or –F [2,3]. The unique structure of MXene materials endows them with exceptional electrical, mechanical, and chemical properties [4,5], thereby demonstrating significant potential for applications in energy storage, catalysis, sensing, and environmental remediation [6,7]. As a two-dimensional non-precious-metal material, an MXene demonstrates remarkable surface-enhanced Raman scattering (SERS) activity. Its distinctive electronic and optical properties, coupled with a high specific surface area, exceptional electrical conductivity, and hydrophilicity [8,9], render it highly suitable as a SERS substrate for the sensitive detection of molecules [10].
At present, MXene-based SERS mainly focuses on M2X and M3X2 structures. Peng et al. [11] first reported that Nb2C and Ta2C MXenes exhibited significant SERS enhancement. Ta2C MXenes can sensitively detect and accurately identify the spike protein of SARS-CoV-2, with a detection limit as low as 5 × 10⁻⁹ M, which is conducive to achieving real-time monitoring and early warning of the novel coronavirus. Lan et al. [12] proposed a new molecular enrichment method based on vacuum-assisted filtration, achieving ultrafine molecular enrichment. As a result of the adoption of a two-dimensional miniaturization strategy, the V2C detection limit of R6G reached 1 × 10⁻⁷ M. In 2017, the Ti3C2TX MXene was first demonstrated to have good SERS activity as a SERS substrate; it significantly enhanced the Raman signal that showed R6G [10], and the enhancement factor could reach 10−6 through calculation. This indicates that MXenes have the potential for biomedical or environmental applications. By calculating the cohesive and formation energies of Tin+1Cn, Shein et al. [13] pointed out that the larger the n value, the higher the stability of the nanostructure. In 2024, a high-performance Ti3CN was reported. Through two-dimensional morphology regulation and molecular enrichment strategies, the SERS sensitivity of Ti3CN MXene was further improved [14]. The Ti3CN MXene SERS substrate has also been successfully used for the detection of prohibited fish drugs at low concentrations and a detection limit of 1 × 10⁻⁷ M for the R6G molecule. In 2024, Lan et al. [15] reported two M4X3-structured MXenes as SERS substrates for the first time. These MXenes have excellent surface-enhanced Raman scattering capabilities and achieve an enhancement coefficient of approximately 105 times for analytes. However, it can be seen from this study that the sensitivity of Ta4C3 still needs to be improved. At present, the research on MXenes as SERS substrates is not extensive enough, and the sensitivity of these materials is not high enough. Therefore, precious metals are introduced to enhance the electromagnetic field and improve the SERS sensitivity.
In this work, we successfully synthesized Ta4C3@AgNP nanocomposites via electrostatic self-assembly. The composition of the nanocomposites was analyzed using X-ray photoelectron spectroscopy (XPS), while their morphology was characterized through scanning electron microscopy (SEM) and transmission electron microscopy (TEM). The SERS properties of the Ta4C3@AgNP nanocomposite material were investigated using probe molecules, and its enhancement mechanism was explored. Furthermore, it was fabricated into a sensor and applied for the detection of Ziram. The detection demonstrated that Ta4C3@AgNP nanocomposite material had high sensitivity and repeatability, which proved its promising application in agricultural detection.

2. Materials and Methods

2.1. Materials

Tantalum aluminum carbide (Ta4AlC3, 99%) was purchased from Foshan Xinxin Technology Co., Ltd. (Foshan, China). Hydrofluoric acid (HF, 49 wt%) and Ziram (C6H12N2S4Zn, 95%) were purchased from Ron. Anhydrous calcium chloride (CaCl2, 96%) was purchased from Sinopharm Group Chemical Reagent Co., Ltd. (Shanghai, China). Polydiallyl dimethyl ammonium chloride (PDDA, 20% by weight) was purchased from Yuan Ye Bio (Shanghai, China). Silver nitrate (AgNO3, 99%), sodium citrate (C6H5Na3O7, 98%), hydroxide tetramethyl ammonium (TMAOH, 25% by weight), and sodium borohydride (NaBH4, 96%) were obtained from Aladdin (Shanghai, China). Citric acid (C6H8O7, 99.5%) was sourced from McLin (Shanghai, China). All chemicals did not require further purification processes.

2.2. Preparation of AgNPs

The preparation of a silver colloid was carried out using the sodium citrate reduction method [16]. A total of 0.3 mL of AgNO3 solution was combined with 10 mL of sodium citrate in a round-bottom flask. Subsequently, 1.8 mL of citric acid was added, and the mixture was allowed to stand at room temperature for 3 min. Under continuous stirring, 0.6 mL of freshly prepared NaBH4 was then gradually introduced into the solution, followed by a static period of 5 min. The mixture was then heated to 100 °C and kept in a boiling state for 20 min, followed by cooling in an ice bath.

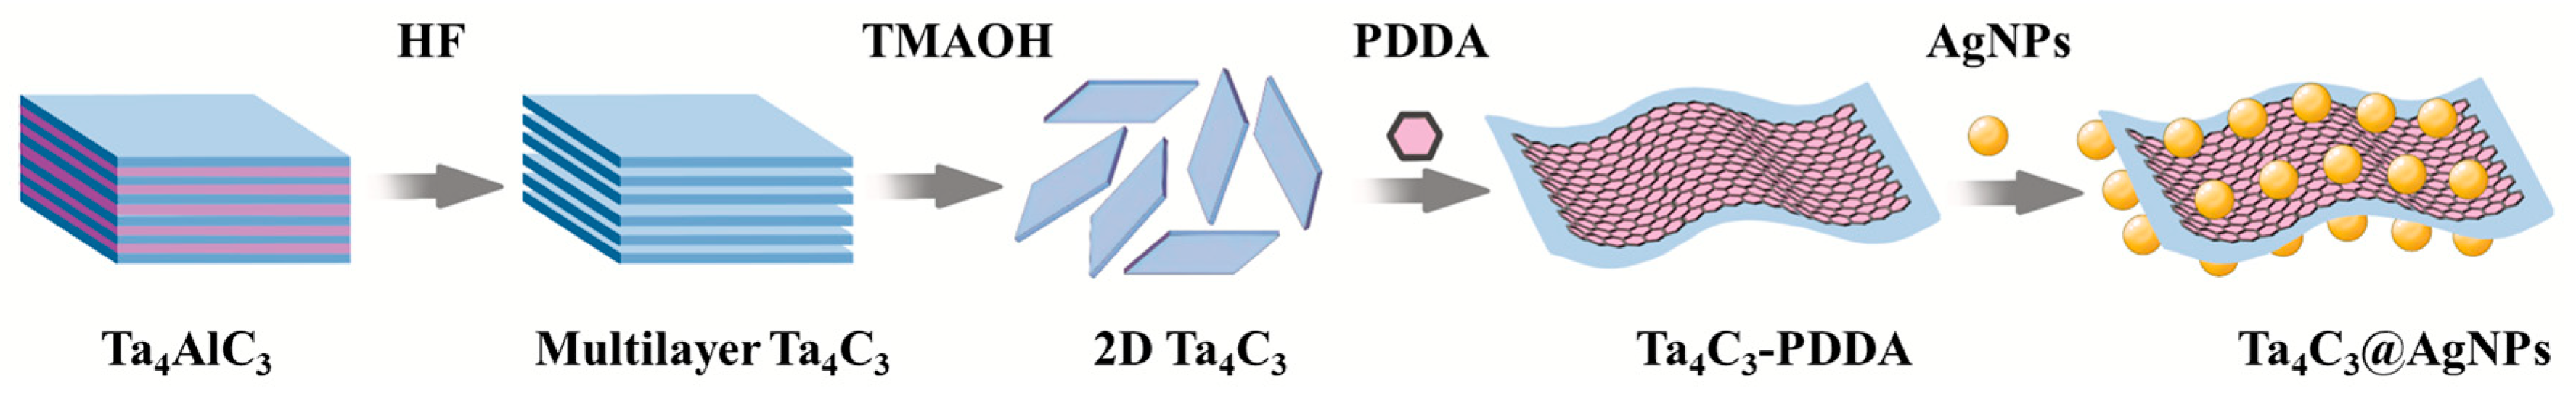
2.3. Synthesis of Ta4C3@AgNP Nanocomposites

The preparation process for the Ta4C3@AgNP nanocomposite material is illustrated in Figure 1. The Ta4C3 MXene was synthesized by etching Ta4AlC3 powder in HF to remove Al layers [17,18], washing to neutral pH, intercalating with TMAOH, and finally delaminating via ice-bath ultrasonication to obtain few-layer nanosheets.
The composite material Ta4C3@AgNPs was synthesized using the method of electrostatic self-assembly [19,20]. To the 10 mL dispersion of Ta4C3 MXene, 4 mL of PDDA solution was slowly added under continuous stirring for 24 h. Subsequently, the resulting product was centrifuged at 4000 rpm for 1 h. The precipitate obtained was washed with deionized water and subjected to centrifugation three times. Finally, the product was added dropwise to the AgNP solution and stirred for 3 h. The mixture was then centrifuged and washed three times to obtain the Ta4C3@AgNP nanocomposite material.

2.4. Characterization

The XRD patterns of the samples were measured using an X-ray diffractometer (XRD, Rigaku SmartLab, Rigaku Corporation, Tokyo, Japan). The morphological structure of the samples was characterized by scanning electron microscopy (SEM, Sigma 360, Carl Zeiss AG, Oberkochen, Germany), transmission electron microscopy (TEM, JEM-2100F, JEOL Ltd., Tokyo, Japan), and atomic force microscopy (AFM, Dimension Icon, Bruker Corporation, MA, USA). An X-ray photoelectron spectrometer (XPS, Scientific K-Alpha, Thermo Fisher Scientific Inc., MA, USA) was utilized to record the X-ray photoelectron spectra. A zeta potential analyzer (DLS, Zetasizer Pro, Malvern Panalytical Ltd., Worcestershire, UK) was used to measure the zeta potential. Raman measurements were acquired using a Raman spectrometer (Raman, inVia, Renishaw plc, Gloucestershire, UK).

2.5. UV-Vis Measurements

First, the liquid sample was diluted to an appropriate concentration, and a solvent that exhibits transparency within the ultraviolet spectrum was selected. Prior to use, the cuvette was thoroughly cleaned to prevent potential contamination. The UV–visible spectrophotometer (UV–Vis, Hitachi UH4150, Hitachi UH4150, Tokyo, Japan) was activated and allowed to preheat for 30 min, and subsequently, the scanning wavelength range was set from 200 nm to 900 nm. Initially, blank correction was conducted using pure solvent, and then the prepared sample was loaded into the cuvette for measurement. Finally, the absorption spectrum obtained was meticulously recorded.

2.6. Raman Measurements

The Ta4C3 MXene dispersion was deposited as droplets on a silicon substrate and allowed to dry naturally. Raman measurements were conducted using a 50× objective lens with an excitation laser wavelength of 532 nm, a laser power of 0.5 mW, an acquisition time of 5 s, and three accumulations while scanning within the range of 1944 to 197 cm−1. The Ta4C3@AgNP nanocomposite was drop-cast onto a silicon wafer and allowed to air dry, forming a uniform film. Both R6G and Ziram were tested in solution form, with their Raman signals acquired by dropwise application onto the SERS substrate. Ziram detection using the Ta4C3@AgNP nanocomposite was performed with a laser power of 273 mW, an acquisition time of 3 s, and three accumulations. Spectral scanning was conducted over the range of 1800 to 200 cm−1.

3. Results

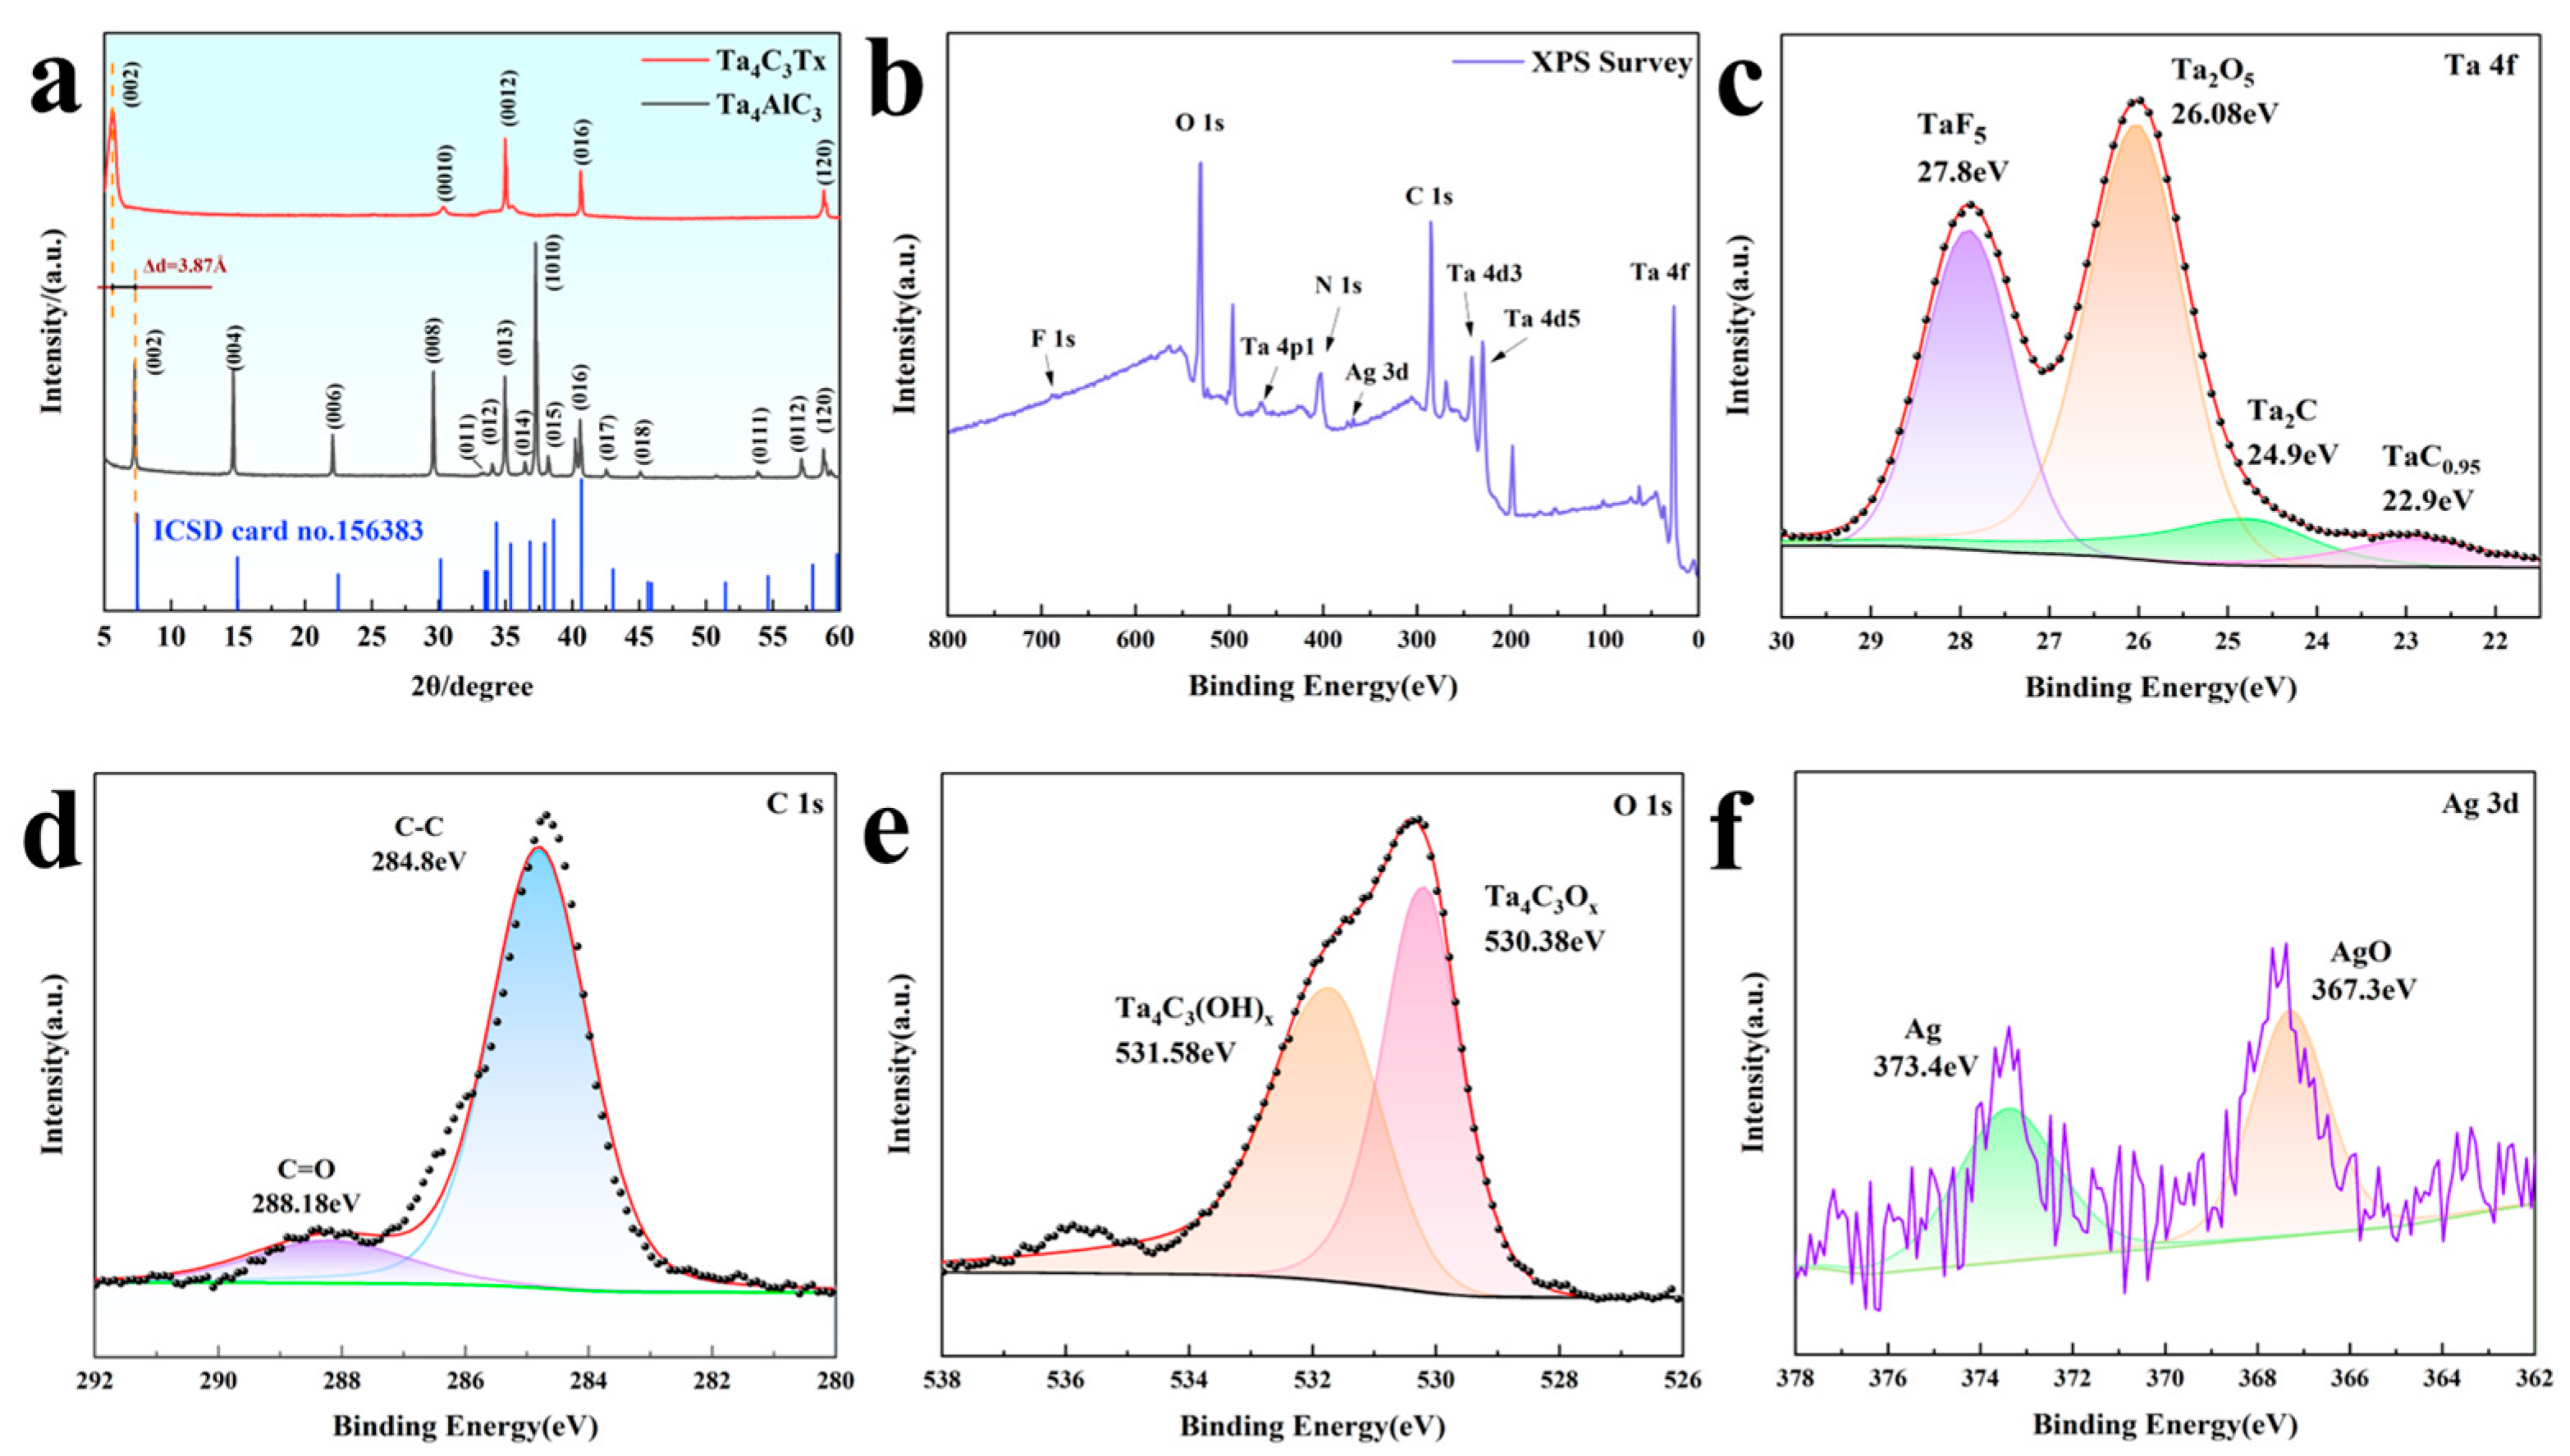
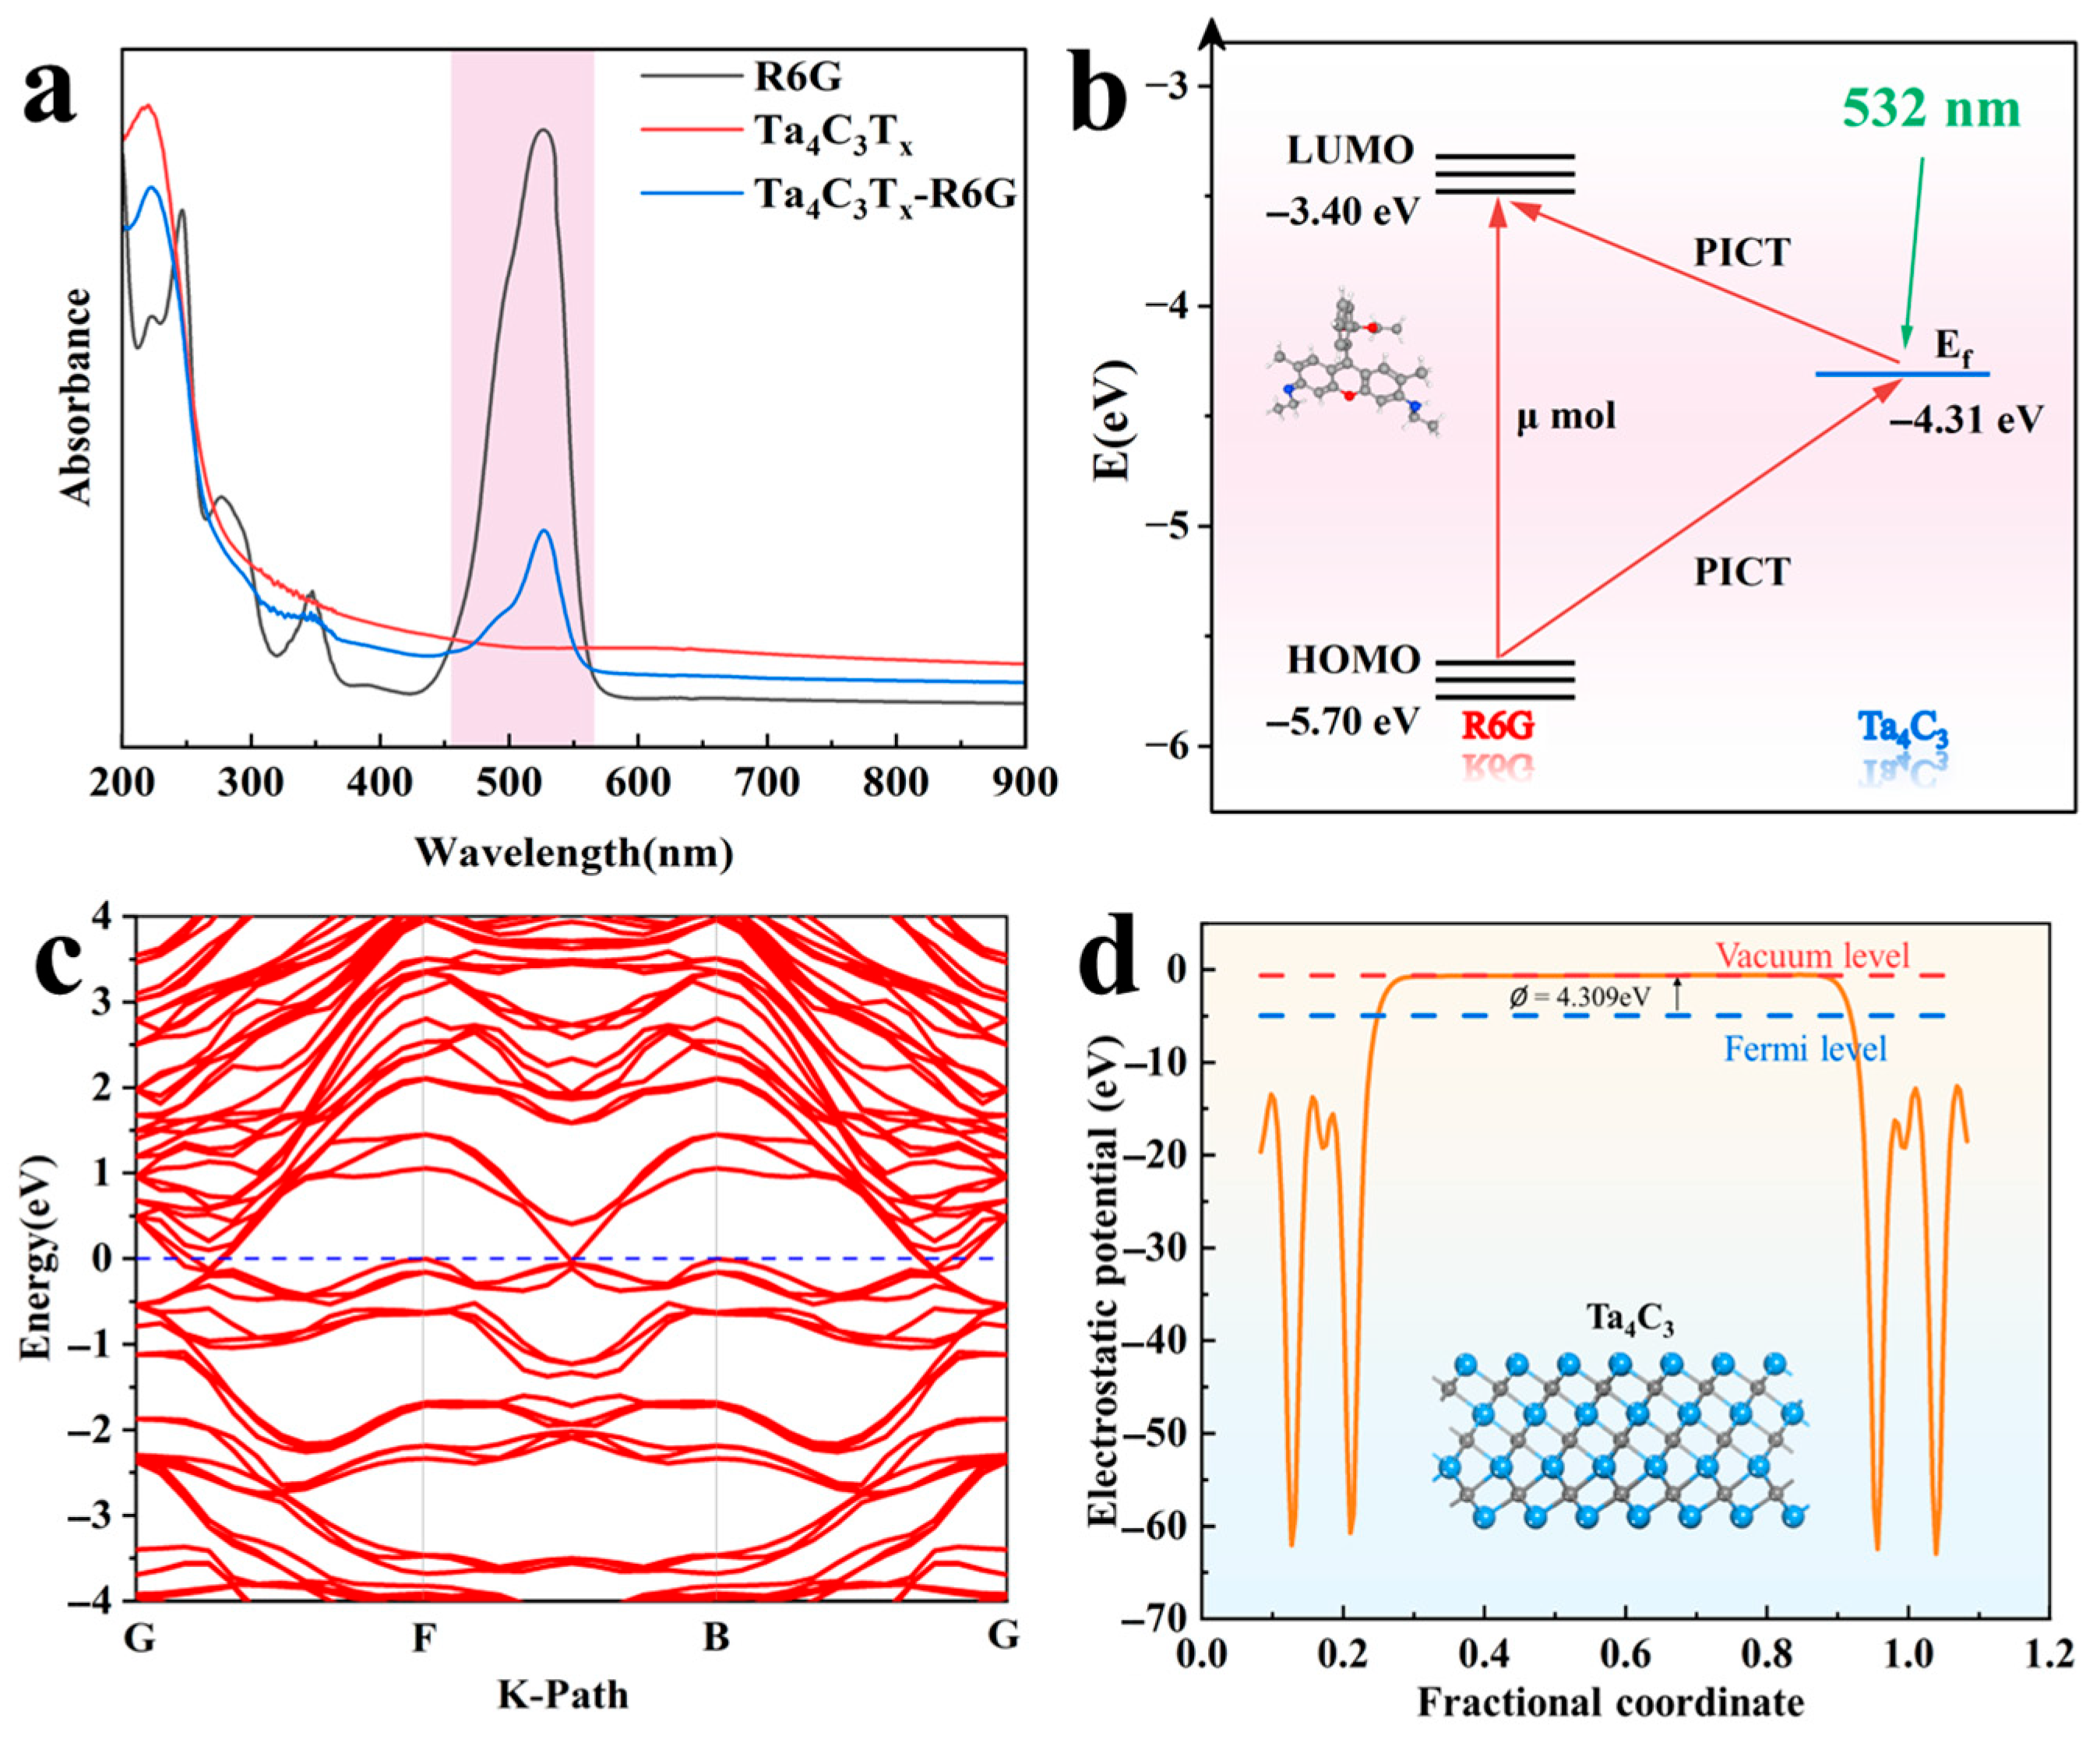
3.1. Characterization of Ta4C3@AgNP Nanocomposites

Figure 2a shows the XRD comparison pattern of the Ta4AlC3 precursor and the Ta4C3TX formed after etching. Through the analysis of the diffraction characteristics, the transformation from MAX to MXene can be observed. The Ta4AlC3 precursor presents a typical hexagonal crystal system MAX phase structure, with the main characteristic peaks located at 7.2°, 14.6°, 22°, 29.6° and 37.2°, corresponding to the (002), (004), (006), (008) and (1010) crystal planes, respectively (ICSD card 156383). After HF acid etching treatment, the most significant change was that the peak (002) shifted from 7.2° to a lower angle of 5.6°, indicating that the lattice parameter of A significantly expanded from the initial value of 23.71 A to 31.45 A, with an increase of 32.6%. This lattice expansion is a direct result of the selective etching of Al atomic layers and the insertion of surface terminating groups (such as –O, –OH, –F, etc.) and water molecules between the layers. Meanwhile, the peaks at 30.4° and 35.1° originate from the diffraction of the (0010) and (0012) planes of Ta4C3, indicating the successful preparation of MXene. The broadening of XRD peaks and the reduction in intensity indicate a decrease in order degree, which is consistent with the characteristics of two-dimensional materials [21,22].
Due to the presence of abundant functional groups on the surface of the Ta4C3 MXene, it exhibits a negatively charged characteristic, with a measured Zeta potential of −42.78 mV. AgNPs were synthesized by reducing sodium citrate, resulting in the presence of citrate ions on their surface, which imparts a negative charge to AgNPs. Consequently, PDDA, as a positively charged modifying agent, was employed to connect two negatively charged materials. A simple electrostatic self-assembly method was utilized to prepare the Ta4C3@AgNP nanocomposite material.
The full-spectrum XPS information of the prepared Ta4C3@AgNP nanocomposite material is presented in Figure 2b. The fitting peaks for Ta 4f, as shown in Figure 2c, correspond to TaF5, Ta2O5, Ta2C, and TaC0.95, with binding energies of 27.8 eV, 26.08 eV, 24.9 eV, and 22.9 eV [23,24], respectively. The peaks in the C 1s spectrum of sample C, as shown in Figure 2d, are located at 284.8 eV and 288.18 eV, corresponding to C-C and C=O bonds, respectively. As illustrated in Figure 2e, the spectra of the O 1s region can be attributed to Ta4C3OX and Ta4C3(OH)X, with binding energies of 530.38 eV and 531.58 eV corresponding to Ta4C3OX and Ta4C3(OH)X. The spectrum peaks in the Ag 3d region, as shown in Figure 2f, are located at 373.4 eV and 367.3 eV, corresponding to Ag and AgO, respectively. The XPS spectrum indicates that Ta, C, O, and Ag are the predominant elements present, and no characteristic peaks associated with Al were detected. This confirms that the Al atomic layer has been successfully removed through etching. These results demonstrate that Ag nanoparticles have been successfully incorporated into Ta4C3 nanosheets.
As shown in Figure 3a, the Ta4AlC3 MAX phase exhibits a layered particle morphology prior to etching. The TEM image of the sample prepared from Figure 3b indicates that the material exhibits a distinct layered structure. As shown in Figure 3c, AFM measurements reveal that the thickness of the few-layer nanosheets is approximately 4.56 nm. These results of characterization collectively demonstrate that Ta4C3 nanosheets have been successfully synthesized. The results of the SEM and EDS analysis for the prepared samples are presented in Figure 3d. With elements Ta, Ag, and C of the prepared samples being shown, AgNPs can be observed to be distributed on nanosheets. Figure 3e presents the TEM micrograph of the Ta4C3@AgNP nanocomposite material. As observed, the Ag nanoparticles exhibit an average particle size of approximately 40 nm and are uniformly distributed across the MXene substrate with no signs of agglomeration. Figure 3f shows the elemental mapping of Ta4C3@AgNP nanocomposites. The element mapping images of Ag, Ta, C, and their superpositions describe the distribution of Ag, Ta, and C. The presence of Ag and Ta further indicates that Ag is adsorbed on the surface of the MXene. This indicates that we have successfully synthesized high-quality Ta4C3@AgNP nanocomposite material.

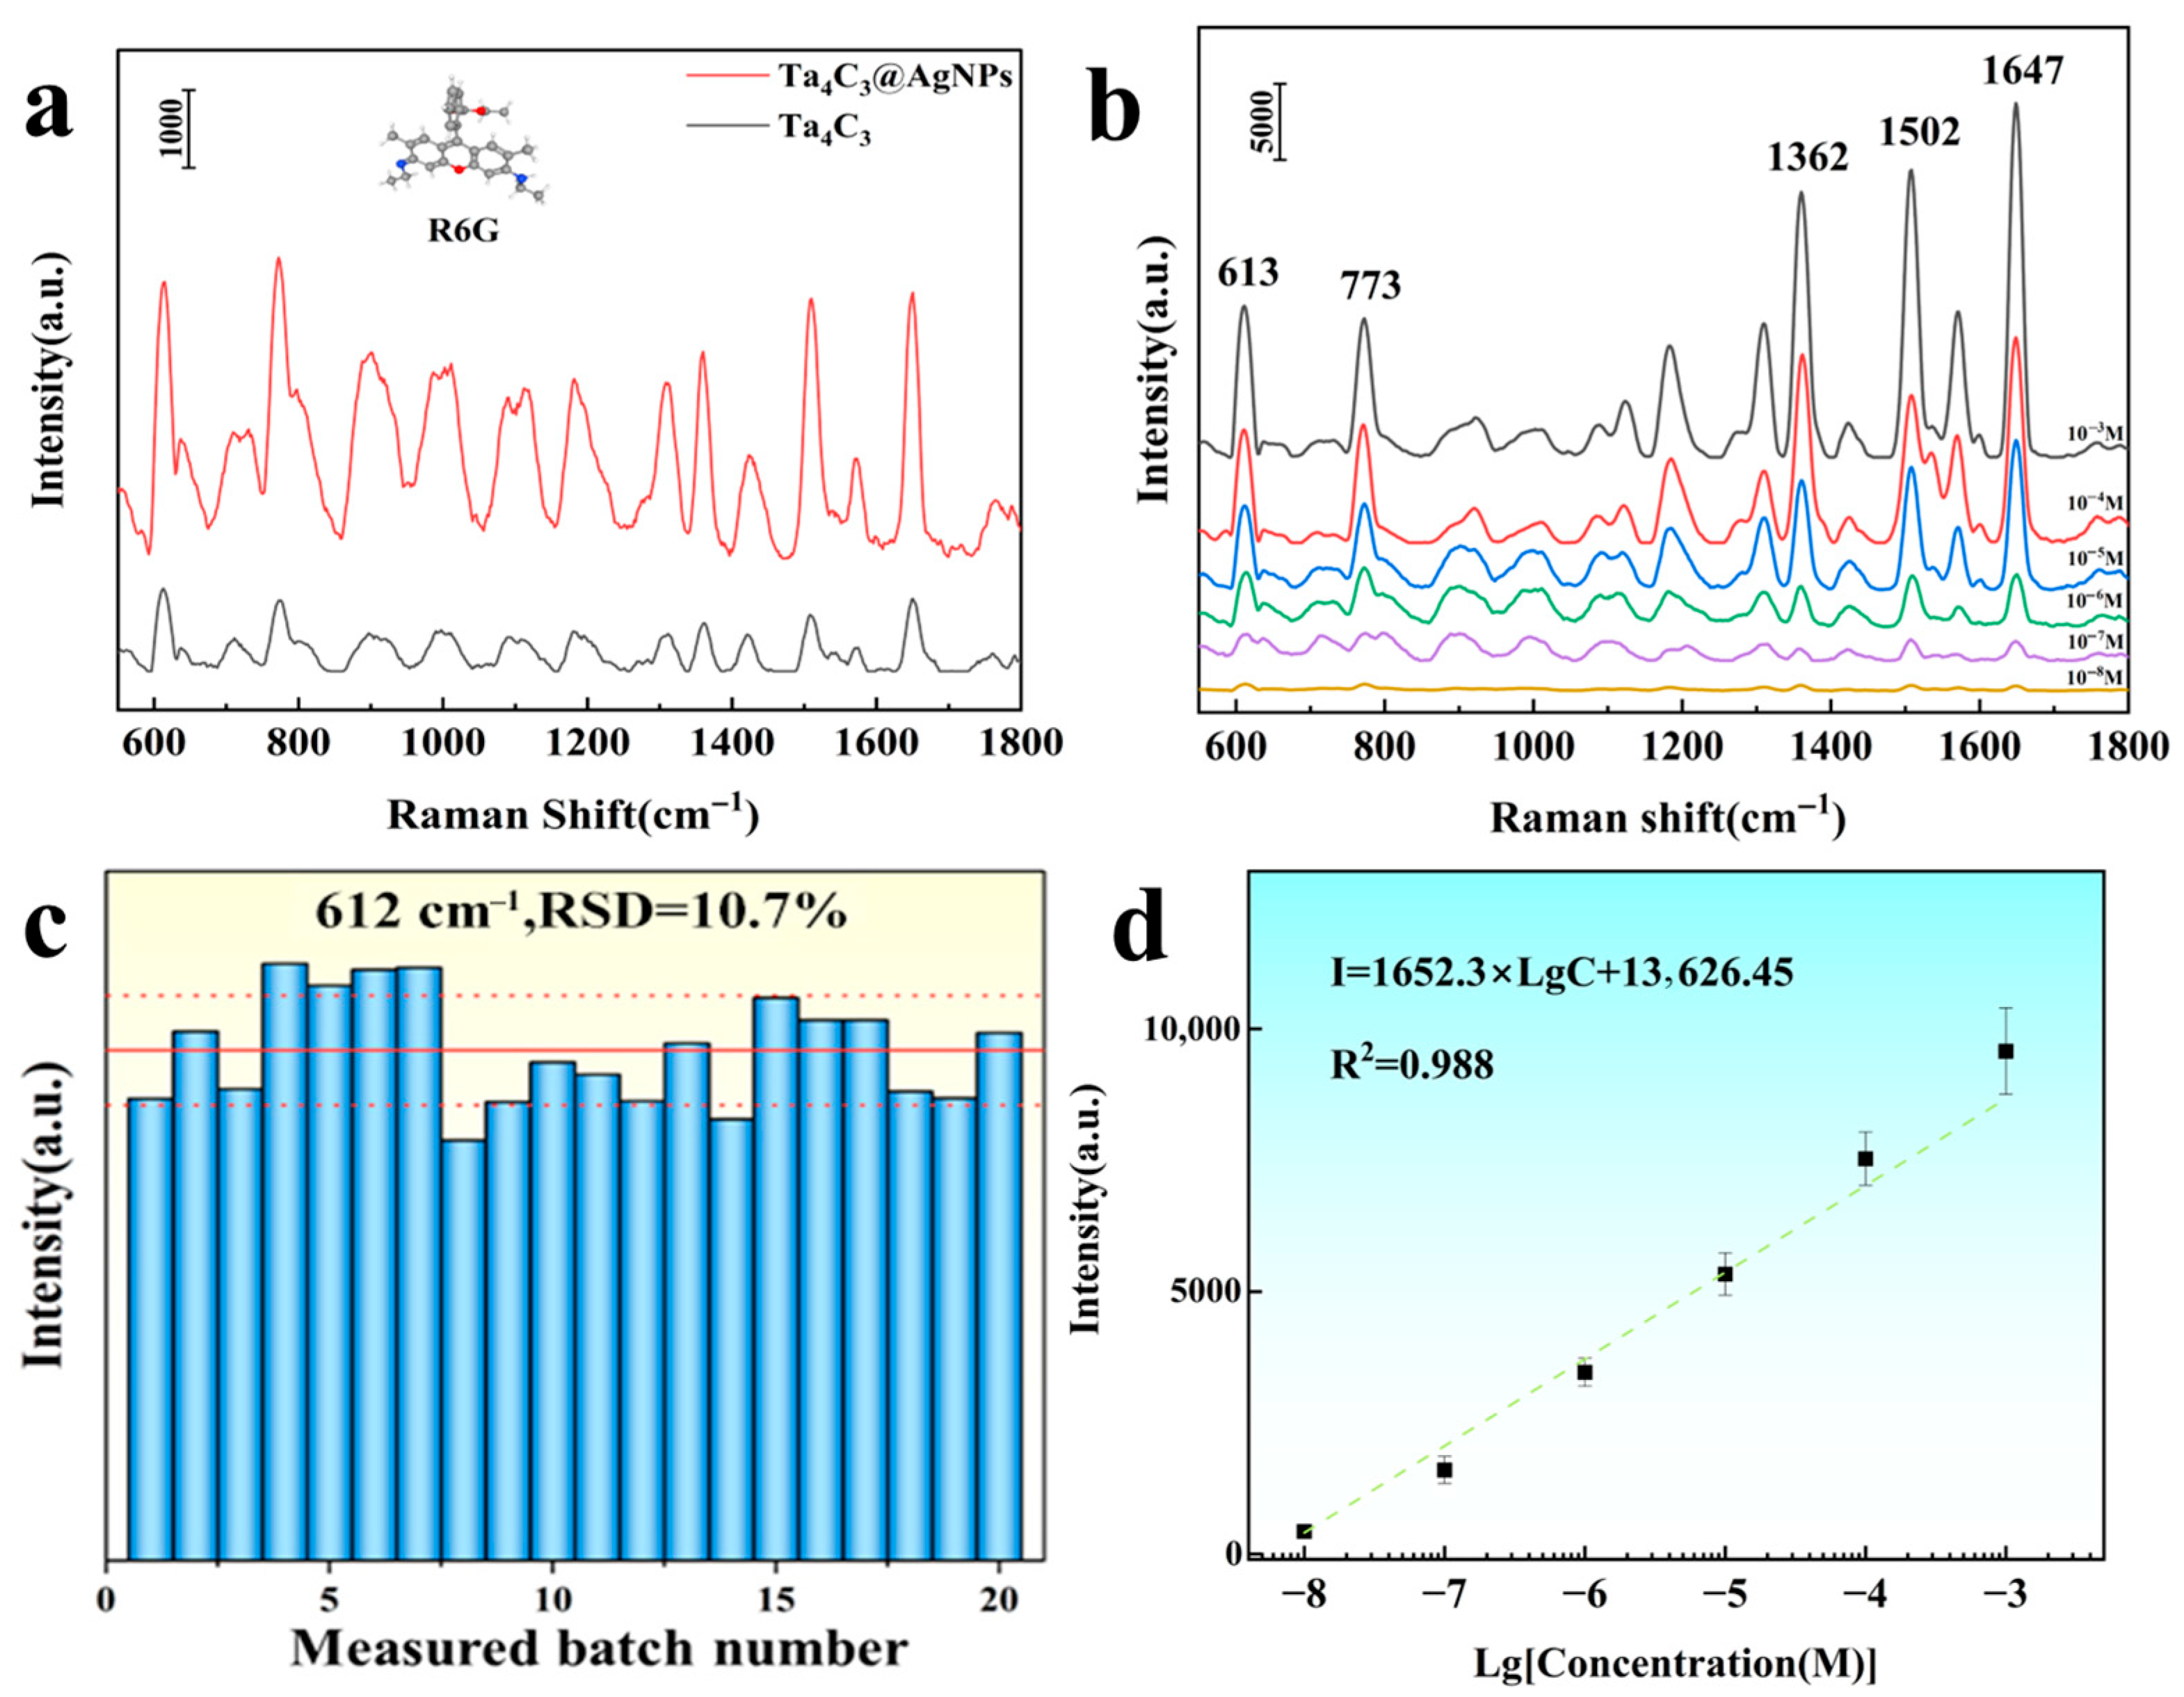
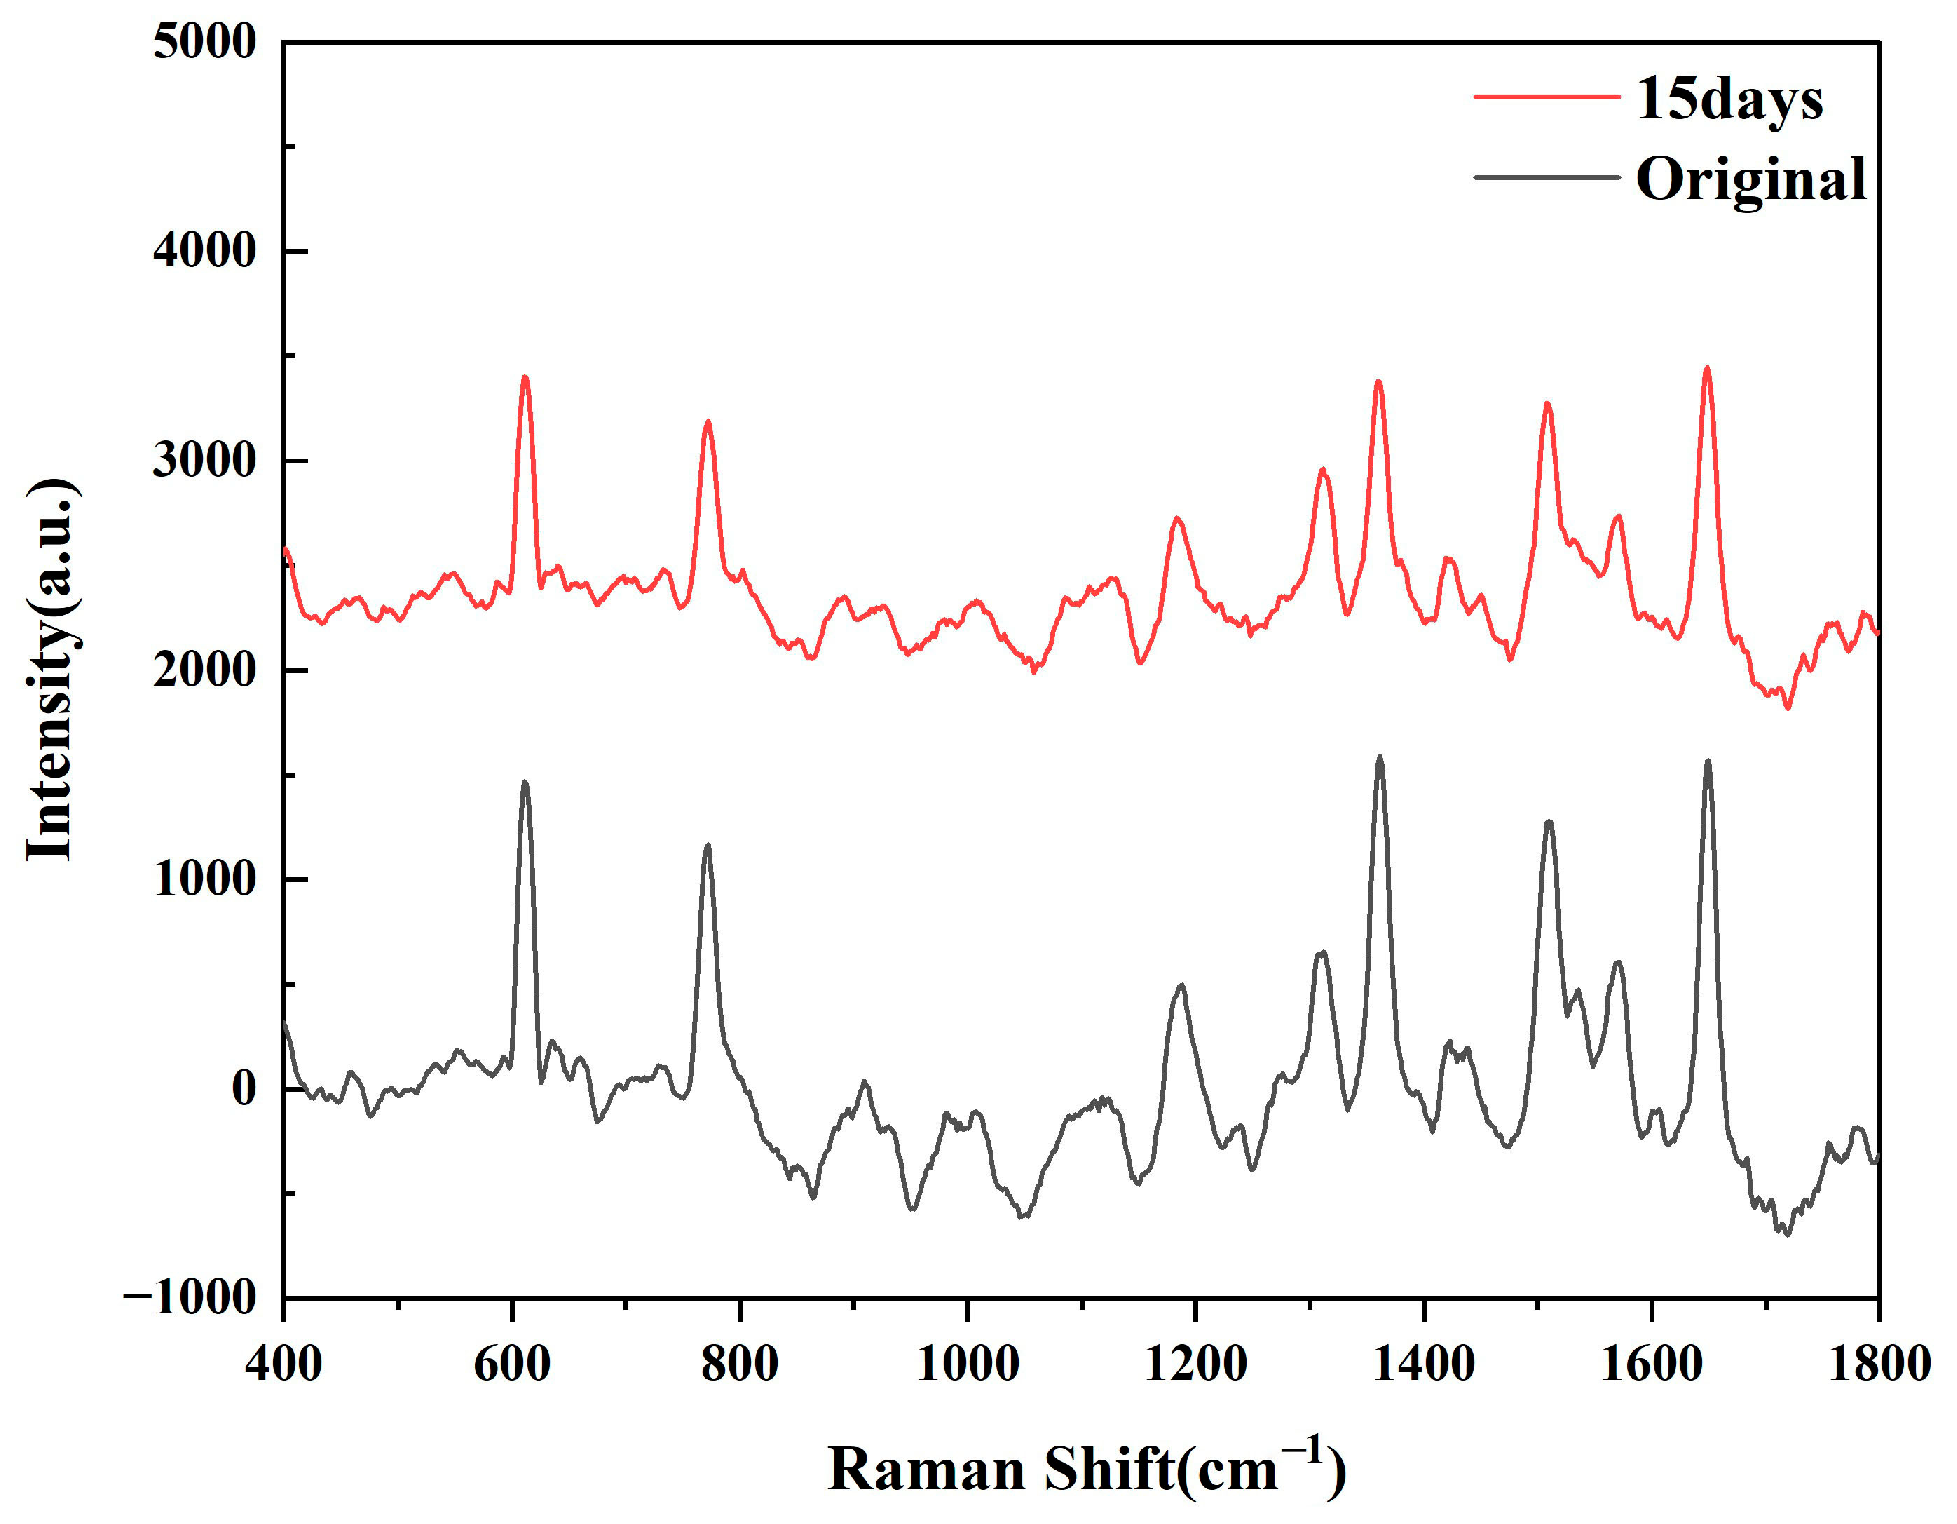
3.2. SERS Performance of Ta4C3@AgNP Nanocomposites

The commonly used organic dye molecule Rhodamine 6G (R6G) was selected as a probe molecule to investigate the SERS performance of the Ta4C3 MXene and Ta4C3@AgNP nanocomposite material. As shown in Figure 4a. The detection of R6G molecules indicated that the detection effect of Ta4C3@AgNPs was significantly better than that of bare Ta4C3. This enhancement is primarily attributed to the LSPR of AgNPs, which induces a strong EM field. Each Ag nanoparticle generates an intense local field on its surface, particularly at the edges, thereby amplifying the Raman scattering of nearby molecules. Notably, even sparsely distributed AgNPs can produce substantial SERS signals when incorporated into MXene-based hybrids. For instance, Yang et al. [25] reported that even a few AgNPs on Ti3C2TX can form “nanoscale gaps” with probe molecules, leading to excellent SERS performance. As long as the analyte resides near the AgNPs or at the AgNP/MXene interface, its Raman signal is markedly enhanced.
As shown in Figure 4b, SERS tests were carried out on the modified samples using a 532 nm laser. The characteristic Raman peaks of R6G at 612 cm−1, 773 cm−1, 1360 cm−1, and 1650 cm−1 are clearly observable. The peaks at 612 cm−1 and 773 cm−1 are attributed to the in-plane C−C−C bending vibrations and out-of-plane C−H bending vibrations within the xylose acid backbone, respectively. In contrast, the peaks at 1360 cm−1 and 1650 cm−1 correspond to the C−C stretching vibrations of the aromatic ring [26,27]. As the concentration of R6G decreases, the intensity of the characteristic Raman peaks also decreases, with a detection limit reaching as low as 1 × 10⁻⁸ M. The Raman enhancement factor (EF) serves as a crucial indicator for assessing the enhancement effect of substrates, and its calculation formula is given by [15]
E F = I S E R S I R a m a n × N R a m a n N S E R S
The intensity of the characteristic Raman peak at 612 cm−1 was selected to calculate the enhancement factor. The calculated Raman enhancement factor for the Ta4C3@AgNP nanocomposite material is found to be 1.53 × 10⁶. The working curve depicted in Figure 4b illustrates the relationship between Raman intensity (I) and R6G concentration (c) on a logarithmic scale. As shown in Figure 4d, a strong linear correlation is observed within the concentration range of 1 × 10⁻³ to 1 × 10⁻⁸ M, with a correlation coefficient (R2) of 0.988. The fitting equation is expressed as Lg I = 1652.3 Lg C + 13,626.45. The aforementioned results indicate that the Ta4C3@AgNP nanocomposite material exhibits excellent SERS activity, suggesting its potential for quantitative analysis. The consistency of the SERS signals from the samples was tested by randomly selecting 20 points to record the results, as shown in Figure 4c. The relative standard deviation (RSD) calculated for the characteristic Raman peak at 612 cm−1 was found to be 10.7%. These findings demonstrate that the Ta4C3@AgNP nanocomposite material exhibits excellent consistency in the SERS signal response. For the substrates prepared in three independent batches, when detecting the same concentration of R6G, the relative standard deviation of the main Raman peak remained below 12%, indicating good consistency between batches and reliable repeatability. The aforementioned results indicate that Ta4C3@AgNP nanocomposite material is an excellent substrate material for SERS, suggesting its potential for quantitative analysis.
As shown in Figure 5, after testing the SERS spectra generated by R6G at different times, we can see that the intensity of the characteristic peaks of R6G has decreased, but there is no sharp fluctuation. Based on the original spectral data, the calculation results show that the sensor still retains approximately 70.6% of the original Raman intensity after 15 days, which proves that the substrate has time stability.
A theoretical and experimental investigation of the Raman enhancement mechanism for the Ta4C3 MXene has been carried out. The ultraviolet–visible absorption spectrum of Ta4C3 MXene is shown in Figure 6a. It can be observed that the MXene exhibits no absorption bands within the visible-light range, indicating a lack of potential for electromagnetic field enhancement. Furthermore, at approximately 527 nm, photoluminescence (PL) quenching of R6G is observed after its adsorption onto the Ta4C3 MXene, suggesting the occurrence of strong interfacial charge transfer (CT) between them [14]. Therefore, the Raman enhancement mechanism of the Ta4C3 MXene is primarily attributed to CM [15]. As illustrated in Figure 6c,d, the electronic band structure, density of states (DOS), and work function of Ta4C3 were obtained through calculations of density functional theory (DFT). The electronic bands of Ta4C3 intersect multiple Fermi levels, demonstrating its metallic properties.
According to the Golden Fermi rule, the probability of electronic transition ω I K is given by [14]
ω I K = 2 π g E K H k I 2
The symbol g E K represents the number of available final states within a unit energy range. The magnitude of the density of states influences the transition probability, while the perturbation Hamiltonian H k I denotes the matrix elements between the initial and final states. As shown in Figure 6d, the DOS value of Ta4C3 at the Fermi level is 4.438 states/eV. The relatively high DOS value facilitates an increase in the probability of electronic transitions, thereby enhancing the SERS performance of MXene substrates. The calculated work function is 4.309 eV. The Fermi level of Ta4C3 is located at −4.309 eV relative to the vacuum level. For the R6G molecule, the energy levels of the highest occupied molecular orbital (HOMO) and the lowest unoccupied molecular orbital (LUMO) are −5.70 eV and −3.40 eV. The polarization tensor α provides a framework for understanding the mechanisms of molecular interactions with their environment. Specifically, the polarization tensor can be expressed as [12] α = A + B + C ; A primarily reflects the inherent Raman activity of the molecule, while B and C illustrate the additional enhancement effects on Raman scattering due to CT processes induced by light between the substrate and the molecule, as well as from the molecule back to the substrate. The energy level schematic of the Ta4C3-R6G system is illustrated in Figure 6b. The Fermi energy level of the substrate matches with the energy states of the LUMO and HOMO energy levels of the molecule, thereby allowing electrons to transfer between them. Under the illumination of a laser with a wavelength of 532 nm (2.33 eV), both the CT process from the HOMO of R6G to the Fermi level of Ta4C3 and the CT process from the Fermi level of Ta4C3 to the LUMO of R6G contribute significantly to Raman enhancement. Furthermore, the excitation wavelength energy is very close to the electronic transition energy of R6G. According to the Herzberg–Teller theory [28], this proximity will further amplify the polarization tensor of the molecule, thus enhancing the Raman signal from R6G molecules. The aforementioned results indicate that the SERS signal from molecules adsorbed on MXene originates from the interface PICT mechanism between MXene and the target molecules.
When the analyte is in contact with both AgNPs and the MXene, it benefits from the synergistic effects of both EM and CT mechanisms. Wang et al. [29] explicitly attributed the improved sensitivity of AuNSs@Ta4C3TX composites to the enhanced electromagnetic properties of the hybrid substrate. Similarly, Satheeshkumar et al. [30] reported an exceptionally high enhancement factor for MXene–Ag substrates due to the plasmonic synergy between Ag and an MXene. Consistent with these findings, our results demonstrate that the AgNP-functionalized MXene yields significantly stronger SERS signals compared to the pristine MXene, even under low Ag coverage, confirming the presence of a cooperative EM + CT mechanism [31,32,33]. This dual enhancement strategy accounts for the pronounced SERS performance observed in our system.
The theoretical basis for the test results can be summarized as a synergistic effect between electromagnetic field enhancement and charge transfer enhancement: (1) uniformly distributed AgNPs on the surface of the MXene provide a stable localized electric field enhancement, while the conductive properties of the MXene further enhance the localized field effect of metal particles; (2) the enhanced field effect and increased specific surface area facilitate molecular adsorption and charge transfer processes. Together, these factors contribute to the amplification of SERS signals.

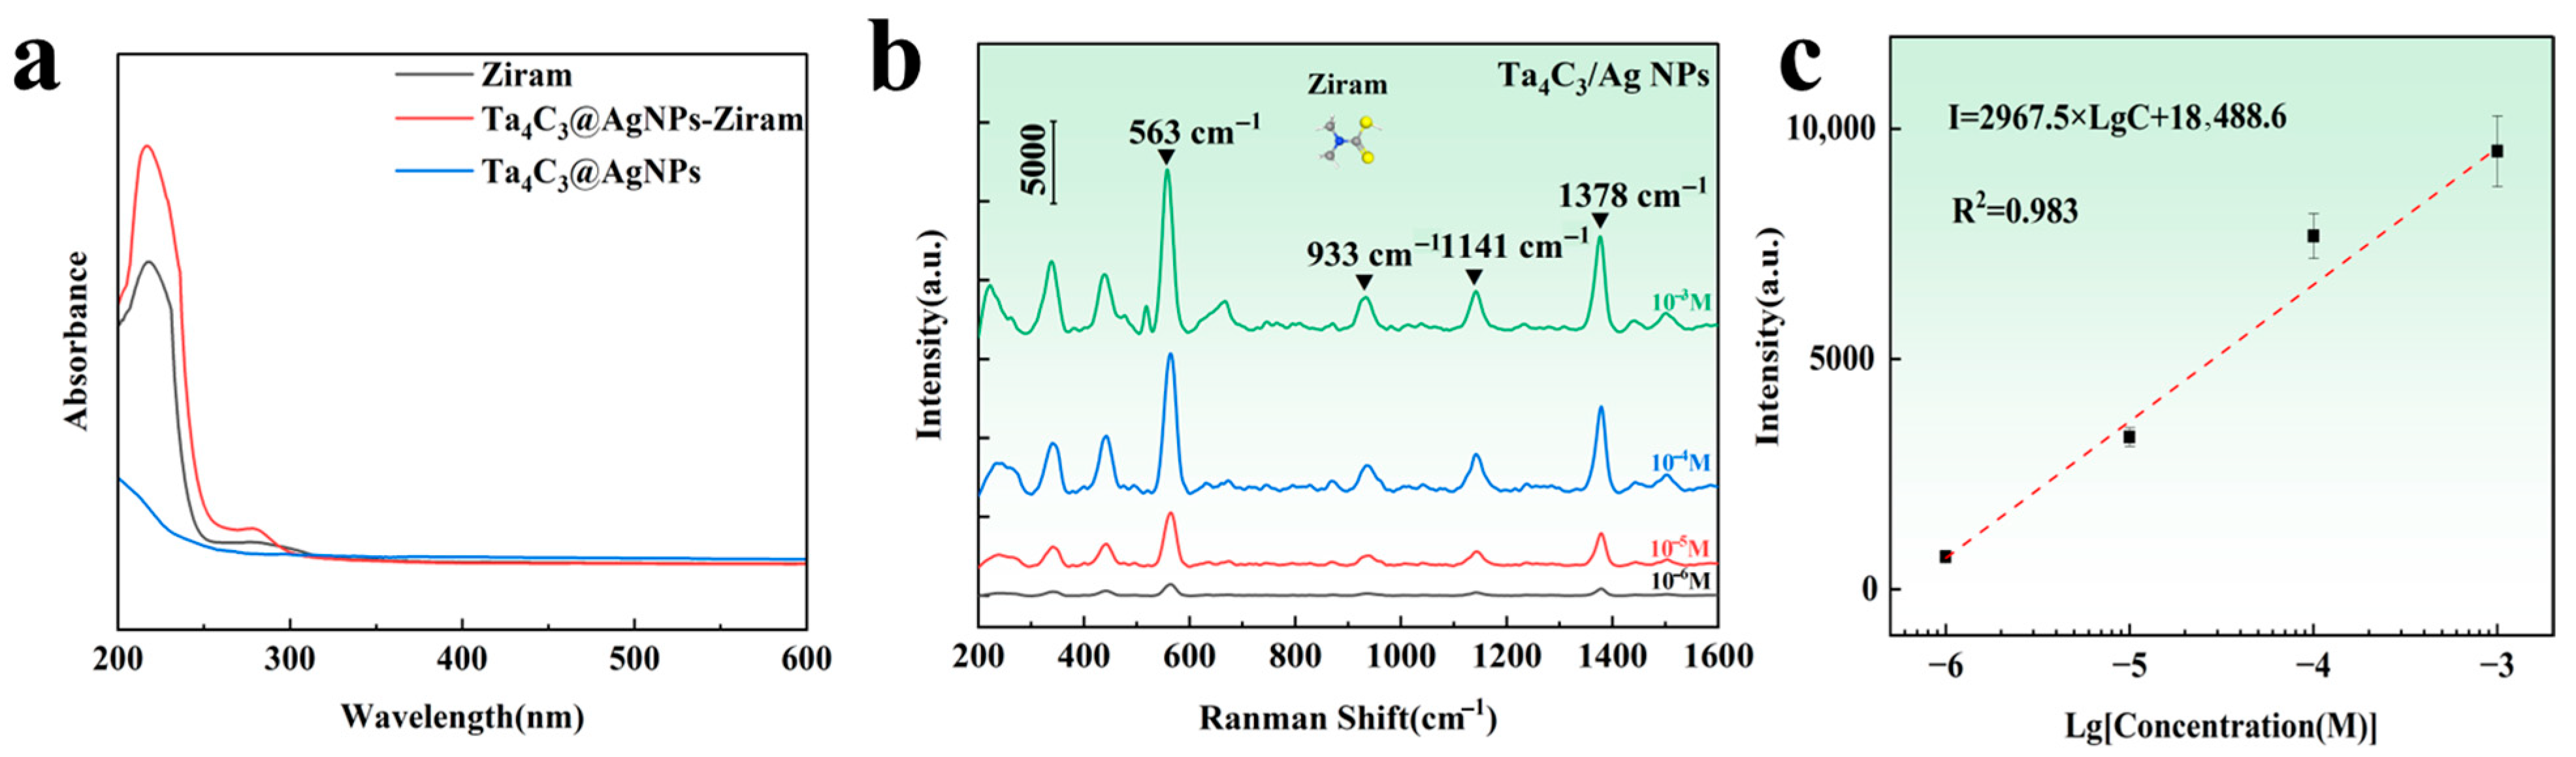
3.3. Detection of Ziram Using Ta4C3@AgNP Nanocomposite Sensor

The commonly used pesticide Ziram was selected as the target analyte for practical detection. As shown in Figure 7a, the UV-vis absorption spectra of Ziram, Ta4C3@AgNPs, and Ta4C3@AgNPs–Ziram exhibit enhanced absorption in the range of 200–300 nm. This enhancement indicates the superposition of characteristic peaks of Ziram, confirming its successful modification onto the surface of the composite material. In the range of 200–256 nm, the absorption peak broadens, indicating that the interaction between the composite material and Ziram may be attributed to chemical adsorption. This result also confirms that the substrate material may exhibit chemical enhancement of the SERS signals for target molecules. The Raman spectrum of the target molecule is illustrated in Figure 7b. It can be observed that the intensity of the Raman peaks decreases with a reduction in Ziram concentration. Characteristic peaks appear near the Raman shifts at 430, 563, 933, 1141, and 1378 cm−1. The main Raman peaks of Ziram and the distribution of vibration modes are shown in Table 1. The peak at 430 cm−1 corresponds to the stretching vibration mode of the C=S bond, which is a characteristic signal of dithiocarbamate pesticides such as Ziram. The peak at 563 cm−1 is attributed to the vibration mode of the S=S, indicating the presence of typical disulfide structures in the molecule. The peak at 933 cm−1 corresponds to a coupling mode between C=S stretching vibrations [34]. The 1141 cm−1 peak originates from the stretching vibration of the C–N bond and the rocking mode of CH3 groups, which are important structural features of carbamate-type molecules. The peak at 1378 cm−1 is associated with the stretching vibration of the C–N bond combined with the vibrational contribution from methyl groups, further confirming the presence of nitrogen-containing organic compounds [35].
Furthermore, it is noted that the intensity of these Raman spectral peaks exhibits a linear relationship with the logarithm of the Ziram concentration. As shown in Figure 7c, the linear range extends from 10−3 M to 10−6 M, with a detection limit that is lower than the national standard [36]. The intensity of the characteristic Raman peak at 563 cm−1 was selected to calculate the enhancement factor. The calculated Raman enhancement factor for the Ta4C3@AgNP nanocomposite material is found to be 1.35 × 10⁴. The linear equation is expressed as I = 2967.5 Lg C + 18,488.6, and the correlation coefficient R2 is 0.983. This indicates that a good logarithmic linear relationship has been achieved between SERS intensity and concentration, facilitating both qualitative and quantitative detection of the target substance.
The Ta4C3@AgNPs MXene nanocomposite material, as a novel detection platform, has broad application prospects in fields such as food safety, environmental monitoring, and water quality assessment. In the future, we will further optimize the structure or surface chemistry of the Ta4C3@AgNPs MXene nanocomposite to improve its SERS performance.

4. Conclusions

In summary, a Ta4C3@AgNP nanocomposite was successfully fabricated via self-assembly, and molecular detection studies demonstrated its excellent sensitivity and reproducibility. Using first-principles calculations, we demonstrated that Ta4C3 exhibits excellent electrical conductivity, which enhances charge transfer and further enhances the Raman signal of the Ta4C3@AgNP nanocomposite. Through practical detection of the pesticide Ziram, the Ta4C3@AgNP nanocomposite sensor demonstrated excellent sensitivity, achieving an enhancement factor of 1.35 × 10⁴ and exhibiting strong detection capability. The implementation of trace detection for agricultural residues has significant potential to address the food safety issues associated with pesticide residues.

Author Contributions

Methodology, P.L.; validation, K.H.; investigation, K.H.; resources, L.L.; data curation, K.H.; writing—original draft preparation, K.H.; writing—review and editing, P.L.; supervision, L.L. and P.L. All authors have read and agreed to the published version of the manuscript.

Funding

This research was funded by the General Scientific Research Projects of Zhejiang Provincial Education Department (No. Y202044663).

Data Availability Statement

Data are contained within the article.

Conflicts of Interest

The authors declare no conflict of interest.

References

  1. Biswas, S.; Alegaonkar, P.S. MXene: Evolutions in Chemical Synthesis and Recent Advances in Applications. Surfaces 2022, 5, 1–34. [Google Scholar] [CrossRef]
  2. Ampong, D.N.; Agyekum, E.; Agyemang, F.O.; Mensah-Darkwa, K.; Andrews, A.; Kumar, A.; Gupta, R.K. MXene: Fundamentals to Applications in Electrochemical Energy Storage. Discov. Nano 2023, 18, 3. [Google Scholar] [CrossRef] [PubMed]
  3. Wang, C.; Chen, S.; Song, L. Tuning 2D MXenes by Surface Controlling and Interlayer Engineering: Methods, Properties, and Synchrotron Radiation Characterizations. Adv. Funct. Mater. 2020, 30, 2000869. [Google Scholar] [CrossRef]
  4. Wang, Y.; Wang, Y.; Jian, M.; Jiang, Q.; Li, X. MXene Key Composites: A New Arena for Gas Sensors. Nano-Micro Lett. 2024, 16, 209. [Google Scholar] [CrossRef] [PubMed]
  5. Ronchi, R.M.; Arantes, J.T.; Santos, S.F. Synthesis, Structure, Properties and Applications of MXenes: Current Status and Perspectives. Ceram. Int. 2019, 45, 18167–18188. [Google Scholar] [CrossRef]
  6. Rahman, U.U.; Humayun, M.; Ghani, U.; Usman, M.; Ullah, H.; Khan, A.; El-Metwaly, N.M.; Khan, A. MXenes as Emerging Materials: Synthesis, Properties, and Applications. Molecules 2022, 27, 4909. [Google Scholar] [CrossRef]
  7. Saxena, S.; Johnson, M.; Dixit, F.; Zimmermann, K.; Chaudhuri, S.; Kaka, F.; Kandasubramanian, B. Thinking Green with 2-D and 3-D MXenes: Environment Friendly Synthesis and Industrial Scale Applications and Global Impact. Renew. Sustain. Energy Rev. 2023, 178, 113238. [Google Scholar] [CrossRef]
  8. Luo, W.; Xiong, W.; Han, Y.; Yan, X.; Mai, L. Application of Two-Dimensional Layered Materials in Surface-Enhanced Raman Spectroscopy (SERS). Phys. Chem. Chem. Phys. 2022, 24, 26398–26412. [Google Scholar] [CrossRef]
  9. Liu, Z.-W.; Wang, G.; Li, Y.-F.; Yu, Y. Substrate Types and Applications of MXene for Surface-Enhanced Raman Spectroscopy. Front. Chem. 2024, 12, 1378985. [Google Scholar] [CrossRef]
  10. Sarycheva, A.; Makaryan, T.; Maleski, K.; Satheeshkumar, E.; Melikyan, A.; Minassian, H.; Yoshimura, M.; Gogotsi, Y. Charge-transfer-driven ultrasensitive (MXene) as Surface-Enhanced Raman Scattering Substrate. J. Phys. Chem. C 2017, 121, 19983–19988. [Google Scholar] [CrossRef]
  11. Peng, Y.; Lin, C.; Long, L.; Masaki, T.; Tang, M.; Yang, L.; Liu, J.; Huang, Z.; Li, Z.; Luo, X. Charge-Transfer Resonance and Electromagnetic Enhancement Synergistically Enabling MXenes with Excellent SERS Sensitivity for SARS-CoV-2 S Protein Detection. Nano-Micro Lett. 2021, 13, 52. [Google Scholar] [CrossRef] [PubMed]
  12. Lan, L.; Fan, X.; Yu, S.; Gao, J.; Zhao, C.; Hao, Q.; Qiu, T. Flexible Two-Dimensional Vanadium Carbide MXene-Based Membranes with Ultra-Rapid Molecular Enrichment for Surface-Enhanced Raman Scattering. ACS Appl. Mater. Interfaces 2022, 14, 40427–40436. [Google Scholar] [CrossRef]
  13. Shein, I.R.; Ivanovskii, A.L. Planar nano-block structures Tin+1Al0.5Cn and Tin+1Cn(n = 1, and 2) from MAX phases: Structural, electronic properties and relative stability from first principles calculations. Superlattices Microstruct. 2012, 52, 147–157. [Google Scholar] [CrossRef]
  14. Lan, L.; Zhao, C.; Tang, X.; Gao, J.; Li, G.; Cai, H.; Yang, S.; Liu, J.; Qu, Z.; Fan, X. Charge-Transfer-Driven Ultrasensitive SERS Sensing in a Two-Dimensional Titanium Carbonitride MXene. Opt. Lett. 2024, 49, 2405–2408. [Google Scholar] [CrossRef]
  15. Lan, L.; Ni, Z.; Zhao, C.; Gao, J.; Tang, X.; Qu, Z.; Zheng, L.; Fan, X.; Qiu, T. Photoinduced Charge Transfer Empowers Ta4C3 and Nb4C3 MXenes with High SERS Performance. Langmuir 2024, 40, 20945–20953. [Google Scholar] [CrossRef]
  16. Lee, P.C.; Meisel, D. Adsorption and Surface-Enhanced Raman of Dyes on Silver and Gold Sols. J. Phys. Chem. 1982, 86, 3391–3395. [Google Scholar] [CrossRef]
  17. Syamsai, R.; Grace, A.N. Ta4C3 MXene as Supercapacitor Electrodes. J. Alloys Compd. 2019, 792, 1230–1238. [Google Scholar] [CrossRef]
  18. Naguib, M.; Mashtalir, O.; Carle, J.; Presser, V.; Lu, J.; Hultman, L.; Gogotsi, Y.; Barsoum, M.W. Two-Dimensional Transition Metal Carbides. ACS Nano 2012, 6, 1322–1331. [Google Scholar] [CrossRef]
  19. Chen, Y.; Jiang, C.; Huang, F.; Yu, Z.; Jiang, L. Efficient Interfacial Self-Assembled MXene/Ag NPs Film Nanocarriers for SERS-Traceable Drug Delivery. Anal. Bioanal. Chem. 2023, 415, 5379–5389. [Google Scholar] [CrossRef]
  20. Meng, W.U.; Lei, R.; Zhang, J.F.; Li, Y.X.; Ji, Z.Y.; Ying, G.B. Research Progress in Preparation and Performance of MXene and Its Composite Absorbing Materials. Acta Mater. Compos. Sin 2022, 39, 942–955. [Google Scholar] [CrossRef]
  21. Du, B.; Zhao, Y.; Ren, Z.; Liu, Q.; Zhang, F. 2D Ta4AlC3 and Ta4C3 nanosheets with excellent ultraviolet optical limiting behavior for laser protection. J. Mater. Chem. C 2024, 12, 7748–7758. [Google Scholar] [CrossRef]
  22. Naguib, M.; Mochalin, V.N.; Barsoum, M.W.; Gogoysi, Y. 25th Anniversary Article: MXenes: A New Familyof Two-Dimensional Materials. Adv. Mater. 2014, 26, 992–1005. [Google Scholar] [CrossRef]
  23. Lin, H.; Wang, Y.; Gao, S.; Chen, Y.; Shi, J. Theranostic 2D Tantalum Carbide (MXene). Adv. Mater. 2018, 30, 1703284. [Google Scholar] [CrossRef]
  24. Echols, I.J.; Holta, D.E.; Kotasthane, V.S.; Tan, Z.; Radovic, M.; Lutkenhaus, J.L.; Green, M.J. Oxidative Stability of Nbn+1CnTZ MXenes. J. Phys. Chem. C 2021, 125, 13990–13996. [Google Scholar] [CrossRef]
  25. Yang, Z.; Guo, S.; Park, E.; Sun, Y.; Liu, Y.; Chen, L.; Jung, Y.M. Decoration of Ag nanoparticle on MXene sheets for SERS studies. Spectrochim. Acta Part A Mol. Biomol. Spectrosc. 2024, 316, 124382. [Google Scholar] [CrossRef]
  26. Hildebrandt, P.; Stockburger, M. Surface-Enhanced Resonance Raman Spectroscopy of Rhodamine 6G Adsorbed on Colloidal Silver. J. Phys. Chem. 1984, 88, 5935–5944. [Google Scholar] [CrossRef]
  27. Zhang, C.; Jiang, S.Z.; Huo, Y.Y.; Liu, A.H.; Xu, S.C.; Liu, X.Y.; Sun, Z.C.; Xu, Y.Y.; Li, Z.; Man, B.Y. SERS Detection of R6G Based on a Novel Graphene Oxide/Silver Nanoparticles/Silicon Pyramid Arrays Structure. Opt. Express 2015, 23, 24811–24821. [Google Scholar] [CrossRef]
  28. Lombardi, J.R. The Theory of Surface-Enhanced Raman Scattering on Semiconductor Nanoparticles; toward the Optimization of SERS Sensors. Faraday Discuss. 2017, 205, 105–120. [Google Scholar] [CrossRef]
  29. Wang, T.; Zhu, C.; Dong, P. Preparation and Application of Two-Dimensional Ta4C3 MXene/Gold Nanostar Composite SERS Substrates for Thiram Detection. Langmuir 2024, 40, 22015–22026. [Google Scholar] [CrossRef]
  30. Satheeshkumar, E.; Makaryan, T.; Melikyan, A.; Minassian, H.; Gogotsi, Y.; Yoshimura, M. One-step solution processing of Ag, Au and Pd@MXene hybrids for SERS. Sci. Rep. 2016, 6, 32049. [Google Scholar] [CrossRef]
  31. Liu, G.H.; Wang, H.F.; Xu, C.Y.; Fang, Q.L.; Wang, H.L.; Xu, Y.Q.; Sang, M.; Xuan, S.H.; Hao, L.Y. A MXene@AgAu@PDA nanoplatform loaded with AgAu nanocages for enhancing catalytic activity and antibacterial performance. J. Mater. Chem. B 2023, 11, 10678–10691. [Google Scholar] [CrossRef]
  32. Wang, C.C.; Han, J.S.; Xue, D.N.; Gu, C.J.; Zeng, S.W.; Jiang, J.H.; Jiang, T.; Li, X.; Ku, K.R. SERS-active immunoassay kit for SARS-CoV-2 mediated by the cooperative chemical and electromagnetic effects of MXene modified with gold nanowires. Spectrochim. Acta Part A Mol. Biomol. Spectrosc. 2024, 305, 123445. [Google Scholar] [CrossRef]
  33. Park, J.; Kim, J.; Kim, K.; Kim, J.; You, J.; Kim, D.W. Highly sensitive thin SERS substrate by sandwich nanoarchitecture using multiscale nanomaterials for pesticide detection on curved surface of fruit. J. Hazard. Mater. 2025, 494, 138450. [Google Scholar] [CrossRef]
  34. Fernandes, T.; Fateixa, T.; Ferro, M.; Nogueira, H.I.S.; Daniel, A.L.; Trindade, T. Colloidal dendritic nanostructures of gold and silver for SERS analysis of water pollutants. J. Mol. Liq. 2021, 337, 116608. [Google Scholar] [CrossRef]
  35. Hussain, N.; Li, Y.; Qu, C.; Li, N.; Liu, H. Bimetallic Coreshell Nanorods with Thioglycolic Acid Monolayer for Highly Sensitive and Rapid SERS Detection of Thiabendazole and Ziram Residues in Prunus Persica Peaches. Food Chem. 2025, 464, 141688. [Google Scholar] [CrossRef]
  36. GB2763-2021; National Health Commission of the People’s Republic of China, Ministry of Agriculture and Rural Affairs of the People’s Republic of China, State Administration for Market Regulation: National food Safety Standard-Maximum Residue Limits for Pesticides in Food. China Agriculture Press: Beijing, China, 2021; p. 496.
Figure 1. Schematic diagram of the process of preparation for the Ta4C3@AgNP nanocomposite material.
Biosensors 15 00426 g001
Figure 2. (a) XRD patterns of the Ta4AlC3 MAX phase and Ta4C3 MXene; (b) XPS spectrum of the Ta4C3@AgNP nanocomposite material; (c) Ta 4f XPS spectrum of the Ta4C3@AgNP nanocomposite material; (d) C 1s XPS spectrum of the Ta4C3@AgNP nanocomposite material; (e) O 1s XPS spectrum of the Ta4C3@AgNP nanocomposite material; (f) Ag 3d XPS spectrum of the Ta4C3@AgNP nanocomposite material.
Biosensors 15 00426 g002
Figure 3. (a) SEM image of the Ta4AlC3 MAX phase; (b) TEM image of 2D Ta4C3 MXene; (c) AFM image of 2D Ta4C3 MXene. (d) SEM images of Ta4C3@AgNPs; (e) TEM image of Ta4C3@AgNPs; (f) elemental mapping images of Ta4C3@AgNPs.
Biosensors 15 00426 g003
Figure 4. (a) The Raman spectra of R6G molecules (1 × 10⁻⁶ M) adsorbed on Ta4C3 and Ta4C3@AgNPs; (b) the Raman spectra of R6G adsorbed on Ta4C3@AgNPs at different concentrations ranging from 10−3 to 10−8 M; (c) statistical distribution of peak intensity at 612 cm−1; (d) the relationship between the Raman intensity at a shift of 612 cm−1 and the logarithm of R6G concentration.
Biosensors 15 00426 g004
Figure 5. SERS spectra produced by R6G on Ta4C3@AgNPs 15 days later.
Biosensors 15 00426 g005
Figure 6. (a) UV-vis absorption spectra of R6G, Ta4C3, and the Ta4C3-R6G composite; (b) diagram of the energy level and charge transfer pathways in the Ta4C3-R6G system; (c) electronic band structure of monolayer Ta4C3; (d) work function of the Ta4C3 monolayer.
Biosensors 15 00426 g006
Figure 7. (a) UV-Vis absorption spectra of Ziram, Ta4C3@AgNPs and Ta4C3@AgNPs–Ziram; (b) Raman spectra of different concentrations of Ziram on the Ta4C3@AgNP nanocomposite material; (c) relationship between the logarithm of Raman intensity at a Raman shift of 563 cm−1 and the logarithm of Ziram concentration.
Biosensors 15 00426 g007
Table 1. The main Raman peaks for Ziram and vibration mode assignments.
SERS Spectrum (cm−1)Assignment
430C=S vibration mode
563Vibration mode of S=S
933C=S vibration mode
1141CH3 deformation and CN stretching
1378CN stretching and CH3 rocking
Disclaimer/Publisher’s Note: The statements, opinions and data contained in all publications are solely those of the individual author(s) and contributor(s) and not of MDPI and/or the editor(s). MDPI and/or the editor(s) disclaim responsibility for any injury to people or property resulting from any ideas, methods, instructions or products referred to in the content.

