Photoplethysmography Feature Extraction for Non-Invasive Glucose Estimation by Means of MFCC and Machine Learning Techniques †

 ,
,  , and
, and
Abstract
1. Introduction
2. Materials and Methods
2.1. Database Description
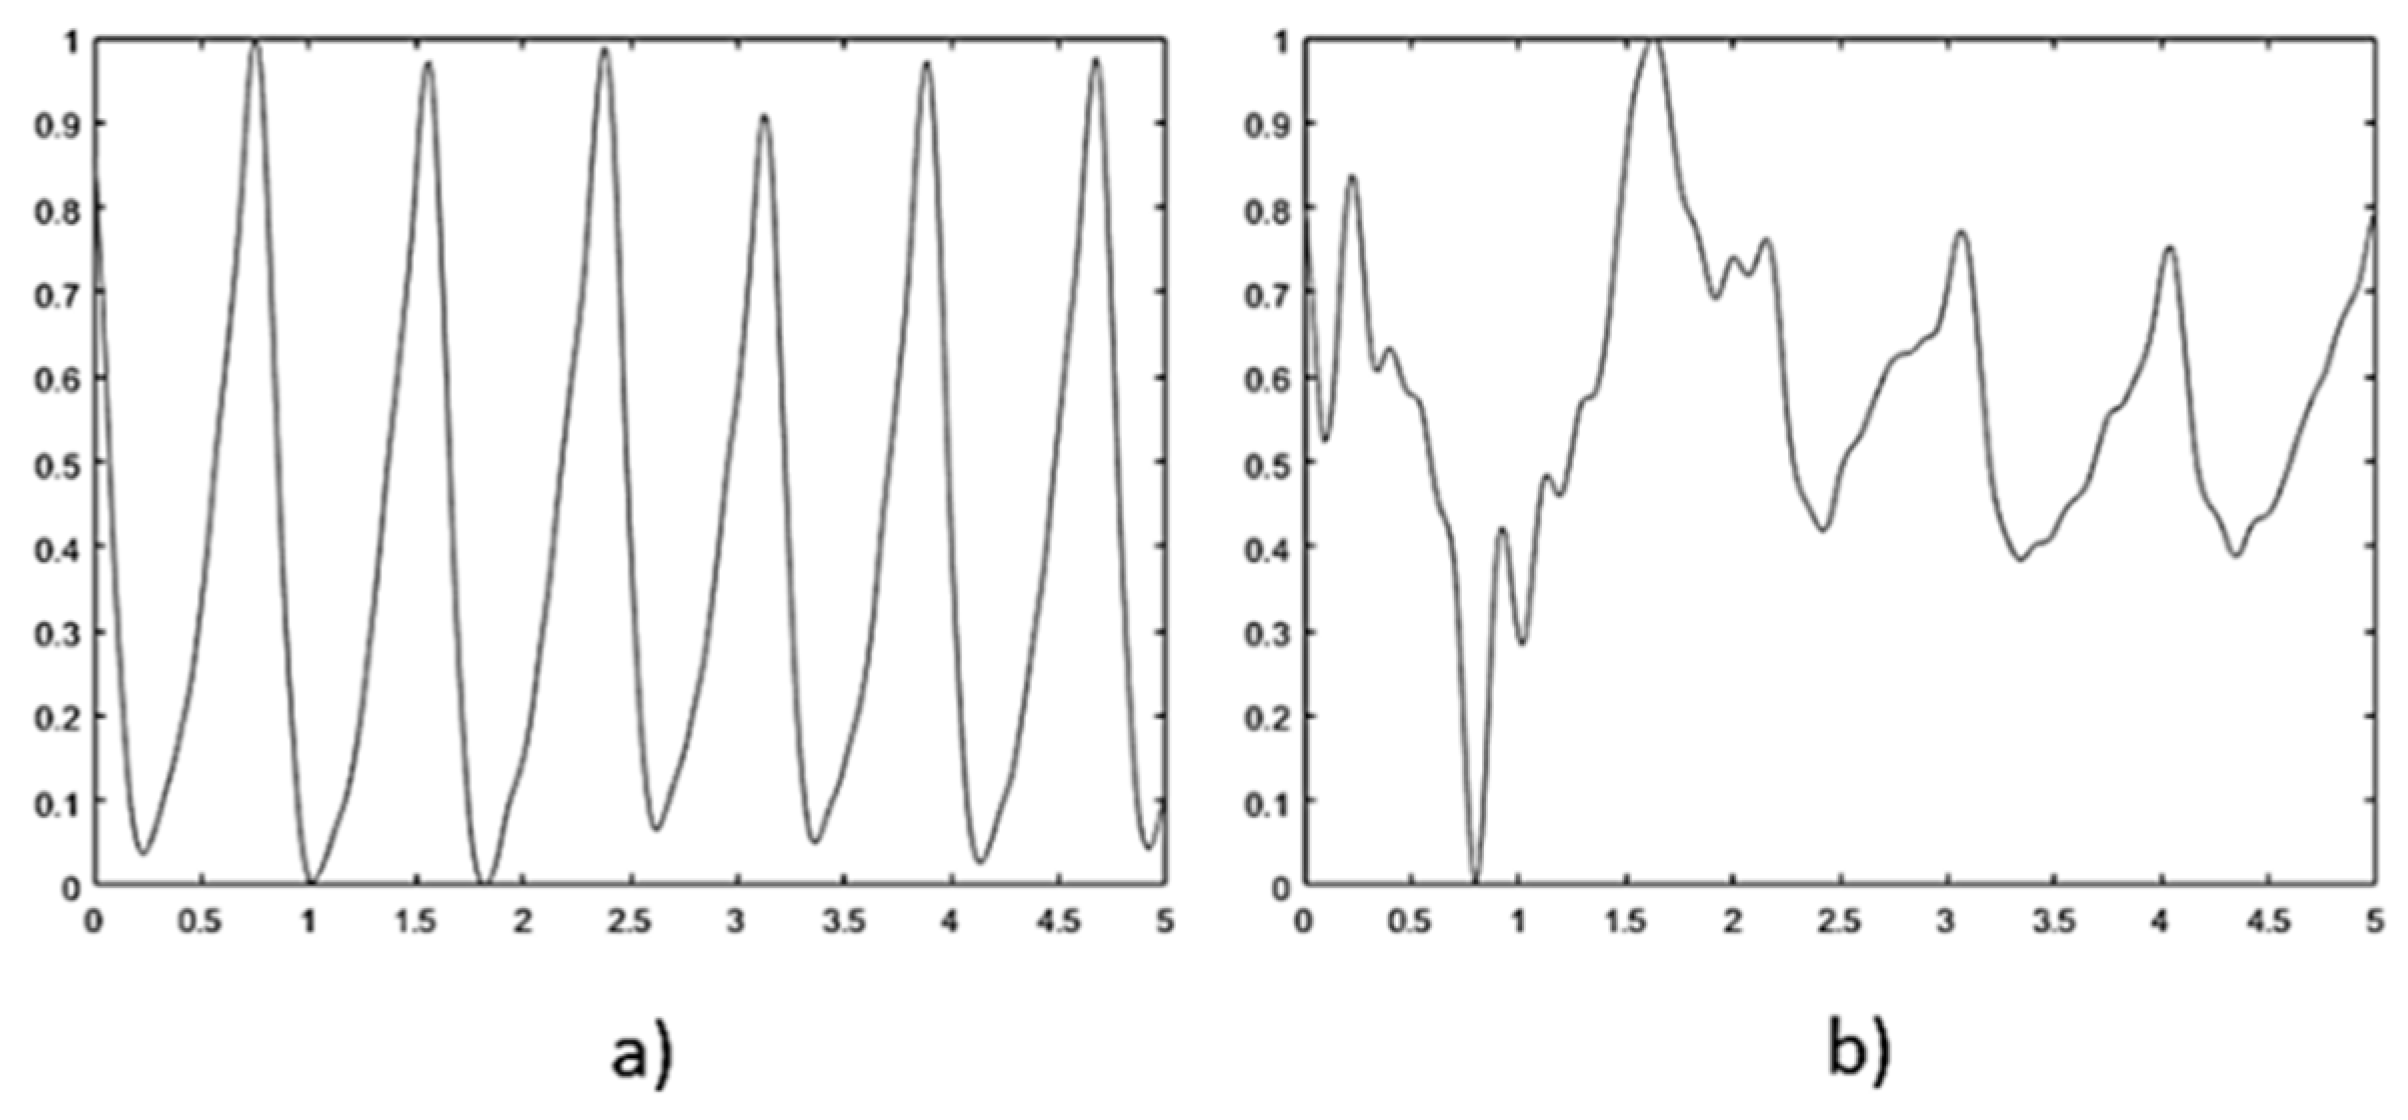
2.2. Signal Processing
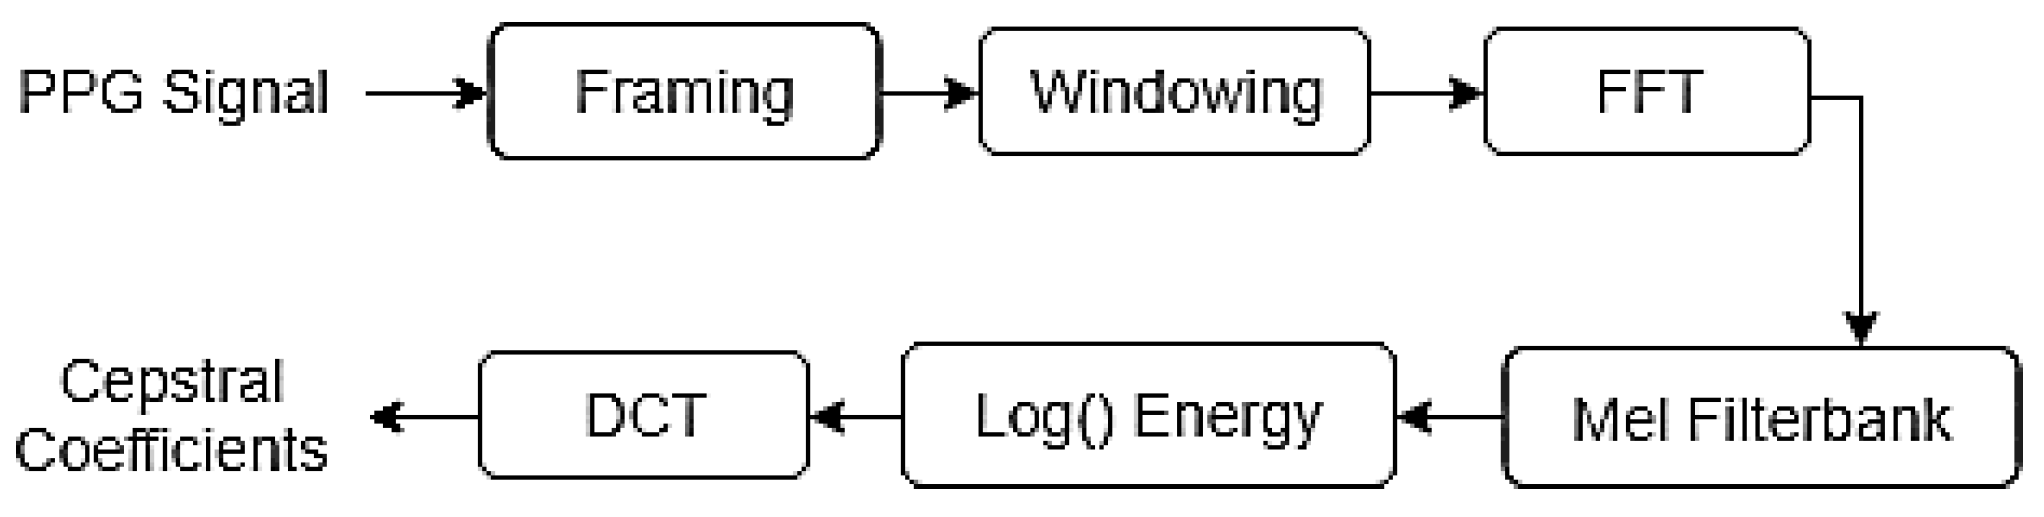
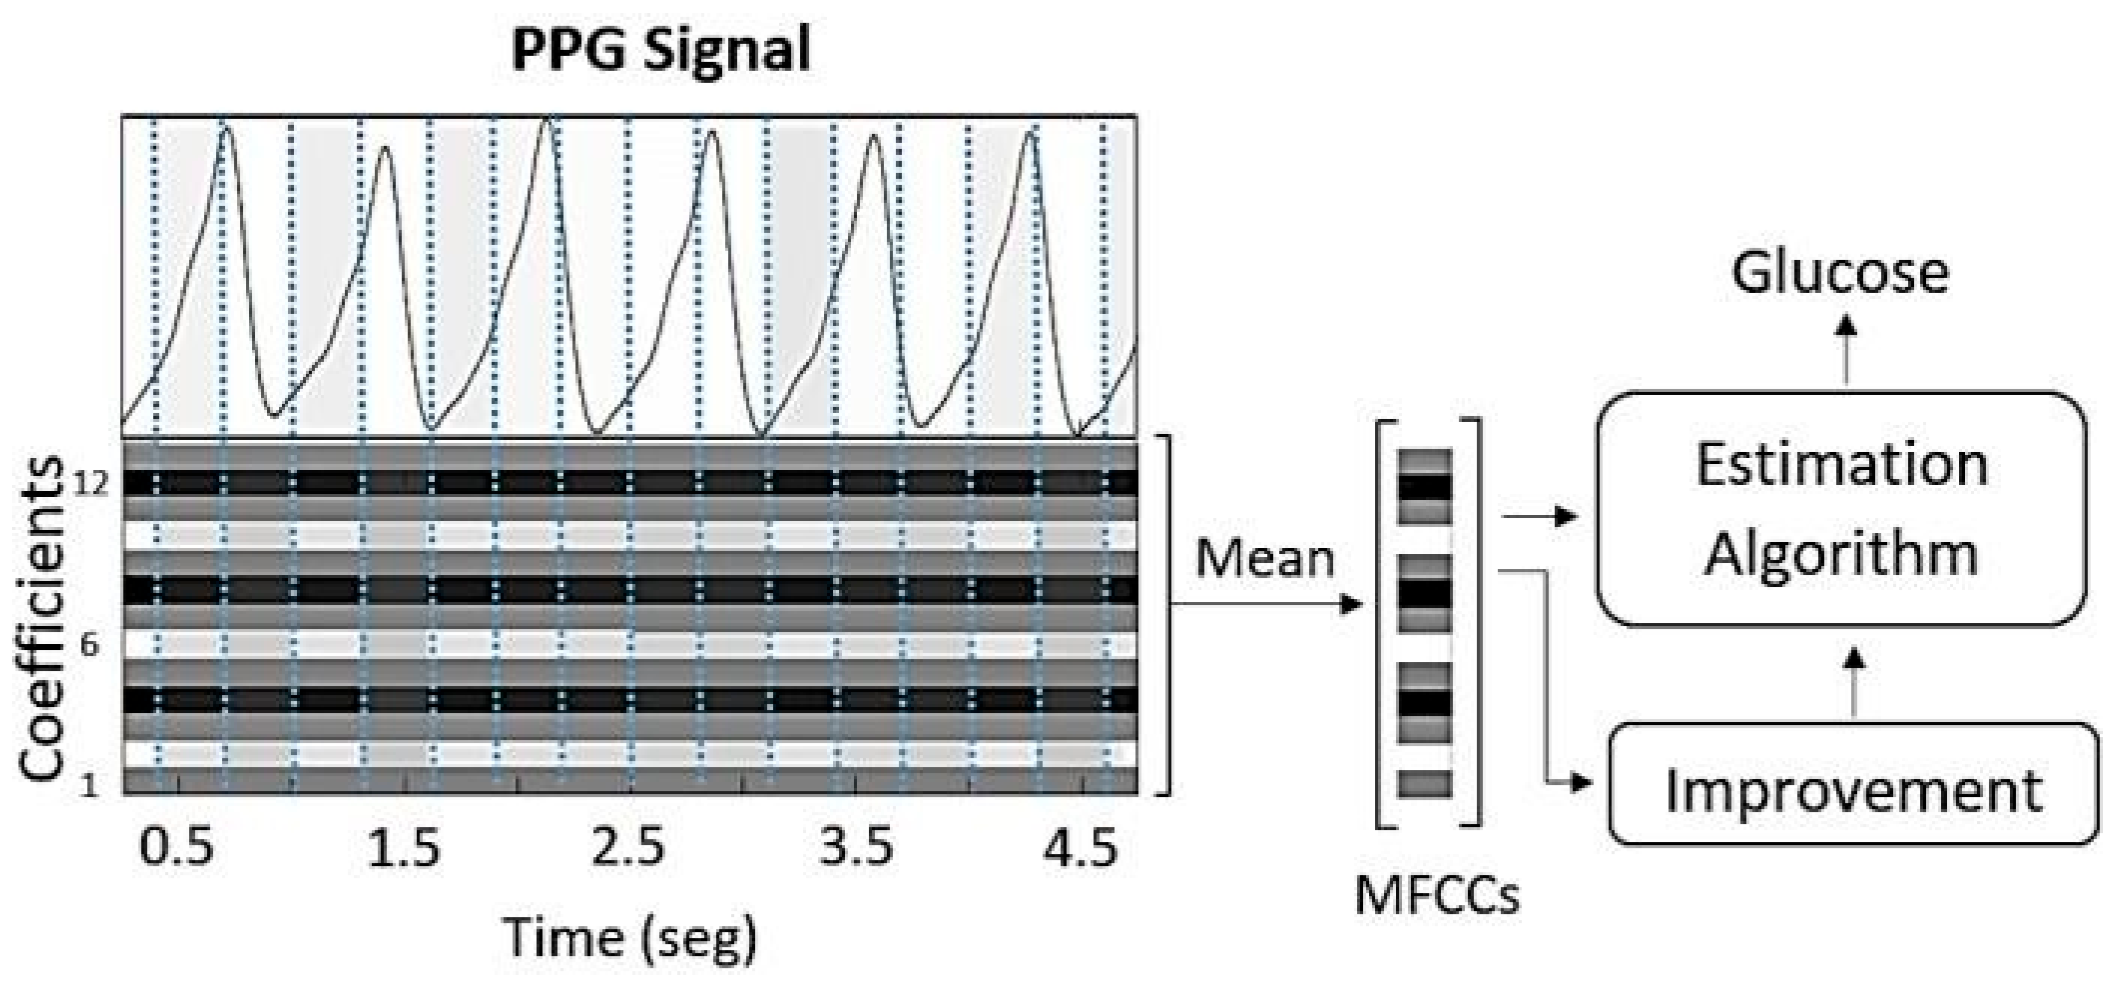
2.3. Feature Extraction
2.3.1. Mel-Frequency Cepstral Coefficients
2.3.2. MFCCs and Multiplayer Perceptron
2.3.3. MFCCs and Linear Discriminant Analysis
2.4. Estimation Algorithms
2.4.1. Multiplayer Perceptron
2.4.2. Support Vector Regression
2.4.3. Regression Tree
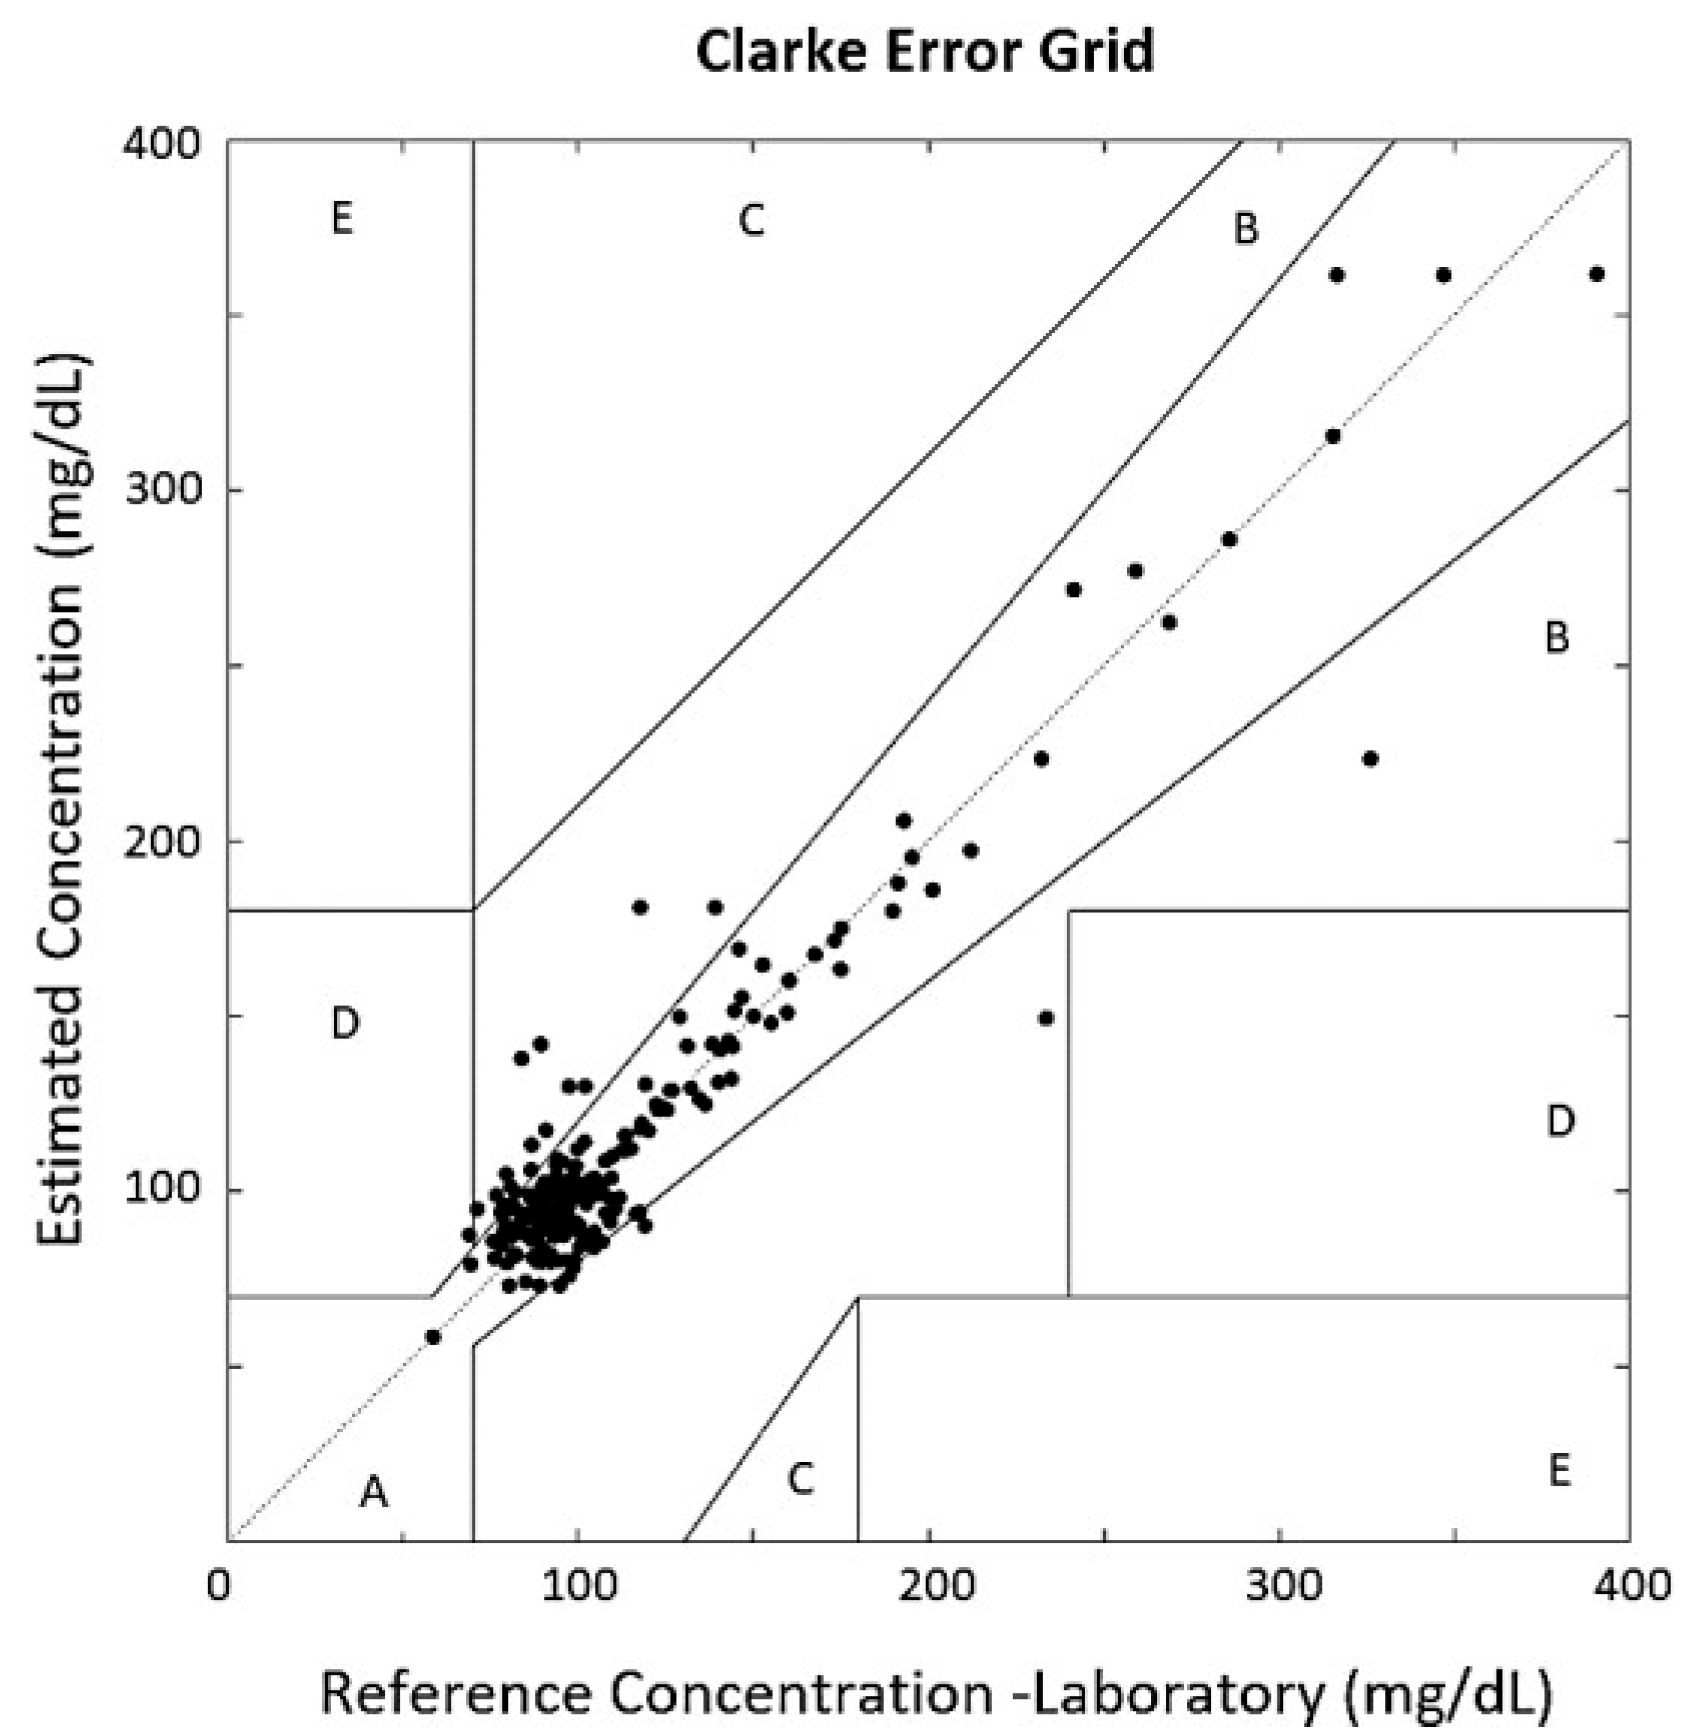
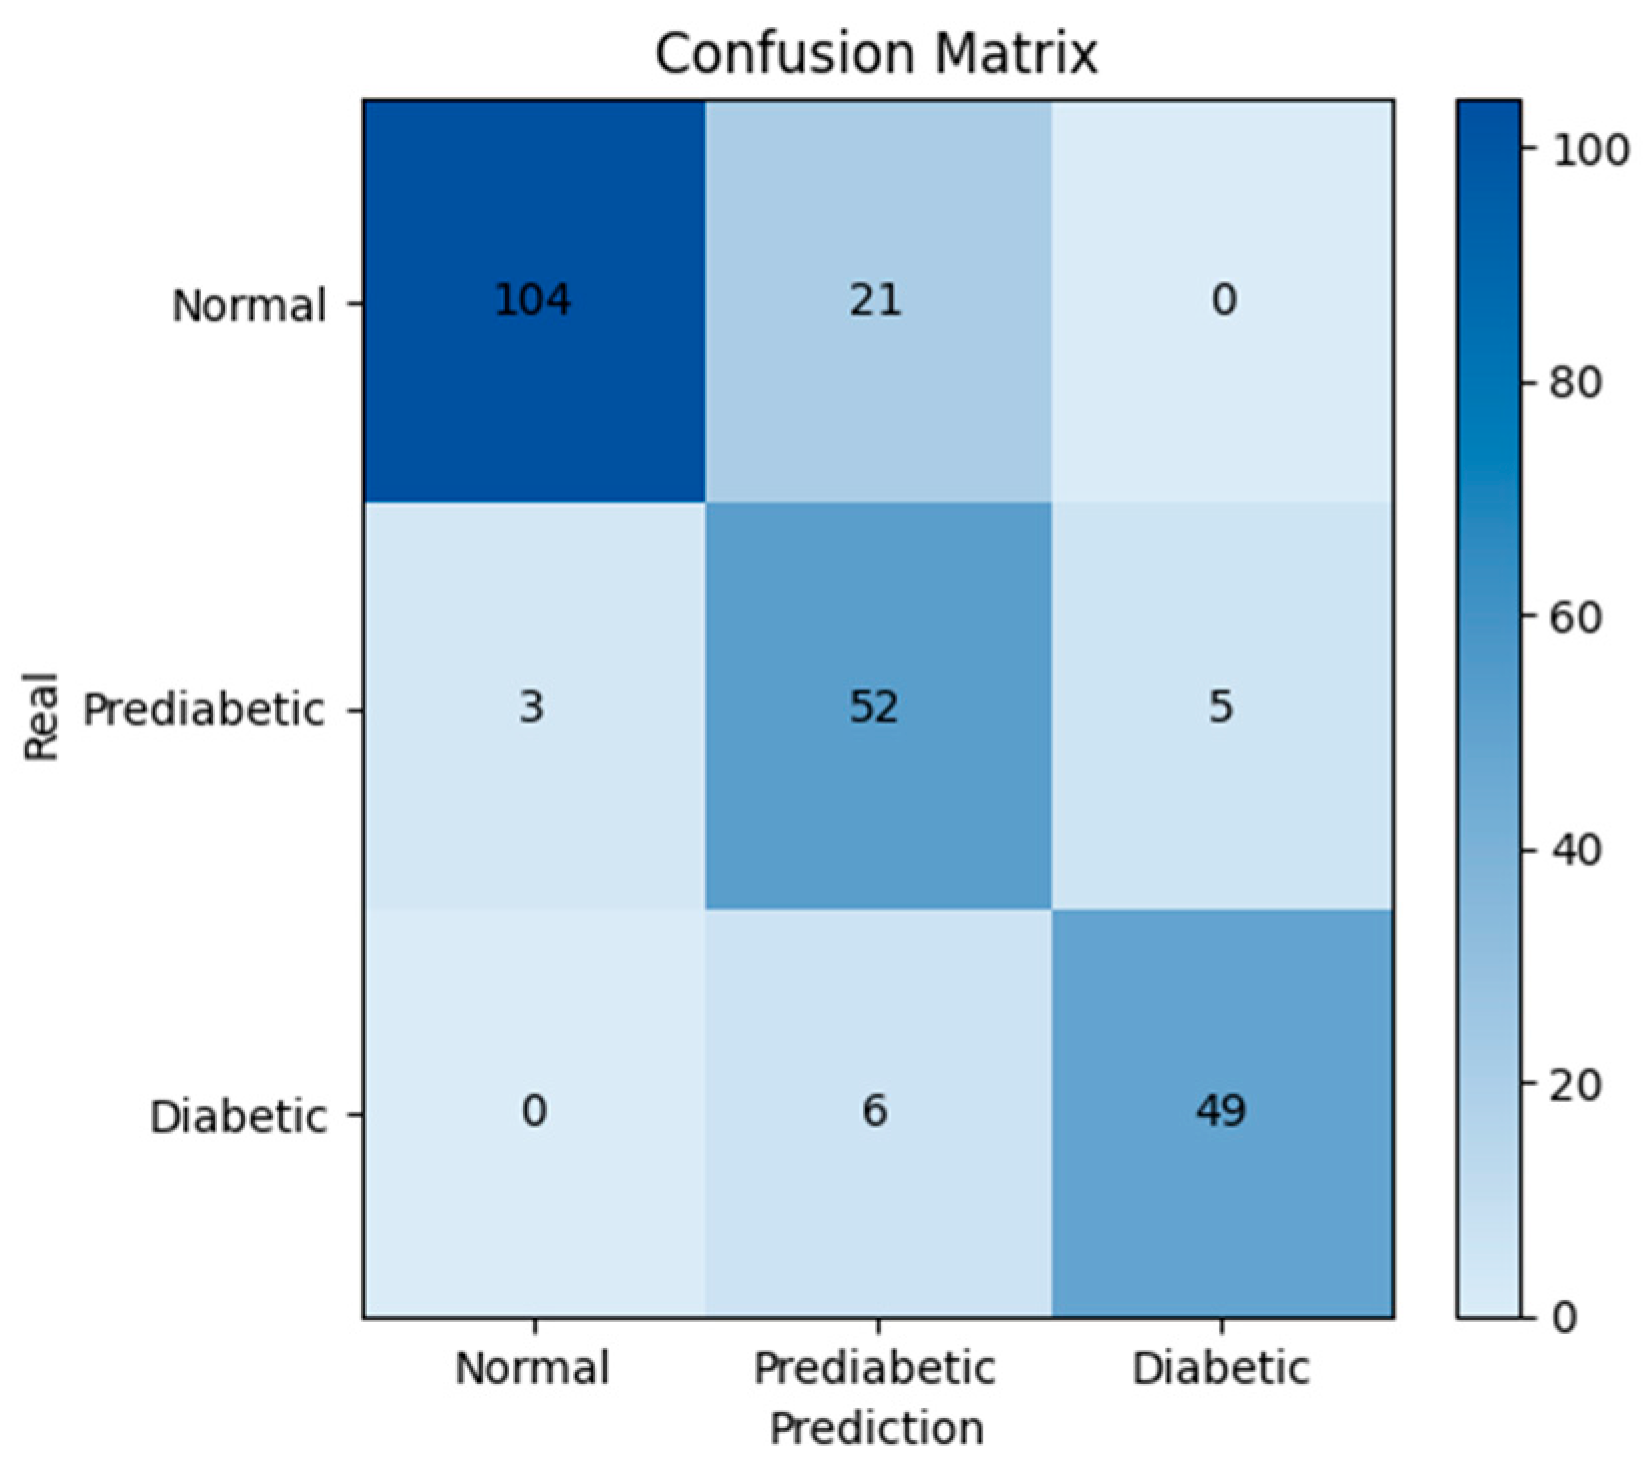
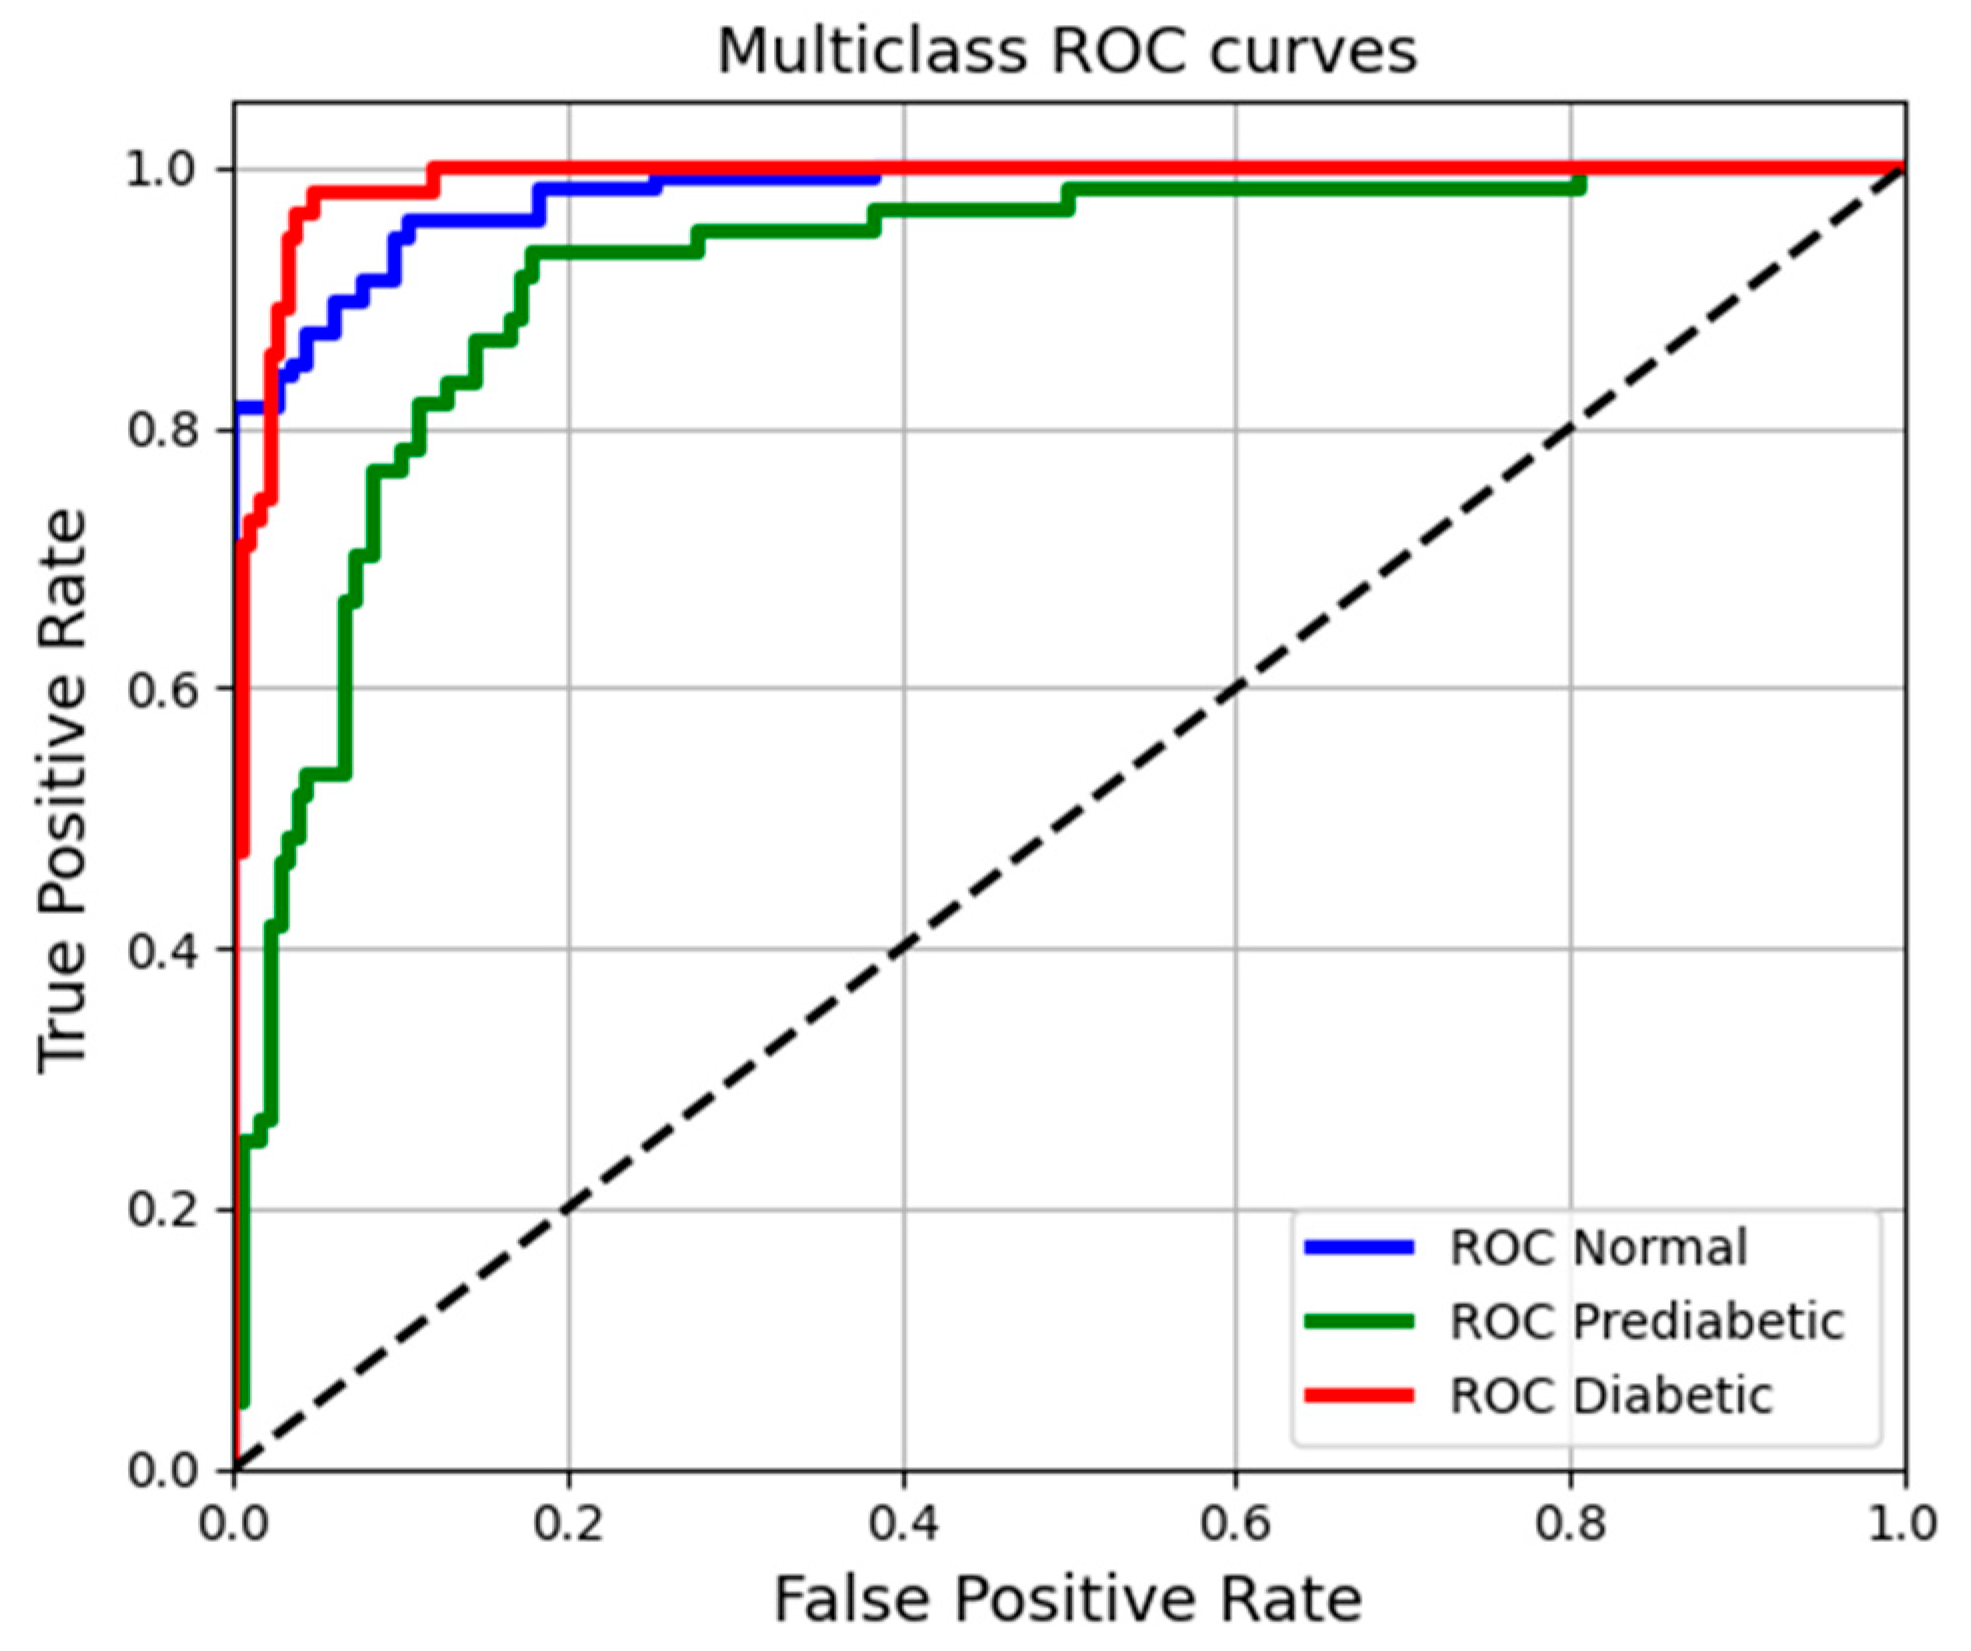
3. Results and Discussion
4. Conclusions
Author Contributions
Funding
Institutional Review Board Statement
Informed Consent Statement
Data Availability Statement
Acknowledgments
Conflicts of Interest
References
- Sun, H.; Saeedi, P.; Karuranga, S.; Pinkepank, M.; Ogurtsova, K.; Duncan, B.B.; Magliano, D.J. IDF Diabetes Atlas: Global, regional and country-level diabetes prevalence estimates for 2021 and projections for 2045. Diabetes Res. Clin. Pract. 2022, 183, 109119. [Google Scholar] [CrossRef] [PubMed]
- American Diabetes Association. 4. Lifestyle Management: Standards of Medical Care in Diabetes—2018. Diabetes Care 2018, 41 (Suppl. 1), S38–S50. [Google Scholar] [CrossRef] [PubMed]
- Lin, T.; Gal, A.; Mayzel, Y.; Horman, K.; Bahartan, K. Non-invasive glucose monitoring: A review of challenges and recent advances. Curr. Trends Biomed. Eng. Biosci 2017, 6, 555696. [Google Scholar] [CrossRef]
- Khalil, O.S. Non-invasive glucose measurement technologies: An update from 1999 to the dawn of the new millennium. Diabetes Technol. Ther. 2004, 6, 660–697. [Google Scholar] [CrossRef] [PubMed]
- Smith, J.L. The pursuit of Noninvasive Glucose: Hunting the Deceitful Turkey. 2015. Available online: http://www.mendosa.com/noninvasive_glucose.pdf (accessed on 10 February 2025).
- Mishra, N.; Singh, N. Blood viscosity, lipid profile, and lipid peroxidation in type-1 diabetic patients with good and poor glycemic control. N. Am. J. Med. Sci. 2013, 5, 562. [Google Scholar] [CrossRef] [PubMed]
- Irace, C.; Carallo, C.; Scavelli, F.; De Franceschi, M.S.; Esposito, T.; Gnasso, A. Blood viscosity in subjects with normoglycemia and prediabetes. Diabetes Care 2014, 37, 488–492. [Google Scholar] [CrossRef] [PubMed]
- Richards, R.S.; Nwose, E.U. Blood viscosity at different stages of diabetes pathogenesis. Br. J. Biomed. Sci. 2010, 67, 67–70. [Google Scholar] [CrossRef] [PubMed]
- Allen, J. Photoplethysmography and its application in clinical physiological measurement. Physiol. Meas. 2007, 28, R1. [Google Scholar] [CrossRef] [PubMed]
- Alian, A.A.; Shelley, K.H. Photoplethysmography. Best Pract. Res. Clin. Anaesthesiol. 2014, 28, 395–406. [Google Scholar] [CrossRef] [PubMed]
- Yamakoshi, T.; Lee, J.; Matsumura, K.; Yamakoshi, Y.; Rolfe, P.; Kiyohara, D.; Yamakoshi, K.I. Integrating sphere finger-photoplethysmography: Preliminary investigation towards practical non-invasive measurement of blood constituents. PLoS ONE 2015, 10, e0143506. [Google Scholar] [CrossRef] [PubMed]
- Ganchev, T. Contemporary Methods for Speech Parameterization; Springer Science & Business Media: Dordrecht, The Netherlands, 2011. [Google Scholar]
- Salamea, C.; Narvaez, E.; Montalvo, M. Database Proposal for Correlation of Glucose and Photoplethysmography Signals. In Advances in Emerging Trends and Technologies: Volume 2, Proceedings of the 1st International Conference on Advances in Emerging Trends and Technologies (ICAETT 2019), Loja, Ecuador, 24–26 April 2019; Springer International Publishing: Cham, Switzerland, 2020; pp. 44–53. [Google Scholar] [CrossRef]
- McCarthy, C.; Pradhan, N.; Redpath, C.; Adler, A. Validation of the Empatica E4 wristband. In Proceedings of the 2016 IEEE EMBS International Student Conference (ISC), Ottawa, ON, Canada, 29 May 2016; pp. 1–4. [Google Scholar] [CrossRef]
- Oreskovic, J.; Kaufman, J.; Fossat, Y. Impact of Audio Data Compression on Feature Extraction for Vocal Biomarker Detection: Validation Study. JMIR Biomed. Eng. 2024, 9, e56246. [Google Scholar] [CrossRef] [PubMed]
- Pei, W.; Li, Y.; Wen, P.; Yang, F.; Ji, X. An automatic method using MFCC features for sleep stage classification. Brain Inform. 2024, 11, 6. [Google Scholar] [CrossRef] [PubMed]
- Prabha, A.; Yadav, J.; Rani, A.; Singh, V. Design of intelligent diabetes mellitus detection system using hybrid feature selection based XGBoost classifier. Comput. Biol. Med. 2021, 136, 104664. [Google Scholar] [CrossRef] [PubMed]
- San-Segundo, R.; Montero, J.M.; Barra-Chicote, R.; Fernández, F.; Pardo, J.M. Feature extraction from smartphone inertial signals for human activity segmentation. Signal Process. 2016, 120, 359–372. [Google Scholar] [CrossRef]
- Wahab, A.; Kamaruddin, N.; Palaniappan, L.K.; Li, M.; Khosrowabadi, R. EEG signals for emotion recognition. J. Comput. Methods Sci. Eng. 2010, 10 (Suppl. 1), S1–S11. [Google Scholar] [CrossRef]
- Rajakumar, P.S.; Ravi, S.; Suresh, R.M. Automated Heart Sound Diagnosis Using Feature Extraction Model for Bio-signals. In Proceedings of the International Conference on Computing and Communication Systems, Chennai, India, 21–22 December 2011; Springer: Berlin/Heidelberg, Germany, 2011; pp. 103–109. [Google Scholar]
- Becerra, M.A.; Orrego, D.A.; Mejia, C.; Delgado-Trejos, E. Stochastic analysis and classification of 4-area cardiac auscultation signals using Empirical Mode Decomposition and acoustic features. In Proceedings of the 2012 Computing in Cardiology, Kraków, Poland, 9–12 September 2012; pp. 529–532. [Google Scholar]
- Kotsiantis, S.B.; Zaharakis, I.D.; Pintelas, P.E. Machine learning: A review of classification and combining techniques. Artif. Intell. Rev. 2006, 26, 159–190. [Google Scholar] [CrossRef]
- Venables, W.N.; Ripley, B.D. Tree-based methods. In Modern Applied Statistics with S: Statistical Computing; Springer: New York, NY, USA, 2002; pp. 251–269. [Google Scholar]
- Francisco-García, V.; Guzmán-Guzmán, I.P.; Salgado-Rivera, R.; Alonso-Silverio, G.A.; Alarcón-Paredes, A. Non-invasive glucose level estimation: A comparison of regression models using the MFCC as feature extractor. In Proceedings of the Pattern Recognition: 11th Mexican Conference, MCPR 2019, Querétaro, Mexico, 26–29 June 2019; Springer International Publishing: Cham, Switzerland, 2019; pp. 206–215. [Google Scholar] [CrossRef]
- Monte-Moreno, E. Non-invasive estimate of blood glucose and blood pressure from a photoplethysmograph by means of machine learning techniques. Artif. Intell. Med. 2011, 53, 127–138. [Google Scholar] [CrossRef] [PubMed]
- Chen, S.; Qin, F.; Ma, X.; Wei, J.; Zhang, Y.T.; Zhang, Y.; Jovanov, E. Multi-view cross-fusion transformer based on kinetic features for non-invasive blood glucose measurement using PPG signal. IEEE J. Biomed. Health Inform. 2024, 28, 1982–1992. [Google Scholar] [CrossRef] [PubMed]
- Shuzan, M.N.I.; Chowdhury, M.H.; Chowdhury, M.E.; Abualsaud, K.; Yaacoub, E.; Faisal, M.A.A.; Zorba, N. QU-GM: An IoT Based Glucose Monitoring System from Photoplethysmography, Blood Pressure and Demographic Data using Machine Learning. IEEE Access 2024, 12, 77774–77790. [Google Scholar] [CrossRef]
- Liu, X.; Wu, H.; Ou, W. Identity Authentication via ECG and PPG Signals: An Innovative Method Incorporating Singular Spectrum Analysis and Feature Integration. In Proceedings of the 2024 IEEE 7th Advanced Information Technology, Electronic and Automation Control Conference (IAEAC), Chongqing, China, 22–24 March 2024; Volume 7, pp. 505–511. [Google Scholar]
- Roche Diagnostics International. Cobas 6000 Analyzer Series: Technical Specifications; Roche Diagnostics International: Rotkreuz, Switzerland, 2013. [Google Scholar]


| Measurement | Max | Min. | Mean | Std. Deviation |
|---|---|---|---|---|
| Age (years) | 65 | 22 | 48.93 | 11.27 |
| Weight (kg) | 140 | 38 | 75.87 | 16 |
| Height (m) | 1.9 | 1.41 | 1.6 | 0.098 |
| ) | 50.88 | 17.82 | 29.41 | 5.08 |
| Measurement | Max | Min. | Mean | Std. Deviation |
|---|---|---|---|---|
| Laboratory Glucose (mg/dL) | 390.7 | 58.6 | 114.05 | 50.13 |
| Glucometer Glucose (mg/dL) | 363 | 67 | 115.66 | 44.71 |
| Feature Extr\Estimation A. | ANN-MLP | SVR | RT |
|---|---|---|---|
| MFCCs | 28.04 | 25.09 | 29.84 |
| MFCCs (MLP) | 16.38 | 15.49 | 9.85 |
| MFCCs (LDA) | 15.11 | 16.86 | 10.98 |
| Feature Extr\Estimation A. | ANN-MLP | SVR | RT |
|---|---|---|---|
| MFCCs | 0.37 | 0.45 | 0.33 |
| MFCCs (MLP) | 0.76 | 0.93 | 0.94 |
| MFCCs (LDA) | 0.88 | 0.79 | 0.93 |
| MAE | R | MSE | RMSE |
|---|---|---|---|
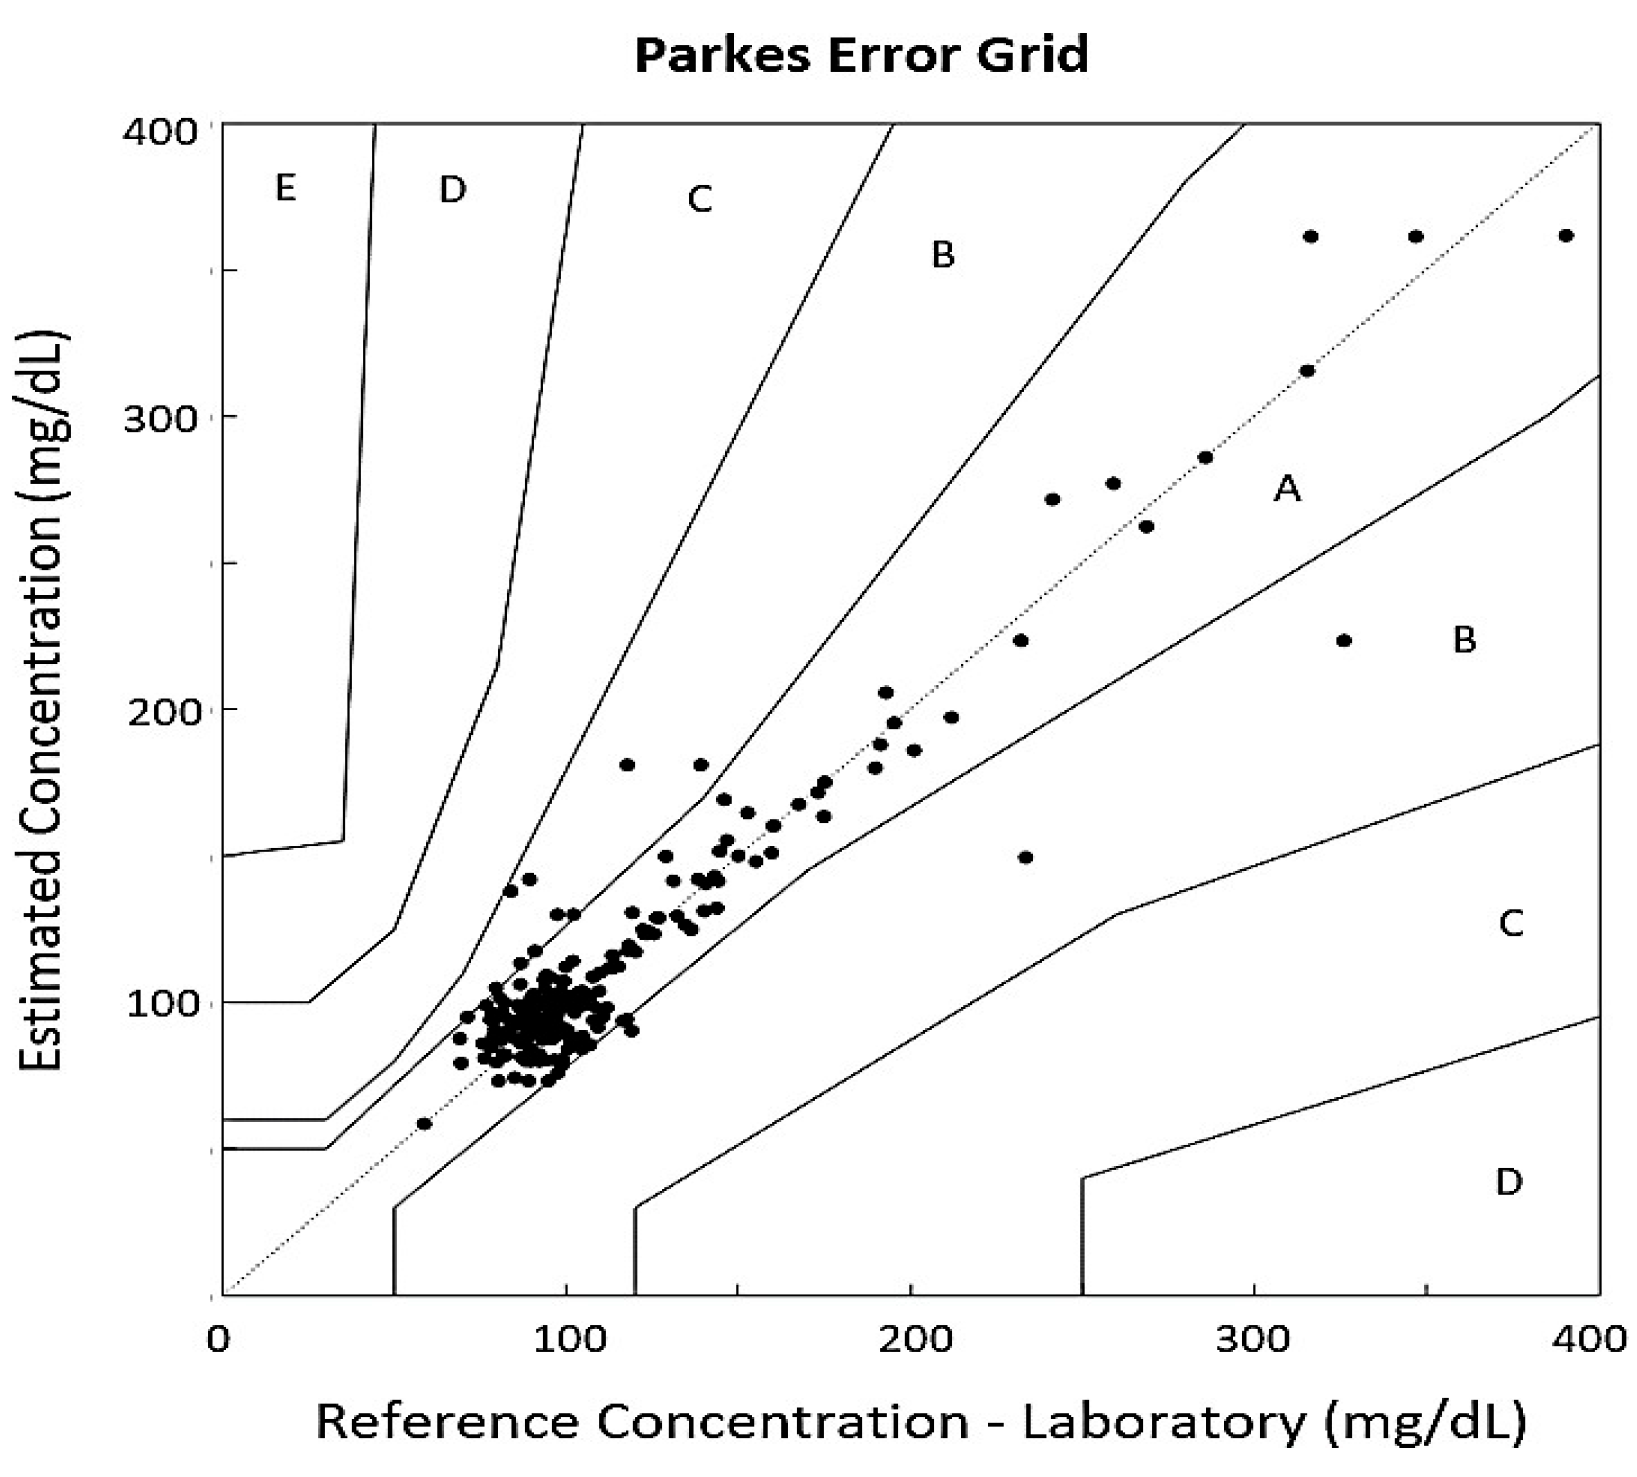
| 9.85 | 0.94 | 277.55 | 16.66 |
Disclaimer/Publisher’s Note: The statements, opinions and data contained in all publications are solely those of the individual author(s) and contributor(s) and not of MDPI and/or the editor(s). MDPI and/or the editor(s) disclaim responsibility for any injury to people or property resulting from any ideas, methods, instructions or products referred to in the content. |
© 2025 by the authors. Licensee MDPI, Basel, Switzerland. This article is an open access article distributed under the terms and conditions of the Creative Commons Attribution (CC BY) license (https://creativecommons.org/licenses/by/4.0/).
Share and Cite
Salamea-Palacios, C.; Montalvo-López, M.; Orellana-Peralta, R.; Viñanzaca-Figueroa, J. Photoplethysmography Feature Extraction for Non-Invasive Glucose Estimation by Means of MFCC and Machine Learning Techniques. Biosensors 2025, 15, 408. https://doi.org/10.3390/bios15070408
Salamea-Palacios C, Montalvo-López M, Orellana-Peralta R, Viñanzaca-Figueroa J. Photoplethysmography Feature Extraction for Non-Invasive Glucose Estimation by Means of MFCC and Machine Learning Techniques. Biosensors. 2025; 15(7):408. https://doi.org/10.3390/bios15070408
Chicago/Turabian StyleSalamea-Palacios, Christian, Melissa Montalvo-López, Raquel Orellana-Peralta, and Javier Viñanzaca-Figueroa. 2025. "Photoplethysmography Feature Extraction for Non-Invasive Glucose Estimation by Means of MFCC and Machine Learning Techniques" Biosensors 15, no. 7: 408. https://doi.org/10.3390/bios15070408
APA StyleSalamea-Palacios, C., Montalvo-López, M., Orellana-Peralta, R., & Viñanzaca-Figueroa, J. (2025). Photoplethysmography Feature Extraction for Non-Invasive Glucose Estimation by Means of MFCC and Machine Learning Techniques. Biosensors, 15(7), 408. https://doi.org/10.3390/bios15070408