Article

Ultrasensitive and Real-Time Detection of Kanamycin Residues in Milk Using an Aptasensor Based on Microfluidic Capacitive Strategy

1
College of Electrical and Electronic Engineering, Wenzhou University, Wenzhou 325035, China
2
Department of Electrical Engineering and Computer Science, The University of Tennessee, Knoxville, TN 37996, USA
*
Authors to whom correspondence should be addressed.
These authors contributed equally to this work.
Biosensors 2025, 15(5), 322; https://doi.org/10.3390/bios15050322
Submission received: 1 April 2025 / Revised: 15 May 2025 / Accepted: 16 May 2025 / Published: 18 May 2025
(This article belongs to the Special Issue In Honor of Prof. Evgeny Katz: Biosensors: Science and Technology)

Abstract

:
Kanamycin (KanR) is a widely used antibiotic in human and veterinary medicine, as well as in food production and livestock breeding. However, its environmental residue and bioaccumulation in the food chain pose a great threat to human health. A real-time and sensitive aptasensor is developed for KanR detection based on a gold interdigitated electrode (IDE). A microfluidic alternating current electrothermal (ACET) effect is employed for rapid directional manipulation and enrichment of KanR molecules. As an ultrasensitive indicator, solid–liquid capacitance is adopted to reflect the tiny change on the IDE surface caused by target adsorption. The overall detection takes only 60 s from sample to result, and a wide linear detection range of 0.1 fM~1 pM, an ultra-low detection limit of 16.56 aM, and a high selectivity of 7752:1 are simultaneously achieved, with 5 times of repeated use and the shelf life of 10 days. Furthermore, the aptasensor shows excellent practicability in milk samples, with the spiked recovery rate ranging from 86.90% to 116.17%. This aptasensor with the detecting strategy provides a rapid, convenient, and cost-effective solution for real-time monitoring of KanR.

1. Introduction

Kanamycin (KanR, C18H38N4O15S) is a common aminoglycoside antibiotic derived from the fermentation broth of streptomyces kanamyceticus [1,2], which is widely utilized due to its low price, high solubility in water, and broad-spectrum antibacterial properties in the livestock industry for treating infections caused by various bacteria [3]. Initially, kanamycin was used solely for disease treatment; however, its applications have gradually expanded into animal feed as a growth promoter and prophylactic agent, with its consumption increasing significantly over the last decade [4]. Studies have revealed that the abuse of kanamycin gives rise to drug resistance among pathogenic strains. Moreover, approximately 30%~90% of the ingested kanamycin is excreted into the environment, leading to contamination due to its low absorptivity for animals [5]. Even worse, its residues in animal-derived foods can lead to bioaccumulation in the human body [6], potentially causing various toxic effects such as ototoxicity, nephrotoxicity, and hepatotoxicity [7,8]. Therefore, numerous countries, such as the European Union, the United States, Japan, South Korea, and China, have stated the upper limits of residue in animal-derived foods, typically from 100 to 600 μg/kg [9,10,11]. Hence, the development of rapid and sensitive detection techniques for KanR residues is essential for food and environmental safety, and can even facilitate clinical diagnosis.
Traditional methods for KanR detection include enzyme-linked immunosorbent assay [12,13], high-performance liquid chromatography [14], liquid chromatography–mass spectrometry [15], capillary electrophoresis [16], surface plasmon resonance [17], and microbial detection methods [18]. However, these methods have several disadvantages such as expensive equipment, misquantification, complex procedure, and long turnaround time. In contrast, biosensors have attracted much attention from researchers in recent years and possess advantages such as portability, low cost, high sensitivity, and operation convenience [19], showing excellent application potential in on-site and fast-responding tests [20].
The core of a biosensor is a target recognition and sensing mechanism. The recognition elements include aptamers, antibodies, enzymes, etc. [21,22]. An aptamer is a short RNA or single-stranded DNA oligonucleotide with a specific three-dimensional structure for binding targets [23,24]. Compared with other probes, they have small and flexible structures with lower cost, better stability, better modifiability, and equivalent or higher selectivity and affinity for targets [25,26]. For sensing mechanisms, colorimetry, fluorescence, electrochemistry, and photonic crystal-based methods were reported for KanR detection in milk, with the limits of detection (LODs) from pM to tens of nM, and the turnaround time of tens of minutes [27,28,29,30,31,32]. The cause for the long turnaround time of these biosensors was the absence of effective means for target enrichment. In the last decade, microfluidic techniques have become versatile strategies for nanoparticle driving and separation, providing a good solution for target enrichment for biosensors, and shortening the turnaround time. However, most reported microfluidic methods depend on microchannels and pumps, making the system complex. Therefore, simple microfluidics with electrical excitation is becoming a promising technique coupled to electrical biosensors, particularly for on-site and real-time detection of KanR.
In this work, a microfluidic capacitive aptasensor is developed for KanR detection in milk. By using an aptamer as the probe, a PCB interdigitated electrode (IDE)-based sensor is constructed, employing a pF-level-resolution AC interfacial capacitance as the indicator. Meanwhile, the microfluidic AC electrothermal (ACET) effect is stimulated by the same AC signal for driving and enriching the target towards the electrode. Based on these sensing mechanisms and microfluidic effects, high sensitivity and short overall detection time are achieved. The turnaround time is 60 s, the linearity is over a wide range of 0.1 fM~1 pM, and the LOD is as low as 16.56 aM. The key performance of this aptasensor is compared with typical reported assays for KanR in milk, as presented in Table 1, showing a good competitiveness for field and real-time detection of milk KanR.

2. Materials and Methods

2.1. Reagents

A 5′-amino-modified aptamer for KanR was synthesized by Sangon Biotech Co., Ltd., Shanghai, China, according to previous studies, with the sequence of 5′-TGG GGG TTG AGG CTA AGC CGA-3′ [33]. It was diluted to 2.5 μM with phosphate buffer saline (0.05× PBS), purchased from Biosharp Co., Ltd., Shanghai, China. 6-Mercapto-1-hexanol (6-MCH) was purchased from Aladdin Biotechnology Co., Ltd., Shanghai, China, and was diluted to 1 mM with 0.05× PBS. KanR was purchased from Sangon Biotech Co., Ltd., Shanghai, China. Other antibiotics of penicillin G (PG), tobramycin (TOB), chloramphenicol (CL), streptomycin (STR), and gentamicin sulfate (GEN), were all purchased from Bioshun Biotech Co., Ltd., Shanghai, China.

2.2. Sample Treatment

For sensor calibration, all the above antibiotics, including KanR, were diluted in 0.1× PBS to obtain six concentrations from 0.1 fM to 10 pM, each with a 10-fold increase. The interfering proteins and antibiotics, including peptidoglycan (PG), tobramycin (TOB), chloramphenicol (CL), streptomycin (STR), and gentamicin (GEN), were prepared with the same process. The qualified skimmed milk was purchased from a local supermarket. To eliminate the interference of proteins and other impurities, the supernatant was collected after a milk sample was centrifuged at 12,000 rpm for 10 min, and this operation was repeated twice. The supernatant was then filtered through a sterile microporous membrane with an aperture of 0.22 μm. Subsequently, the obtained milk samples in triplicate were spiked with three KanR concentrations. Then, these samples were 1:106 diluted with 0.1× PBS for the final test. The recovery rate can be calculated as follows: Recovery(%) = (Detected concentration − Original concentration)/Spiked concentration × 100%.

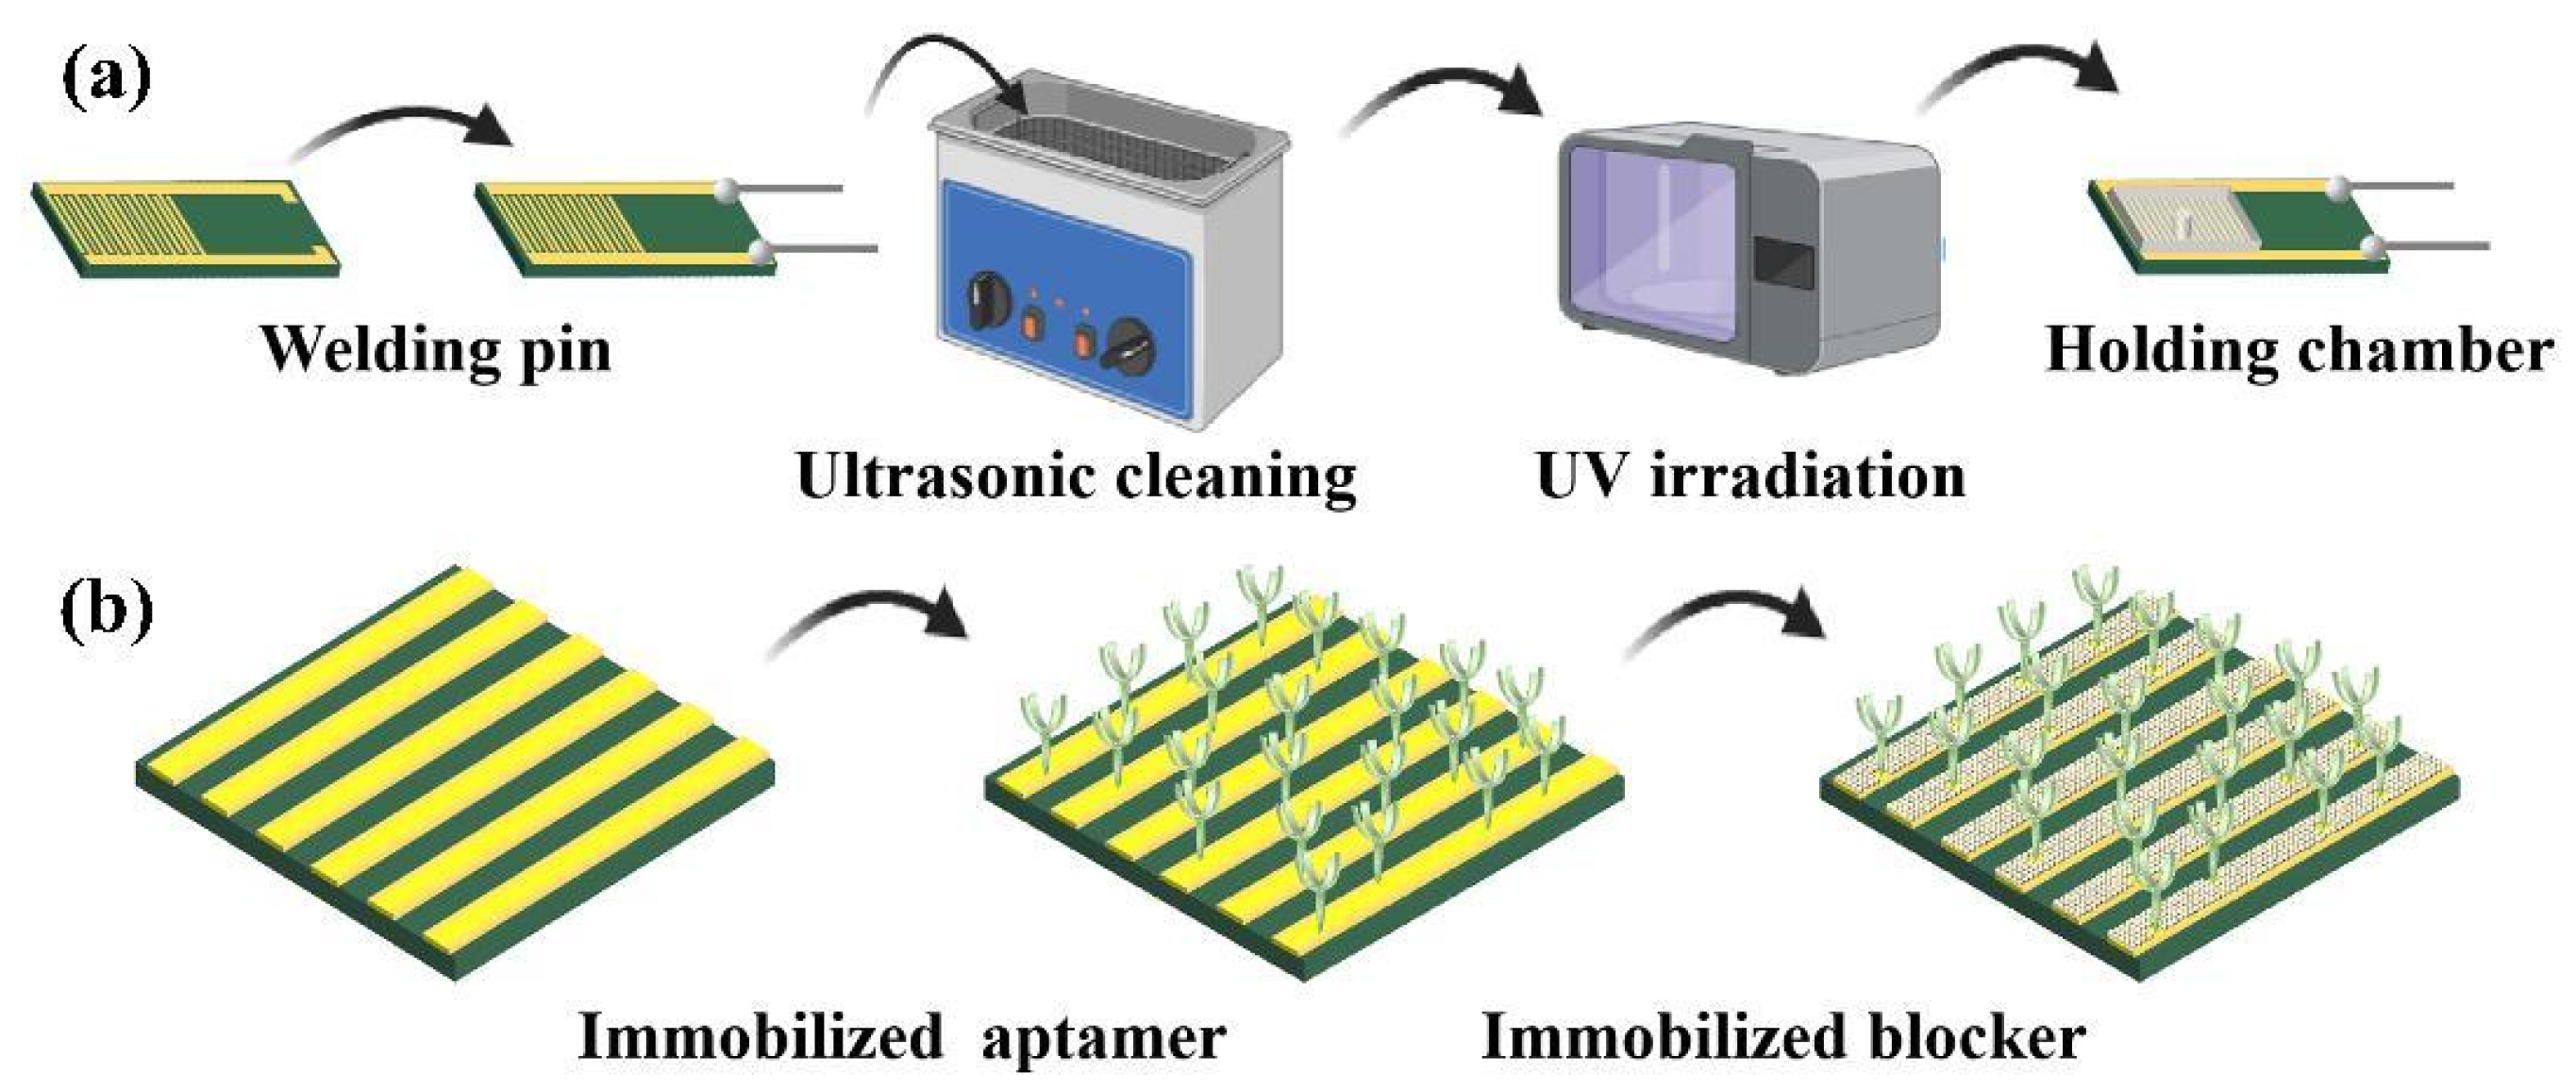
2.3. Aptasensor Preparation

As illustrated in Figure 1a, the basic structure of the sensor is a gold IDE fabricated by standard PCB process, with an external dimension of 3 cm × 1.5 cm, electrode width of 0.2 mm, and electrode gap of 0.15 mm. For its fabrication, the FR-4 (glass fiber-reinforced epoxy resin) is adopted as a substrate, with a covered copper layer of 35 μm (2 oz). After a thorough cleaning and removal of the surface oxide, graphical photoresist of about 30 μm is deposited and exposed. Then, the copper layer is etched to form the IDE pattern. Subsequently, the gold film is electroplated on the copper electrodes with the aid of a nickel bonding layer. The thicknesses of the nickel layer and gold layer are 3 μm and 1 μm, respectively. This IDE is fabricated by Shenzhen Jialichuang Technology Co., Ltd., Shenzhen, China. After soldering a pair of pins, the IDE is ultrasonically cleaned in acetone, isopropanol, and DI water for 3 min to completely remove the surface contaminants. Then, it is treated with ultraviolet light for 40 min to increase hydrophilicity. Finally, a silicone patch with a pore size of 4 mm is affixed to create a 20 μL chamber for holding the sample solution.
Figure 1b illustrates the sensor functionalization process. First, 20 μL of 2.5 μM aptamer for KanR is dropped into the chamber and incubated in a thermostatic humidor at 22 °C for 18 h, which facilitates the covalent bonding of the amino group at the 5′ end of the aptamer to the gold surface. After washing to remove the free aptamer, 20 μL of 1 mM 6-MCH is dropped and incubated at 18 °C for 2.5 h, blocking the blank sites at the IDE surface not occupied by the aptamer. After that, the IDE is cleaned again with DI water and stored at 4 °C for future use.

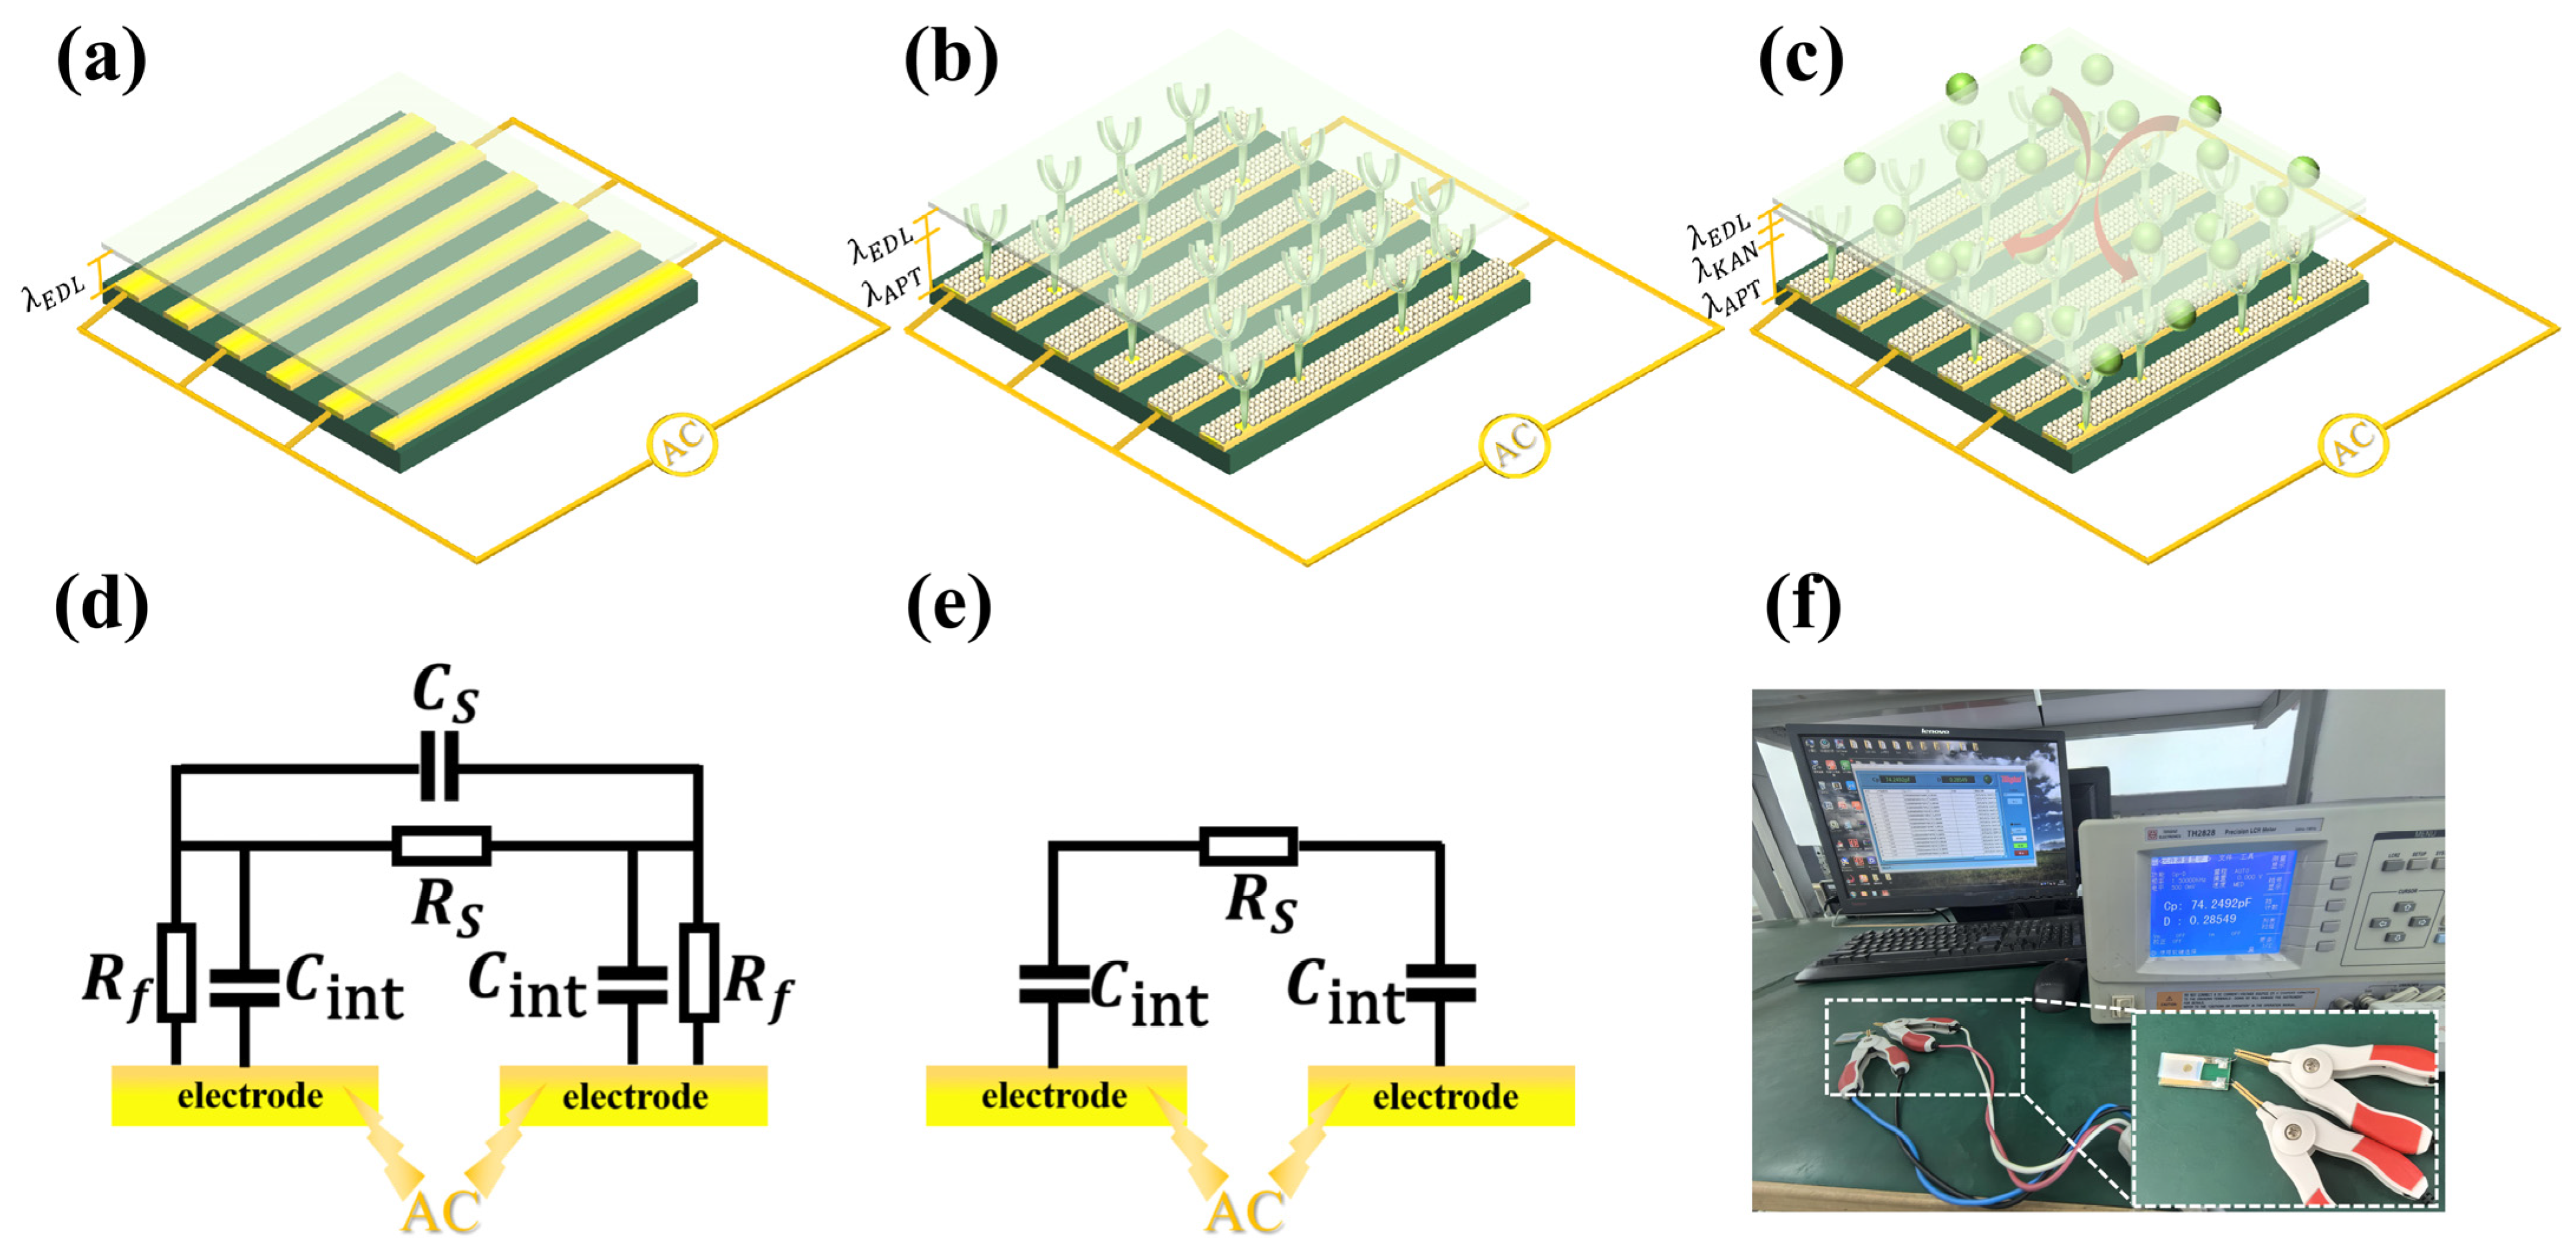
2.4. Enrichment Mechanism by ACET Effect

The ACET effect refers to a microfluidic phenomenon induced by a non-uniform electric field applied across the microelectrodes in a solution [34]. The current passing through the solution generates Joule heat, causing a local temperature increase, which affects the electrical conductivity and dielectric constant of the solution, resulting in their non-uniform distribution in space. Then, the coupling of the electric field and the temperature gradient generates the electrothermal volume force [35]. Therefore, subsequent micro-vortices appear, which can drive the embedded small particles and continuously transport them towards the electrode surface. Obviously, higher conductivity leads to more powerful vortices. In this work, the background of 0.1× PBS or the highly diluted milk by PBS has a high conductivity of about 0.184 S/m. Therefore, ACET flows are prominent for KanR molecule enrichment. The ACET force in the fluid is approximately expressed as
F A C E T = 0.011 ε m σ m k π r E r m s 4
where εm (F/m), σm (S/m) and k (W·m−1·K−1) are the permittivity, conductivity, and thermal conductivity of the fluid, respectively. r (m) is half of the electrode gap, and Erms (V/m) is the root mean square value of the electric field [36]. According to this equation Erms positively related to the applied voltage, playing a dominant role in enhancing the ACET effect.

2.5. Interfacial Capacitive Sensing

When an electrode is immersed in an electrolyte, net charges are induced on its surface. Meanwhile, a counter-ion layer in the solution will be generated above the surface. These two layers form an electrical double layer (EDL), which acts as an interfacial capacitor with the intervening dielectric medium [35], as shown in Figure 2a. The interface capacitance Cint (F) is expressed as
C int = ε E D L S int λ E D L
where Sint (m2) is the surface area of interface capacitance, εEDL (F/m) is the solution permittivity, and λEDL (m) is the thickness of EDL. When the aptamer is immobilized on the electrode surface, the thickness of the dielectric layer containing the EDL becomes thicker. Therefore, the interfacial capacitance will change, as shown in Figure 2b. This change can reflect the binding of KanR to the aptamer, and further indicates the KanR concentration in the solution. The changed capacitance Cint-apt (F) can be expressed as
C int- apt = S int- apt λ E D L ε E D L + λ A P T ε A P T
where Sint-apt (m2) is the surface area after aptamer immobilization, εAPT (F/m) is the permittivity of the aptamer, and λAPT (m) is the thickness of the aptamer layer. As illustrated in Figure 2c, the ACET vortices will drive the KanR molecules to the IDE surface and bind with the aptamer. Then, the thickness of capacitor Cint-combine is superposed by the KanR, aptamer, and EDL, expressed as
C int- combine = S int combine λ E D L ε E D L + λ A P T ε A P T + λ K A N ε K A N
where εKAN (F/m) is the permittivity of KanR, λKAN (m) is the thickness of the KanR layer, and Sint-combine (m2) is the surface area after target binding. Assuming the same surface area during the detection process, the normalized change rate of the capacitance during the detection is given as
Δ C C int- apt = C int- combine C int- apt C int- apt = λ K A N ε K A N ε E D L λ E D L + ε K A N ε A P T λ A P T + λ K A N
where ΔC is acquired in a duration of 1 min. According to Equation (5), Δ C C int apt , i.e., the dC/dt (%/min) in the later section, has no connection with the initial capacitance, avoiding the test error caused by the inconsistent initial state of different sensor surfaces.
The electrode–electrolyte system can be approximately described by the equivalent circuit network in Figure 2d, where Cint and Rf represent the interfacial capacitance and charge transfer resistance at the electrode–fluid interface, respectively, and Rs and Cs are the bulk resistance and capacitance of the solution, respectively. When the AC frequency is lower than 100 kHz, Cint and Rs play a dominant role in this network [37]. Therefore, the equivalent circuit can be simplified as a series connection of two Cint and one Rs, as shown in Figure 2e. The observable variables of Cint just reflect the process of KanR binding to the aptamer. The detection schematic is illustrated in Figure 2f, with an impedance analyzer (Tonghui TH2828, Changzhou, China) for applying the AC excitation and testing the capacitance.

3. Results and Discussion

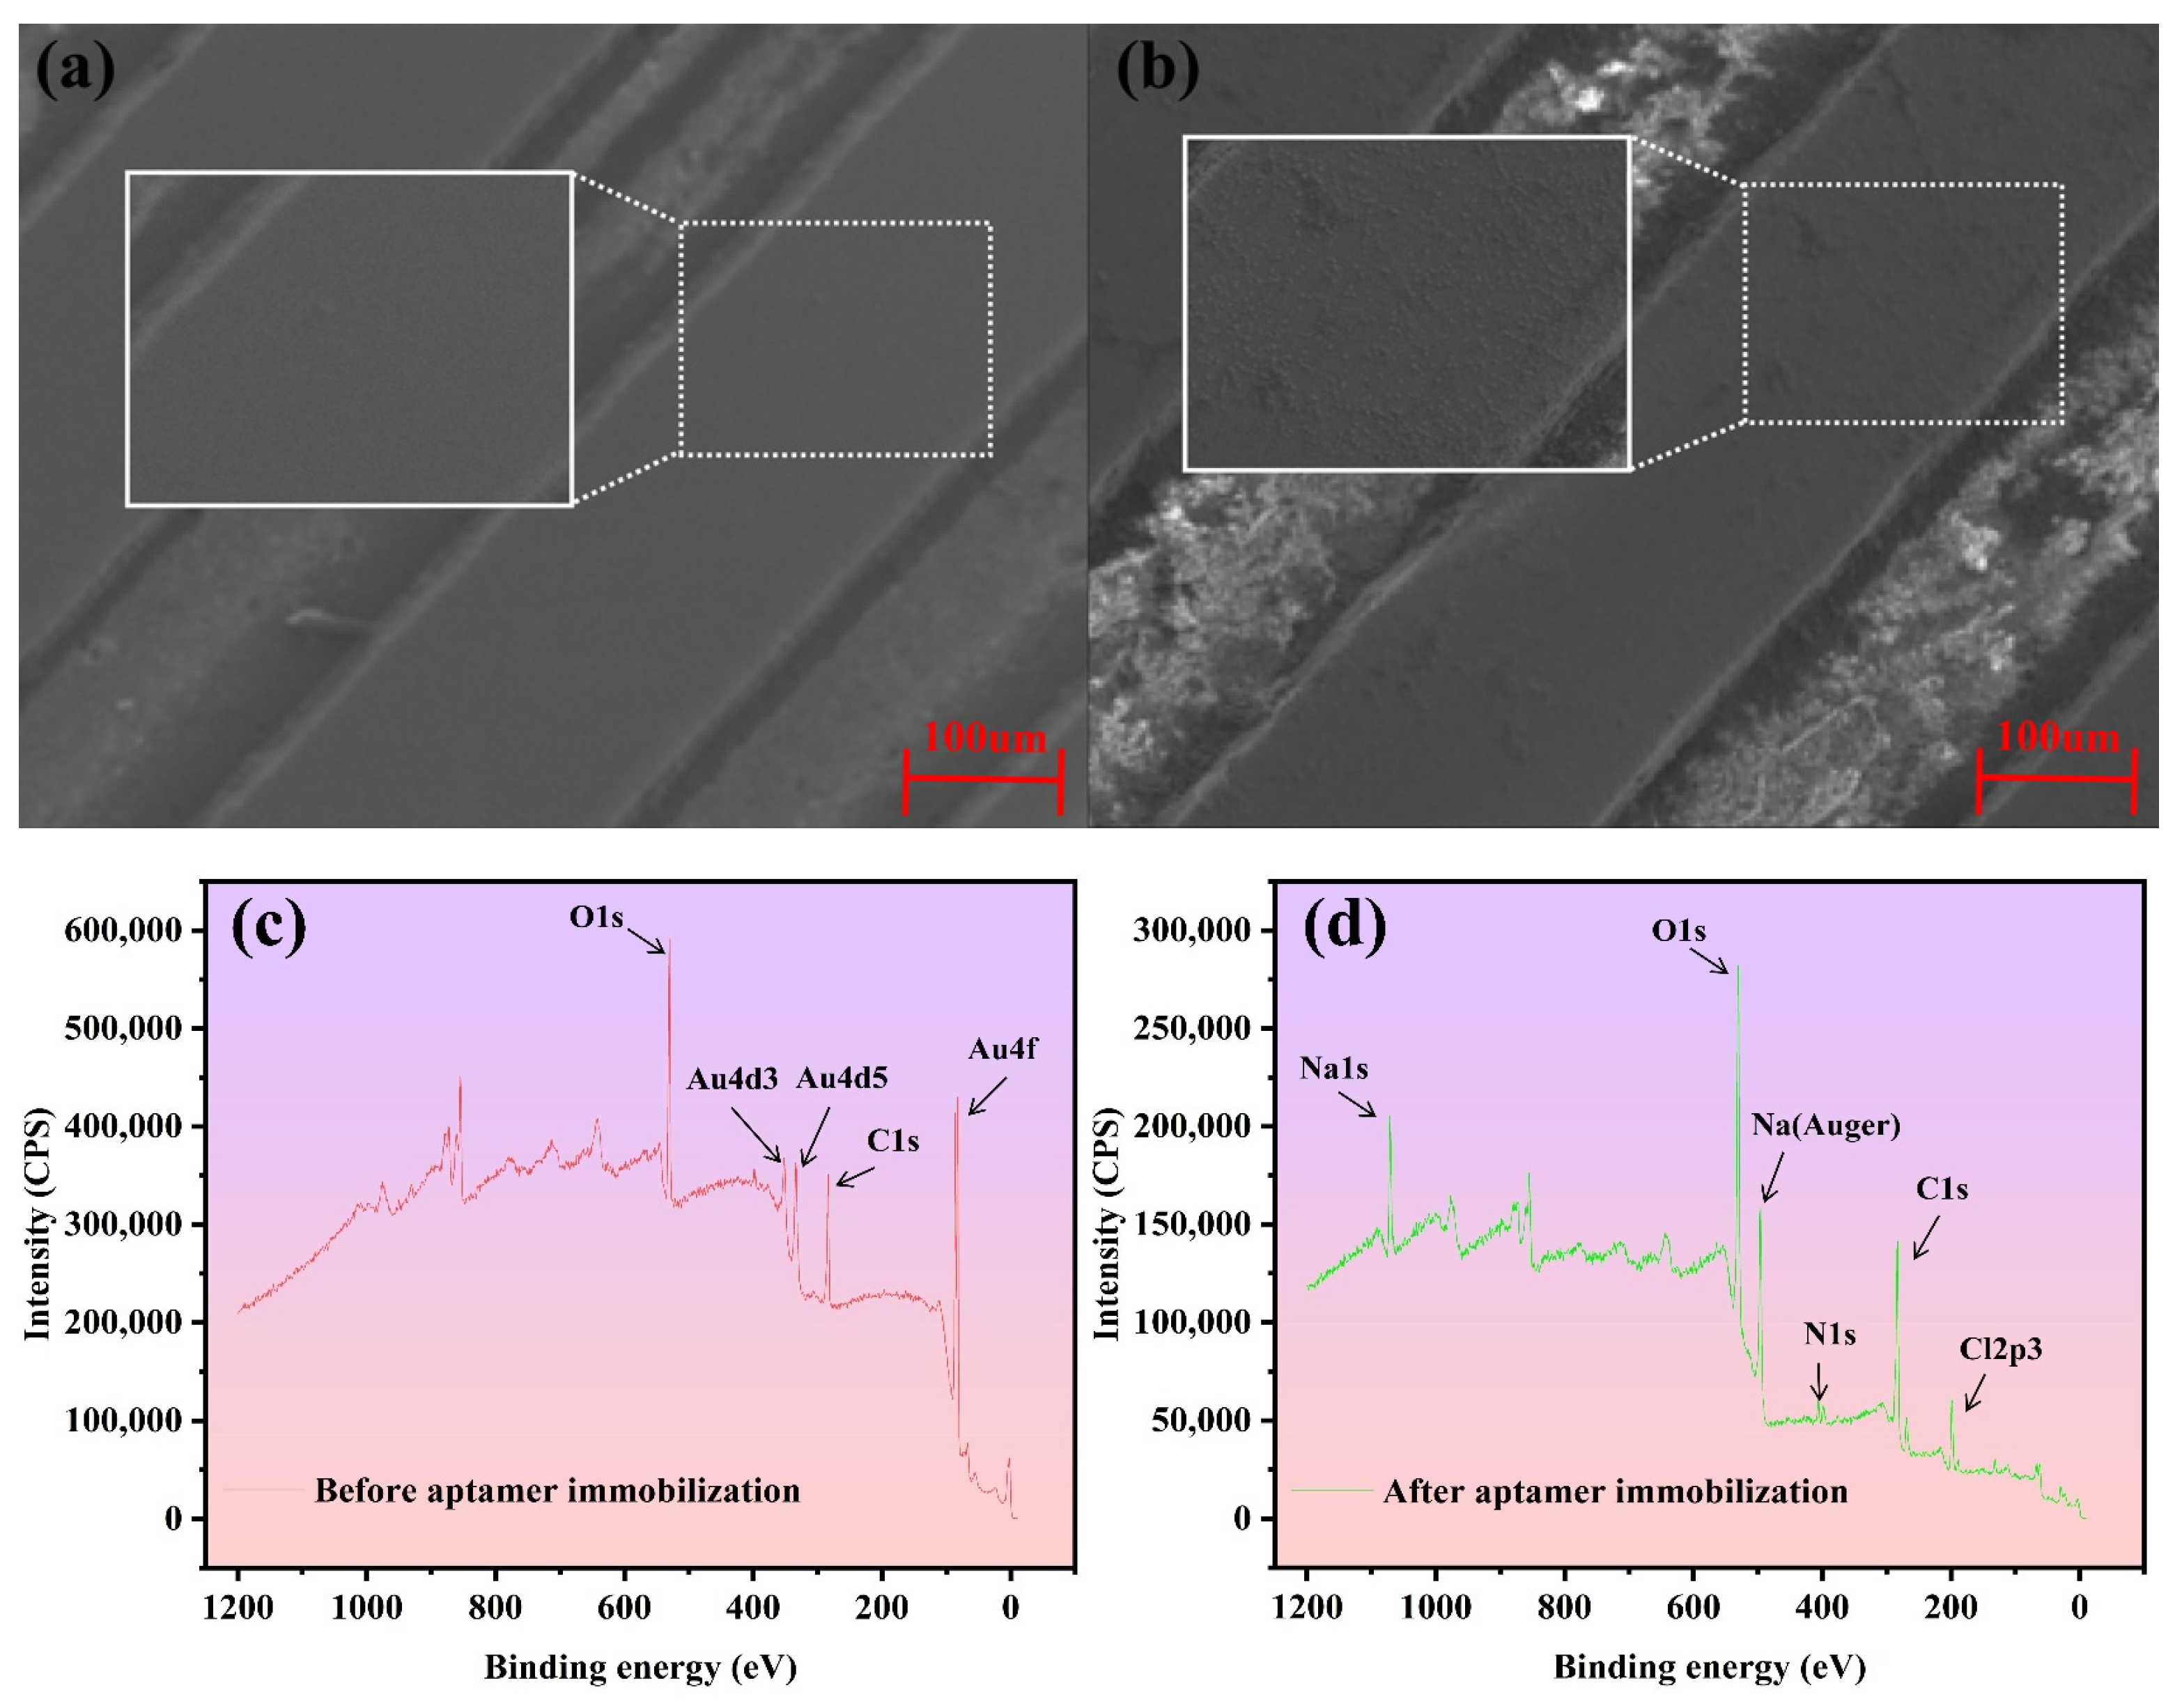
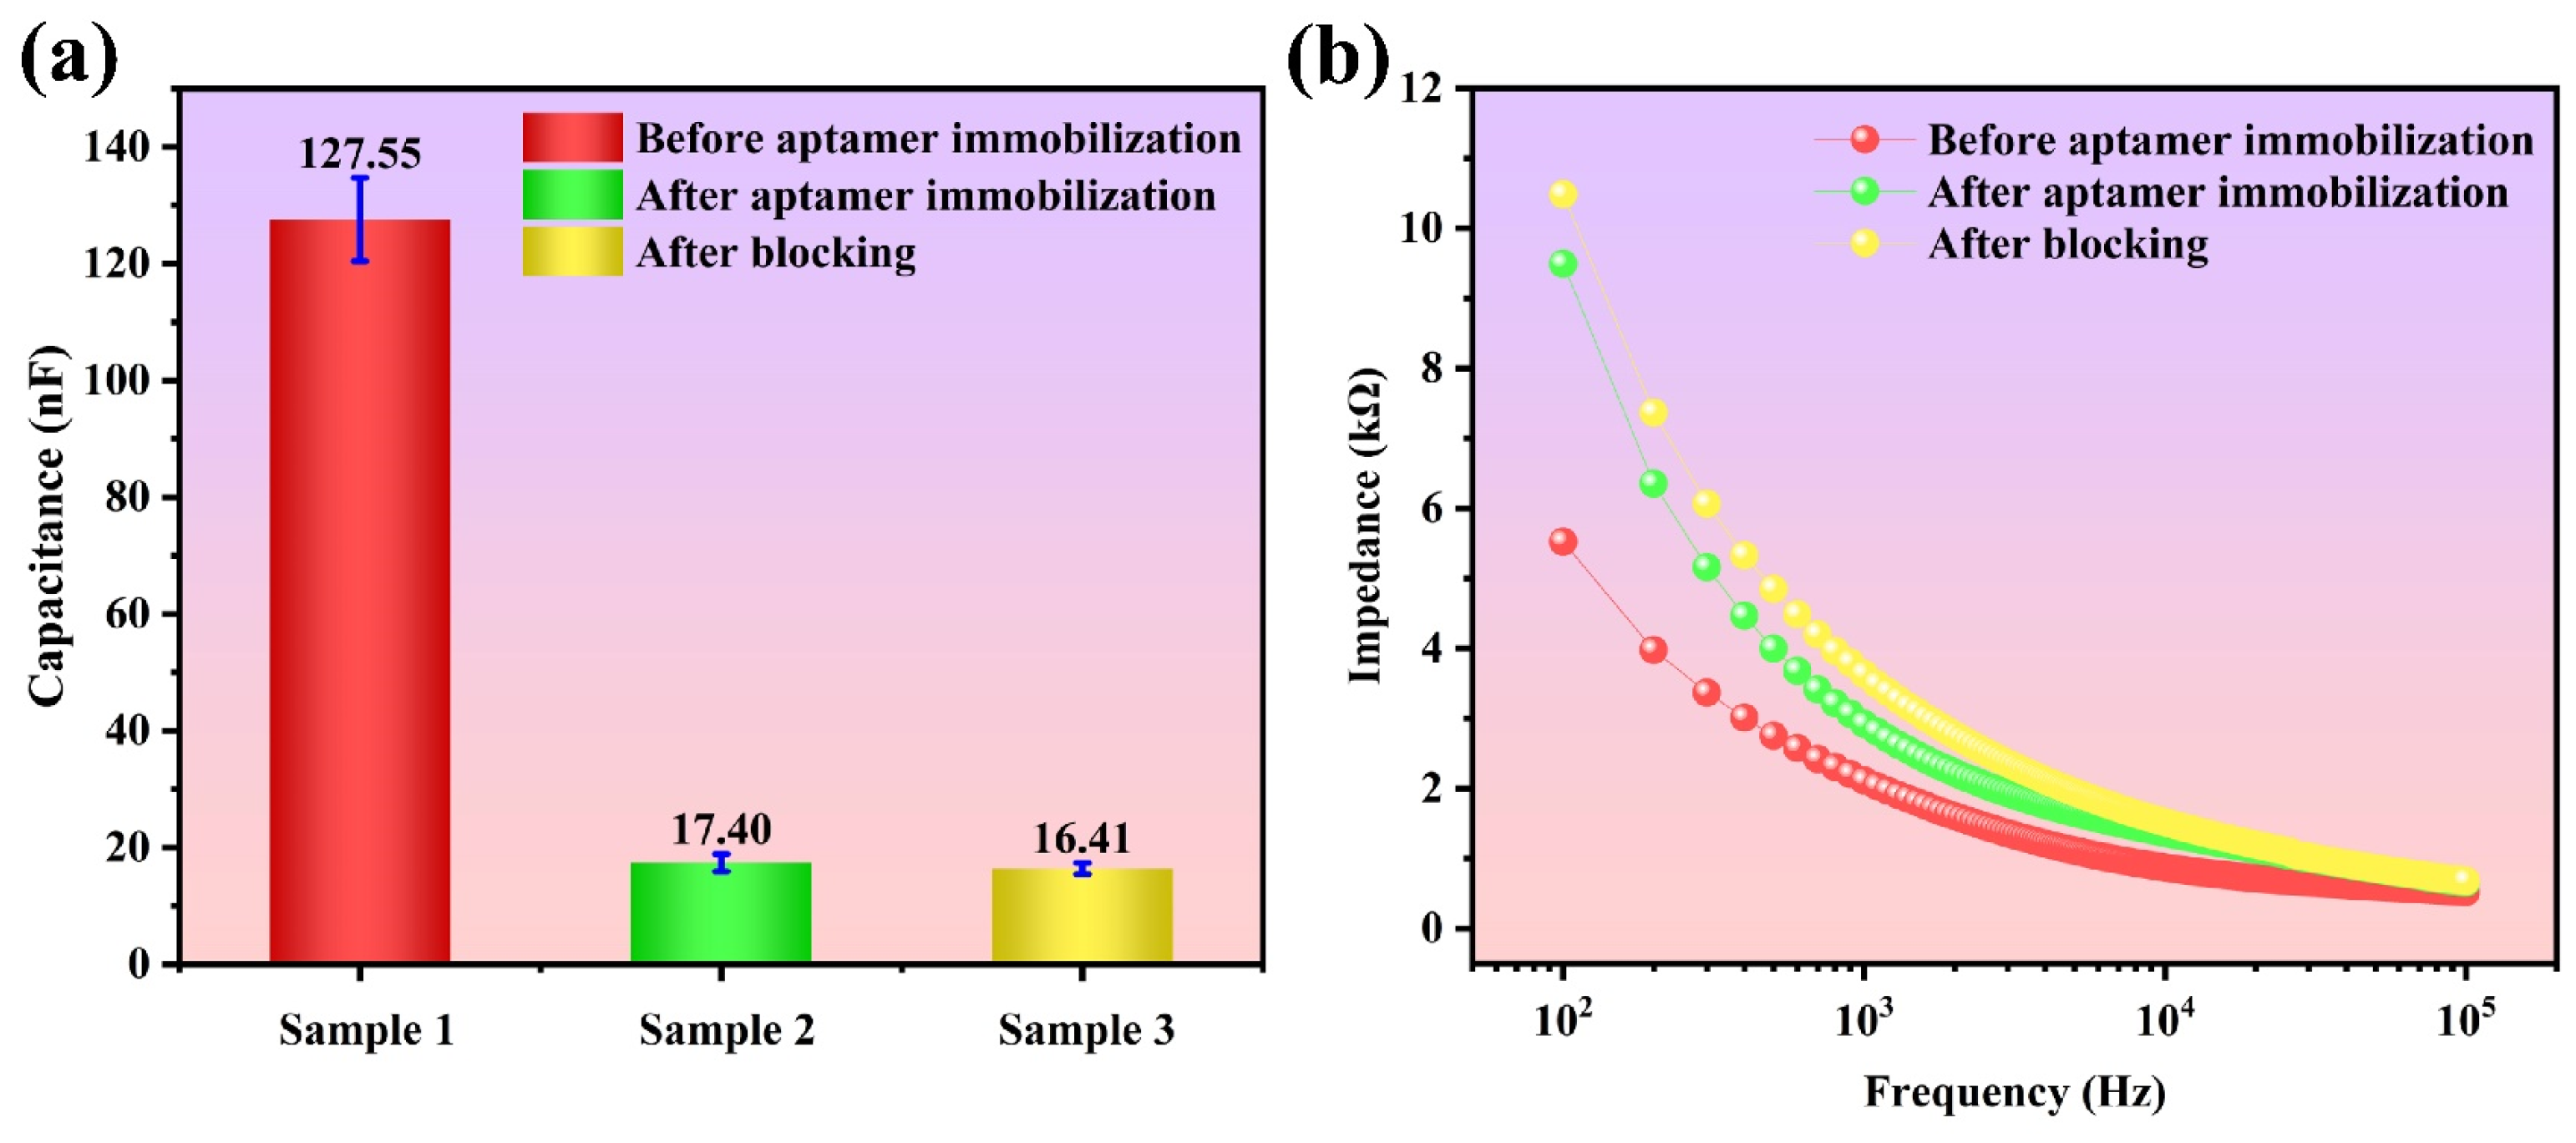
3.1. Sensor Characterization

The sensor functionalization is examined by observing the IDE surface with a scanning electron microscope (SEM) as shown in Figure 3a,b, where a layer of homogenous and slightly rough material is clearly found after the aptamer and blocker coating, indicating successful immobilization. As the electrode gaps do not play a role in the formation of capacitance, the deposition on the gaps has no effect on the sensing. In addition, X-ray photoelectron spectroscopy (XPS) is utilized for characteristic element identification before and after aptamer immobilization, as shown in Figure 3c,d. The element of Au from the IDE surface is dominant before aptamer coating, while after aptamer immobilization, it can hardly be found with the appearance of N, Na, and Cl, which are from the aptamer and PBS. This result indicates a good modification of the IDE by the aptamer.
Using the electrical method, the sensor functionalization can further be examined. The capacitance and the impedance spectroscopy are measured before and after aptamer immobilization and after blocking, as shown in Figure 4a and Figure 4b, respectively. The capacitance significantly decreases after aptamer immobilization. Because the 6-MCH molecules are much smaller than aptamers, they do not generate an apparent additional layer for the interfacial capacitance. Therefore, the capacitance change from the blockers is slight. As for the impedance, it increases after these functionalizations due to the smaller conductivity of these overlays. Analogically, the change from aptamers is more significant than that from blockers. In conclusion, these electrical results demonstrate good functionalization of the IDE.

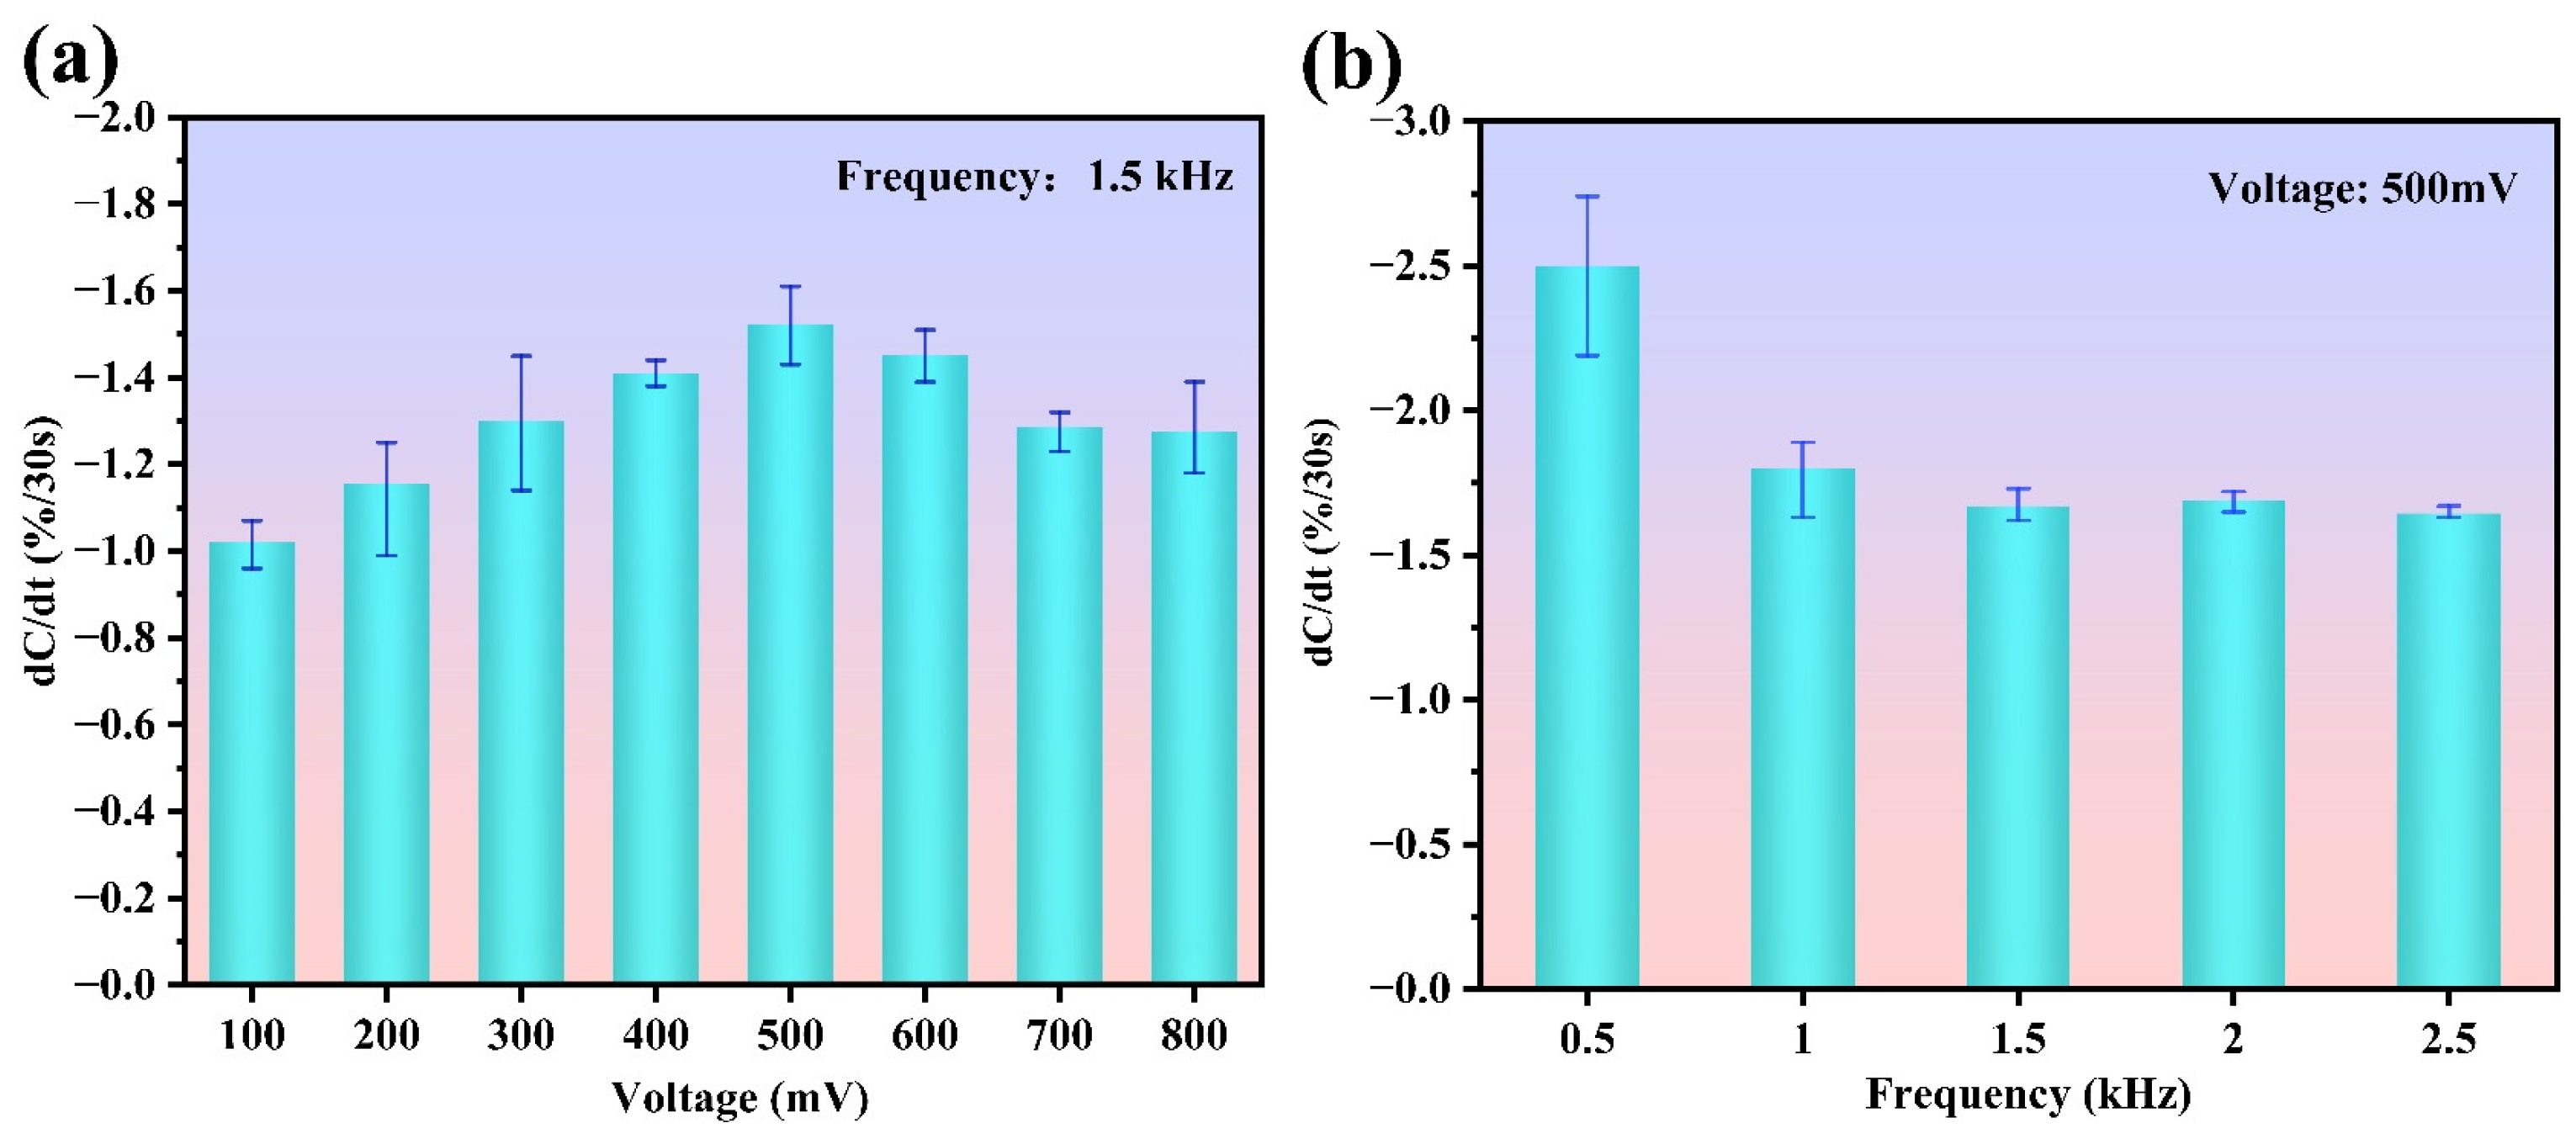
3.2. Optimization of Excitation Signal

As indicated in Equation (2), the ACET force has a strong positive correlation with the electric field. Therefore, a high applied voltage will enhance the target enrichment. However, too high a voltage may increase the possibility of premature adsorption saturation and undesired nonspecific adsorption. Under a fixed AC frequency of 1.5 kHz, a KanR standard solution of 1 fM is detected at different voltages (from 100 mV to 800 mV with a step of 100 mV). Each test is repeated three times to obtain the average response using three new sensors. In the results, as shown in Figure 5a, the response monotonically increases with the voltage from 100 mV to 500 mV. However, when the voltage is above 500 mV, the response begins to decrease due to the adsorption saturation. Thus, 500 mV is adopted as the optimized voltage.
To further determine an appropriate frequency, different frequencies (from 0.5 kHz to 2.5 kHz with a step of 0.5 kHz) are set for the KanR test, with an AC voltage of 500 mV. As shown in Figure 5b, the average response from the sensor decreases as the frequency increases. Although the sensor produces a larger response at the frequencies of 0.5 kHz and 1 kHz, the error bar is significant, indicating poor stability. Therefore, 1.5 kHz is confirmed as the optimized frequency for future detection.

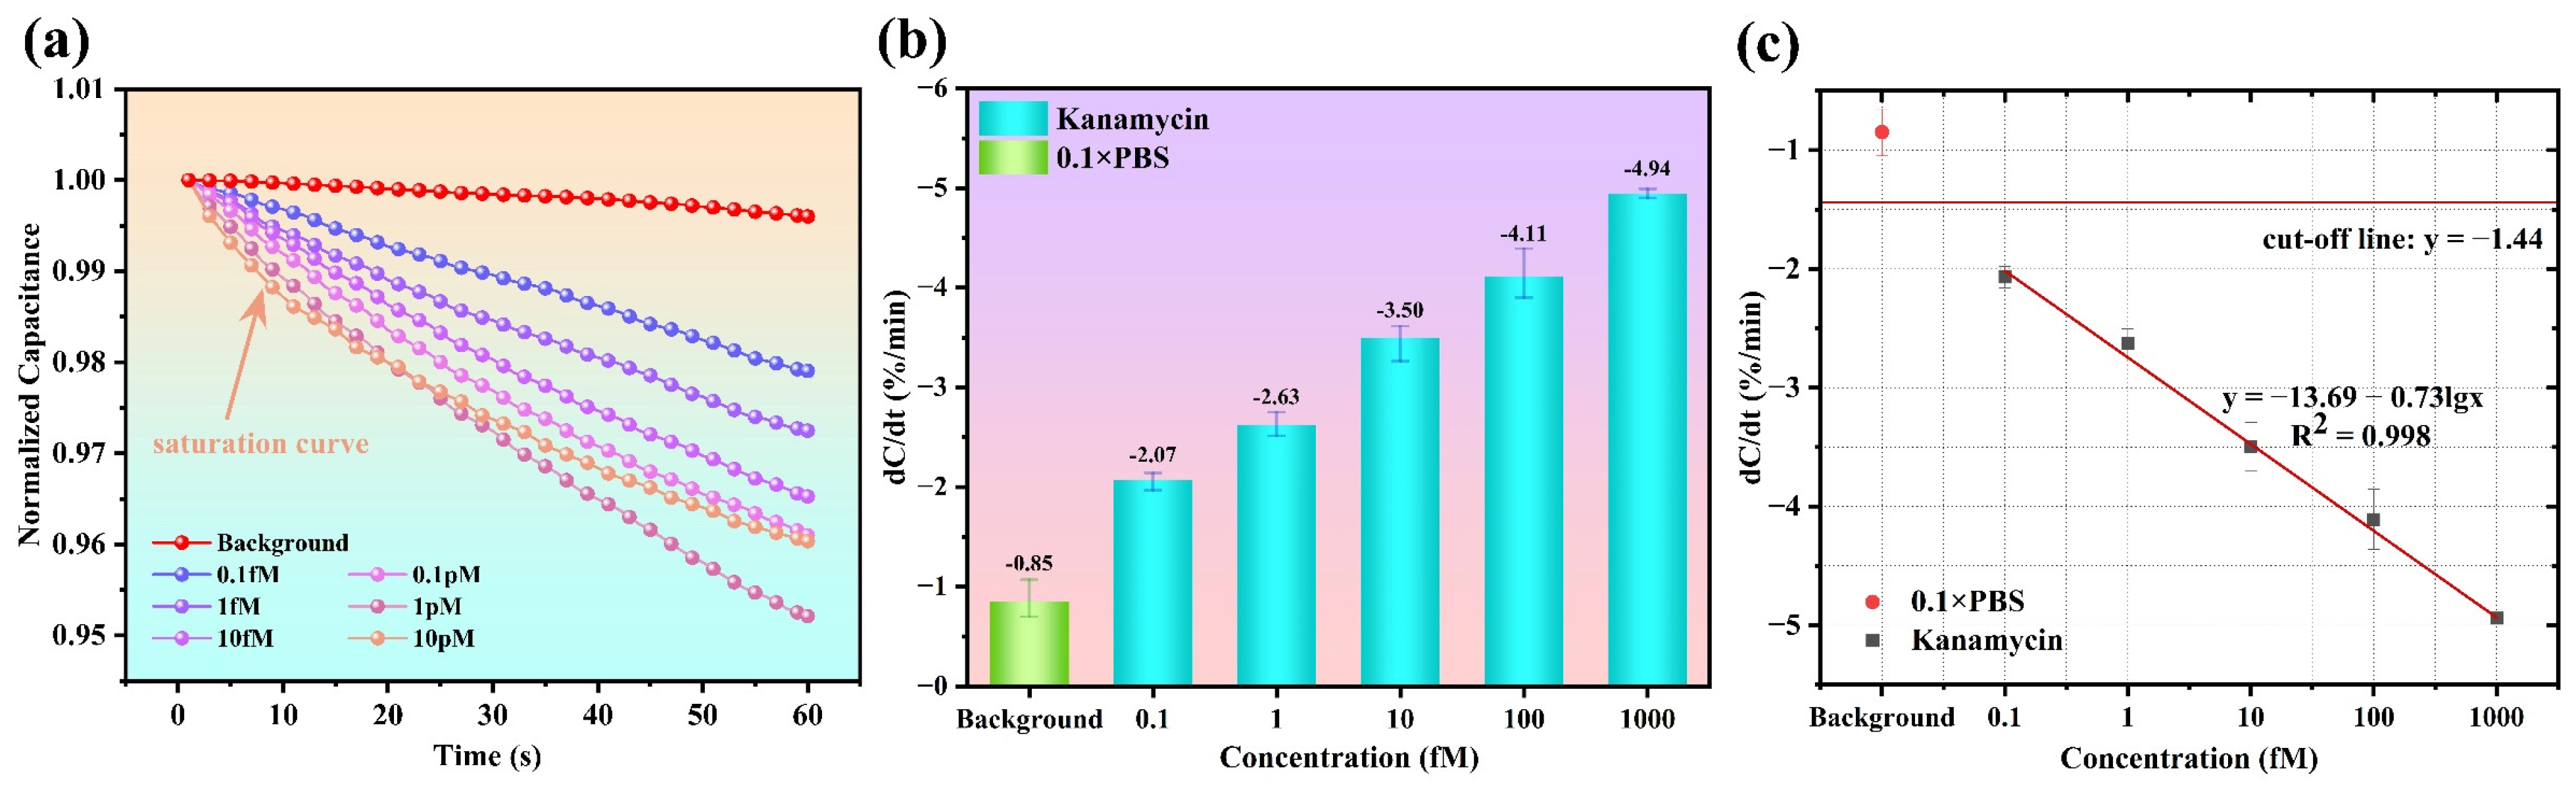
3.3. Dose Response and Sensor Calibration

Triplicate detection is performed with the 0.1× PBS background and KanR standard solutions at six concentrations, as specified. The typical normalized transient capacitance curves in 60 s are as shown in Figure 6a, exhibiting a clear distinction between different concentrations. The absolute slope of the transient curves gradually increases as the KanR concentration rises. However, when the concentration reaches 10 pM, an upswept curve is observed, indicating a saturated status at the IDE. Therefore, the linear dynamic range of this aptasensor is determined as (0.1 fM~1 pM). Additionally, the blank control of 0.1× PBS produces an almost unchanging curve.
Based on the transient curves, a series of fitted slopes can be obtained, which are just the previously defined response of dC/dt (%/min) indicating the KanR concentrations. As shown in Figure 6b, the dose responses with their standard deviations (STDEVs) are −2.0 ± 0.09%/min, −2.63 ± 0.12%/min, −3.50 ± 0.20%/min, −4.11 ± 0.25%/min, −4.94 ± 0.05%/min, and −4.30 ± 0.30%/min, corresponding to the concentrations of 0.1 fM, 1 fM, 10 fM, 0.1 pM and 1 pM, respectively.
To provide a reference for the future detection of milk samples with unknown concentrations of KanR, calibration for this aptasensor is necessary. Using the obtained responses, a linear fitting is performed using the least squares method. As shown in Figure 6c, the calibration equation is y(%/min) = −13.69 − 0.73lgx(mol/L), with the correlation coefficient of R2 = 0.998. After a cut-off line is defined as a response of that from 0.1× PBS minus three times the STDEV (towards the negative Y-axis), there is an intersection point of the calibration line and the cut-off line, with the response value known as the limit of detection (LOD), being a very low concentration of 16.56 aM.

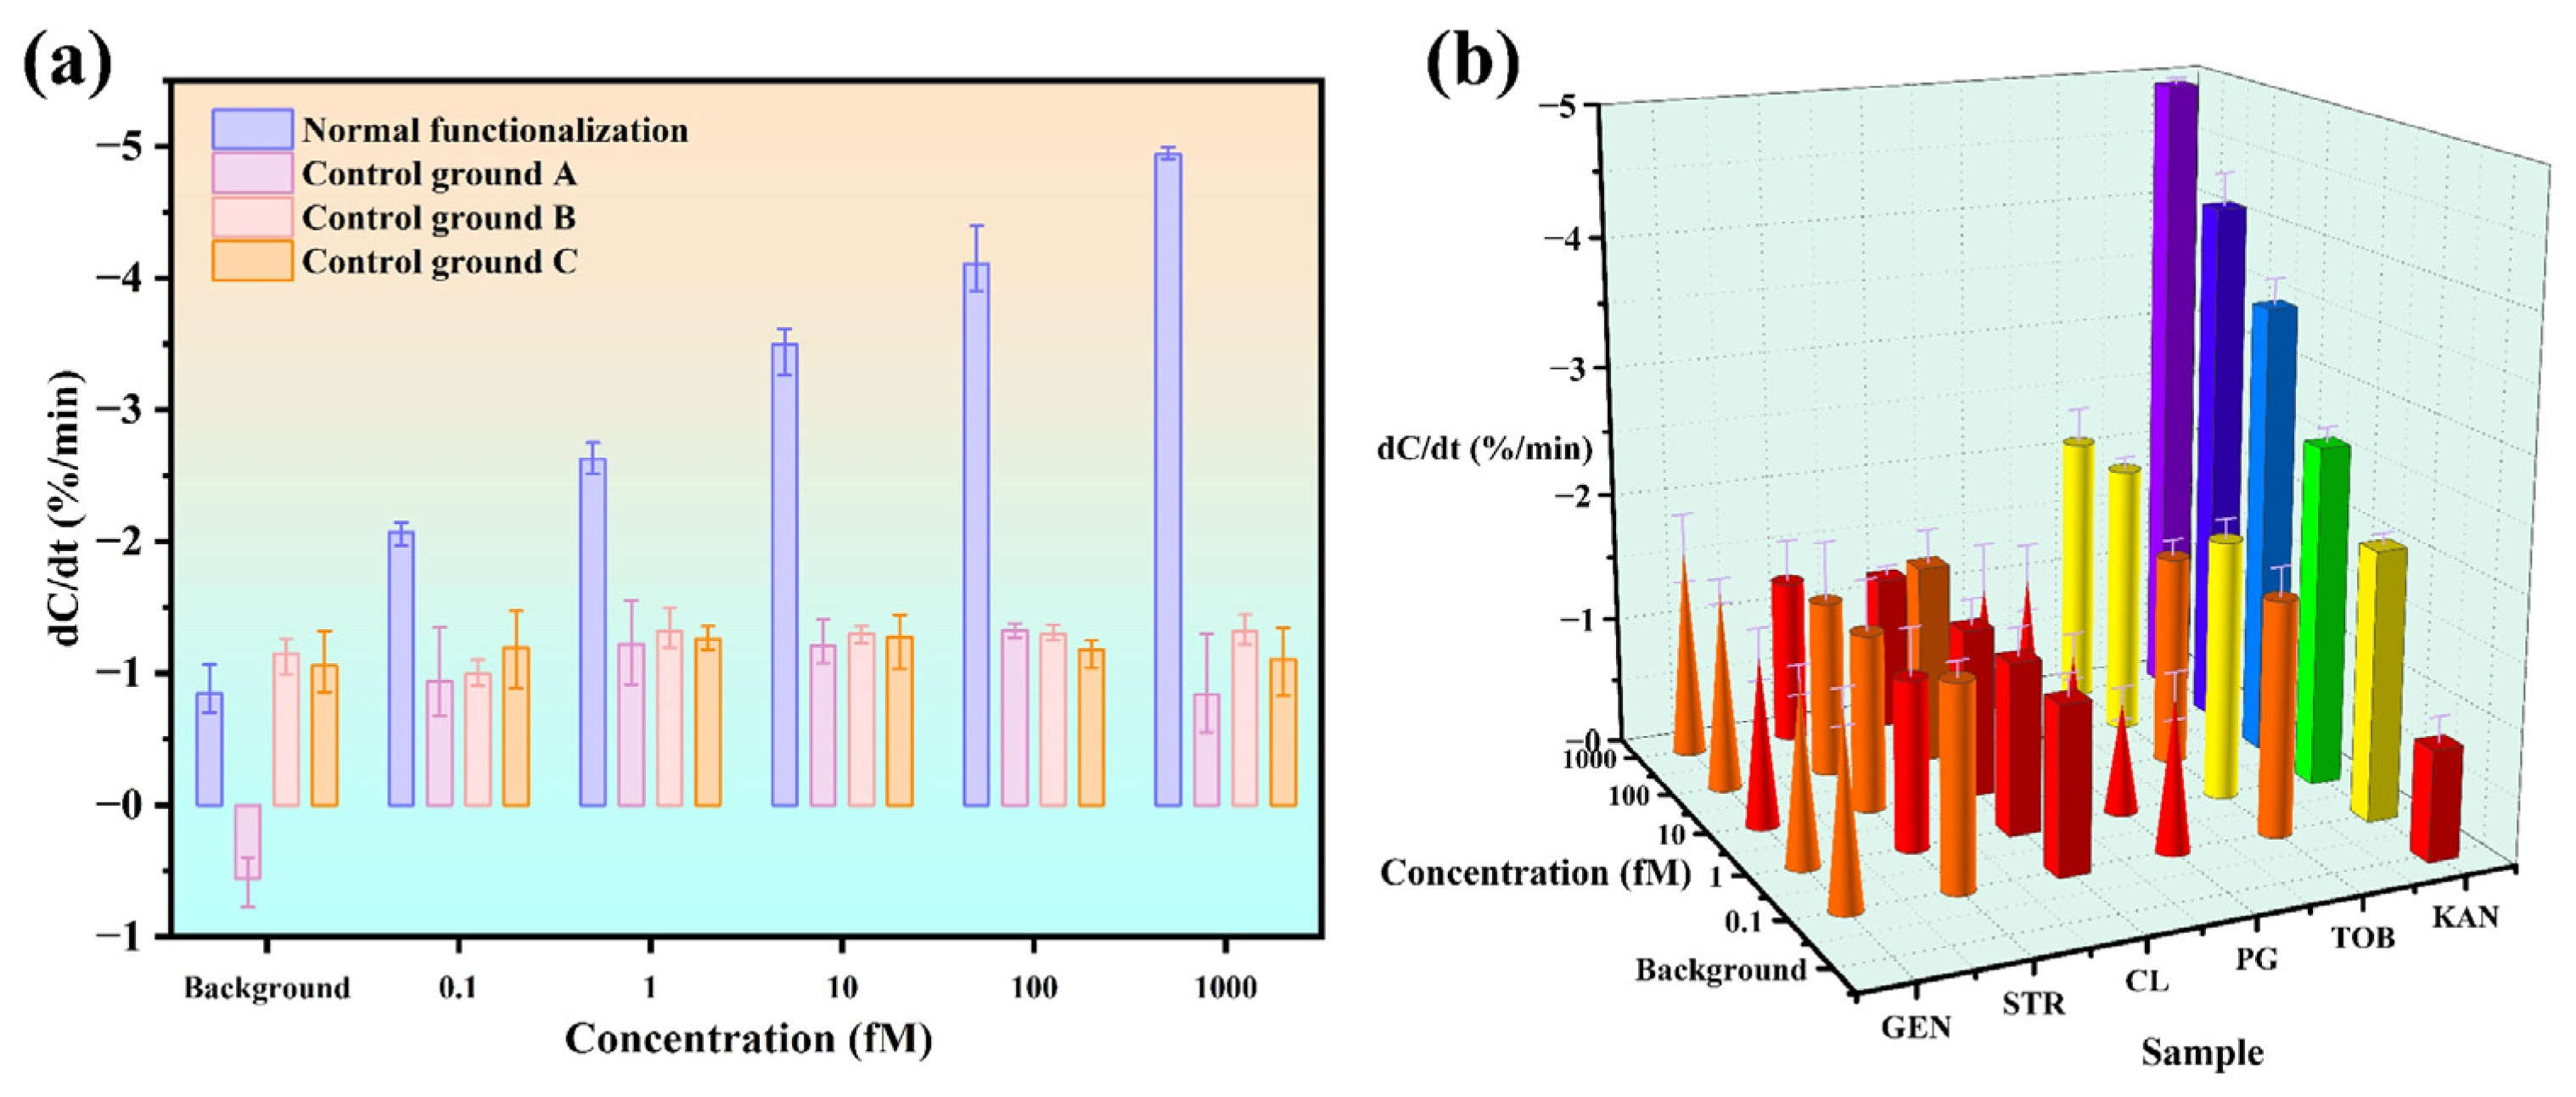
3.4. Sensor Specificity

To verify the sensor specificity, three groups of dummy sensors are prepared as controls. Group A is a set of sensors modified without a KanR aptamer but with a blocker. Groups B and C are sensors with the probes replaced by a Micro RNA-221 aptamer and a cov-N58 aptamer, respectively, ordered from Sangon Biotech Co., Ltd., Shanghai, China. Using the above three types of sensors and the sensors for KanR, standard samples of KanR in 0.1× PBS are detected. As shown in Figure 7a, the sensors for KanR show excellent dose–response, while all the dummy sensors produce similar responses to the background without any significant changes. This indicates that the aptamer for KanR is qualified and the aptasensors are successfully functionalized.
Next, common interfering proteins and antibiotics of PG, TOB, CL, STR, and GEN are tested using the aptasensors to evaluate the specificity, together with the KanR from 0.1 fM to 1 pM. It can be seen in Figure 7b that even for TOB, STR, and GEN, as the same aminoglycoside antibiotics as KanR, the responses at the highest concentration are still much lower than that from KanR at the low concentration of 0.1 fM. Among all the interferences, TOB shows the maximum response of −2.11%/min. Using the calibration equation, the same response from KanR corresponds to a concentration of 0.129 fM. Therefore, the selectivity of this sensor can be calculated as 7752:1 (1 pM:0.129 fM). According to these analyses, the aptasensor demonstrates excellent selectivity for KanR.

3.5. Repeatability and Long-Term Stability of the Sensor

Repeatability refers to the capability of a sensor to maintain consistency in repeated measurements. Although the aptasensor in this work is designed for single use, good repeatability can still reduce the cost. Due to the short detection duration, the aptamer sites might not be occupied by the targets. After setting 90% of the desired responses as the threshold, the sensors are retested. As shown in Figure 8a, when a sensor is used 5 times to detect a 0.1 pM standard sample, its response drops to 91%. Meanwhile, when detecting a 1 fM standard sample, the response remains about 91% until 8 repeated detections. These data indicate that the reusability for higher-concentration samples is worse. As an estimate, this sensor can be reused 5 times if the KanR concentration is not ultrahigh.
Long-term stability refers to the shelf life of the sensor under certain storage conditions. In this work, aptasensors of different batches are stored in a refrigerator at 4 °C, and the threshold response is also set as 90% of the desired response. On the 10th day, as shown in Figure 8b, the responses from KanR with the concentrations of 0.1 pM and 1 fM drop to 90.33% and 95.15%, respectively, which is mainly caused by the inactivation of the aptamer. Therefore, this aptasensor can maintain good performance when stored at 4 °C for about 10 days.

3.6. Application with Milk Samples

Because foods with excessive levels of antibiotics are hard to obtain, qualified skimmed milk is tested after being spiked with KanR to investigate the applicability as well as the performance of this sensor for practical samples. All the following tests are performed after dilutions with the procedure described previously. First, the milk without spiking is detected to determine the original KanR concentration of 3.13 fM. Subsequently, triplicate milks (990 mL each) are spiked with 10 mL KanR at the concentrations of 153 fM, 303 fM, and 603 fM, respectively. The three theoretical concentrations are then obtained as 4.63 fM, 6.13 fM, and 9.13 fM, respectively. Using the aptasensors, the detected KanR concentrations of the spiked samples are 4.58 fM, 6.65 fM, and 8.37 fM, respectively. According to the theoretical and detected values, the recovery of three spiked samples is calculated as shown in Table 2, from 86.90% to 116.17%, with a relative standard deviation (RSD) from 2.88% to 3.60%, demonstrating satisfactory accuracy and stability of this sensor for practical application.

4. Conclusions

Rapid and sensitive detection of antibiotics in complex matrices is of great significance to food safety. At present, most sensors or assays are still facing the challenges of real-time responding and particularly when the antibiotic concentration is low, requiring necessary pre-enrichment or extraction steps. Taking KanR as a typical antibiotic commonly found in dairy products, an aptasensor is developed integrating an ultrasensitive interfacial capacitive sensing mechanism with powerful microfluidic ACET enrichment. Thus, the sub-femtomolar LOD and 60 s turnaround time are realized simultaneously, independent of extra pretreatment except simple dilution and filtration. Owing to the ultralow LOD, a large amount of interferences can be removed in the matrices via dilution, while the concentrations for the test are still within the sensor’s dynamic range, which covers five orders of magnitude. With high specificity, low cost, and simple operation, this aptasensor is successfully applied for KanR detection in milk, demonstrating good feasibility for real sample detection. In conclusion, this aptasensor provides a competitive solution for real-time, highly sensitive, and low-cost KanR detection in food.

Author Contributions

Conceptualization, H.Q. and J.W.; methodology, J.W.; validation, W.Z. and J.C.; formal analysis, J.C.; resources, J.Z.; data curation, W.Z. and J.C.; writing—original draft, W.Z.; writing—review and editing, H.Q., J.Z. and J.W.; visualization, W.Z. and J.C.; supervision, H.Q.; project administration, J.W.; funding acquisition, H.Q. and J.Z. All authors have read and agreed to the published version of the manuscript.

Funding

This work was supported by the Natural Science Foundation of China (62074047), Open Project of Key Laboratory of Architectural Acoustic Environment of Anhui Higher Education Institutes (AAE2022KF01), Open Research Fund of State Key Laboratory of Digital Medical Engineering (2024-M04), and Wenzhou Basic Scientific Research Project (G20240024).

Institutional Review Board Statement

This study does not involve human subjects or animal study.

Informed Consent Statement

Not applicable.

Data Availability Statement

Data supporting the findings of this study are available from the corresponding author H. Qi upon request.

Conflicts of Interest

The authors declare no conflicts of interest.

References

  1. Xu, C.; Ying, Y.; Ping, J. Colorimetric aggregation assay for kanamycin using gold nanoparticles modified with hairpin DNA probes and hybridization chain reaction-assisted amplification. Microchim. Acta 2019, 186, 448. [Google Scholar] [CrossRef] [PubMed]
  2. Huang, Z.; Li, Z.; Chen, Y.; Xu, L.; Xie, Q.; Deng, H.; Chen, W.; Peng, H. Regulating Valence States of Gold Nanocluster as a New Strategy for the Ultrasensitive Electrochemiluminescence Detection of Kanamycin. Anal. Chem. 2021, 93, 4635–4640. [Google Scholar] [CrossRef]
  3. Robati, R.Y.; Arab, A.; Ramezani, M.; Langroodi, F.A.; Abnous, K.; Taghdisi, S.M. Aptasensors for quantitative detection of kanamycin. Biosens. Bioelectron. 2016, 82, 162–172. [Google Scholar] [CrossRef] [PubMed]
  4. Watkins, R.R.; Bonomo, R.A. Overview: Global and Local Impact of Antibiotic Resistance. Infect. Dis. Clin. N. Am. 2016, 30, 313–322. [Google Scholar] [CrossRef]
  5. Redwan Haque, A.; Sarker, M.; Das, R.; Azad, M.A.K.; Hasan, M.M. A review on antibiotic residue in foodstuffs from animal source: Global health risk and alternatives. Int. J. Environ. Anal. Chem. 2021, 103, 3704–3721. [Google Scholar] [CrossRef]
  6. Cui, W.; Liu, J.; Zhao, W.; Zhang, J.; Wang, Y.; Li, Q.; Wang, R.; Qiao, M.; Xu, S. An enzyme-free and label-free fluorescent aptasensor for sensitive detection of kanamycin in milk samples based on hybridization chain reaction. J. Food Compos. Anal. 2023, 120, 105300. [Google Scholar] [CrossRef]
  7. Hui, X.; Wang, Y.; Zhang, H.; Fang, W.; Liu, H.; Dai, X. Overlooked abiotic humification for kanamycin removal in kanamycin fermentation waste by tea polyphenols: New, environmentally friendly and specific. Chem. Eng. J. 2023, 478, 147377. [Google Scholar] [CrossRef]
  8. Algethami, F.K.; Rabti, A.; Mastouri, M.; Ben Aoun, S.; Alqarni, L.S.; Elamin, M.R.; Raouafi, N. Sub-femtomolar capacitance-based biosensing of kanamycin using screen-printed electrodes coated with redox-active polymeric films. Microchim. Acta 2023, 190, 434. [Google Scholar] [CrossRef]
  9. McGlinchey, T.A.; Rafter, P.A.; Regan, F.; McMahon, G.P. A review of analytical methods for the determination of aminoglycoside and macrolide residues in food matrices. Anal. Chim. Acta 2008, 624, 1–15. [Google Scholar] [CrossRef]
  10. Jiang, Y.; Sun, D.-W.; Pu, H.; Wei, Q. Ultrasensitive analysis of kanamycin residue in milk by SERS-based aptasensor. Talanta 2019, 197, 151–158. [Google Scholar] [CrossRef]
  11. Pietschmann, J.; Dittmann, D.; Spiegel, H.; Krause, H.-J.; Schröper, F. A Novel Method for Antibiotic Detection in Milk Based on Competitive Magnetic Immunodetection. Foods 2020, 9, 1773. [Google Scholar] [CrossRef] [PubMed]
  12. Su, P.; Chen, X.; He, Z.; Yang, Y. Preparation of polyclonal antibody and development of a biotin-streptavidin-based ELISA method for detecting kanamycin in milk and honey. Chem. Res. Chin. Univ. 2017, 33, 876–881. [Google Scholar] [CrossRef]
  13. Galvidis, I.A.; Burkin, M.A. Monoclonal antibody-based enzyme-linked immunosorbent assay for the aminoglycoside antibiotic kanamycin in foodstuffs. Russ. J. Bioorganic Chem. 2010, 36, 722–729. [Google Scholar] [CrossRef]
  14. Zhang, X.; Wang, J.; Wu, Q.; Li, L.; Wang, Y.; Yang, H. Determination of Kanamycin by High Performance Liquid Chromatography. Molecules 2019, 24, 1902. [Google Scholar] [CrossRef] [PubMed]
  15. Guironnet, A.; Sanchez-Cid, C.; Vogel, T.M.; Wiest, L.; Vulliet, E. Aminoglycosides analysis optimization using ion pairing liquid chromatography coupled to tandem mass spectrometry and application on wastewater samples. J. Chromatogr. A 2021, 1651, 462133. [Google Scholar] [CrossRef]
  16. El-Attug, M.N.; Adams, E.; Hoogmartens, J.; Van Schepdael, A. Capacitively coupled contactless conductivity detection as an alternative detection mode in CE for the analysis of kanamycin sulphate and its related substances. J. Sep. Sci. 2011, 34, 2448–2454. [Google Scholar] [CrossRef] [PubMed]
  17. Wang, X.; Zou, M.; Xu, X.; Lei, R.; Li, K.; Li, N. Determination of human urinary kanamycin in one step using urea-enhanced surface plasmon resonance light-scattering of gold nanoparticles. Anal. Bioanal. Chem. 2009, 395, 2397–2403. [Google Scholar] [CrossRef]
  18. Sýkorová Goffová, Z.; Kožárová, I.; Máté, D.; Marcinčák, S.; Gondová, Z.; Sopková, D. Comparison of detection sensitivity of five microbial inhibition tests for the screening of aminoglycoside residues in fortified milk. Czech J. Food Sci. 2012, 30, 314–320. [Google Scholar] [CrossRef]
  19. Michelini, E.; Roda, A. Staying alive: New perspectives on cell immobilization for biosensing purposes. Anal. Bioanal. Chem. 2011, 402, 1785–1797. [Google Scholar] [CrossRef]
  20. Chen, T.; Cheng, G.; Ahmed, S.; Wang, Y.; Wang, X.; Hao, H.; Yuan, Z. New methodologies in screening of antibiotic residues in animal-derived foods: Biosensors. Talanta 2017, 175, 435–442. [Google Scholar] [CrossRef]
  21. Majdinasab, M.; Yaqub, M.; Rahim, A.; Catanante, G.; Hayat, A.; Marty, J. An Overview on Recent Progress in Electrochemical Biosensors for Antimicrobial Drug Residues in Animal-Derived Food. Sensors 2017, 17, 1947. [Google Scholar] [CrossRef] [PubMed]
  22. Moon, J.; Kim, G.; Park, S.; Lim, J.; Mo, C. Comparison of Whole-Cell SELEX Methods for the Identification of Staphylococcus Aureus-Specific DNA Aptamers. Sensors 2015, 15, 8884–8897. [Google Scholar] [CrossRef] [PubMed]
  23. Ma, Y.; Li, X.; Li, W.; Liu, Z. Glycan-Imprinted Magnetic Nanoparticle-Based SELEX for Efficient Screening of Glycoprotein-Binding Aptamers. ACS Appl. Mater. Interfaces 2018, 10, 40918–40926. [Google Scholar] [CrossRef]
  24. Choi, J.-W.; Seo, M.; Kim, K.; Kim, A.R.; Lee, H.; Kim, H.-S.; Park, C.G.; Cho, S.W.; Kang, J.H.; Joo, J.; et al. Aptamer Nanoconstructs Crossing Human Blood–Brain Barrier Discovered via Microphysiological System-Based SELEX Technology. ACS Nano 2023, 17, 8153–8166. [Google Scholar] [CrossRef]
  25. Yazdian-Robati, R.; Bayat, P.; Oroojalian, F.; Zargari, M.; Ramezani, M.; Taghdisi, S.M.; Abnous, K. Therapeutic applications of AS1411 aptamer, an update review. Int. J. Biol. Macromol. 2020, 155, 1420–1431. [Google Scholar] [CrossRef]
  26. Dehghani, S.; Danesh, N.M.; Ramezani, M.; Alibolandi, M.; Lavaee, P.; Nejabat, M.; Abnous, K.; Taghdisi, S.M. A label-free fluorescent aptasensor for detection of kanamycin based on dsDNA-capped mesoporous silica nanoparticles and Rhodamine B. Anal. Chim. Acta 2018, 1030, 142–147. [Google Scholar] [CrossRef] [PubMed]
  27. Jesuraj, R.; Amalraj, A.; Vaidyanathan, V.K.; Perumal, P. Exceptional peroxidase-like activity of an iron and copper based organic framework nanosheet for consecutive colorimetric biosensing of glucose and kanamycin in real food samples. Analyst 2023, 148, 5157–5171. [Google Scholar] [CrossRef]
  28. Qi, X.; Zhao, Y.; Su, H.; Wang, L.; Li, L.; Ma, R.; Yan, X.; Sun, J.; Wang, S.; Mao, X. A label-free colorimetric aptasensor based on split aptamers-chitosan oligosaccharide-AuNPs nanocomposites for sensitive and selective detection of kanamycin. Talanta 2022, 238, 123032. [Google Scholar] [CrossRef]
  29. Cui, W.; Hu, C.; Zhu, R.; Qiu, D.; Gong, R.; Wang, R.; Li, Q.; Yan, T.; Li, C.; Qiao, M.; et al. Low-background fluorescent biosensor based on graphene oxide and aptamer biorecognition for sensitive detection of kanamycin. J. Food Compos. Anal. 2024, 131, 106261. [Google Scholar] [CrossRef]
  30. Wang, X.; Zhang, W.; Gao, X.; Sun, Z.; Sun, X.; Guo, Y.; Li, F.; Boboriko, N.E. Fluorescent aptasensor based on DNA-AgNCs emitting in the visible red wavelength range for detection of kanamycin in milk. Sens. Actuators B Chem. 2022, 360, 131665. [Google Scholar] [CrossRef]
  31. Gao, X.; Sun, Z.; Wang, X.; Zhang, W.; Wang, Y.; Han, J.; Sun, X.; Guo, Y.; Li, F.; Xu, S. Construction of a ratiometric electrochemical aptasensor based on graphdiyne-methylene blue and Fc-labeled hairpin for cyclic signal amplification detection of kanamycin. Sens. Actuators B Chem. 2022, 373, 132706. [Google Scholar] [CrossRef]
  32. Li, X.; Jia, M.; Yu, L.; Li, Y.; He, X.; Chen, L.; Zhang, Y. An ultrasensitive label-free biosensor based on aptamer functionalized two-dimensional photonic crystal for kanamycin detection in milk. Food Chem. 2023, 402, 134239. [Google Scholar] [CrossRef] [PubMed]
  33. Song, K.-M.; Cho, M.; Jo, H.; Min, K.; Jeon, S.H.; Kim, T.; Han, M.S.; Ku, J.K.; Ban, C. Gold nanoparticle-based colorimetric detection of kanamycin using a DNA aptamer. Anal. Biochem. 2011, 415, 175–181. [Google Scholar] [CrossRef] [PubMed]
  34. Yuan, Q.; Islam, N.; Wu, J. AC electrokinetics based capture of yeast cells from ultra-fast through-flow for sensitive detection. Micro Nano Lett. 2017, 12, 901–906. [Google Scholar] [CrossRef]
  35. Wu, J. Interactions of electrical fields with fluids:laboratory-on-a-chip applications. IET Nanobiotechnol. 2008, 2, 14–27. [Google Scholar] [CrossRef]
  36. Qi, H.; Huang, X.; Wu, J.; Zhang, J.; Wang, F.; Qu, H.; Zheng, L. A disposable aptasensor based on a gold-plated coplanar electrode array for on-site and real-time determination of Cu2+. Anal. Chim. Acta 2021, 1183, 338991. [Google Scholar] [CrossRef]
  37. Cheng, C.; Wang, S.; Wu, J.; Yu, Y.; Li, R.; Eda, S.; Chen, J.; Feng, G.; Lawrie, B.; Hu, A. Bisphenol A Sensors on Polyimide Fabricated by Laser Direct Writing for Onsite River Water Monitoring at Attomolar Concentration. ACS Appl. Mater. Interfaces 2016, 8, 17784–17792. [Google Scholar] [CrossRef]
Figure 1. Process of sensor preparation. (a) Pretreatment before the sensor functionalization. (b) Sensor functionalization including aptamer and blocker immobilization.
Biosensors 15 00322 g001
Figure 2. (ac) Capacitive sensing mechanism of the aptasensor. (d,e) Equivalent circuit of the electrode–solution system. (f) Picture of the detection system.
Biosensors 15 00322 g002
Figure 3. (a,b) SEM images and (c,d) XPS results of the sensor before and after functionalization, where the zoom-in views are in the white solid line frames corresponding to the areas within the white solid line frames.
Biosensors 15 00322 g003
Figure 4. Change of (a) capacitance and (b) impedance spectroscopy before and after aptamer immobilization and after blocking.
Biosensors 15 00322 g004
Figure 5. Optimization of (a) voltage and (b) frequency of the excitation signal for test.
Biosensors 15 00322 g005
Figure 6. (a) Sensor calibration. (b) Fit curve of the dose response. (c) Normalized transient capacitance curves from KanR of different concentrations.
Biosensors 15 00322 g006
Figure 7. Specificity of the sensor. (a) Response of functionalized and dummy sensors from KanR. (b) Response to KanR against the interferences.
Biosensors 15 00322 g007
Figure 8. Repeatability and long-term stability of the sensor. (a) Response degradation of the sensor after being reused multiple times. (b) Response degradation of the sensors after being stored at 4 °C for different days.
Biosensors 15 00322 g008
Table 1. Comparison of recent assays for KanR detection in milk.
MethodsTurnaround TimeLinear RangeLODSampleReference
Colorimetry0.02–0.1 μM8 nMMilk[27]
Colorimetry55 min25–800 nM20.58 nMTap water, Milk[28]
Fluorescence1–400 nM0.60 nMMilk[29]
Fluorescence100–1100 nM22.6 nMMilk[30]
Electrochemistry120 min50 nM–1 μM6.044 nMMilk[31]
Photonic crystal10.3 pM–10.3 μM2.3 pMMilk[32]
Capacitance1 min0.1 fM–1 pM16.56 aMMilkThis work
Table 2. Detection of KanR in milk samples.
SampleSpiked Concentration
(fM)
Theoretical Concentration (fM)Detected Concentration
(fM)
Recovery (%)RSD (%, n = 3)
Skimmed milk1.534.634.5894.772.88
3.036.136.65116.173.60
6.039.138.3786.902.94
Disclaimer/Publisher’s Note: The statements, opinions and data contained in all publications are solely those of the individual author(s) and contributor(s) and not of MDPI and/or the editor(s). MDPI and/or the editor(s) disclaim responsibility for any injury to people or property resulting from any ideas, methods, instructions or products referred to in the content.

