Review

Comprehensive Analysis of Advancement in Optical Biosensing Techniques for Early Detection of Cancerous Cells

Department of Electrical and Electronics Engineering, Ariel University, Ariel 40700, Israel
*
Author to whom correspondence should be addressed.
Biosensors 2025, 15(5), 292; https://doi.org/10.3390/bios15050292
Submission received: 28 March 2025 / Revised: 27 April 2025 / Accepted: 30 April 2025 / Published: 5 May 2025
(This article belongs to the Special Issue Fiber Optic Biosensors: Advancements and Applications)

Abstract

:
This investigation presents an overview of various optical biosensors utilized for the detection of cancer cells. It covers a comprehensive range of technologies, including surface plasmon resonance  ( S P R )  sensors, which exploit changes in refractive index  ( R I )  at the sensor surface to detect biomolecular interactions. Localized surface plasmon resonance  ( L S P R )  sensors offer high sensitivity and versatility in detecting cancer biomarkers. Colorimetric sensors, based on color changes induced via specific biochemical reactions, provide a cost-effective and simple approach to cancer detection. Sensors based on fluorescence work using the light emitted from fluorescent molecules detect cancer-specific targets with specificity and high sensitivity. Photonics and waveguide sensors utilize optical waveguides to detect changes in light propagation, offering real-time and label-free detection of cancer biomarkers. Raman spectroscopy-based sensors utilize surface-enhanced Raman scattering  ( S E R S )   to provide molecular fingerprint information for cancer diagnosis. Lastly, fiber optic sensors offer flexibility and miniaturization, making them suitable for in vivo and point-of-care applications in cancer detection. This study provides insights into the principles, applications, and advancements of these optical biosensors in cancer diagnostics, highlighting their potential in improving early detection and patient outcomes.

Graphical Abstract

1. Introduction

Cancer is among the most fatal diseases infecting human beings of the 21st century. The modern understanding of cancer began to develop in the 19th century with pivotal advancements in medical science, including the development of cell theory and innovations in anesthesia and antiseptic techniques that revolutionized surgery. The discovery of X-rays in 1895 and the development of radiation therapy, along with the emergence of chemotherapy in the 1940s, marked early milestones in non-surgical cancer treatments. The latter half of the 20th century was defined by breakthroughs in molecular biology, most notably the discovery of  D N A s  structure in 1953, which paved the way for identifying genetic mutations responsible for cancer [1,2,3]. This era also saw the advent of hormone therapy, immunotherapy, and the concept of targeted therapy, proceeding to complete the human genome project by 2003, which heralded the age of precision medicine offering treatments tailored to the genetic profile of individual cancers [4]. Despite all of these advancements, cancer remains one of the leading causes of disease and death worldwide, with early and accurate detection playing a critical role in improving patient outcomes. Traditional diagnostic methods such as imaging and biopsy are effective but often suffer from limitations including invasiveness, high costs, and delayed results. In recent years, the demand for rapid, sensitive, and non-invasive diagnostic technologies has attracted significant research into biosensing approaches. Among these, optical biosensors have gained a lot of popularity due to their ability to detect cancer-related biomarkers or circulating tumor cells ( C T C s ) with high sensitivity and specificity [5].
The 21st century has been characterized by significant advances in immunotherapy, such as checkpoint inhibitors and  C A R T  cell therapy, alongside ongoing research aimed at understanding cancer’s molecular underpinnings, improving treatment, reducing toxicity, and preventing cancer through lifestyle interventions and vaccines. This rapid evolution of cancer understanding and treatment over the past two centuries reflects a transition from rudimentary knowledge to a sophisticated, genetics-based approach that continues to offer new hope for effective cancer management and a cure [6,7,8]. However, when these regulatory processes fail, cells can begin to grow uncontrollably, leading to the formation of tumors or malignancies. Not all tumors are cancerous; for instance, benign tumors do not spread to other body parts. Malignant tumors, also known as cancerous tumors, can infiltrate surrounding tissues and disseminate into different parts of the body through the bloodstream, lymphatic system, cells, etc.; this process is referred to as metastasis. The precise origins of cancer typically involve a combination of factors, including genetic mutations, environmental influences, lifestyle decisions, e.g., smoking, dietary habits, etc., and contact with specific chemicals or radiation [9,10].
The management and outlook of cancer differ significantly based on its variety, stage, and other personal considerations. Treatment options may encompass surgical intervention, radiation therapy, chemotherapy, immunotherapy, and therapies that target specific aspects of cancer cells [11,12]. In 2020, cancer was a leading cause of mortality worldwide, claiming more than 10 million lives [13]. Cancer has various types; lung and breast cancers are notably prevalent across both genders. The most frequently identified cancers include carcinoma, lymphoma, leukemia, sarcoma, and melanoma, each capable of originating in different human organs [14]. Figure 1 presents the classification of various types of cancers infecting humans. Gender-neutral cancers are considered those cancer types that can affect both males and females. Factors such as radiation, over-aging, viral infections, prolonged exposure to the sun, smoking, hormone therapies, and exposure to certain chemicals are well-recognized contributors to cancer development [15].
Common methods for diagnosing cancer include mammography [16], biopsies of tissue [17], magnetic resonance imaging  ( M R I )  [18], enzyme-linked immunosorbent assays  ( E L I S A )  [19], polymerase chain reaction  ( P C R )  [20], sonography [21], and breast imaging based on molecules [22]. However, tissue biopsy, a standard diagnostic procedure, is not without its risks and is impractical for certain locations within the body [23]. Monitoring cancer progression and obtaining samples often necessitate surgical interventions. The typical protocols for detecting cancer face numerous challenges, including the need for skilled professionals, the requirement of large volumes of bodily fluids, expensive, complex equipment, and time-consuming processes [24]. Additionally, these diagnostic methods need millions of cells for an accurate diagnosis, which hampers early detection efforts. In response, researchers are working to create diagnostics that are more sensitive, quicker, and easier to use, aiming to overcome these limitations. Table 1 presents a summary of information on distinct methodologies that are used to detect a particular form of cancer in human beings.
Optical biosensors play a crucial role in cancer diagnostics by enabling the detection of specific biomarkers, deoxyribonucleic acid ( D N A ) , ribonucleic acid ( R N A ), proteins, or whole tumor cells present in body fluids such as blood, saliva, cell fluid, or urine [45]. These sensors operate based on the interaction of light with biological elements, offering real-time monitoring, high sensitivity, and label-free detection capabilities. Optical sensing technologies have been extensively employed to recognize cancer-associated analytes at very low concentrations. Their ability to provide quantitative and qualitative information with minimal sample preparation makes them highly suitable for early-stage cancer detection [46].
Recent advancements in biosensing technology have focused on improving sensitivity, selectivity, and portability. Innovations in nanomaterials such as gold nanoparticles ( A u N P s ), graphene, and quantum dots have significantly improved signal amplification and detection accuracy for optical biosensors. Miniaturization through microfluidic integration has enabled point-of-care testing ( P O C T ) with minimal sample volumes. Additionally, combining optical sensing platforms with data analytics and machine learning has improved interpretation and real-time decision-making [47,48]. These developments have made optical biosensors more reliable and applicable in early cancer diagnostics and continuous health monitoring.
Optical biosensors have tremendous potential to be used for several applications related to health monitoring and early detection. In cancer detection and identification, they have also proven to be used as important medical devices. These sensors can be used in various other application areas related to food quality, environmental analysis, industrial applications, military applications, etc. However, this work focuses exclusively on their applications in cancer detection. Optical biosensors offer a non-invasive alternative to current cancer diagnosis methods. These devices utilize a biomarker to identify the target molecule, a bio-receptor for recognition, and a physicochemical transducer to detect the interaction. Optical biosensors typically rely on cancer-related biomaterials like  m i c r o R N A s , proteins, circulating tumor cells,  D N A , and exosomes  ( E X O s ) , which can be derived from human body fluids [49,50,51,52]. Figure 2 presents various medical applications of optical biosensors by using human body fluids as a noninvasive investigating analyte for disease identification.
Several optical biosensor-based setups have already been translated into practical applications for early cancer detection to date. Some of the prominent one include the Biacore  S P R  platform, which is widely used for biomolecular interaction analysis, including cancer biomarker detection in pharmaceutical and clinical research [53]. Veristrat system, a serum-based proteomic test, utilizes mass spectrometry and optical sensing for non-small cells related to lung cancer classification and treatment guidance [54]. Oncocyte’s DetermaDx are emerging optical biosensor kits designed for liquid biopsy approaches, detecting circulating tumor-derived nucleic acids from blood samples [55]. These platforms demonstrate the growing role of optical biosensing in non-invasive, rapid, and accurate cancer diagnostics.
This study presents an exhaustive analysis of various optical sensing techniques, optical sensors, specific biomarkers, binding materials, plasmonic materials, etc., used to detect and identify cancerous cells in the human body. In addition to this, the article presents details regarding various types of photonic crystal fiber  ( P C F ) , fiber Bragg gratings, waveguide structures, and resonance-based sensing methods such as localized surface plasmon resonance  ( L S P R )   and surface plasmon resonance  ( S P R )  specifically for cancer cell detection and early prediction.

2. Classification of Optical Biosensors

Optical biosensors have revolutionized the field of detection and analysis, offering a range of techniques suited for various applications. One of the prominent applications includes the identification and detection of cancerous cells. Among the diverse types of optical biosensors  S P R   sensors detect alteration in the refractive index  ( R I )  near a sensor’s surface, making them invaluable in biomolecular interaction analysis [56,57,58,59]. Similarly,  L S P R  based sensors analyze the localized oscillations of conduction electrons at the nanoscale, offering enhanced sensitivity for detecting molecular changes [60,61,62]. Colorimetric sensors, which change color in response to analyte interaction, offer a simple and direct method of visual detection, making them highly accessible for various applications [63,64,65]. Fluorescence-based sensors are distinguished by their ability to emit light upon excitation, providing high specificity and sensitivity for targeted molecule detection [66,67,68]. Photonics and waveguide sensors utilize the principles of light guidance and manipulation to detect changes in light properties or interaction with materials, offering a platform for high-throughput screening [69,70,71]. Finally, Raman spectroscopy-based sensors leverage the Raman scattering effect to provide detailed information about molecular vibrations, enabling precise chemical identification [72,73,74]. Interferometric sensors, employing the principle of optical interference, offer ultrasensitive detection capabilities, making them ideal for measuring minute changes in biological samples. Fiber-optic sensors, known for their flexibility and remote sensing capabilities, utilize light modulation within optical fibers  ( O F )  to detect changes in the external environment, offering a robust solution for in-situ monitoring [75,76,77]. Lastly, together, these optical sensors provide a comprehensive toolkit for advanced detection and analysis in various scientific and medical fields. Thus, this study presents details regarding the procedure to use body fluid liquid as analyte, preparation for biomarker testing, molecular testing, etc., that can be merged with optical sensors for cancer detection and identification.
Types of optical sensors are listed as follows.
  • S P R   sensors [39,40,41].
  • L S P R  sensors [60,62].
  • Colorimetric sensors [63,64,65].
  • Fluorescence-based sensors [66,67,68].
  • Photonics and waveguide sensors [69,70,71].
  • Raman spectroscopy-based sensors [72,73,74].
  • Fiber optic sensors [75,76,77].

3. Advanced Optical Biosensors Technologies and Applications

3.1. Classification of SPR Sensors

S P R  involves the interaction between a surface plasmon wave  ( S P W )  and electromagnetic wave, also referred to as a surface plasmon polariton  ( S P P ) , occurring at the boundary between a metal and a dielectric medium. The  S P W  is characterized as a transverse magnetic  ( T M )  polarized electromagnetic wave, exhibits evanescent decay into adjacent media. Its magnetic vector stands perpendicular to the propagation direction while remaining parallel to the plane of the interface.  S P R  occurs when there is a resonance between the frequencies and parallel components of an incident  T M  polarized electromagnetic wave and the  S P W . This phenomenon is observed in attenuated total reflection setups within a prism-coupling configuration.  S P R  enables the energy transfer from incoming photons to surface plasmons  ( S P s ) , resulting in a reduction in the energy in the reflected light. Initially observed on the Otto configuration with a silver  ( A g )  film by Otto, it was later refined by Kretschmann. The Kretschmann and Otto configuration exemplifies the principles underlying  S P R , as presented in Figure 3 [78].
Based on Maxwell’s equations and associated boundary conditions, the propagation constant  k s p  for an  S P W  traversing the boundary between a metal and a semi-infinite dielectric material can be determined via Equation (1). Here,  ε s  represents the dielectric constant of the dielectric material,  ε m   denotes the dielectric constant of the metal,  ω  is the frequency of the incident wave, and  c  stands for the speed of light [79].
k s p = ω c ε m ε s ε m + ε s
In the context of the Kretschmann configuration, the propagation constant of the evanescent field, which is parallel to the metal surface, is detailed in Equation (2) [79].
k e v = ω c ε 0   s i n θ
The  S P R   phenomenon occurs when the frequency of the evanescent field matches the  S P W  frequency. This is expressed in Equation (3), where  θ r e s  is called the resonance angle [79].
ω c   s i n θ r e s = ω c ε m ε s ε 0 ( ε m + ε s )
Thus, in the Kretschmann configuration, a metal film is deposited onto a dielectric substrate, which is typically a glass prism. This setup allows light to hit at an angle above the critical threshold for total internal reflection  ( T I R ) ,  creating an evanescent wave in the metal film that couples with  S P s  at the metal–dielectric boundary. Contrastingly, the Otto configuration involves sandwiching a metal film between two dielectric layers, with incident light typically directed onto the upper dielectric layer. Both configurations facilitate  S P R   observation, but the Kretschmann setup is more relevant due to its higher sensitivity and widespread application in biosensing, while the Otto configuration offers advantages in certain scenarios, such as simpler fabrication processes and reduced sensitivity to changes in the surrounding medium’s  R I .
Another type of  S P R -based sensor is designed using  P C F . They are also known as micro-structured or holey fibers. There are types of  O F  having a periodic array of air holes along the length of the fiber. Unlike traditional  O F , which rely on  T I R P C F s  guide light via structural dispersion through their micro-structured cross-section [80,81]. This unique construction allows for the tailoring of optical properties, such as dispersion, nonlinearity, and the guiding of light in air or vacuum-filled cores.  S P R  occurs when light triggers the collective oscillation of electrons at the boundary between materials with negative and positive permittivity, typically at a metal-dielectric boundary.
This resonance condition is highly sensitive to changes in the   R I   near the metal surface, making  S P R  an effective sensing mechanism for detecting chemical and biological analytes [82,83]. Combining  P C F s  with  S P R  leads to highly sensitive and selective sensors.  P C F -based  S P R  sensors utilize the unique guiding properties of  P C F  to expose the evanescent field of light propagating within the fiber to an external medium. By coating parts of the  P C F  with a thin layer of plasmonic metals, the evanescent field can interact with  S P s  on the metal surface. This interaction is sensitive to changes in the  R I  of the surrounding medium, which can be used to detect various analytes with high precision.  P C F   S P R  sensors can be designed using several geometries, but the main challenge is the real-time fabrication of the fiber. As for  P C F  fabrication, high-end equipment and machinery are required [84,85]. Thus, currently, the  P C F   S P R  sensors are mostly limited to theoretical design and analysis.  P C F   S P R  sensors are designed using three design procedures, which include internal metal deposition  ( I M D ) , external metal deposition  ( E M D ) , and the  D -shaped designing method; in addition to these traditional approaches,  P C F  can also be fabricated using the slotted-shaped approach [86]. In  I M D -shaped  P C F   S P R  sensors’ liquid analyte is passed from inside the  P C F .  Different air-hole geometries are possible, which assists in the interaction of the analyte with the  P C F .  Figure 4 represents a variety of  P C F   S P R  sensor models based on different design approaches. Figure 4a represents the  I M D -shaped  P C F   S P R  sensor with x-pol. and y-pol. being polarized core modes [87]. Figure 4b represents a  P C F   S P R  sensor model based on the  E M D  design methodology. In  E M D -shaped  P C F   S P R  sensors, the analyte channel is present at the exterior surface of the fiber body, having coats of plasmonic materials that assist in the generation of the  S P P  at the metal–dielectric interface [88]. Figure 4c represents the  D -shaped  P C F   S P R  sensor model.  D -shaped  P C F   S P R   sensor models possess a coat of plasmonic materials on a polished flat surface. The polished surface needs to be designed with extreme care as, during polishing, there is always a possibility of disturbing the air-hole geometry [89]. In recent times, researchers have come up with a novel model of  P C F   S P R  sensors in which they merge two different design techniques to develop a new sensor design methodology. In this quest, Figure 4d represents a  P C F   S P R  sensor model that achieves a merger of the  I M D  and  E M D  design methodology in the single  P C F   S P R  sensor for transformer oil sensing [86]. Similarly, Figure 4e represents a novel design of the  P C F   S P R  sensor model with a merger of quasi- D -shaped  P C F  and an  E M D  technique for heavy-metal sensing [59].
As suggested above, a variety of plasmonic materials are used in the sensor models, which include gold  ( A u ) A g , aluminum  ( A l ) , indium tin oxide  ( I T O ) , titanium dioxide  ( T i O 2 ) , graphene, etc. [82]. Innovation and exploration are also performed to identify various substitutes for expensive plasmonic materials, and researchers have identified materials like transition-metal dichalcogenides  ( T M D C s )  [90], transparent conductive oxides  ( T C O s )  [91], magnesium fluoride  ( M g F 2 )   [92], MXenes [93], perovskites [94], silicene [91], phosphorene [91], etc. Infiltrating the  P C F   S P R  surface can be achieved through various methods, such as sputtering, evaporation, or electroless plating [95]. A further analyte is infiltrated in the  P C F  surface to enhance the interaction between the guided light and the analyte in order to achieve these objective methods; for instance, precision injection and capillary forces are used. Plasmonic materials can be deposited over the  P C F  using a number of techniques, among which chemical vapor deposition  ( C V D )  is considered the most prominent [96]. Several imaging techniques can be used to obtain a sophisticated image of the designed  P C F   when fabricated. These techniques include transmission electron microscopy  ( T E M )  [97], scanning electron microscopy  ( S E M )   [98], atomic force microscopy  ( A F M )  [99], optical microscopy [100], etc.
The real-time fabricated  P C F   with different design configurations is presented in Figure 5. Figure 5a,d,f represent fabricated  P C F  with a hexagonal lattice of air-hole geometry; see [101,102,103], respectively. Figure 5b represents fabricated  P C F  with six air holes, and Figure 5c represents fabricated  P C F  with a hexagonal lattice of air holes, [104,105], respectively. Figure 5e represents an  S E M  image of a slotted  P C F  [106]. Figure 5g represents an  S E M  image of a fabricated fiber with an ultrathin core [106], finally, Figure 5h represents an  S E M  image of a fabricated hexagonal honeycomb  P C F   model [107]. Thus,  P C F   S P R  sensor models presented in the literature for different applications can be fabricated, but only with the assistance of high-end machinery and equipment.
P C F   S P R  sensors can be used significantly for cancer detection. Ramola et al. [6], in Figure 6a, represent the  P C F   S P R   sensor based on the  E M D   approach. Cancerous cells named squamous cells, basal cells, HeLa, INBL, CaSki (HIC), Jurkat, JM (JJM), PC12, MDA-MB-231 (MM231), and MCF7 related to skin, cervical, blood, adrenal gland, and breast cancer (Types 1 and 2), are identified from their proposed sensor. A dual-mode investigation corresponding to  T M   polarization (x-pol.) and transverse electric ( T E ) polarization (y-pol.) is performed. A high wavelength sensitivity  ( W S )  of 12,857.14 nm RIU−1, an amplitude sensitivity  ( A S )  of 15,010 RIU−1, and a sensor resolution  ( S R )  in the order of 10−6 is obtained from the proposed biosensor. Ibrahimi et al. [108] in Figure 6b present a dual-core  P C F   S P R  biosensor with a triple coat of  A u / T i O 2 /graphene as a plasmonic material. Cervical, blood, adrenal gland, and breast cancer (Types 1 and 2) are detected from the proposed biosensor. The highest  W S   of  5714.29   nm   R I U 1 A S  of  599.33   R I U 1 , and  S R  in the order of  10 5   R I U  are obtained from their proposed biosensor. Yasli [109], in Figure 6c, presents a novel model of a  P C F   S P R   sensor for cancer cell detection with a slot inside the background material of the  P C F . The biosensor model has a coat of  A u   for   S P W  generation. The biosensor is built using the finite element method  ( F E M ) -based approach. Six different cancers have been detected using their sensor model. The highest  W S  of  7142.86   nm / R I U  and  A S  of  757   R I U 1  is obtained from the biosensor model. Pappu et al. [110], in Figure 6d, present an  A u -coated,  H -shaped biosensor model for cancer cell identification. The proposed biosensor investigates skin cancer, cervical cancer, and breast cancer cells. The maximum  W S  obtained from the proposed biosensor is  7857.14   nm   R I U 1 , with an  A S  of  985.26   R I U 1   and an  S R   in the order of  10 5   R I U , respectively. Mollah et al. [111], in Figure 6e, present a  P C F   S P R  sensor based on a hexagonal lattice of air holes for blood cancer detection. The stacked preform of the proposed sensor model is also presented. They obtained a  W S  of  8571.43   nm / R I U  from their designed sensor model. Similarly, several  P C F   S P R   sensor models can be designed based on different design approaches and can be used effectively for cancer detection. In addition to these popular SPR techniques, the SPR phenomenon is also used in the following sensor technologies.
Waveguide-based SPR sensors: These integrate waveguides with SPR techniques, through which plasmons are excited along the metal-coated waveguide. They are compact and useful for integrated lab-on-a-chip systems [112,113,114,115].
Grating-based SPR sensors use a diffraction grating instead of a prism to excite  S P s . These are advantageous for their simplicity, possess potential for large-scale development, and offer cost-effective production [116,117,118,119].
Photodetector-based SPR sensors combine SPR technology with photodetectors to measure the intensity of plasmonic light directly, offering compact solutions for portable sensing systems [120,121,122].
SPR imaging (SPRI): an advanced technique through which the reflected SPR signal is captured as an image, enabling high-throughput sensing and an analysis of multiple samples simultaneously [123,124,125,126].

3.2. Classification of LSPR Sensors

L S P R  sensors represent a specific subset of plasmonic sensing technologies, offering high sensitivity in the detection of various analytes at the nanoscale. These sensors utilize the resonance of  S P s  localized on metallic nanoparticles  ( N P s )  when they are excited through light. The  L S P R  phenomenon is extremely sensitive to variations in the dielectric properties close to the  N P s  surface, rendering it an efficient method for identifying chemical and biological materials [127,128,129]. In  L S P R , phenomenon-coherent oscillations of electrons occur at the boundary between metallic  N P s  and the surrounding dielectric medium. Unlike  S P R , which occurs in continuous metal films,  L S P R  is characterized by its confinement to nanostructures. The resonance frequency of these plasmons is highly responsive to the dimensions, configuration, and composition of the  N P s , as well as to the  R I  of the surrounding medium. The binding of analytes to the  N P s  surface causes a shift in the resonance frequency, which can be detected optically [60].  A u  and  A g N P s  are commonly used due to their strong plasmonic responses [130]. The choice of the material, size, and shape of the  N P s  can be tailored to optimize the sensor for specific applications.  N P s  can be immobilized on various substrates or dispersed in a solution. The substrate material and design play a prominent role in the sensor’s performance. These  L S P R  sensors have shown promising potential for cancer detection, leveraging their high sensitivity to molecular interactions for the identification of cancer biomarkers. These biomarkers can be proteins,  D N A  mutations, or other molecules associated with cancerous cells.  L S P R   sensors detect these biomarkers by monitoring changes in the  R I  near the sensor surface, which affects the resonance condition of  S P s   on metallic  N P s . To enhance selectivity for specific cancer biomarkers, the surface of the  N P s  is often modified with recognition elements, such as aptamers, antibodies  ( A b s ) , or peptides, that have a high affinity for the target biomarkers [131,132]. Cancer detection often requires the simultaneous detection of multiple biomarkers, and  L S P R  sensors are designed for multiplexed detection. By functionalizing different areas of the sensor surface with different recognition elements, they thus act as a promising tool for cancer detection [128,133,134]. Na et al. [135] in Figure 7a illustrates the approach to enhancing the detection of  m i R N A s  using  3 D  nanostructures on  A u  strips, which can be used to attract cancer biomarkers in the signal-amplification process for  m i R N A  detection. Three-dimensional plasmonic  A u  nanostructures are designed; they involve roll-to-roll nanoimprint lithography  ( R 2 R   N I L )  and subsequent  A u  deposition. The  A u  strips were produced through thermal evaporation at a  35 °  angle onto polyurethane acrylate  ( P U A )   nanograting, which was fabricated using  R 2 R   N I L  with a polydimethylsiloxane mold, achieving a  200   nm   spacing and  100   nm -high nanograting pattern. In the evaluations, these  A u  strips demonstrated a capacity for high-throughput analysis, and due to their flexible and transparent  3 D   nanostructure, they offered several advantages for straightforward incorporation into various point-of-care  ( P O C )  and lab-on-a-chip diagnostic tools. Moreover, the  A u   nanostructures achieved via   A u  deposition on both the top and sidewalls of the  P U A  nano-gratings at a controlled oblique angle facilitated the creation of  S P s  with a longer oscillation length. This configuration is recognized for its superior sensitivity to changes in the  R I , surpassing that of rectangular rod-shaped  A u  structures deposited solely on the top. Therefore, through this signal amplification approach implemented on the  A u  nanostructure sensitive detection of the target in a buffer solution by generating reproducible signals with a distinct  L S P R  shift is achieved. Takemura et al. [126] presented an  L S P R -based sensing setup with the potential to detect various viruses via biomarkers based on changes in the local  R I  at the nanoscale as an optical phenomenon. The approach used to assemble  L S P R  sensors mirrors that of  S P R   sensors. It is crucial to alter the material for efficient target capture via nanomaterials while preserving the  N P s ’ structural integrity. The displacement in the plasmon resonance peak due to the  L S P R  from plasmonic particles depends upon virus attachment, which serves as a highly sensitive indicator [136,137].
Kim et al. [138] present an optical absorbance peak-shift methodology in Figure 7b in which they crafted a design where a virus is encapsulated between two differently sized  A u N P s  on a substrate enriched with  A u N P s . In their configuration, two closely situated  A u N P s  exhibit repulsion in a plasmonic resonance condition when a virus is present, leading to a more pronounced peak shift than in configurations without the sandwich structure. The signal amplification resulting from this sandwich architecture was validated, achieving a sensitivity enhancement by a factor of 100 compared to cases where the virus is only captured on an  A u N P s-rich substrate. Additionally, the sensitivity within the sandwich framework varies with the size of the  A u N P s  at the site of the secondary antibody. Smaller particles yield a stronger signal, even at lower concentrations of the sample. Their investigation highlights the critical role of particle size in enhancing  L S P R -based system development for specific applications. The metallic  N P s  can be synthesized through various physical and chemical methods, including electrochemical processes, vapor deposition techniques, the decomposition of organometallic compounds, seed-mediated growth, photochemical reduction, and reducing metal salts in the presence of stabilizers. These stabilizers determine the shape and size of the  N P s . The unique shapes of these nanostructures, such as nanocages, nano-prisms, and aggregates, display diverse colors or spectra due to their complex, non-degenerate properties. Thus, through this detection methodologies, various cancer biomarkers can be identified and detected.
Abdi et al. [132] explore an  L S P R -based sensor presented in Figure 7c comprising two interconnected  A g N P s  rings on a  S i O 2 / S i  substrate. The resonance peak arises from the concentrated electric field within the elliptical region between the nano-rings. By imagining a carved-out area filled with a solution under this elliptical region, they enhance the interaction between the solution containing cancer cells and the electric field that has infiltrated this space in the  S i O 2  layer. As a biosensor, their designed model demonstrates efficacy in distinguishing various cancerous cells from healthy ones, exploiting the higher  R I  of cancer-affected cells.
Acimovic et al. [139], in Figure 8a, display an  S E M  image illustrating a segment of a typical nanorod array. To maintain the independence of each  N P s  array, accurate delivery, and the separation of samples across arrays, are achieved through a microfluidic interface crafted from polydimethylsiloxane  ( P D M S )   polymer. This interface is regulated via micromechanical valves  ( M M V ) , which allow for the toggling of microfluidic network functions among different operational modes necessary for the sensor’s preparation and sample analysis stages. The  P D M S  chip is fabricated and positioned on top of the plasmonic glass substrate, ensuring that the distributed nanoparticle arrays are located within specified areas across eight separate channels, as shown in Figure 8(ai). After securing a strong adhesion between the  P D M S  and the glass substrate, the device is set for attachment and linkage to the controlled liquid delivery module, illustrated in Figure 8(aii). The optical system for monitoring the chip includes a custom-built microscope designed for bright-field transmission, featuring scanning detection capabilities. It is paired with a visible-near-infrared  ( V I S N I R )  light source and a spectrometer, as shown in Figure 8(aiii). Thus, through their specially crafted system, they can swiftly identify cancer biomarkers like human alpha-fetoprotein and prostate-specific antigen.
Law et al. [140] presented a biosensor enhanced via  N P s , merging  N P s  and immunoassay sensing techniques within a phase interrogation  S P R  system capable of detecting antigens at extremely low concentrations, down to the femtomolar range. Their research highlights the significant enhancement in sensitivity achieved by extending the plasmonic field from the  A u  film to  A u  nanorods  ( G N R s ) .  Utilizing antibody-functionalized sensing films in combination with antibody-conjugated  G N R s . Then, a highly effective plasmonic coupling system capable of serving as a powerful ultrasensitive sandwich immunoassay for detecting cancer-related diseases is established. Figure 8(bi) represents an illustration of an ultrasensitive immunoassay employing  G N R s   as amplification labels. The  T E M   image presented in Figure 8(bii) depicts the  G N R s  utilized in their research. The average dimensions of the  G N R s   were estimated to be  46.5   ±   2.9   nm  in length and  21.1   ±   1.8   nm  in width, resulting in an aspect ratio of  2.20 .  This characteristic is further elucidated by the longitudinal peak observed in the absorption spectrum.
Ma et al. [141] introduced a unique nano-plasmonic sensing platform that leverages  L S P R  for the label-free and real-time identification of highly reliable cancer markers, including mutant genes and telomerase, within clinical samples, as depicted in Figure 8(ci). Their sensor exhibits specific detection of mutant  D N A   and can detect telomerase from as few as 10 HeLa cells, as represented in Figure 8(cii). This flexible method offers the potential to identify a wide range of pathological markers with outstanding sensitivity and specificity and for observing crucial biomolecular interactions, including those between nucleic acids and proteins as diseases progress in real time. Additionally, their system shows significant promise for advancement, facilitating on-chip analysis and the concurrent detection of numerous targets and interactions.

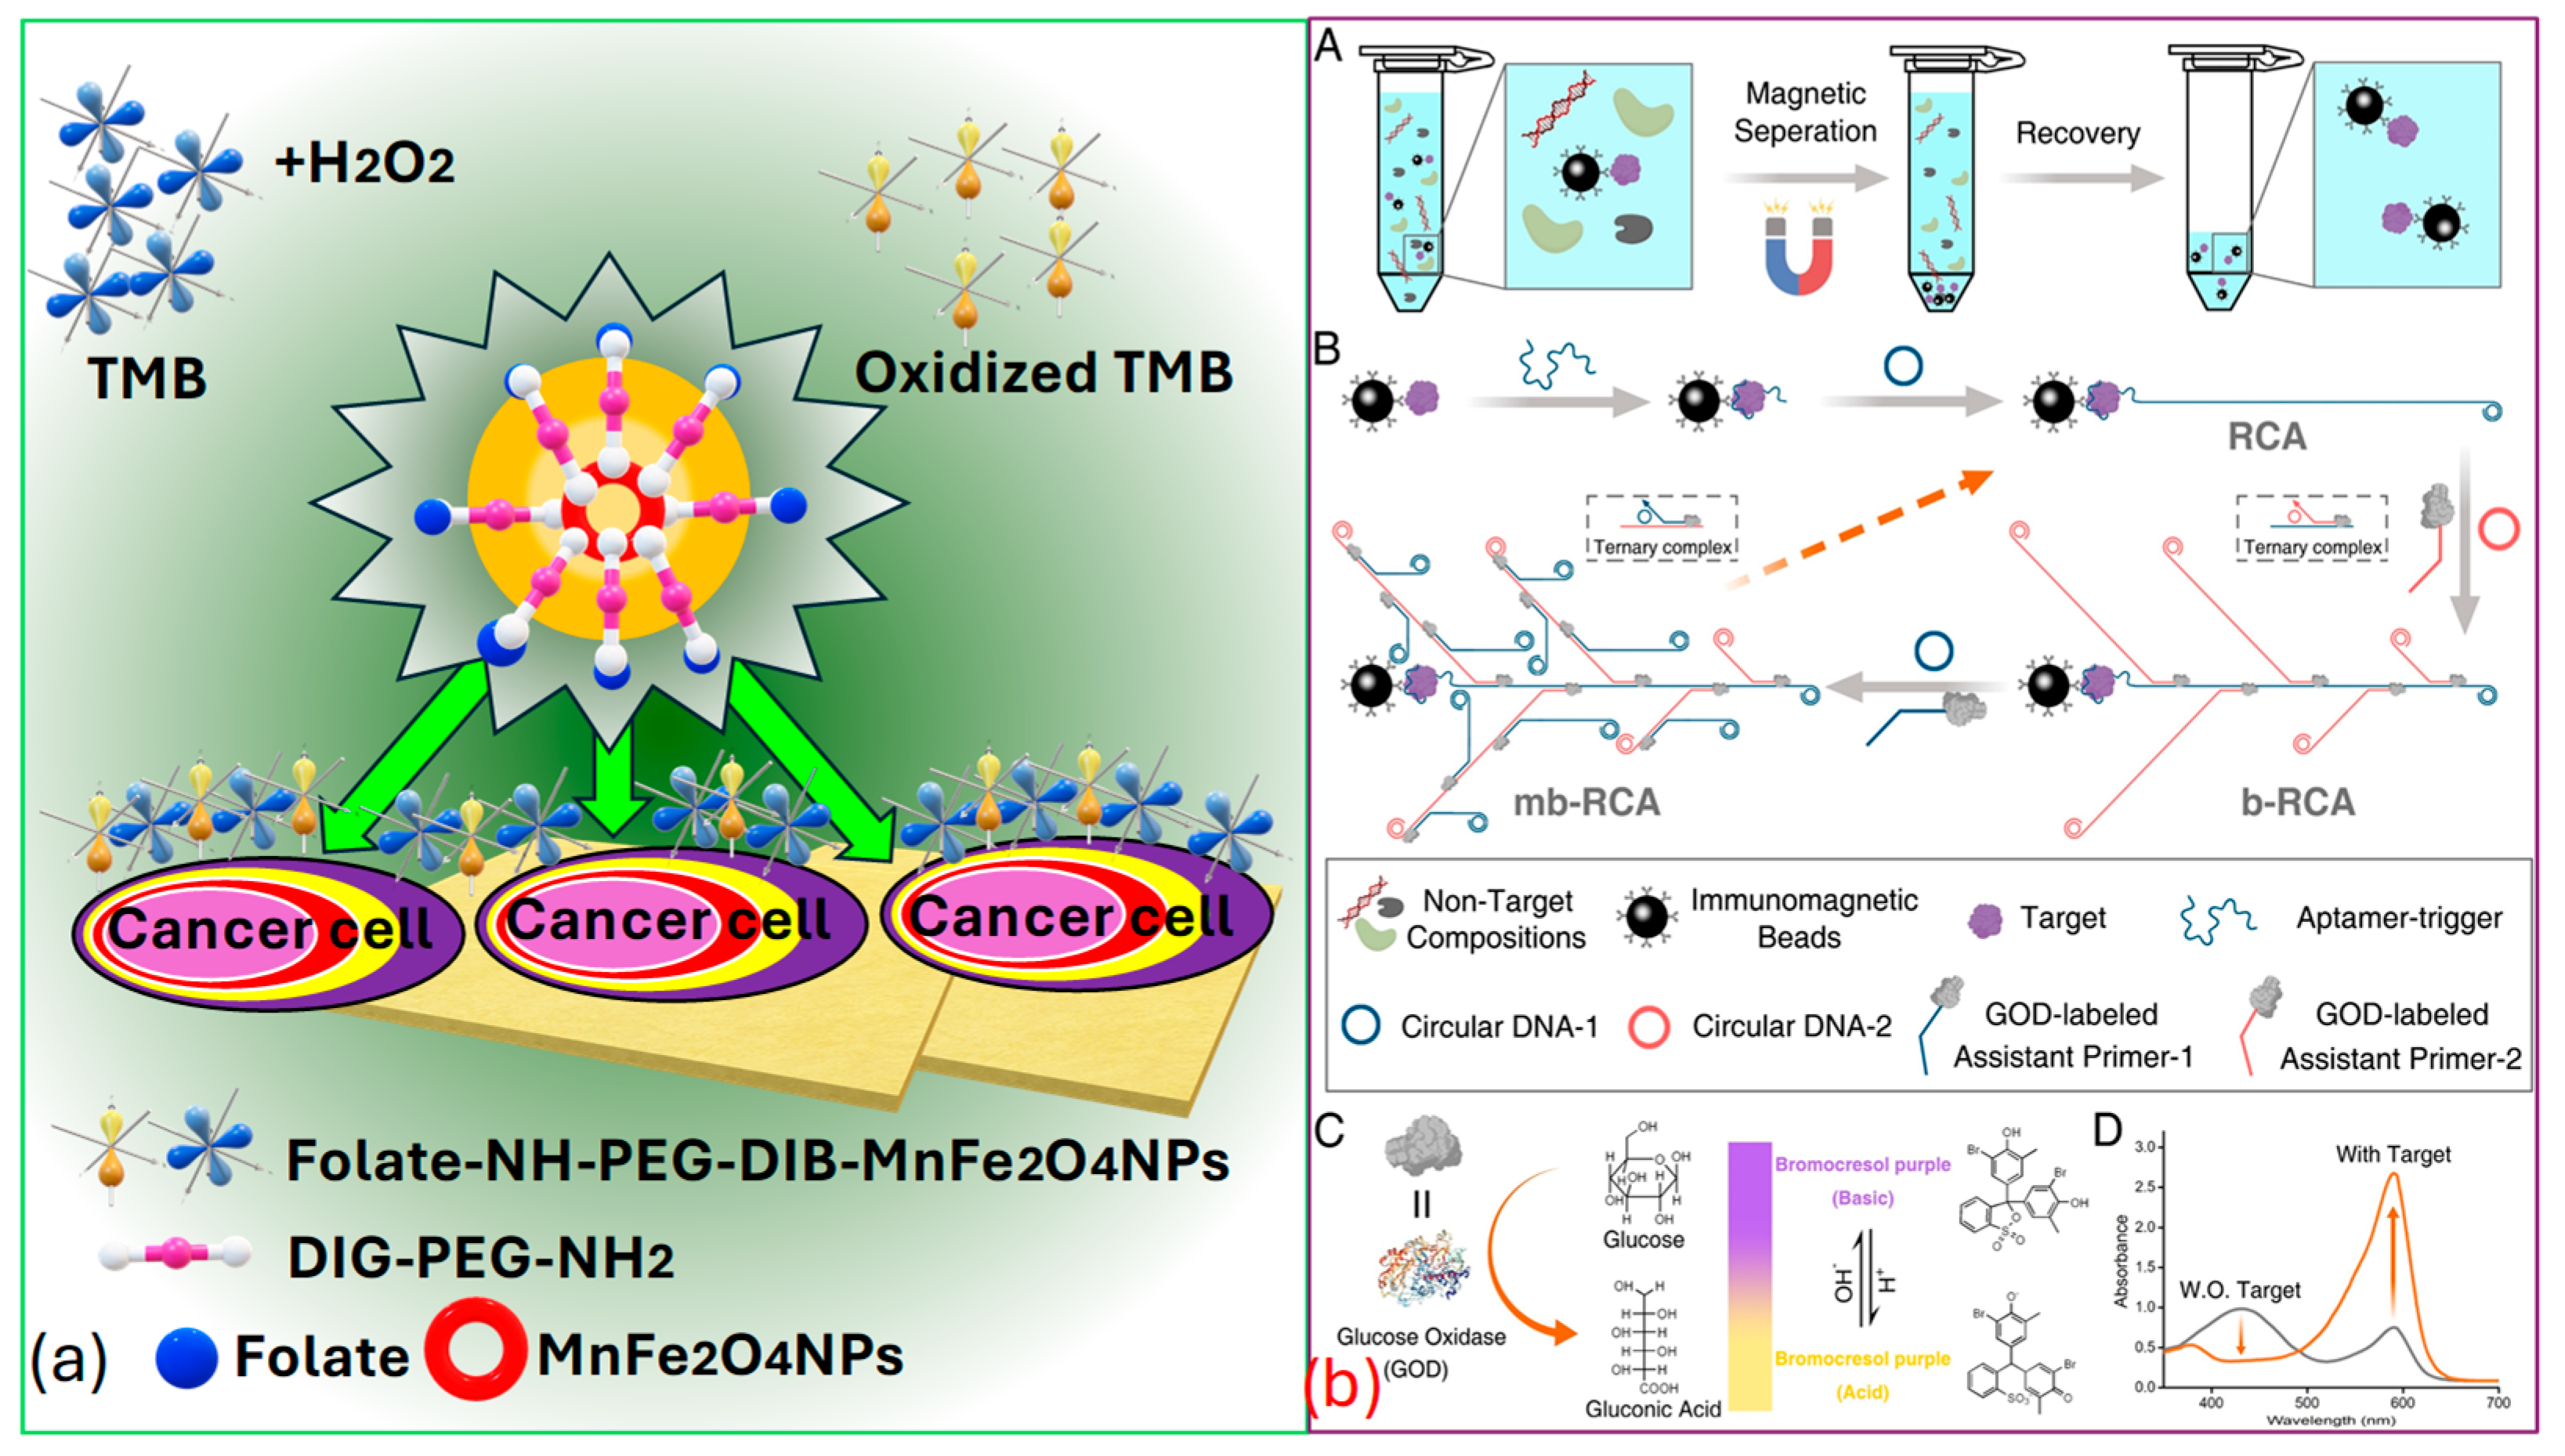
3.3. Classification of Colorimetric Sensors

Colorimetric sensors for cancer detection utilize the principle of color change in response to specific biomarkers associated with cancer, offering a simple, cost-effective, and easily interpretable method for early diagnosis and monitoring. These sensors often involve the use of  N P s , such as  A u  or  A g , which exhibit a change in their plasmonic properties when bound to cancer-related molecules, leading to a visible color shift. The interaction between the sensor and target molecules can be engineered to be highly specific, targeting a wide range of cancer biomarkers, including proteins [142],  D N A  mutations [143], and  m i c r o R N A s  [144]. The simplicity of observing color changes without the need for sophisticated equipment makes colorimetric sensors particularly appealing for  P O C T  and resource-limited settings. Progress in nanotechnology and biochemistry has markedly improved the sensitivity and specificity of these sensors, positioning them as a promising approach for non-invasive cancer detection [145], assisting in the early detection of tumors [146], and potentially improving patient outcomes through enabling timely treatment. Figure 9a presents details about various elements used in a colorimetric sensor for detection purposes, which include body-fluid samples [6], a variety of papers [147], recognition elements [148], and signal read-out devices [149].
Biosensors are analytical tools that feature a detection element, often referred to as a bioreceptor, e.g., enzymes, antigens,  A b s ,  cells, or nucleic acids, crafted to detect specific targets, and a transducer such as optical, electrochemical, thermal, or mass-based systems tasked with transforming the recognition occurrence into a quantifiable signal. Offering high specificity, biosensors excel at detecting single biomarkers or sets of biomarkers, even at low concentrations. Consequently, researchers have emphasized the advancement of biosensor-based methodologies for disease detection, such as cancer, particularly when they can be engineered into a  P O C T   format, enabling testing outside the conventional laboratory setting. While  P O C T   devices are not designed to completely substitute clinical tests, they have attracted significant interest lately, especially for diagnostic uses, because they provide straightforward and quick initial screenings [150]. Carneiro et al. [154], in Figure 9b, present  P A D S  kits and microfluidic detection systems capable of producing rapid results following a noninvasive detection methodology. These devices can be used effectively for cancer detection due to easy detection methodology. Thus, numerous diagnostic assays for cancer biomarkers are available on the market, enabling rapid and non-invasive detection. Figure 9c presents the operational principle of the lateral-flow assays  ( L F A )  for analyte detection. This analyte can also be human body fluid for cancerous cell detection. In addition to these other different technical approaches to the development of  P A D S   based sensors, which include dipsticks, spot tests, and  µ P A D S  [153]. Biorecognition elements concerning  P A D s  for cancer biomarker detection are summarized in Table 2. Another important procedure for cancer identification includes the domain of metallic  N P s . The dimension of these  N P s   is often less than  100   nm . In  N P s , the unrestricted movement of free electrons within their confined space due to size limitations naturally leads to oscillation at a specific frequency. When these  N P s  are irradiated with a frequency matching the inherent oscillation frequency of electrons, they absorb energy, inducing a plasmonic effect characterized by non-propagating oscillations. This phenomenon is predominantly observed in metallic  N P s . Additionally, bimetallic  N P s ,  composites, and metal oxides also exhibit the plasmonic effect suitable for detecting cancer biomarkers. Akshaya et al. [155] conducted a study on the diagnosis of breast cancer-cell MCF-7 utilizing aptamer–cell interactions. MCF-7 cells possess nucleole receptors, which are overexpressed in cancer cells, allowing them to capture nucleole aptamers  ( A S   1411 ) . When all the  A S   1411  bind to the nucleole receptors, the addition of complementary single-stranded  D N A -coated  A u N P s  ( s s D N A A u N P s ) results in no remaining aptamers available for binding. Consequently, no aggregation of  A u N P s   occurs, resulting in the absence of a noticeable color change. In contrast, in normal cells,  s s D N A A u N P s  bind with excess unbound aptamers, promoting aggregation and producing a blue color. This phenomenon is observed through spectrophotometry to guarantee a precise colorimetric response that differentiates between cancerous and non-cancerous cells, with a detection threshold of 10 cells. Thus, they were able to demonstrate the ability of their device in the effective detection of early-stage cancer. The procedure of preparing  A u N p s  for cancer cell identification is presented in Figure 9d.
Table 3 summarizes the utilization of the  N P s  for the detection of cancer biomarkers. Among the diverse types of  N P s  demonstrated,  A u N P s  are favored due to their numerous advantageous characteristics, rendering them a promising candidate for sensing applications. The key factor for successful colorimetric detection is robust  S P R  activity, which directly impacts the sensitivity of the colorimetric sensor.
Peng et al. [154] successfully identified targeted cancer cells using  M n F e 2 O 4  as a novel, sturdy, and effective signaling probe. Folic acid  ( F A ) , which is widely recognized as a receptor-mediated targeting ligand, exhibits a strong affinity towards  F A  receptors present on the cell surface of  F A -positive tumors. These  F A  receptors are often overexpressed on the surfaces of certain human tumors, such as ovarian, brain, endometrial, kidney, and breast cancer cells. Thus, by covalently linking  F A  to  N P s , they selectively target various kinds of tumors, as represented in Figure 10a.
In Figure 10b, Miao et al. [155] present the process for the  p H  colorimetric-based detection of the cancer biomarker protein  P D G F B B  that involves several sequential steps. Initially, they target the separation that occurs based on the utilization of immunomagnetic beads. Subsequently, multi-branched rolling circle amplification ( m b R C A ) is employed, along with glucose oxidase  ( G O D )  enrichment. The next step involves signal conversion utilizing  G O D  and  p H  based colorimetric analysis, facilitated via the  p H  indicator bromocresol purple  ( B C P ) . Finally, the  U V V I S  spectrum is recorded with and without the presence of the target protein, providing insight into the detection process. Thus, it is the effective establishment of this  p H -dependent colorimetric strategy that holds significant value in advancing the practical utilization of  p H  in bioanalysis. Moreover, it stands poised to offer insights into the advancement of additional high-performance sensor technologies and is used for cancer biomarker identification. Indeed, recent advancements have demonstrated the efficiency of these biosensors in distinguishing between healthy individuals and patients with various diseases, achieving high classification rates. A study conducted by Moon et al. [165] introduced a bioinspired M13 bacteriophage-based photonic nose capable of differential cell recognition. This sensor presents characteristic color patterns in response to specific biomarkers, enabling the successful identification of different molecular and cellular species. The versatility and tunable selectivity of the M13 bacteriophage make it a promising tool for developing target-oriented sensors with high accuracy and throughput. Additionally, research has shown that M13 bacteriophage-based color sensors can detect cancer cell types by analyzing volatile organic compounds  ( V O C s )  produced via the cells. These sensors demonstrated significant sensitivity and selectivity, with principal component analysis accounting for 99.8% of the variance, indicating excellent discrimination capabilities [166].

3.4. Classification of Fluorescence-Based Optical Sensors

Fluorescence-based optical sensors are based on the phenomenon of fluorescence, which occurs due to molecules called fluorophores [167]. These molecules capture light energy and then release light at a longer wavelength. In fluorescence-based optical sensors, a specific analyte or target molecule interacts with a fluorescent probe, leading to a change in fluorescence intensity, lifetime, or wavelength. This change is then detected and quantified using optical instrumentation, such as fluorescence spectrometers or microscopes. By measuring the fluorescence signal, the concentration or presence of the target analyte can be determined with high sensitivity and specificity [168]. Fluorescence-based optical sensors can be used effectively to identify cancerous cells in the human body. Specifically, there are three categories of optical wireless sensors utilizing the fluorescence phenomenon, encompassing wearable optical sensors, radio-frequency optical sensors, and smartphone camera-based sensors. Figure 11a presents the artistic view of the visual appearance of fluorescence  N P s  [169].
Ponlakhet et al. [170] presented an efficient approach for the fluorescence detection of  N O 2  using a portable fluorescence platform based on smartphones. Images captured via the smartphone camera are transmitted to a mobile (Android) application, where the  R G B  components of the images are analyzed. The obtained fluorescent species  ( D A P )   originates after the reaction between  N O 2  and  C T A B A u N P s , yielding  A u 3 +  that acts as a homogeneous catalyst for the oxidation of  O P D  in the presence of  H 2 O 2 , resulting in the generation of fluorescent  D A P . Remarkably, the micelle model of a nonionic surfactant ( T X 100 ) enhances the fluorescence emission of  D A P .  The  R G B   intensities of  D A P  are analyzed to correlate with the concentration of  N O 2 . Moreover, key factors influencing sensitivity are thoroughly examined and refined. The usability of this fluorescence sensing system is showcased through the analysis of pretreated fruit juice and malt beverage samples using a streamlined sample preparation technique. The precision of their assay matches that of the conventional method for  N O 2 —analysis. By integrating fluorescence signal analysis with a fluorescence amplification approach on a compact, smartphone-based fluorescence device that includes mobile applications, the complexity of analysis is substantially minimized. This approach is cost-effective, easy to use, and portable, enables swift on-the-spot detection, and offers outstanding sensitivity and specificity for  N O 2 —detection. Figure 11b presents the prototype of their proposed fluorescence-based sensor model. Figure 11c presents the condition of the fluorescence resonance-based energy transfer ( F R E T ) scheme used in the fluorescence-based sensor models [171]. Mohammadi et al. [172] emphasized wearable sensors that employ fluorescence, combined with smartphones, potentially serving functions such as data storage, image processing, illumination, and radio communication. The merging of wireless sensors with smartphones is particularly viewed as an encouraging advancement in the evolution of fluorescence-based sensors. Figure 11d presents a prototype of the fluorescence-based optical biosensing device that can further be used for cancer cell detection.
Hernandez et al. [173] presented  F R E T -based optical sensors that offer the capability of detecting minute changes ranging from angstroms to nanometers. Nevertheless, traditional fluorescent molecules like organic dyes pose limitations due to their potential toxicity and susceptibility to photobleaching. The integration of nanomaterials into the production of fluorescent devices has surpassed prior challenges, resulting in the creation of affordable, portable sensors that display improved fluorescence signals. This is achieved by utilizing nanostructures that magnify fluorescence signals. Consequently, the use of  F R E T  assays and fluorescence lifetime flow cytometry has made it possible to detect phosphorylated  E G F R  in tumor cells [174]. These findings represent progress in the advancement of devices capable of capturing subcellular phenomena pertinent to cancer research. Figure 11e represents a schematic depiction of a microfluidics device designed for biosensing utilizing the  F R E T  technique for cancer detection.
Anand et al. [175] noticed that the limited diffusion of nutrients and waste products beyond  150 200 μ m , crossing cellular barriers, leads to hypoxic conditions, ultimately resulting in the fragmentation of the nucleus and necrosis within the spheroid. This observation was clarified using H&E staining on a spheroid formed via seeding  10,000   M C F 7 C 3  cells, which was then cultured for 5 days, as shown in Figure 11f. The lack of hematoxylin staining in the nuclei at the spheroid’s core highlighted necrotic cells in that central area. In contrast, hematoxylin staining in the spheroid’s outer region  ( 200   μ m )  indicated that the nuclei were preserved in these cells. Additionally, the morphological features and the detection of a necrotic core in the histological sections of the xenograft tumors highlight that the spheroids faithfully mimic the histological attributes of tumors in a living organism. Consequently, various strategies can be employed to detect different cancer biomarkers using fluorescence-based optical biosensors.
Figure 11. (a) Visual appearance of fluorescence NPs [169]. (b) Smartphone-based prototype of the fluorescence sensor [170]. (c) Condition of the fluorescence resonance-based energy transfer scheme [171]. (d) A wireless fluorescence optical biochemical sensor with a mobile optical sensing facility for wireless readout, allowing for direct observation via the naked eye or through remote camera access [172]. (e) FRET-based optical sensing platform for cancer cell identification [173]. (f) Staining of MCF7-C3 spheroids and xenograft tumors originating from MCF-7 cells using hematoxylin and eosin (i) MCF-7 C3 cancerous spheroid showing compact cell morphology and dense nuclei (ii) 3D culture of MCF-7 cells, exhibiting partially organized structures and intercellular spaces (iii) Tumor section from MCF-7-derived xenograft, demonstrating in vivo tissue organization and vascularization (iv) Higher magnification of xenograft tumor, revealing dense cellular proliferation and nuclear atypia [175].
Biosensors 15 00292 g011
Table 4 provides details on biomarker detection in cancerous cells using  F R E T  technology. It highlights several biomarkers, such as  m R N A s  and specific cancer-related proteins, along with their respective detection methods across different types of cancers.

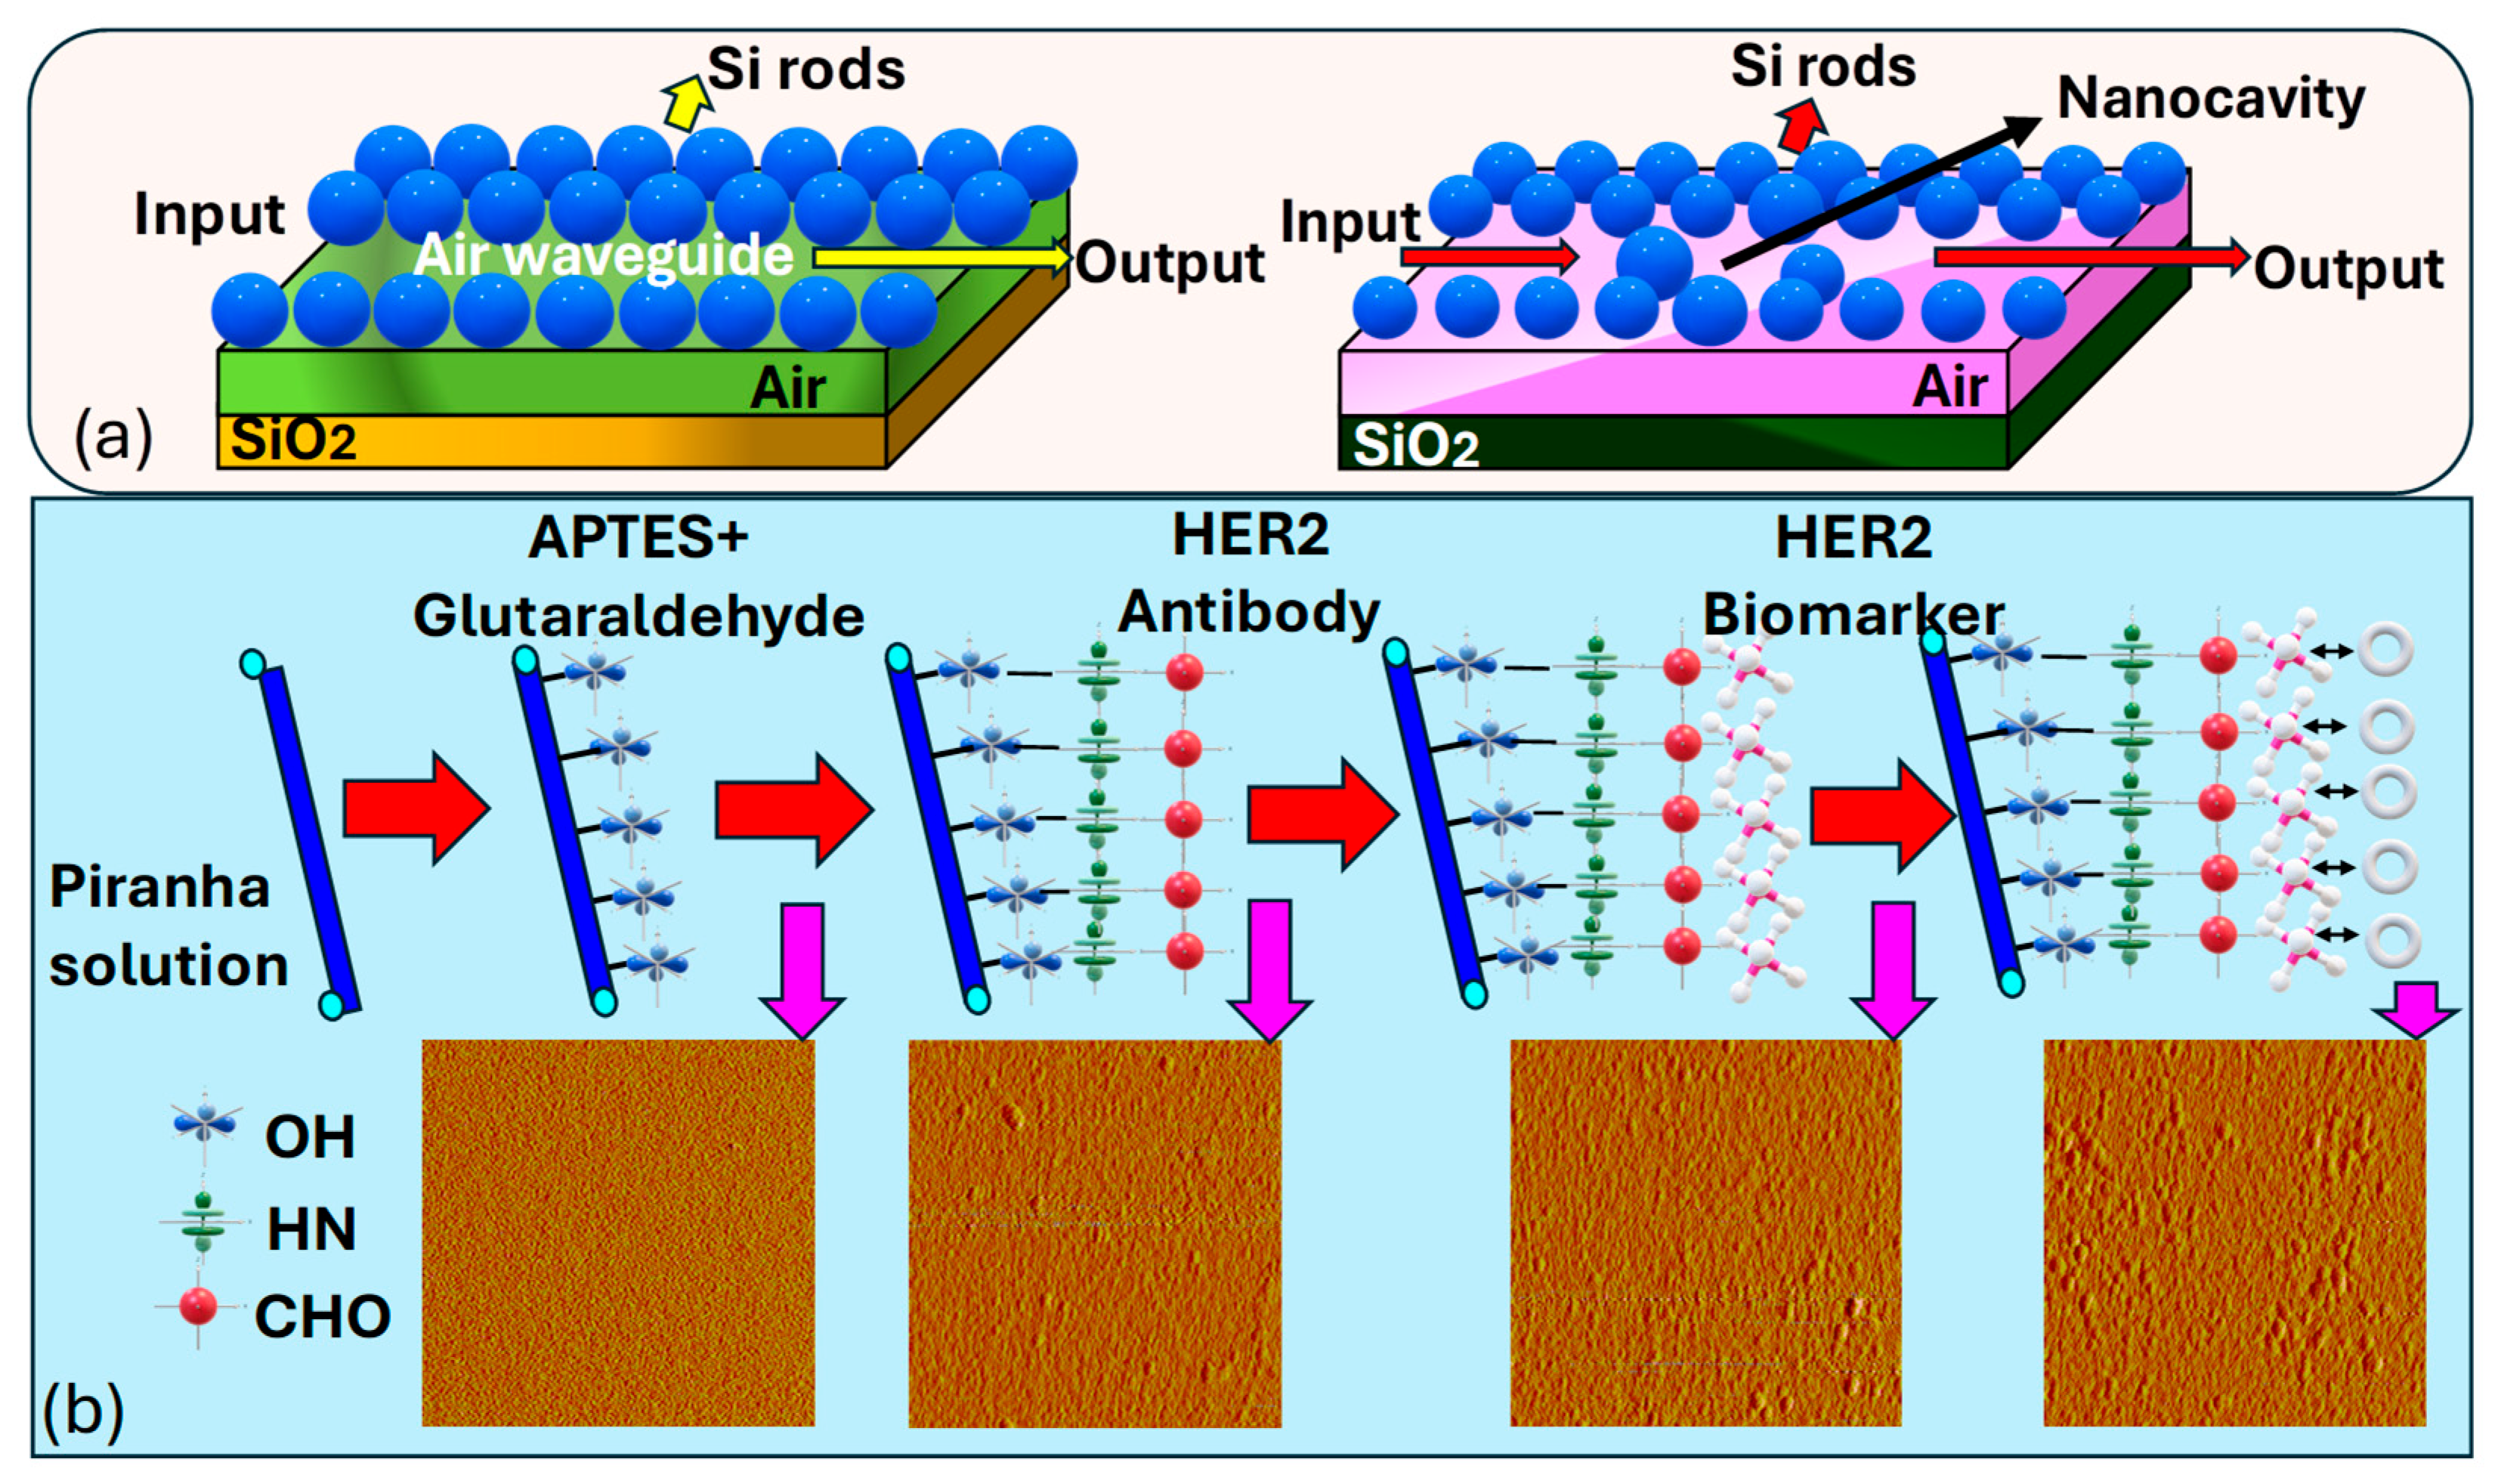
3.5. Classification of Photonics and Waveguide-Based Optical Sensors

Photonics-based optical sensors are utilized in cancer detection because of their high sensitivity and specificity, along with their capability to identify minor changes in biological samples that are indicative of cancerous growth. These sensors operate on the principle of exploiting the interaction between light and the target analyte to generate measurable signals. In photonics-based optical sensors, light is used to probe the sample, and changes in the optical properties of the sample, such as absorption, fluorescence, or  R I , are monitored to detect the presence of cancer biomarkers [186]. On the other hand, waveguide-based optical sensors use waveguides, such as  O F  or planar waveguides, to confine and guide light through the sample. Changes in the optical properties of the sample within the waveguide, such as  R I  or absorption, can be detected by monitoring changes in the guided light signal. These sensors are extremely sensitive to variations in the sample, allowing them to detect cancer biomarkers at very low concentrations [187].
Jindal et al. [188] introduce a nanocavity-coupled photonic crystal waveguide  ( P C W )  based biosensor serving as an on-chip platform for the label-free identification of cancerous cells, as represented in Figure 12a. Their proposed biosensing platform demonstrates remarkable sensitivity and a high Q. In their platform, they have used label-free optical biosensing, which provides a straightforward sensing approach by eliminating the need for fluorescent labeling of analyte molecules. The incorporation of a silicon  ( S i )  nanocavity within the  P C W  is used, which offers advantages over  2 D - P C  micro-cavities, providing a much smaller sensor area while maintaining sensitivity. Monitoring the resonant wavelength  ( R W )  shift or tracking the intensity variation at a specific wavelength sensing mechanisms is available in the proposed sensor. The integration of nanocavity in the  P C W  enhances the capability of the chip for cancer cell detection. Optimizing the structure of the inserted nanocavity sharpens the resonant peak of the output spectra, enabling customizable and highly sensitive detection of cancer cells. The binding of molecules with different cancer cells induces shifts in the observed peaks in the transmission spectra to distinct wavelengths.
Sun et al. [189] presented a covalent immobilization procedure, as illustrated in Figure 12b, for preparing the sample solution to cancer cell identification. Firstly, they treated a freshly prepared piranha solution  ( H 2 S O 4 / H 2 O 2 = 70 : 30 , v / v )  for 30 min, followed by rinsing with de-ionized  ( D I )  water and nitrogen drying. Then, reacting the fiber surface with 5%  3 a m i n o p r o p y l t r i e t h o x y s i l a n e   ( A P T E S )  in ethyl alcohol for 15 min, thorough rinsing with  D I  water, and subsequent drying are performed. Then, a crosslink reaction using a  2.5 %  glutaraldehyde solution for 30 min, followed by thorough rinsing with  D I  water and drying, is performed. Then, immobilization of the  H E R 2  antibody with a concentration of  10 μ g / m L  for 1 h is performed, followed by thorough rinsing with  D I  water.
The final step involves immersing in a 1% bovine serum albumin  ( B S A )  solution in phosphate-buffered saline  ( P B S )  for 5 min to block unreacted sites and reduce nonspecific adsorption. Employing piranha solution is essential in creating reactive hydroxyl groups on the surface of the fiber. Following this, applying fresh  3 A P T E S  in ethyl alcohol aids in forming free amine groups  N H 2  on the fiber surface, thus efficiently immobilizing it. This salinized fiber was then primed for further reaction with aldehyde groups  ( C H O )  present in glutaraldehyde, leading to the formation of imines. Following this, the fiber underwent a 2 min rinse with  D I  water to eliminate excess adsorbed components, followed by drying with nitrogen. Subsequently, the fiber was immersed in a solution containing  H E R 2   A b s  for 60 min and rinsed with  D I   water thereafter. This process ensured the elimination of non-reacted sites, thereby minimizing nonspecific adsorption when immersed in the  B S A  solution. As a result, the functionalized biosensor probe was prepared for the detection of  H E R 2  biomarkers responsible for breast cancer.
Madea et al. [190] illustrate the structural layout and operational principle of the optical interferometric surface-stress sensor, as shown in Figure 13a. The proposed sensor consisted of a thin layer of  p a r y l e n e C  with a bio-functional coating, mimicking a flexible membrane situated above a cavity formed on a  S i  substrate. Hence, the Fabry–Perot interferometer  ( F P I )   comprised a flexible membrane, an air gap, and a  S i  substrate. The interaction between antigens and  A b s  led to the deformation of the membrane due to repulsive forces arising from charged antigen binding. As the surface stress caused the flexible membrane to bend, the distance between the  S i  substrate and the distorted membrane expanded, leading to a spectral change towards longer wavelengths. Consequently, spectral shifts allowed for the assessment of nano-mechanical deflection of the flexible membrane. To heighten detection sensitivity in the surface-stress sensor, one can utilize a soft material characterized by a low Young’s modulus and a thin film. This approach leverages the inverse relationship between the deflection magnitude of the sensor and the material’s Young’s modulus, as well as the thickness of the film. In their investigation,  p a r y l e n e C  is selected as the support layer for the freestanding membrane due to its significantly lower Young’s modulus, which is two orders of magnitude less than that of  S i , and its capability to form uniform nanosheets of submicron thickness through  C V D  at 25 °C.
Liang et al. [191] demonstrated the fabrication process of the optofluidic sensor presented in Figure 13b,c. They took a bare  125 µ m  single-mode  O F  precisely aligned with a  S i   capillary, ensuring lateral contact and alignment in the same direction. The  S i  glass capillary possesses an outer diameter of  660   µ m   and a thickness of  65   µ m .  By employing a flame as the heat source, both the fiber and the capillary underwent substantial tapering, shrinking their dimensions by tens of times. This procedure entailed heating the  S i  glass to its softening point while gradually stretching it with two fiber holders. The resultant tapered configuration consists of a microfiber and an extremely thin capillary, enabling efficient light penetration and interaction with the fluid enclosed within the capillary. This configuration can be effectively utilized as an optofluidic sensor for biomolecular detection. Khan et al. [193] present an  F P  sensor utilizing a metal-coated  F P   cavity to detect  V O C s  such as hexanol, methanol, and acetone, as shown in Figure 13d,e. The interferometer is constructed by sequentially depositing  A g  and a gas-sensing film at the end of an  O F , forming the  F P I  cavity through  A g –polymer and polymer–air interfaces. Norland optical adhesive  ( N O A 81 )  and polyethylene glycol   ( P E G 400 )  were chosen as the sensing film due to their favorable optical and chemical characteristics. Using  P E G 400  as the sensing film, a sensitivity of  3.5   p m / p p m  with a detection limit of  1   p p m  was achieved. This design was expanded to integrate with gas chromatography  ( G C )  for column detection of decane, toluene, methanol, and dimethyl-methyl-phosphonate  ( D M M P ) .  The sensitivity of the sensor is improved to sub-nanogram levels, and a detection limit as low as  50   p g  was attained for  D M M P . The reported sensitivities of their designed sensors appear to be  4.75   m V / n g  and  77   m V / n g  for decane and  D M M P , respectively. Thus, the methodology suggests that, through photonics and waveguide-based sensors, cancer biomarkers can also be detected efficiently.

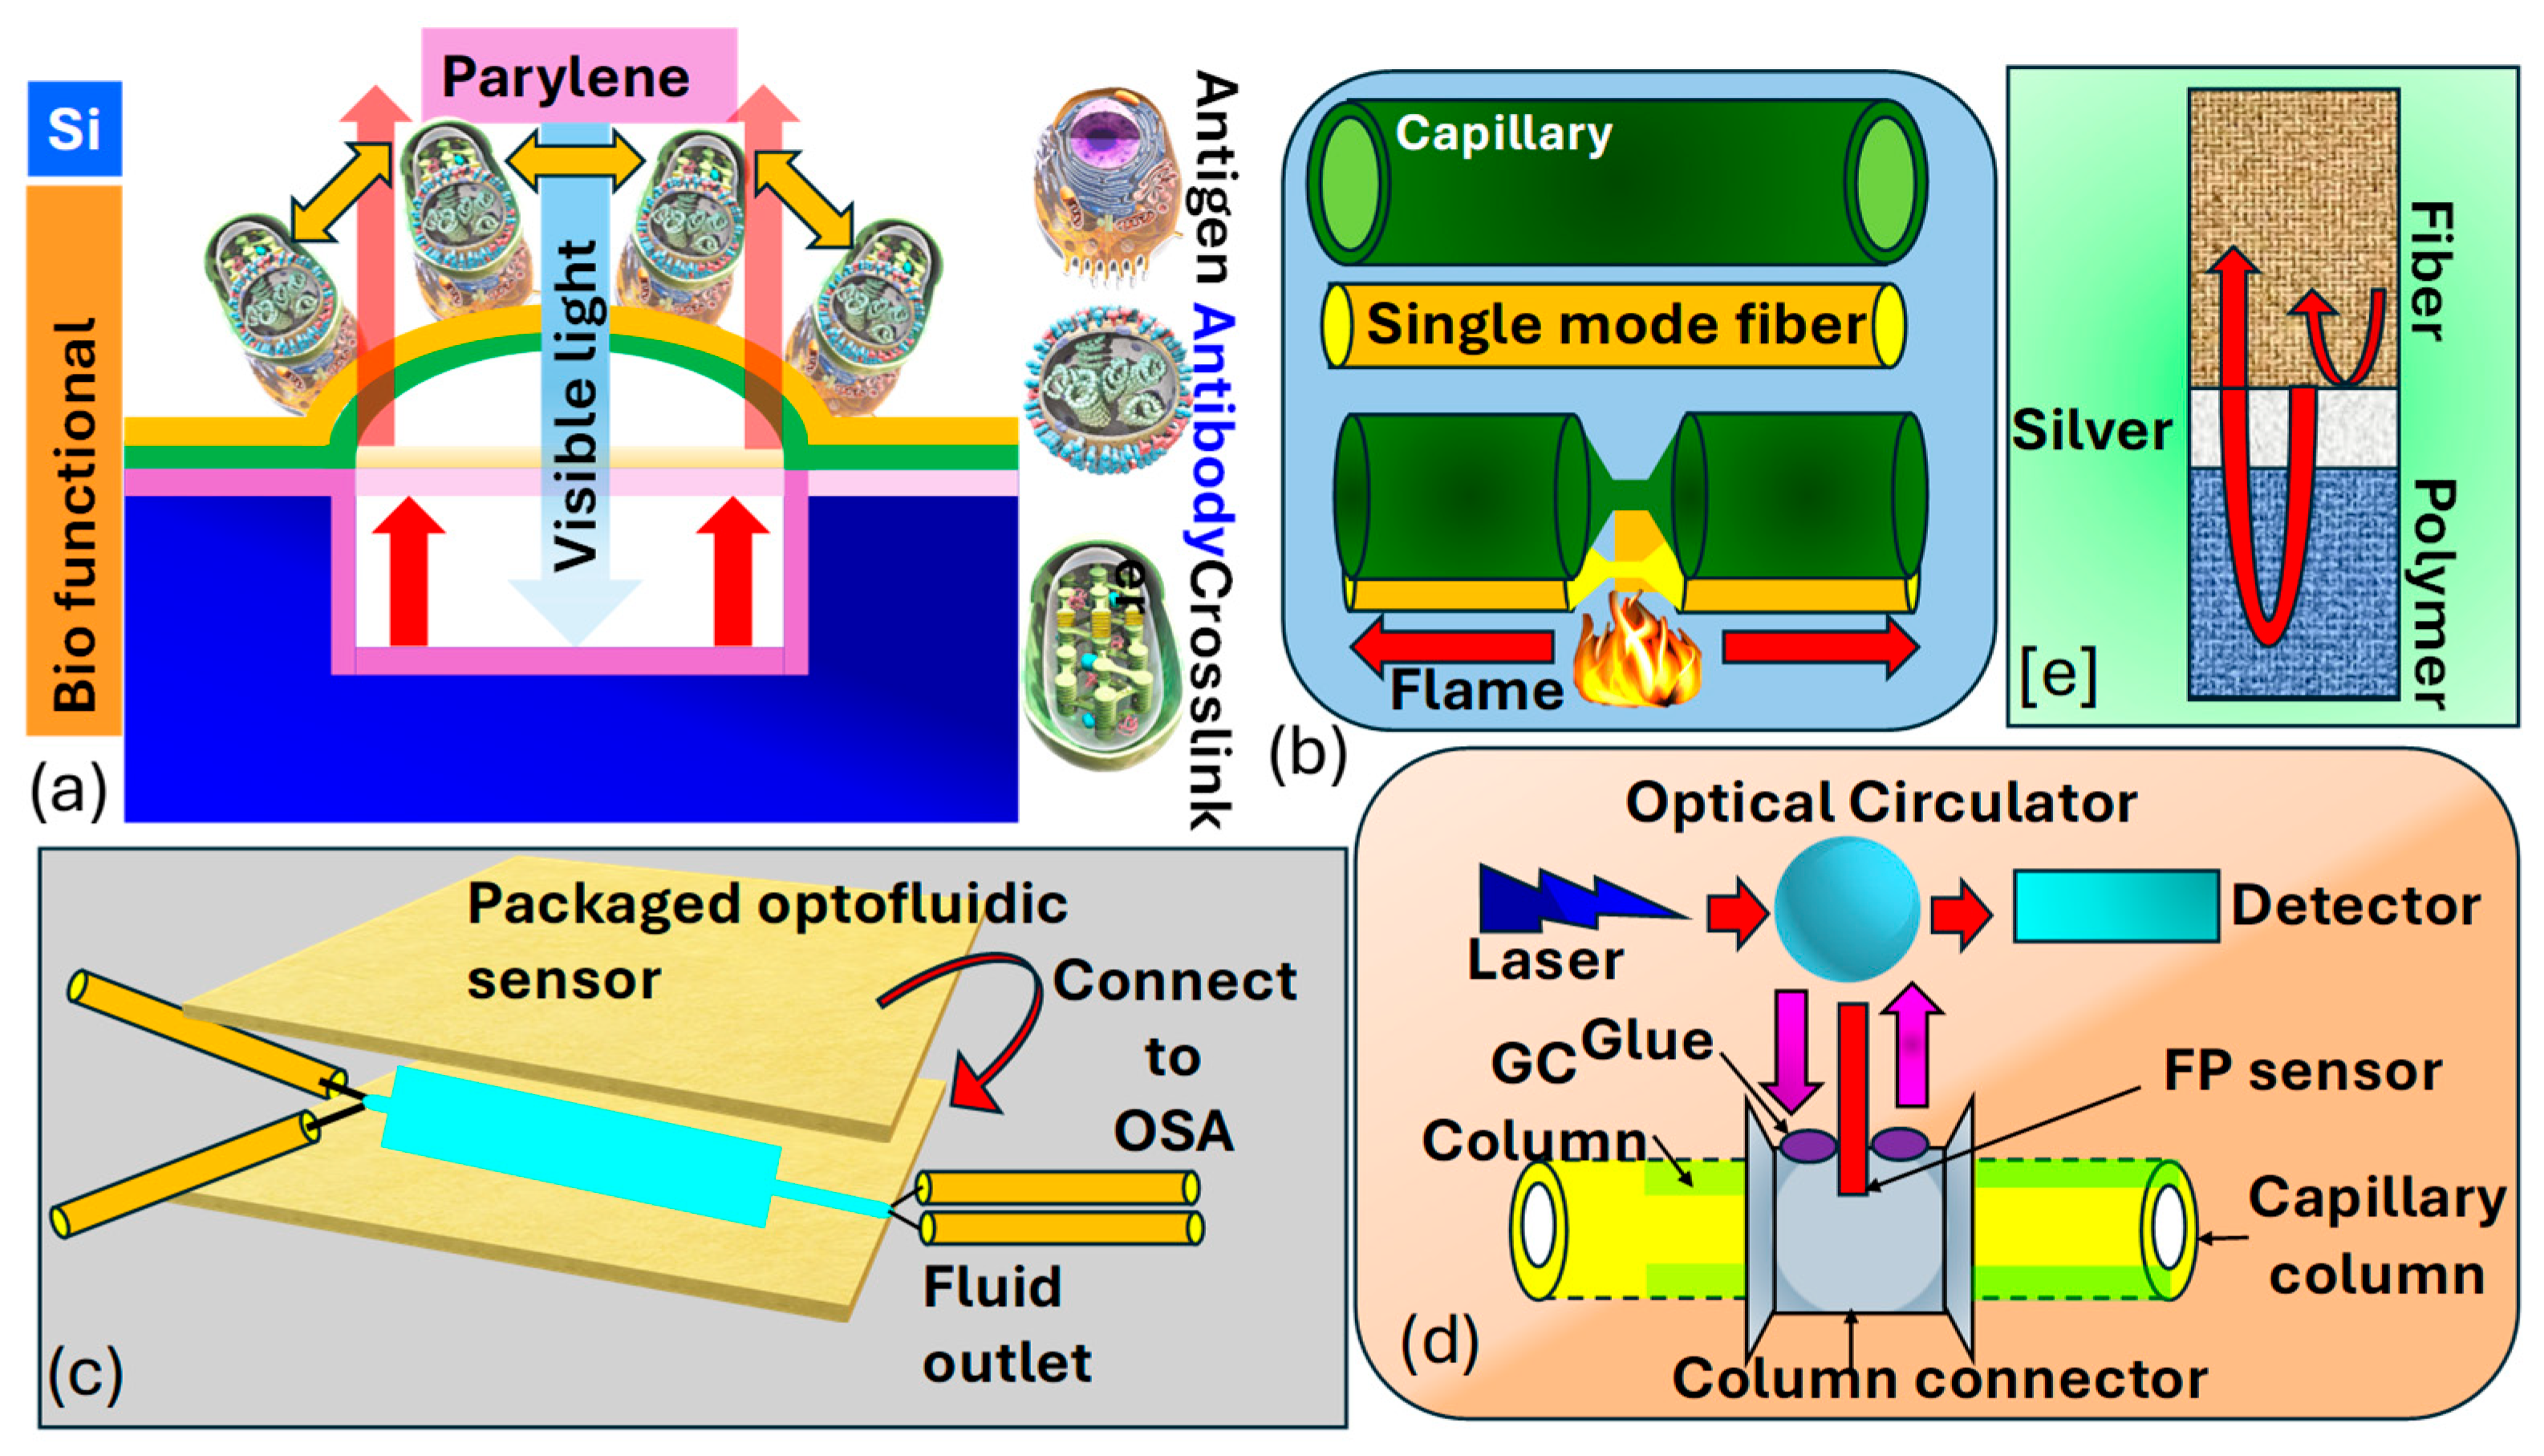
3.6. Classification of Fiber-Optics Sensors

It may sound similar, but fiber-optic sensors differ in design, operation, and applications as compared to PCF SPR sensors. Fiber-optic sensors broadly measure parameters like temperature, pressure, and strain using light transmission and techniques such as intensity modulation and interferometry. They are versatile, with applications in telecommunications, healthcare, and environmental monitoring. In contrast, PCF SPR sensors are a specialized subset, leveraging PCF and SPR for ultrasensitive RI detection. Tailored to precision applications like biomolecular interactions and chemical analysis, PCF SPR sensors excel in biosensing, offering high sensitivity compared to general-purpose fiber-optic sensors. Fiber-optic sensors for cancer detection offer promising avenues for early diagnosis and monitoring of the disease. These sensors utilize the unique properties of light transmission through  O F  to detect biomarkers associated with cancerous growth or changes in tissues. These fiber-optic sensors offer advantages such as high sensitivity, real-time monitoring capabilities, and minimally invasive detection, making them appropriate for several cancer detection applications. They can be integrated into medical devices for the in vivo or ex vivo detection of cancer biomarkers in bodily fluids, tissues, or cells. Additionally, their compatibility with imaging techniques such as endoscopy or microscopy enables localized and targeted detection of cancerous lesions. Research in fiber-optic sensors for cancer detection continues to advance, focusing on enhancing sensitivity, specificity, and multiplexing capabilities to enable early and accurate diagnosis of cancer, resulting in improved patient outcomes and personalized treatment. Xu et al. [194] prepared a fiber-optic interstitial needle presented in Figure 14a designed to deliver hypoxia-sensitive fluorescent probes and encapsulated rare-earth dopants for in vivo tumor treatment, employing a combination of endoscopic cancer sensing and photothermal therapy  ( P T T ) .  These specialized  O F , with compact diameters measuring several hundred microns, can be arranged and inserted side by side into a standard syringe needle, allowing for precise interstitial navigation. The detection fiber, armed with fluorescent probes sensitive to tumor markers, rapidly surveys the area for hypoxia markers within the tumor. Additionally, flexible rare-earth-doped fibers serve as containers for photothermal sensitizers, enabling direct tumor ablation. Loyez et al. [195] depict the layered structure arranged in the Kretschmann configuration on  T i S i 2 . A monochromatic light source of wavelength  633   nm  is directed onto the  B K 7  prism, refracted through the layers, and emerges in the opposite direction, adhering to the principles of  T I R .   The prism is coated with a thin layer of  A g  that has a diameter  D 1 = 45   nm , followed by a two-dimensional  ( 2 D )   T i S i 2  nanolayer with a diameter  D 2 = P * 2   nm , where  P   represents the number of  T i S i 2  films. Subsequently, a  B P   thin film with a diameter  D 3 = B * 0.5   nm , where  B  represents the number of  B P   films covering the  T i S i 2   layer, serving as an interface between the  T i S i 2  film and the sensing medium. The  B P  layer enhances the performance of the biomolecular recognition element, which is helpful in cancer cell identification. The  B K 7  prism functions as a coupling prism in this setup presented in Figure 14b. Several  B K   7  prism-based models are presented in literature suitable for cancer detection and early prediction [196,197]. Aldridge et al. [198] introduced a microfluidic device engineered to separate magnetically labeled cells and sort them into distinct subcategories according to their surface protein expression. This separation is accomplished using ferromagnetic guides with variable angles, leveraging prismatic deflection technology. This technique partitions a steady stream of cells into individual segments, like how a prism divides light into its constituent wavelengths, as presented in Figure 14c.
Kaur et al. [200] proposed a fiber-optic sensor to diagnose different cancers, including blood, cervical, adrenal gland, and breast cancer, at a wavelength of  1550   nm . The sensor model possesses a meticulously designed structure consisting of a fiber core, a clad metal layer, and  2 D  material, i.e.,  M o S 2  and graphene. The sensor offers three optimized probe configurations to enhance sensitivity and overall performance. The  F O M   indicates  S i O 2 P F A g M o S 2  as the most effective probe structure, exhibiting superior sensitivity to   R I   changes. The sensor’s low  L O D  values, particularly with  S i O 2 P F A g M o S 2 , underscore its ability to detect subtle  R I  variations associated with different cancer cell types, making it a suitable tool for early cancer detection. Ribaut et al. [201] introduced an innovative  O F  immunosensor tailored to detecting cytokeratin 17  ( C K 17 ) ,  a pivotal biomarker in lung cancer diagnosis. The sensor’s design enables evaluation in non-liquid environments. Initial experiments involved detecting  C K 17   within a gel matrix to simulate tissue samples.  A u -coated immunosensors, housed a specially engineered packaging for enhanced rigidity, successfully penetrated soft materials, unveiling a stable  S P R  signal within such substrates for the first time. Further tests targeting  C K 17   entrapped in a porous polyacrylamide gel matrix underscored the sensor’s selective and specific response to the target protein. Validation through a preliminary examination of human lung biopsy samples confirmed the ex-vivo detection of  C K 17 , marking a significant step towards addressing the clinical challenge of detecting biomarkers in tissues for minimally invasive in vivo medical diagnosis.
The influence of fiber shape on the optical sensor performance is also an important factor to consider while using the fiber sensor for cancer diagnosis. In this section, information about various fiber shapes and their impact on the sensor performance is presented.
U-shape fiber: The U-shape fiber is designed by bending the optical fiber into a U-shaped curve, as represented in Figure 15a. This shape enhances the light interaction with the analyte by focusing the light directly on the sensing surface. The increased surface area in the U-shaped region allows the interaction of the evanescent field more efficiently with the surrounding medium, which ultimately improves the sensitivity of the biosensor. The impact of the U-shaped curve on the sensor surface can be summarized as follows.
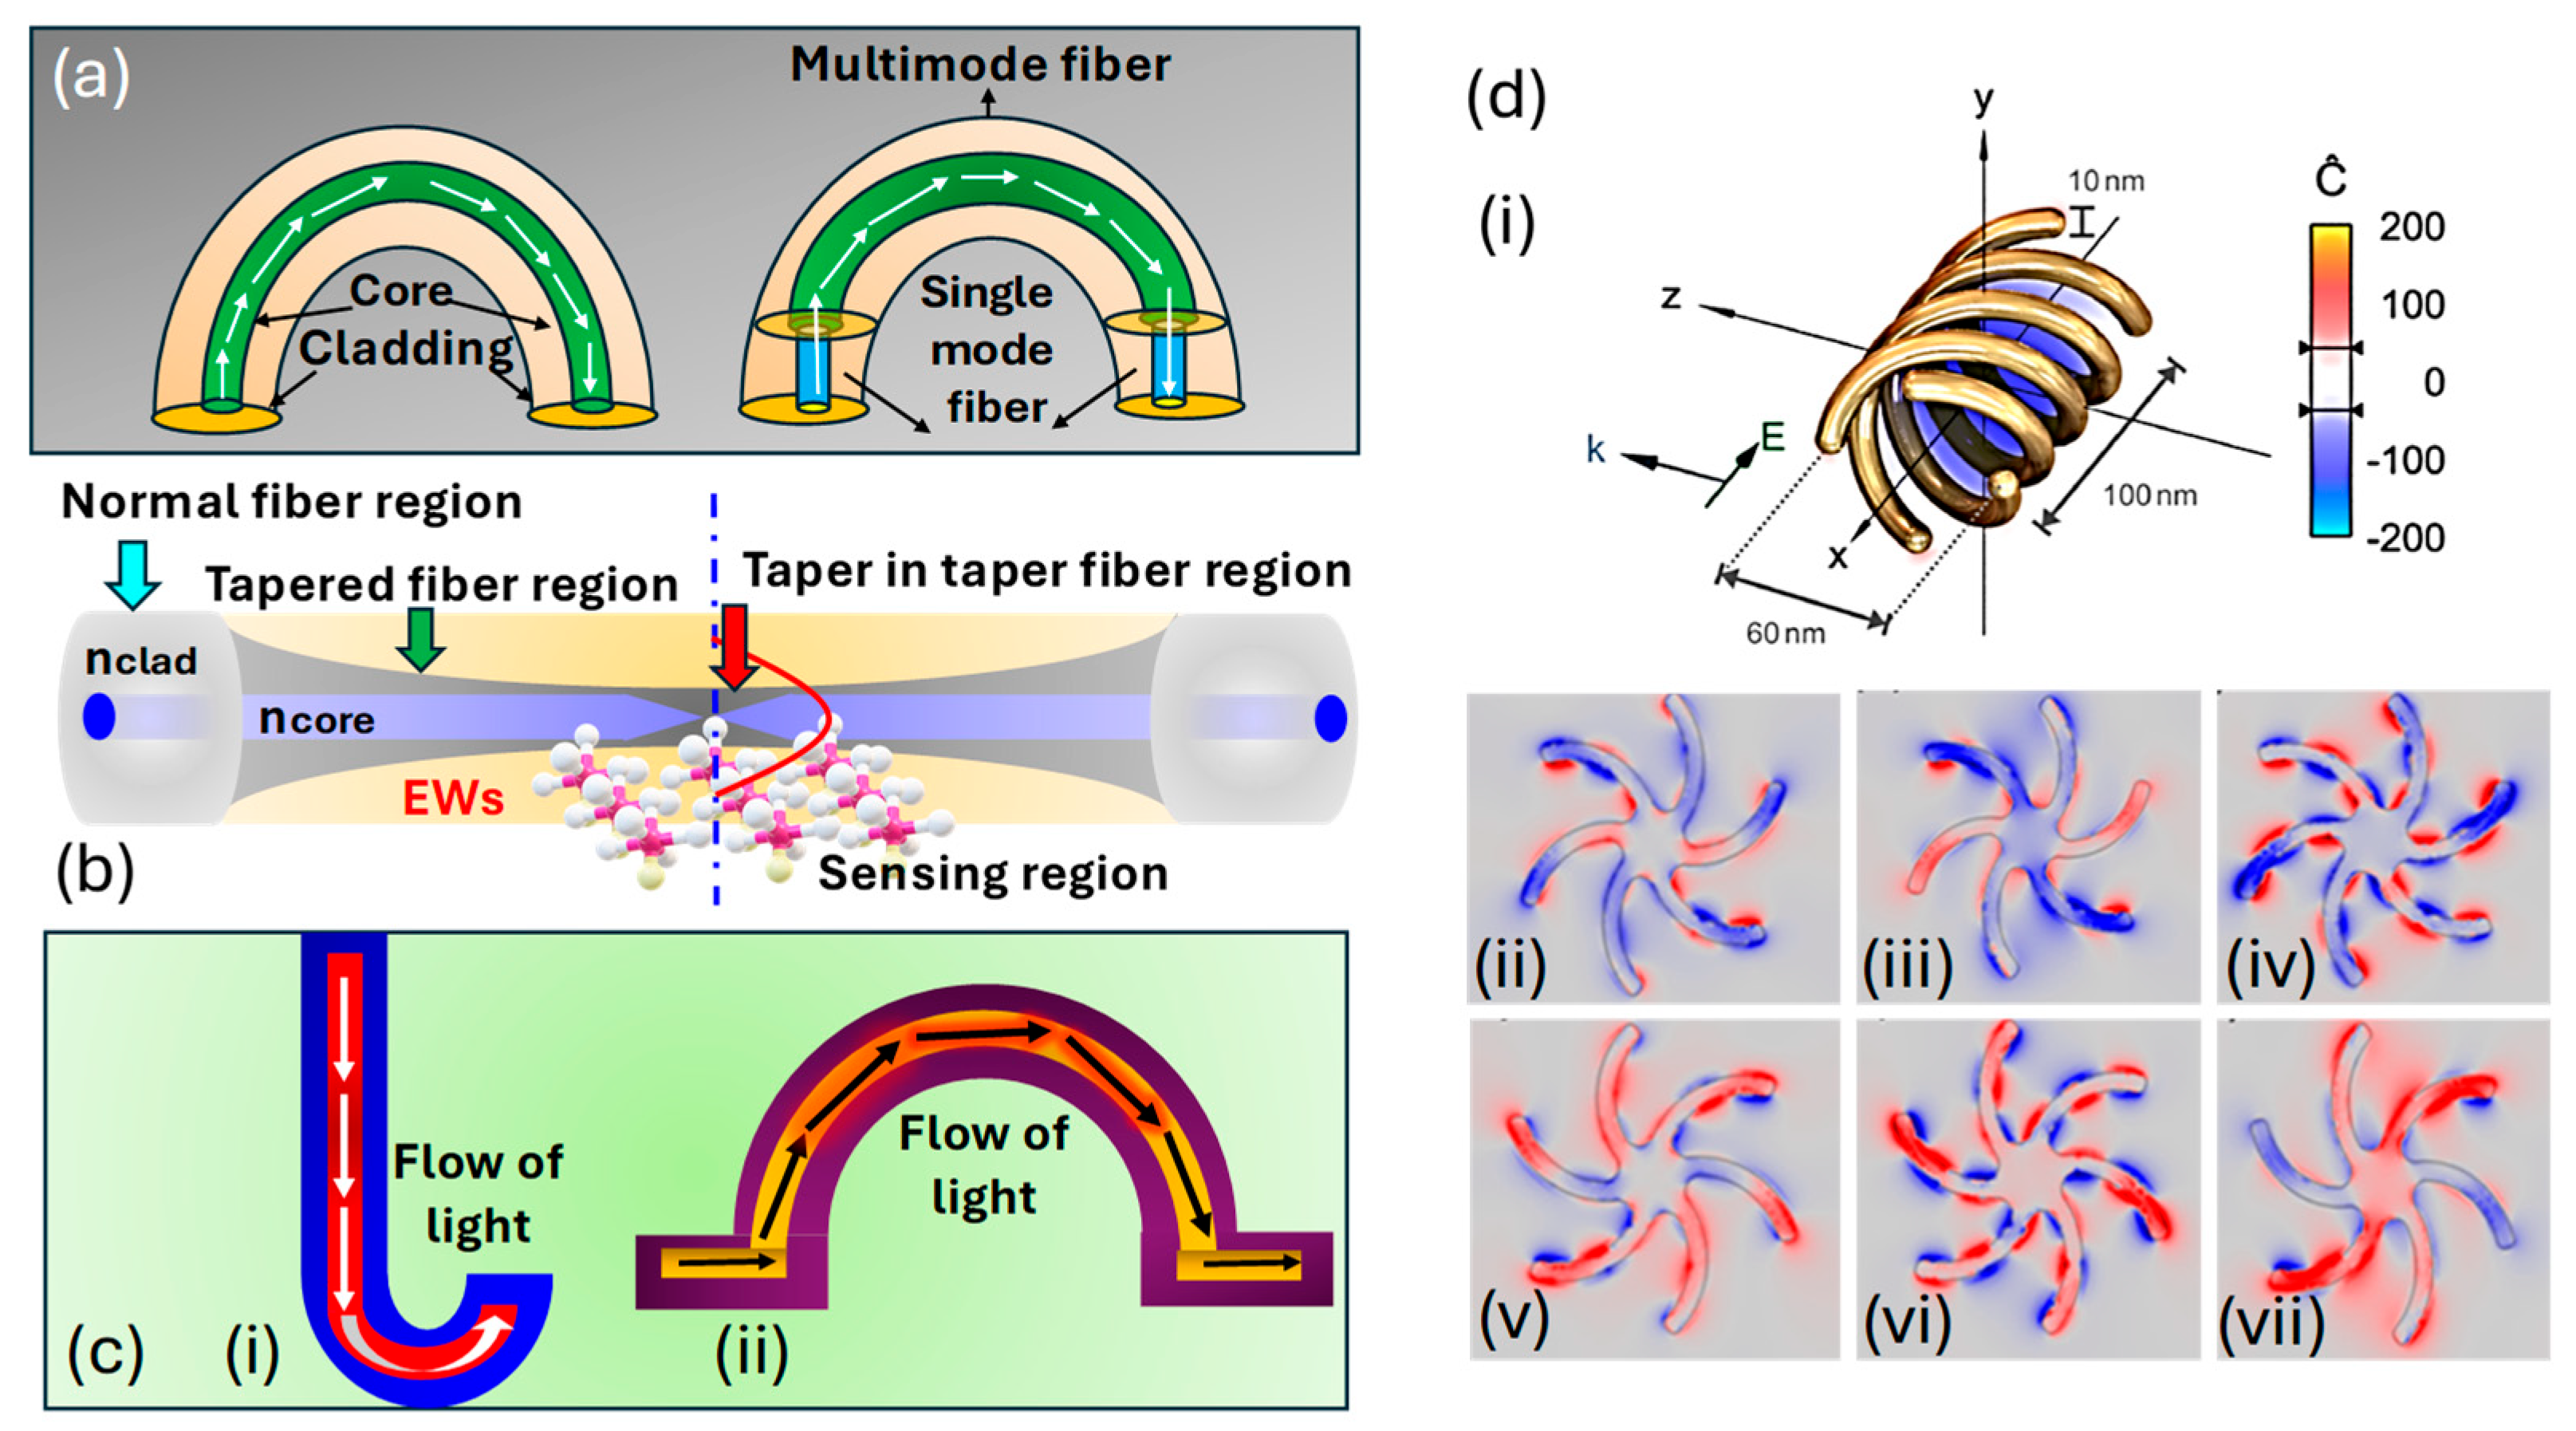
  • Increased interaction area: the U-shape enables exposure of a larger portion of the light to interact with the surrounding environment, which improves the detection of analytes and binding events [202].
  • Enhanced sensitivity: the bending of the fiber increases the path length over which light interacts with the sample; this results in enhanced biomarker detection [203].
Tapered fiber: A tapered fiber has a narrow waist along the length of the fiber. This shape enhances the evanescent field by concentrating the light as it travels through the fiber, which results in the development of a strong light interaction with the analyte in the surrounding medium, as represented in Figure 15b. Tapered fibers are commonly used in  S P R -based sensors, resonator coupling, and other biosensing applications where sensitivity is ultimately achieved. The impact of the tapered fiber on sensor performance can be summarized as follows.
  • Concentration of light: the tapered region of the fiber is responsible for focusing the light and increasing the intensity of the evanescent field at the sensor’s surface [204].
  • Enhanced detection: the improved evanescent field enhances the sensitivity of the sensor to respond against tiny changes in the  R I  or the binding of biomolecules to the sensor surface [205].
J-shaped and Ω-shaped fiber: The Ω-shaped and J-shaped fibers are characterized by a compact and bent structure that enables integration into small-scale, high-performance optical systems, as represented in Figure 15c. The bending is designed to focus the light on the surface and optimize the interaction with the analyte. These shaped fibers are used in integrated biosensing platforms where space and miniaturization are most important. The impact of the tapered fiber on sensor performance can be summarized as follows.
  • Compactness and integration: These shape fibers are physically small but quite efficient, making them suitable for use in compact device designs without compromising performance. The small form of these sensors is ideal to be used for portable or wearable diagnostic devices [206].
  • Localized sensing: The light in these sensors is confined to specific regions of the fiber, allowing for the focused detection of localized binding molecules [207].
Despite having these common properties, Ω-shaped fiber provides more interaction length due to a looped structure, resulting in higher sensitivity, whereas J-shaped fiber, due to its simple structure, is preferred when ease of fabrication or mechanical robustness is required.
Helically shaped fiber: Helically shaped fibers are wound into a spiral configuration and used in fiber-optic sensors mostly for polarization control operations, as represented in Figure 15(di). The coiled structure allows the fiber to interact with the analyte over multiple passes, which increases the interaction area and ultimately increases the sensitivity. These shapes also assist in controlling light polarization, which is helpful for sensing applications, as presented in Figure 15(dii–dvii). The impact of helical fiber on sensor performance can be summarized as follows.
  • Multi-pass interaction: the helical geometry enables multiple passes of light, increasing the path length and finally the interaction with the analyte [208].
  • Polarization control: the helical design of the fiber assists in controlling the polarization state of light and improving the sensitivity for molecular interactions [209].
  • Increased surface area: the helical configuration increases the effective sensing surface area for biomolecule binding, allowing more biomolecules to bind and, therefore, enhancing the sensor’s overall sensitivity and durability [210].
Figure 15. Classification of fiber sensors based on shape. (a) U-shaped fiber [203]. (b) Tapered fiber [204]. (c) (ci) J-shaped fiber [207]. (cii) Ω-shaped fiber [207]. (d) (di) Helically shaped fiber. (dii) Left-hand circular polarization (LHCP−1). (diii) LHCP−2. (div) LHCP−3. (dv) Right-hand circular polarization (RHCP−1). (dvi) RHCP−2. (dvii) RHCP−3 [209].
Biosensors 15 00292 g015

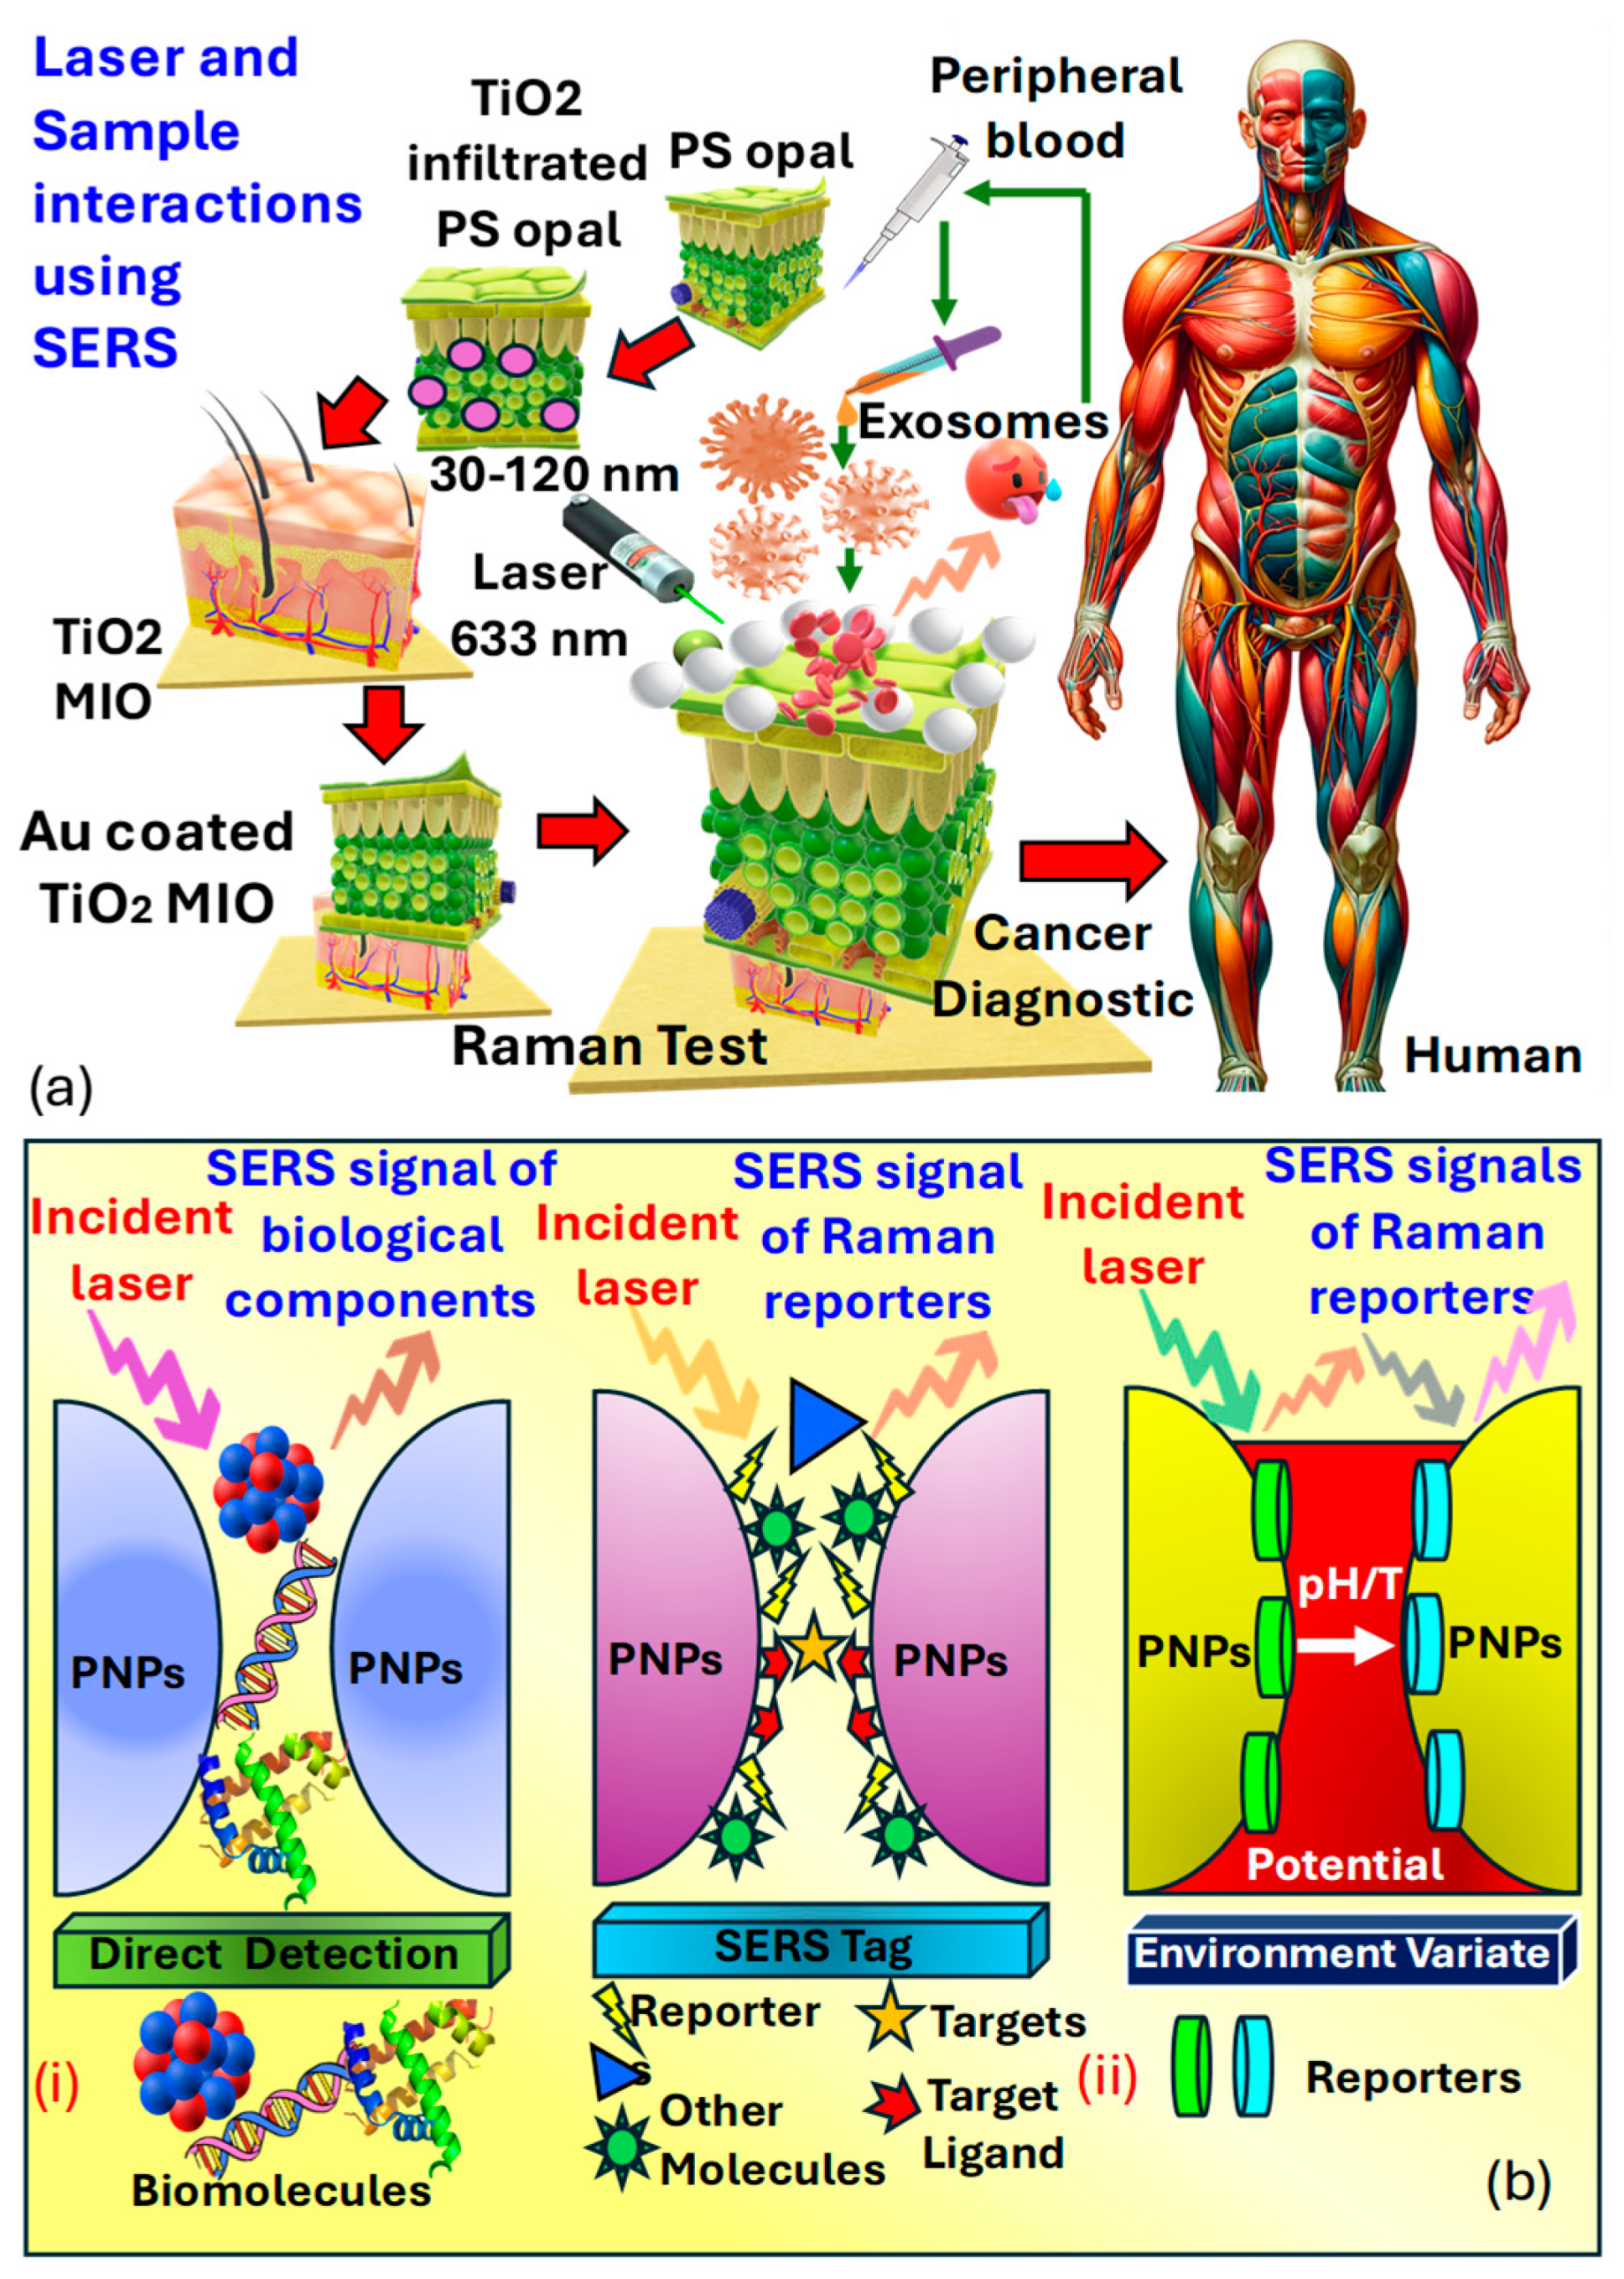
3.7. Classification of Raman SERS

Surface-enhanced Raman spectroscopy  ( S E R S )  is an analytical technique that involves shining monochromatic light onto a sample and measuring the scattered light, providing information about the sample’s molecular composition, structure, and distribution [72]. Its label-free nature, high sensitivity, and specificity make it valuable for cancer detection, allowing for a real-time analysis of tissues during surgery to ensure complete tumor removal and minimize damage to healthy tissue [211]. Raman spectroscopy can differentiate between normal and cancerous tissues based on their molecular signatures and has been applied to various cancer types for diagnosis, intraoperative margin assessment, and monitoring treatment response. Its ability to detect molecular changes and multiplexing capability offers comprehensive molecular profiling and personalized patient care, with minimal sample preparation requirements [212]. Harron et al. [211] investigated the development of a macro-porous  S E R S  probe for cancer detection utilizing  E X O s  as presented in Figure 16a. Notably, the presence of phosphoproteins within  E X O s  serves as a key factor in cancer detection. Within the realm of molecular biology  N P s  composed of proteins, lipids, and nucleic acids, known as  E X O s , are prevalent. These particles, enclosed in a lipid bilayer, typically range in size from  35 110   nm E X O s  have emerged as an intriguing source of biomarkers in clinical diagnostics. However, their structural and compositional modifications allow them to mitigate the adverse effects of proteases and other enzymes. Furthermore, the presence of phosphoproteins within  E X O s  forms the basis for cancer detection.
Sensitive three-dimensional  3 D ,   A u T i O 2  microporous inverse opal  ( M I O )  structures were created to enhance interactions between the laser and the sample for precise  S E R S  measurements. A spectral analysis of exosome vesicles in plasma samples from both prostate cancer patients and healthy individuals demonstrated the capability for detecting prostate cancer in biomedical contexts. This was achieved by observing the signal strength of the  1087   cm 1  peak, associated with  E X O s  in plasma. The notable peak at  1087   cm 1  in  S E R S  analysis is linked to phosphate bond scattering, which is directly related to protein phosphorylation, thus acting as an efficient marker for cancer diagnosis. It was observed that the  S E R S  peak at  1087   cm 1  from  E X O s  derived from cancer cell lines was twice as intense compared to those from normal cells, rendering it a significant indicator applicable in prostate cancer diagnostics.
Li et al. [214] presented an advanced enhancing structure, and substrates have greatly expanded the applications of  S E R S , particularly in the biomedical and life sciences fields. Two main methodologies exist for constructing  S E R S -based biosensors, including label-free detection and indirect detection requiring  S E R S  tags. Biosensors utilizing direct detection offer molecular information about biomolecules by directly monitoring their intrinsic vibrations without the need for labeling molecules. In direct  S E R S  sensing, biomolecules are typically concentrated at the boundary of electromagnetic field, which enhances the substrates, as presented in Figure 16(bi), and surface-bound affinity agents are required for molecules unable to remain within this area or present in low concentrations. Nonetheless, direct sensing encounters limitations due to its intrinsic detection mechanism, where signals from specific biomolecules can be relatively low, intricate, and vulnerable to interference from other molecules within the matrix. In contrast, indirect  S E R S  sensing involves labeling specific  S E R S  signals onto enhancing substrates as  S E R S  tags represented in Figure 16(bii). While analyzing various forms of cancers, human body fluids can be effectively used as an analyte in cancer cell detection using the  S E R S  platform. Table 5 presents a summary of information about various human body fluids, the  S E R S  platform, methods, etc., used in cancer detection.
Hessvik et al. in [224] suggested that  E X O s , which facilitate communication with the tumor microenvironment through the transportation of proteins and nucleic acids, which has emerged as promising biomarkers for early cancer diagnosis, monitoring, and evaluating treatment effectiveness. However, quantitative and phenotypic studies of  E X O s  are hindered by their low protein content due to their small size. While  E L I S A  is the  A u  standard for exosome quantification, it struggles with capturing all target  E X O s  subpopulations and analyzing multiple samples rapidly. Currently, exosome quantification primarily relies on recognizing specific membrane surface proteins, as presented in Figure 17a.
Tian et al. [226] presented a flexible, nanoporous, wearable sensor featuring a goldnanostar  ( A u N S )   integrated with an ion track-etched polycarbonate coating as the  S E R S   sensor. This sensor’s nanoporous nature and flexibility enable convenient and effective sweat collection from different body parts. Even under stationary and mild exercise conditions, this epidermal  S E R S  sensor successfully captures spectral information from sweat analytes; the prototype developed by them is presented in Figure 17b. Shin et al. [227] presented an AI framework for cancer detection; the initial phase involves assigning diagnostic scores, which are determined by averaging the outcomes of a multiple instance learning-based cancer classifier, as presented in Figure 17c. Su et al. [228] demonstrated a quantitative analysis of cancerous  E X O s  in breast cancer using a  S E R S -based lateral flow strip  ( L F S ) ,  offering faster detection compared to  E L I S A  due to the operational simplicity of  L F S .  However, exosome quantification currently provides only quantitative information without distinguishing between different cancer types. Although the mass spectrometry analysis of exosome proteins offers high sensitivity and specificity, it requires sophisticated sample pretreatment and complex instrumentation. To streamline operation steps and reduce analysis times, integrated and malfunctional  S E R S   sensing platforms have been proposed.
Li et al. [225,229] proposed multiplexed quantitative profiling of  E X O s  proteins present in breast cancer patients developed an integrated  S E R S V L A  platform capable of filtration, injection, and multi-indicator detection within 10 min. Body fluid sweat contains a lot of information regarding human physiological states, as has long been recognized, yet challenges in its collection and analysis have hindered extensive study [230]. However, with advancements in technologies like micronano device fabrication and integrated hardware/software systems, wearable sensors are emerging as a prominent solution for  P O C T .   Zheng et al. [231] presented a biosensor that boasts high conformability and biocompatibility to the skin, facilitated by their excellent mechanical flexibility. This flexibility proves invaluable in sweat collection and analysis, leading to the exploration of several compact wearable plasmonic biosensors for label-free detection of sweat-based  S E R S  methods [232,233].

4. Summary and Future Perspective

This study concentrates on the advancements in optical biosensing methodologies for the detection of various cancer types. Presently, optical biosensors are prioritizing the enhancement of sensitivity, lowering detection limits, and targeting specific biomarkers for the early detection of cancer. It is worth noting that there is no universal marker for detecting all types of cancers, presenting a challenge in disease detection. Optical biosensors offer convenient access to anatomical areas that are typically hard to reach, such as the thoracic wall. Several successful strategies, including the utilization of  N P s , nanocavity structures,  2 D  materials, and variously shaped fiber cores, have been documented to amplify optical signals and facilitate the detection of low concentrations of diverse biomarkers and cancer cells. Each type of optical biosensor offers distinct advantages and drawbacks. Plasmonic biosensors, including  S P R L S P R , and  S E R S , boast advantages such as rapid, real-time, and label-free detection. However,  L S P R  biosensors are prone to interference from nonspecific species, potentially yielding false results in complex environments. Although  S P R  and  L S P R  biosensors are commercialized, they suffer from limited specificity, detection limits, and signal-to-noise ratios, requiring large and complex equipment [61]. Colorimetric biosensors are readily available commercially, offering simplicity, rapidity, portability, and cost-effectiveness without the need for sophisticated analytical tools. However, these qualitative sensors often exhibit limited sensitivity and multiplexing capabilities. Conversely, interferometric biosensors, for instance, struggle with challenges such as low coupling efficiency, packaging issues, and precise alignment requirements [150]. Fluorescence biosensors encounter difficulties in pinpointing specific targets due to the inherent fluorescence of tissues or cells, which can generate background signals. Additionally, maintaining a clear solution is necessary to prevent interference among molecules. The complexity and cost escalate due to the necessity of components like filter fluorometers and spectrofluorometers. Furthermore, controlling the binding site of fluorescent molecules presents challenges, potentially leading to false results through interactions with target molecules. Drawbacks such as limited multiplexing, prolonged assay times, photobleaching, and phototoxicity further hinder fluorescence-based approaches [234]. Electrochemiluminescence-based sensors offer high sensitivity, simplicity, miniaturization potential, stability, rapidity, disposability, and controllability. However, they may produce false positives or negative results due to intensity fluctuations. Challenges such as high background noise, environmental interference, low sensitivity, detection limits, and specificity hinder the widespread clinical and practical application of optical biosensors [235]. In waveguide and interferometer sensors, it is important to note that the interferometer sacrifices potential information available from independent  T E  and  T M  modes to achieve a lower detection limit for changes across the surface area. Moreover, the realization of a fully integrated difference interferometer poses challenges due to the robustness and integration difficulties associated with the components. The requirement for end-fire coupling to excite the modes and the detection relying on the interference pattern created off-chip necessitates high mechanical stability of the device, potentially limiting its suitability for  P O C  applications [236].  S E R S -based sensors excel in detecting analytes in opaque solutions like blood or urine with single molecule-level sensitivity, specificity, and multiplexing capabilities. Despite their advantages,  S E R S  biosensors face challenges such as substrate degradation over time, the need for spectral analysis software, and bulky optical components. Both  S E R S  and fluorescence techniques offer ultrahigh sensitivity, enabling single molecule detection without the need for labeling [237]. The prospects of optical biosensors are vast and promising across numerous fields. In pharmacy and medicine, optical biosensors hold the potential to revolutionize drug discovery, personalized medicine, and the real-time monitoring of therapeutic efficacy [238,239]. Food and beverage inspection and safety stand to benefit from the rapid and sensitive detection capabilities of optical biosensors, ensuring the quality and safety of consumables [240,241]. Industrial process monitoring can leverage optical biosensors for precise and continuous monitoring of parameters crucial for manufacturing processes, enhancing efficiency and product quality [242,243]. In veterinary medicine and agriculture, optical biosensors offer opportunities for disease detection in livestock, monitoring environmental parameters, and optimizing agricultural practices for sustainable food production [244,245]. Disease diagnosis and healthcare stand at the forefront of optical biosensor applications, enabling the early detection of diseases, including cancer and infectious diseases, and thereby facilitating timely intervention and improved patient outcomes [246,247]. Biotechnology and biosciences will see advancements in genetic analysis, protein detection, biomolecular interactions, resulting in innovation in research and development [248]. The military and defense sector can utilize optical biosensors for the rapid and sensitive detection of chemical and biological threats, enhancing national security [249]. Environmental inspection and safety benefits are the ability of optical biosensors to detect pollutants, pathogens, and hazardous substances, aiding in environmental monitoring and protection [250,251]. Considering the COVID-19 pandemic, optical biosensors have emerged as critical tools for the rapid detection of the virus, contributing to disease surveillance, outbreak control, and public health efforts [252,253,254]. As the field continues to evolve, optical biosensors hold tremendous promise in addressing diverse challenges across various sectors, ushering in a new era of sensing technology. Thus, optical biosensors have emerged as transformative tools in cancer diagnostics due to their high sensitivity, label-free detection capabilities, and potential for miniaturization and real-time monitoring. Among the sensors discussed in this article,  S P R  sensors, fluorescence-based sensors, Raman spectroscopy, and optical fiber-based sensors have shown remarkable promise in the early detection and classification of various cancer types. These sensors can detect several cancer biomarkers, circulating tumor cells ( C T C s ), exosomes, and other cancer-associated molecules at very low concentrations, offering a significant advantage over traditional diagnostic methods. For example,  P C F   S P R  biosensors have demonstrated high resolution and selectivity in detecting breast cancer cell lines such as MDA-MB-231 and MCF-7. Despite these advancements, in optical sensing techniques, several challenges persist in detecting the cancer. Some of the prominent challenges are listed as follows.
  • The biocompatibility and stability of sensing materials in complex biological environments are a major limitation for the sensing devices used today [255].
  • Production and standardization of sensor fabrication, along with the stable performance across different platforms, is a major challenge [255].
  • A fluctuating signal-to-noise ratio in complex blood or tissue extracts can affect sensor sensitivity [256].
  • The integration of these sensors with clinical workflows and real-time data interpretation tools, particularly in point-of-care settings, is still at an early stage and needs further development [257].
To overcome these challenges, several strategies can be adopted, such as the following.
  • Development of novel plasmonic and 2D materials like graphene, MXenes, and MoS2 which have the potential to significantly enhance sensor sensitivity and stability [258].
  • The merger of machine learning (ML) and artificial intelligence (AI) algorithms for signal pattern recognition and classification of cancer types from the optical sensor outputs [259].
  • Developing microfluidics-based lab-on-a-chip systems to ensure sample handling accurately and sensor integration in portable, automated platforms [260].
Lastly, optical sensors offer a powerful and non-invasive platform for cancer diagnostics. With continued innovation in materials science, data analytics, system integration, and using AI-based techniques. These devices can play a critical role in the future of personalized and precision oncology. Finally, in Table 6, we present the monetary aspects of using these biosensors in cancer diagnosis and detection.

5. Conclusions

This investigation has provided a comprehensive overview of various optical biosensors employed for the detection of cancer cells, related biomarkers, and different related prospects. The discussed technologies present a wide range of approaches, including  S P R  sensors,  L S P R  sensors, colorimetric sensors, fluorescence-based sensors, photonics and waveguide sensors, Raman spectroscopy-based sensors, and fiber optic sensors. Each of these technologies is explained in an exhaustive manner, offering unique advantages in terms of sensitivity, specificity, cost-effectiveness, and suitability for cancer detection. These optical biosensors hold significant promise in advancing cancer diagnostics by enabling early detection and improving patient health. Moving forward, continued research and development in this field will further enhance the capabilities and applicability of optical biosensors in the fight against cancer.

Author Contributions

A.R.: conceptualization; data curation; formal analysis; investigation; methodology; resources; supervision; validation; visualization; writing—original draft; writing—review and editing. A.K.S.: conceptualization; data curation; formal analysis; investigation; methodology; resources; supervision; validation; visualization; writing—original draft; writing—review and editing. A.B.: review, supervision; validation. All authors have read and agreed to the published version of the manuscript.

Funding

This research received no external funding.

Institutional Review Board Statement

Not applicable.

Informed Consent Statement

Not applicable.

Data Availability Statement

The raw data supporting the conclusions of this article will be made available by the authors upon request.

Acknowledgments

A.R. wishes to express her sincere gratitude to Ariel University for the Postdoctoral Fellowship (PDF) and financial support that enabled this research work. The authors acknowledge the use of the ChatGPT tool integrated with DALL·E 3 to generate Figure 2 in this article. The AI system assisted in the conceptualization and creation of these visuals by providing foundational representations, which were subsequently refined and adapted by the authors to align with the research context. All AI-generated content was thoroughly reviewed and edited, and the authors take full responsibility for the final version of the figure. The authors wish to thank all anonymous reviewers for their constructive and valuable suggestions in improving the content of the article.

Conflicts of Interest

The authors confirm that there are no financial or personal relationships that could be perceived as influencing the research presented in this paper.

Abbreviations

AbsAntibodies
AFMAtomic-force microscopy
AgSilver
Al Aluminum
APTESAminopropyl-triethoxysilane
ASAmplitude sensitivity
AS 1411Nucleole aptamers
AuGold
AuNSGold nanostar
BCPBromocresol purple
BSABovine serum albumin
CK17Cytokeratin 17
CVDChemical vapor deposition
CTComputed tomography
DIDe-ionized
DMMPDimethyl-methyl-phosphonate
EMDExternal metal deposition
EXO Exosomes
FAFolic acid
FEMFinite element method
FPI Fabry-Perot interferometer
FRETFluorescence resonance energy transfer
GCGas chromatography
GNRs Gold nanorods
GODGlucose oxidase
IMDInternal metal deposition
ITOIndium tin oxide
LFAs Lateral flow assays
LFSLateral flow strip
LSPRLocalized surface plasmon resonance
mb-RCAMulti-branched rolling circle amplification
MgF2Magnesium fluoride
MEMSMicro-electromechanical systems
MIOMicroporous inverse opal
MMVMicromechanical valves
MRIMagnetic resonance imaging
NOA-81Norland optical adhesive
NIRNear-infrared
NPsNanoparticles
OF Optical fiber
PBSPhosphate buffer saline
PCW Photonic crystal waveguide
PCFsPhotonic crystal fibers
PDMSPolydimethylsiloxane
PEG-400Polyethylene glycol
POC Point of care
POCTPoint-of-care testing
PTTPhotothermal therapy
PUA Polyurethane acrylate
RIRefractive index
RW Resonant wavelength
SiSilicon
SEM Scanning electron microscopy
SERSSurface-enhanced Raman spectroscopy
SPs Surface plasmons
SPPSurface plasmon polariton
SPRSurface plasmon resonance
SPWSurface plasmon wave
SR Sensor resolution
TCOsTransparent conductive oxides
TEMTransmission electron microscopy
TETransverse electric
TiO2 Titanium dioxide
TIRTotal internal reflection
TMTransverse magnetic
TMDCsTransition metal dichalcogenides
VIS-NIRVisible-near-infrared
VOCsVolatile organic compounds
WSWavelength sensitivity
2DTwo-dimensional
3D Three-dimensional

References

  1. Calabrese, E.J. Ethical failings: The problematic history of cancer risk assessment. Environ. Res. 2021, 193, 110582. [Google Scholar] [CrossRef]
  2. Gerstung, M.; Jolly, C.; Leshchiner, I.; Dentro, S.C.; Gonzalez, S.; Rosebrock, D.; Mitchell, T.J.; Rubanova, Y.; Anur, P.; Yu, K.; et al. The evolutionary history of 2,658 cancers. Nature 2020, 578, 122–128. [Google Scholar] [CrossRef] [PubMed]
  3. Pisignano, G.; Michael, D.C.; Visal, T.H.; Pirlog, R.; Ladomery, M.; Calin, G.A. Going circular: History, present, and future of circRNAs in cancer. Oncogene 2023, 42, 2783–2800. [Google Scholar] [CrossRef] [PubMed]
  4. Pinker, K.; Chin, J.; Melsaether, A.N.; Morris, E.A.; Moy, L. Precision Medicine and Radiogenomics in Breast Cancer: New Approaches toward Diagnosis and Treatment. Radiology 2018, 287, 732–747. [Google Scholar] [CrossRef] [PubMed]
  5. Masuda, T.; Hayashi, N.; Iguchi, T.; Ito, S.; Eguchi, H.; Mimori, K. Clinical and biological significance of circulating tumor cells in cancer. Mol. Oncol. 2016, 10, 408–417. [Google Scholar] [CrossRef]
  6. Sterner, R.C.; Sterner, R.M. CAR-T cell therapy: Current limitations and potential strategies. Blood Cancer J. 2021, 11, 69. [Google Scholar] [CrossRef]
  7. June, C.H.; O’Connor, R.S.; Kawalekar, O.U.; Ghassemi, S.; Milone, M.C. CAR T cell immunotherapy for human cancer. Science 2018, 359, 1361–1365. [Google Scholar] [CrossRef]
  8. Ramola, A.; Marwaha, A.; Singh, S. Design and investigation of a dedicated PCF SPR biosensor for CANCER exposure employing external sensing. Appl. Phys. A 2021, 127, 643. [Google Scholar] [CrossRef]
  9. Chen, X.; Zeh, H.J.; Kang, R.; Kroemer, G.; Tang, D. Cell death in pancreatic cancer: From pathogenesis to therapy. Nat. Rev. Gastroenterol. Hepatol. 2021, 18, 804–823. [Google Scholar] [CrossRef]
  10. Koren, E.; Fuchs, Y. Modes of Regulated Cell Death in Cancer. Cancer Discov. 2021, 11, 245–265. [Google Scholar] [CrossRef]
  11. Williamson, C.W.; Sherer, M.V.; Zamarin, D.; Sharabi, A.B.; Dyer, B.A.; Mell, L.K.; Mayadev, J.S. Immunotherapy and radiation therapy sequencing: State of the data on timing, efficacy, and safety. Cancer 2021, 127, 1553–1567. [Google Scholar] [CrossRef] [PubMed]
  12. Patil, V.M.; Noronha, V.; Joshi, A.; Abhyankar, A.; Menon, N.; Dhumal, S.; Prabhash, K. Beyond conventional chemotherapy, targeted therapy and immunotherapy in squamous cell cancer of the oral cavity. Oral Oncol. 2020, 105, 104673. [Google Scholar] [CrossRef] [PubMed]
  13. Bray, F.; Laversanne, M.; Weiderpass, E.; Soerjomataram, I. The ever-increasing importance of cancer as a leading cause of premature death worldwide. Cancer 2021, 127, 3029–3030. [Google Scholar] [CrossRef]
  14. Goyal, A.; O’Leary, D.; Goyal, K.; Patel, K.; Pearson, D.; Janakiram, M. Cutaneous T-cell lymphoma is associated with increased risk of lymphoma, melanoma, lung cancer, and bladder cancer. J. Am. Acad. Dermatol. 2021, 85, 1418–1428. [Google Scholar] [CrossRef]
  15. Todorova, K.; Mandinova, A. Novel approaches for managing aged skin and nonmelanoma skin cancer. Adv. Drug Deliv. Rev. 2020, 153, 18–27. [Google Scholar] [CrossRef] [PubMed]
  16. Abdelrahman, L.; Al Ghamdi, M.; Collado-Mesa, F.; Abdel-Mottaleb, M. Convolutional neural networks for breast cancer detection in mammography: A survey. Comput. Biol. Med. 2021, 131, 104248. [Google Scholar] [CrossRef]
  17. Amelio, I.; Bertolo, R.; Bove, P.; Buonomo, O.C.; Candi, E.; Chiocchi, M.; Cipriani, C.; Di Daniele, N.; Ganini, C.; Juhl, H.; et al. Liquid biopsies and cancer omics. Cell Death Discov. 2020, 6, 131. [Google Scholar] [CrossRef]
  18. Drost, F.-J.H.; Osses, D.; Nieboer, D.; Bangma, C.H.; Steyerberg, E.W.; Roobol, M.J.; Schoots, I.G. Prostate Magnetic Resonance Imaging, with or Without Magnetic Resonance Imaging-targeted Biopsy, and Systematic Biopsy for Detecting Prostate Cancer: A Cochrane Systematic Review and Meta-analysis. Eur. Urol. 2020, 77, 78–94. [Google Scholar] [CrossRef]
  19. Zhao, Q.; Lu, D.; Zhang, G.; Zhang, D.; Shi, X. Recent improvements in enzyme-linked immunosorbent assays based on nanomaterials. Talanta 2021, 223, 121722. [Google Scholar] [CrossRef]
  20. Kawasaki, M.; Ikeda, Y.; Ikeda, E.; Takahashi, M.; Tanaka, D.; Nakajima, Y.; Arakawa, S.; Izumi, Y.; Miyake, S. Oral infectious bacteria in dental plaque and saliva as risk factors in patients with esophageal cancer. Cancer 2021, 127, 512–519. [Google Scholar] [CrossRef]
  21. Byra, M.; Dobruch-Sobczak, K.; Klimonda, Z.; Piotrzkowska-Wroblewska, H.; Litniewski, J. Early Prediction of Response to Neoadjuvant Chemotherapy in Breast Cancer Sonography Using Siamese Convolutional Neural Networks. IEEE J. Biomed. Health Inform. 2021, 25, 797–805. [Google Scholar] [CrossRef] [PubMed]
  22. Galati, F.; Moffa, G.; Pediconi, F. Breast imaging: Beyond the detection. Eur. J. Radiol. 2022, 146, 110051. [Google Scholar] [CrossRef]
  23. Esagian, S.M.; Grigoriadou, G.Ι.; Nikas, I.P.; Boikou, V.; Sadow, P.M.; Won, J.-K.; Economopoulos, K.P. Comparison of liquid-based to tissue-based biopsy analysis by targeted next generation sequencing in advanced non-small cell lung cancer: A comprehensive systematic review. J. Cancer Res. Clin. Oncol. 2020, 146, 2051–2066. [Google Scholar] [CrossRef] [PubMed]
  24. Argilés, G.; Tabernero, J.; Labianca, R.; Hochhauser, D.; Salazar, R.; Iveson, T.; Laurent-Puig, P.; Quirke, P.; Yoshino, T.; Taieb, J.; et al. Localised colon cancer: ESMO Clinical Practice Guidelines for diagnosis, treatment and follow-up. Ann. Oncol. 2020, 31, 1291–1305. [Google Scholar] [CrossRef] [PubMed]
  25. Heidrich, I.; Ačkar, L.; Mossahebi Mohammadi, P.; Pantel, K. Liquid biopsies: Potential and challenges. Int. J. Cancer 2021, 148, 528–545. [Google Scholar] [CrossRef]
  26. Di Capua, D.; Bracken-Clarke, D.; Ronan, K.; Baird, A.-M.; Finn, S. The Liquid Biopsy for Lung Cancer: State of the Art, Limitations and Future Developments. Cancers 2021, 13, 3923. [Google Scholar] [CrossRef]
  27. Ma, T.M.; Lamb, J.M.; Casado, M.; Wang, X.; Basehart, T.V.; Yang, Y.; Low, D.; Sheng, K.; Agazaryan, N.; Nickols, N.G.; et al. Magnetic resonance imaging-guided stereotactic body radiotherapy for prostate cancer (mirage): A phase iii randomized trial. BMC Cancer 2021, 21, 538. [Google Scholar] [CrossRef]
  28. Arnold, T.C.; Freeman, C.W.; Litt, B.; Stein, J.M. Low-field MRI: Clinical promise and challenges. J. Magn. Reson. Imaging 2023, 57, 25–44. [Google Scholar] [CrossRef]
  29. Gupta, I.; Freid, B.; Masarapu, V.; Machado, P.; Trabulsi, E.; Wallace, K.; Halpern, E.; Forsberg, F. Transrectal Subharmonic Ultrasound Imaging for Prostate Cancer Detection. Urology 2020, 138, 106–112. [Google Scholar] [CrossRef]
  30. Wang, Y.; Ge, X.; Ma, H.; Qi, S.; Zhang, G.; Yao, Y. Deep Learning in Medical Ultrasound Image Analysis: A Review. IEEE Access 2021, 9, 54310–54324. [Google Scholar] [CrossRef]
  31. Toğaçar, M. Disease type detection in lung and colon cancer images using the complement approach of inefficient sets. Comput. Biol. Med. 2021, 137, 104827. [Google Scholar] [CrossRef]
  32. Turkoglu, M. COVIDetectioNet: COVID-19 diagnosis system based on X-ray images using features selected from pre-learned deep features ensemble. Appl. Intell. 2021, 51, 1213–1226. [Google Scholar] [CrossRef]
  33. Daryanani, A.; Turkbey, B. Recent Advancements in CT and MR Imaging of Prostate Cancer. Semin. Nucl. Med. 2022, 52, 365–373. [Google Scholar] [CrossRef] [PubMed]
  34. Withers, P.J.; Bouman, C.; Carmignato, S.; Cnudde, V.; Grimaldi, D.; Hagen, C.K.; Maire, E.; Manley, M.; Du Plessis, A.; Stock, S.R. X-ray computed tomography. Nat. Rev. Methods Primer 2021, 1, 18. [Google Scholar] [CrossRef]
  35. Hosoe, N.; Limpias Kamiya, K.J.L.; Hayashi, Y.; Sujino, T.; Ogata, H.; Kanai, T. Current status of colon capsule endoscopy. Dig. Endosc. 2021, 33, 529–537. [Google Scholar] [CrossRef] [PubMed]
  36. Tang, Y.; Anandasabapathy, S.; Richards-Kortum, R. Advances in optical gastrointestinal endoscopy: A technical review. Mol. Oncol. 2021, 15, 2580–2599. [Google Scholar] [CrossRef] [PubMed]
  37. Murphy, C.C.; Sen, A.; Watson, B.; Gupta, S.; Mayo, H.; Singal, A.G. A Systematic Review of Repeat Fecal Occult Blood Tests for Colorectal Cancer Screening. Cancer Epidemiol. Biomark. Prev. 2020, 29, 278–287. [Google Scholar] [CrossRef]
  38. Hu, L.; Yue, Q.; Tang, T.; Sun, Y.; Zou, J.; Huang, Y.; Zeng, X.; Zeng, Y. Knowledge and belief of fecal occult blood screening: A systematic review. Public Health Nurs. 2023, 40, 782–789. [Google Scholar] [CrossRef]
  39. Yusim, I.; Krenawi, M.; Mazor, E.; Novack, V.; Mabjeesh, N.J. The use of prostate specific antigen density to predict clinically significant prostate cancer. Sci. Rep. 2020, 10, 20015. [Google Scholar] [CrossRef]
  40. Garg, S.; Sachdeva, A.; Peeters, M.; McClements, J. Point-of-Care Prostate Specific Antigen Testing: Examining Translational Progress toward Clinical Implementation. ACS Sens. 2023, 8, 3643–3658. [Google Scholar] [CrossRef]
  41. Sechopoulos, I.; Teuwen, J.; Mann, R. Artificial intelligence for breast cancer detection in mammography and digital breast tomosynthesis: State of the art. Semin. Cancer Biol. 2021, 72, 214–225. [Google Scholar] [CrossRef] [PubMed]
  42. Geuzinge, H.A.; Heijnsdijk, E.A.M.; Obdeijn, I.-M.; de Koning, H.J.; Tilanus-Linthorst, M.M.A. Experiences, expectations and preferences regarding MRI and mammography as breast cancer screening tools in women at familial risk. Breast 2021, 56, 1–6. [Google Scholar] [CrossRef]
  43. Johnson, N.L.; Head, K.J.; Scott, S.F.; Zimet, G.D. Persistent Disparities in Cervical Cancer Screening Uptake: Knowledge and Sociodemographic Determinants of Papanicolaou and Human Papillomavirus Testing Among Women in the United States. Public Health Rep. 2020, 135, 483–491. [Google Scholar] [CrossRef] [PubMed]
  44. Swid, M.A.; Monaco, S.E. Should screening for cervical cancer go to primary human papillomavirus testing and eliminate cytology? Mod. Pathol. 2022, 35, 858–864. [Google Scholar] [CrossRef] [PubMed]
  45. Carrascosa, L.G.; Huertas, C.S.; Lechuga, L.M. Prospects of optical biosensors for emerging label-free RNA analysis. TrAC Trends Anal. Chem. 2016, 80, 177–189. [Google Scholar] [CrossRef]
  46. Moorthy, D.N.; Dhinasekaran, D.; Rebecca, P.N.B.; Rajendran, A.R. Optical Biosensors for Detection of Cancer Biomarkers: Current and Future Perspectives. J. Biophotonics 2024, 17, e202400243. [Google Scholar] [CrossRef]
  47. Qaddare, S.H.; Salimi, A. Amplified fluorescent sensing of DNA using luminescent carbon dots and AuNPs/GO as a sensing platform: A novel coupling of FRET and DNA hybridization for homogeneous HIV-1 gene detection at femtomolar level. Biosens. Bioelectron. 2017, 89, 773–780. [Google Scholar] [CrossRef]
  48. Yan, X.; Zhao, X.-E.; Sun, J.; Zhu, S.; Lei, C.; Li, R.; Gong, P.; Ling, B.; Wang, R.; Wang, H. Probing glutathione reductase activity with graphene quantum dots and gold nanoparticles system. Sens. Actuators B Chem. 2018, 263, 27–35. [Google Scholar] [CrossRef]
  49. Mousavi, S.M.; Mahdian, S.M.A.; Ebrahimi, M.S.; Taghizadieh, M.; Vosough, M.; Nahand, J.S.; Hosseindoost, S.; Vousooghi, N.; Javar, H.A.; Larijani, B.; et al. Microfluidics for detection of exosomes and microRNAs in cancer: State of the art. Mol. Ther.—Nucleic Acids 2022, 28, 758–791. [Google Scholar] [CrossRef]
  50. Yang, X.; Xie, X.; Liu, S.; Ma, W.; Zheng, Z.; Wei, H.; Yu, C.-Y. Engineered Exosomes as Theranostic Platforms for Cancer Treatment. ACS Biomater. Sci. Eng. 2023, 9, 5479–5503. [Google Scholar] [CrossRef]
  51. Nakase, I.; Takatani-Nakase, T. Exosomes: Breast cancer-derived extracellular vesicles; recent key findings and technologies in disease progression, diagnostics, and cancer targeting. Drug Metab. Pharmacokinet. 2022, 42, 100435. [Google Scholar] [CrossRef] [PubMed]
  52. Whitham, D.; Bruno, P.; Haaker, N.; Arcaro, K.F.; Pentecost, B.T.; Darie, C.C. Deciphering a proteomic signature for the early detection of breast cancer from breast milk: The role of quantitative proteomics. Expert Rev. Proteom. 2024, 21, 81–98. [Google Scholar] [CrossRef] [PubMed]
  53. Rich, R.L.; Myszka, D.G. BIACORE J: A new platform for routine biomolecular interaction analysis. J. Mol. Recognit. 2001, 14, 223–228. [Google Scholar] [CrossRef]
  54. Fidler, M.J.; Fhied, C.L.; Roder, J.; Basu, S.; Sayidine, S.; Fughhi, I.; Pool, M.; Batus, M.; Bonomi, P.; Borgia, J.A. The serum-based VeriStrat® test is associated with proinflammatory reactants and clinical outcome in non-small cell lung cancer patients. BMC Cancer 2018, 18, 310. [Google Scholar] [CrossRef]
  55. Flanagan, M.B.; Dabbs, D.J.; Brufsky, A.M.; Beriwal, S.; Bhargava, R. Histopathologic variables predict Oncotype DXTM Recurrence Score. Mod. Pathol. 2008, 21, 1255–1261. [Google Scholar] [CrossRef]
  56. Shakya, A.K.; Singh, S. State of the Art Alliance of Refractive Index Sensing and Spectroscopy Techniques for Household Oils Analysis. Plasmonics 2023, 18, 2347–2364. [Google Scholar] [CrossRef]
  57. Shakya, A.K.; Singh, S. Novel Merger of spectroscopy and refractive index sensing for modelling hyper sensitive hexa-slotted plasmonic sensor for transformer oil monitoring in near-infrared region. Opt. Quantum Electron. 2023, 55, 764. [Google Scholar] [CrossRef]
  58. Shakya, A.K.; Singh, S. Performance Analysis of a Developed Optical Sensing Setup Based on the Beer-Lambert Law. Plasmonics 2024, 19, 447–455. [Google Scholar] [CrossRef]
  59. Shakya, A.K.; Singh, S. Design of a novel refractive index BIOSENSOR for heavy metal detection from water samples based on fusion of spectroscopy and refractive index sensing. Optik 2022, 270, 169892. [Google Scholar] [CrossRef]
  60. Xu, T.; Geng, Z. Strategies to improve performances of LSPR biosensing: Structure, materials, and interface modification. Biosens. Bioelectron. 2021, 174, 112850. [Google Scholar] [CrossRef]
  61. Yockell-Lelièvre, H.; Lussier, -F.; Masson, J.F. Influence of the Particle Shape and Density of Self-Assembled Gold Nanoparticle Sensors on LSPR and SERS. J. Phys. Chem. C 2015, 119, 51, 28577–28585. [Google Scholar] [CrossRef]
  62. Pellas, V.; Hu, D.; Mazouzi, Y.; Mimoun, Y.; Blanchard, J.; Guibert, C.; Salmain, M.; Boujday, S. Gold Nanorods for LSPR Biosensing: Synthesis, Coating by Silica, and Bioanalytical Applications. Biosensors 2020, 10, 146. [Google Scholar] [CrossRef] [PubMed]
  63. Kim, C.; Lee, H.; Devaraj, V.; Kim, W.-G.; Lee, Y.; Kim, Y.; Jeong, N.-N.; Choi, E.J.; Baek, S.H.; Han, D.-W.; et al. Hierarchical Cluster Analysis of Medical Chemicals Detected by a Bacteriophage-Based Colorimetric Sensor Array. Nanomaterials 2020, 10, 121. [Google Scholar] [CrossRef]
  64. Mauriz, E. Clinical Applications of Visual Plasmonic Colorimetric Sensing. Sensors 2020, 20, 6214. [Google Scholar] [CrossRef]
  65. Balbach, S.; Jiang, N.; Moreddu, R.; Dong, X.; Kurz, W.; Wang, C.; Dong, J.; Yin, Y.; Butt, H.; Brischwein, M.; et al. Smartphone-based colorimetric detection system for portable health tracking. Anal. Methods 2021, 13, 4361–4369. [Google Scholar] [CrossRef] [PubMed]
  66. Kumar Goshisht, M.; Tripathi, N. Fluorescence-based sensors as an emerging tool for anion detection: Mechanism, sensory materials and applications. J. Mater. Chem. C 2021, 9, 9820–9850. [Google Scholar] [CrossRef]
  67. Pérez, R.L.; Cong, M.; Vaughan, S.R.; Ayala, C.E.; Galpothdeniya, W.I.S.; Mathaga, J.K.; Warner, I.M. Protein Discrimination Using a Fluorescence-Based Sensor Array of Thiacarbocyanine-GUMBOS. ACS Sens. 2020, 5, 2422–2429. [Google Scholar] [CrossRef] [PubMed]
  68. Meher, N.; Barman, D.; Parui, R.; Krishnan Iyer, P. Recent development of the fluorescence-based detection of volatile organic compounds: A mechanistic overview. J. Mater. Chem. C 2022, 10, 10224–10254. [Google Scholar] [CrossRef]
  69. Li, J.; Qu, H.; Wang, J. Photonic Bragg waveguide platform for multichannel resonant sensing applications in the THz range. Biomed. Opt. Express 2020, 11, 2476–2489. [Google Scholar] [CrossRef]
  70. Kazanskiy, N.L.; Butt, M.A.; Khonina, S.N. Silicon photonic devices realized on refractive index engineered subwavelength grating waveguides—A review. Opt. Laser Technol. 2021, 138, 106863. [Google Scholar] [CrossRef]
  71. Vlk, M.; Datta, A.; Alberti, S.; Yallew, H.D.; Mittal, V.; Murugan, G.S.; Jágerská, J. Extraordinary evanescent field confinement waveguide sensor for mid-infrared trace gas spectroscopy. Light Sci. Appl. 2021, 10, 26. [Google Scholar] [CrossRef] [PubMed]
  72. Bell, S.E.J.; Charron, G.; Cortés, E.; Kneipp, J.; de la Chapelle, M.L.; Langer, J.; Procházka, M.; Tran, V.; Schlücker, S. Towards Reliable and Quantitative Surface-Enhanced Raman Scattering (SERS): From Key Parameters to Good Analytical Practice. Angew. Chem. Int. Ed. 2020, 59, 5454–5462. [Google Scholar] [CrossRef]
  73. Safar, W.; Azziz, A.; Edely, M.; Lamy de la Chapelle, M. Conventional Raman, SERS and TERS Studies of DNA Compounds. Chemosensors 2023, 11, 399. [Google Scholar] [CrossRef]
  74. Han, X.X.; Rodriguez, R.S.; Haynes, C.L.; Ozaki, Y.; Zhao, B. Surface-enhanced Raman spectroscopy. Nat. Rev. Methods Primer 2022, 1, 87. [Google Scholar] [CrossRef]
  75. Miliou, A. In-Fiber Interferometric-Based Sensors: Overview and Recent Advances. Photonics 2021, 8, 265. [Google Scholar] [CrossRef]
  76. Casquel, R.; Holgado, M.; Laguna, M.F.; Hernández, A.L.; Santamaría, B.; Lavín, Á.; Tramarin, L.; Herreros, P. Engineering vertically interrogated interferometric sensors for optical label-free biosensing. Anal. Bioanal. Chem. 2020, 412, 3285–3297. [Google Scholar] [CrossRef]
  77. Ushakov, N.; Markvart, A.; Kulik, D.; Liokumovich, L. Comparison of Pulse Wave Signal Monitoring Techniques with Different Fiber-Optic Interferometric Sensing Elements. Photonics 2021, 8, 142. [Google Scholar] [CrossRef]
  78. Heckmann, J.; Pufahl, K.; Franz, P.; Grosse, N.B.; Li, X.; Woggon, U. Plasmon-enhanced nonlinear yield in the Otto and Kretschmann configurations. Phys. Rev. B 2018, 98, 115415. [Google Scholar] [CrossRef]
  79. Zhao, Y.; Deng, Z.; Li, J. Photonic crystal fiber based surface plasmon resonance chemical sensors. Sens. Actuators B Chem. 2014, 202, 557–567. [Google Scholar] [CrossRef]
  80. Ramola, A.; Marwaha, A.; Singh, S. Design of a Triple-Layered Plasmonic Biosensor for Glucose Monitoring from Urine Sample for DIABETES Prevention. MAPAN 2023, 38, 511–525. [Google Scholar] [CrossRef]
  81. Ramola, A.; Singh, S.; Marwaha, A. Modelling and parameter quantification of plasmonic sensor based on external sensing for analysis of body liquids. Biosens. Bioelectron. X 2023, 14, 100358. [Google Scholar] [CrossRef]
  82. Vijayalakshmi, D.; Manimegalai, C.T.; Selvakumar, P. Bi-core photonic crystal fiber for blood component detection. J. Opt. 2023, 52, 42–49. [Google Scholar] [CrossRef]
  83. Islam, M.R.; Jamil, M.A.; Zaman, M.S.-U.; Ahsan, S.A.H.; Pulak, M.K.; Mehjabin, F.; Khan, M.M.I.; Chowdhury, J.A.; Islam, M. Design and analysis of birefringent SPR based PCF biosensor with ultra-high sensitivity and low loss. Optik 2020, 221, 165311. [Google Scholar] [CrossRef]
  84. Azab, M.Y.; Hameed, M.F.O.; Mahdiraji, G.A.; Adikan, F.R.M.; Obayya, S.S.A. Experimental and numerical characterization of a D-shaped PCF refractive index sensor. Opt. Quantum Electron. 2022, 54, 846. [Google Scholar] [CrossRef]
  85. Kumar Shakya, A.; Singh, S. Design of novel Penta core PCF SPR RI sensor based on fusion of IMD and EMD techniques for analysis of water and transformer oil. Measurement 2022, 188, 110513. [Google Scholar] [CrossRef]
  86. Shakya, A.K.; Singh, S. Design of refractive index sensing based on optimum combination of plasmonic materials gold with indium tin oxide/titanium dioxide. J. Nanophotonics 2022, 16, 026010. [Google Scholar] [CrossRef]
  87. Shakya, A.K.; Ramola, A.; Singh, S.; Van, V. Design of an ultra-sensitive bimetallic anisotropic PCF SPR biosensor for liquid analytes sensing. Opt. Express 2022, 30, 9233–9255. [Google Scholar] [CrossRef]
  88. Singh, S.; Prajapati, Y.K. TiO2/gold-graphene hybrid solid core SPR based PCF RI sensor for sensitivity enhancement. Optik 2020, 224, 165525. [Google Scholar] [CrossRef]
  89. Mittal, S.; Saharia, A.; Ismail, Y.; Petruccione, F.; Bourdine, A.V.; Morozov, O.G.; Demidov, V.V.; Yin, J.; Singh, G.; Tiwari, M.; et al. Design and Performance Analysis of a Novel Hoop-Cut SPR-PCF Sensor for High Sensitivity and Broad Range Sensing Applications. IEEE Sens. J. 2024, 24, 2697–2704. [Google Scholar] [CrossRef]
  90. Liu, W.; Liu, Z.; Zhang, Y.; Li, S.; Zhang, Y.; Yang, X.; Zhang, J.; Yuan, L. Specialty optical fibers and 2D materials for sensitivity enhancement of fiber optic SPR sensors: A review. Opt. Laser Technol. 2022, 152, 108167. [Google Scholar] [CrossRef]
  91. Danlard, I.; Akowuah, E.K. Assaying with PCF-based SPR refractive index biosensors: From recent configurations to outstanding detection limits. Opt. Fiber Technol. 2020, 54, 102083. [Google Scholar] [CrossRef]
  92. Ramola, A.; Marwaha, A.; Singh, S. Pregnancy Detection Through Modelling of Dual-Polarized Plasmonic PREGBIOSENSOR by Urine Samples Analysis. Plasmonics 2024, 19, 33–49. [Google Scholar] [CrossRef]
  93. Mumtaz, F.; Roman, M.; Zhang, B.; Abbas, L.G.; Dai, Y.; Ashraf, M.A.; Fiaz, M.A.; Kumar, A. MXene (Ti3C2Tx) coated highly-sensitive D-shaped photonic crystal fiber based SPR-biosensor. Photonics Nanostruct. Fundam. Appl. 2022, 52, 101090. [Google Scholar] [CrossRef]
  94. Yin, Z.; Jing, X.; Yang, H.; Chen, S. Lossy mode resonance generation with perovskite-coated photonic crystal fiber for sensing applications. Results Phys. 2023, 50, 106580. [Google Scholar] [CrossRef]
  95. Liu, W.; Wang, F.; Liu, C.; Yang, L.; Liu, Q.; Su, W.; Lv, J.; An, S.; Li, X.; Sun, T.; et al. A hollow dual-core PCF-SPR sensor with gold layers on the inner and outer surfaces of the thin cladding. Results Opt. 2020, 1, 100004. [Google Scholar] [CrossRef]
  96. Rifat, A.A.; Ahmed, R.; Yetisen, A.K.; Butt, H.; Sabouri, A.; Mahdiraji, G.A.; Yun, S.H.; Adikan, F.R.M. Photonic crystal fiber based plasmonic sensors. Sens. Actuators B Chem. 2017, 243, 311–325. [Google Scholar] [CrossRef]
  97. Fakhri, M.A.; Salim, E.T.; Sulaiman, G.M.; Albukhaty, S.; Ali, H.S.; Salim, Z.T.; Gopinath, S.C.B.; Hashim, U.; Al-aqbi, Z.T. Gold Nanowires Based on Photonic Crystal Fiber by Laser Ablation in Liquid to Improve Colon Biosensor. Plasmonics 2023, 18, 2447–2463. [Google Scholar] [CrossRef]
  98. Luo, W.; Li, X.; Abbasi, S.A.; Zhu, S.; Ho, H.-P.; Yuan, W. Analysis of the D-shaped PCF-based SPR sensor using Resonance Electron Relaxation and Fourier domain method. Opt. Lasers Eng. 2023, 166, 107588. [Google Scholar] [CrossRef]
  99. Zhao, Y.; Cheng, T.; Fu, R.; Hu, T.; Wei, L.; Li, H.; Yan, X. A novel surface plasmon resonance sensor sensitivity enhancement method for temperature measurement by depositing tungsten disulfide nanosheets on the silver film. Photonics Nanostruct.—Fundam. Appl. 2023, 56, 101156. [Google Scholar] [CrossRef]
  100. Yin, Z.; Jing, X.; Bai, G.; Wang, C.; Liu, C.; Gao, Z.; Li, K. A broadband SPR dual-channel sensor based on a PCF coated with sodium-silver for refractive index and temperature measurement. Results Phys. 2022, 41, 105943. [Google Scholar] [CrossRef]
  101. Liu, Z.; Tse, M.-L.V.; Wu, C.; Chen, D.; Lu, C.; Tam, H.-Y. Intermodal coupling of supermodes in a twin-core photonic crystal fiber and
its application as a pressure sensor. Opt. Express 2012, 20, 21749–21757. [Google Scholar] [CrossRef] [PubMed]
  102. Karim Qureshi, K.; Liu, Z.; Tam, H.-Y.; Fahad Zia, M. A strain sensor based on in-line fiber Mach–Zehnder interferometer in twin-core photonic crystal fiber. Opt. Commun. 2013, 309, 68–70. [Google Scholar] [CrossRef]
  103. Tse, M.-L.V.; Liu, Z.; Cho, L.-H.; Lu, C.; Wai, P.-K.A.; Tam, H.-Y. Superlattice Microstructured Optical Fiber. Materials 2014, 7, 4567–4573. [Google Scholar] [CrossRef]
  104. Luan, N.; Wang, R.; Lv, W.; Lu, Y.; Yao, J. Surface Plasmon Resonance Temperature Sensor Based on Photonic Crystal Fibers Randomly Filled with Silver Nanowires. Sensors 2014, 14, 16035–16045. [Google Scholar] [CrossRef]
  105. Feng, W.-Q.; Liu, Z.-Y.; Tam, H.-Y.; Yin, J.-H. The pore water pressure sensor based on Sagnac interferometer with polarization-maintaining photonic crystal fiber for the geotechnical engineering. Measurement 2016, 90, 208–214. [Google Scholar] [CrossRef]
  106. Li, B.; Cheng, T.; Chen, J.; Yan, X. Graphene-Enhanced Surface Plasmon Resonance Liquid Refractive Index Sensor Based on Photonic Crystal Fiber. Sensors 2019, 19, 3666. [Google Scholar] [CrossRef] [PubMed]
  107. Wong, G.K.L.; Chen, A.Y.H.; Ha, S.W.; Kruhlak, R.J.; Murdoch, S.G.; Leonhardt, R.; Harvey, J.D.; Joly, N.Y. Characterization of chromatic dispersion in photonic crystal fibers using scalar modulation instability. Opt. Express 2005, 13, 8662–8670. [Google Scholar] [CrossRef]
  108. Ibrahimi, K.M.; Kumar, R.; Pakhira, W. A graphene/Au/TiO2 coated dual-core PCF SPR biosensor with improved design and performance for early cancer cell detection of with high sensitivity. Optik 2023, 288, 171186. [Google Scholar] [CrossRef]
  109. Yasli, A. Cancer Detection with Surface Plasmon Resonance-Based Photonic Crystal Fiber Biosensor. Plasmonics 2021, 16, 1605–1612. [Google Scholar] [CrossRef]
  110. Pappu, M.H.; Rahman, A.; Mollah, M.A. An H-Shaped Exposed Core Surface Plasmon Resonance Sensor and Detection of Cancer Cells. Plasmonics 2024, 19, 2795–2811. [Google Scholar] [CrossRef]
  111. Mollah, M.A.; Yousufali, M.; Ankan, I.M.; Rahman, M.M.; Sarker, H.; Chakrabarti, K. Twin core photonic crystal fiber refractive index sensor for early detection of blood cancer. Sens. Bio-Sens. Res. 2020, 29, 100344. [Google Scholar] [CrossRef]
  112. Vasimalla, Y.; Singh, L. Design and Analysis of Planar Waveguide-Based SPR Sensor for Formalin Detection Using Ag-Chloride-BP Structure. IEEE Trans. NanoBiosci. 2023, 22, 365–374. [Google Scholar] [CrossRef] [PubMed]
  113. Gu, Y.; Yang, J.; Zhao, J.; Zhang, Y.; Yang, S.; Hu, J.; Zhao, M. Novel polymer waveguide-based surface plasmon resonance (SPR) sensor. Instrum. Sci. Technol. 2020, 48, 269–286. [Google Scholar] [CrossRef]
  114. Butt, M.A. Dielectric Waveguide-Based Sensors with Enhanced Evanescent Field: Unveiling the Dynamic Interaction with the Ambient Medium for Biosensing and Gas-Sensing Applications—A Review. Photonics 2024, 11, 198. [Google Scholar] [CrossRef]
  115. Du, W.; Miller, L.; Zhao, F. Numerical Study of Graphene/Au/SiC Waveguide-Based Surface Plasmon Resonance Sensor. Biosensors 2021, 11, 455. [Google Scholar] [CrossRef]
  116. Huang, F.; Moreno, Y.; Cai, J.; Cai, L.; Cai, H.; Dai, Y.; Sun, Y.; Yan, Z.; Guo, X. Refractive Index Sensitivity Characterization of Tilted Fiber Bragg Grating Based Surface Plasmon Resonance Sensor. J. Light. Technol. 2023, 41, 5737–5743. [Google Scholar] [CrossRef]
  117. Le, D.; Ranta-Lassila, A.; Sipola, T.; Karppinen, M.; Petäjä, J.; Kehusmaa, M.; Aikio, S.; Guo, T.-L.; Roussey, M.; Hiltunen, J.; et al. High-performance portable grating-based surface plasmon resonance sensor using a tunable laser at normal incidence. Photonics Res. 2024, 12, 947–958. [Google Scholar] [CrossRef]
  118. Kuroki, R.; Suzuki, S.; Yasunaga, S.; Oshita, M.; Kan, T. Grating-Based Surface Plasmon Resonance Sensor for Visible Light Employing a Metal/Semiconductor Junction for Electrical Readout. IEEE Sens. J. 2022, 22, 22557–22563. [Google Scholar] [CrossRef]
  119. Gnilitskyi, I.; Mamykin, S.V.; Lanara, C.; Hevko, I.; Dusheyko, M.; Bellucci, S.; Stratakis, E. Laser Nanostructuring for Diffraction Grating Based Surface Plasmon-Resonance Sensors. Nanomaterials 2021, 11, 591. [Google Scholar] [CrossRef]
  120. Young, S.-J.; Chu, Y.-J.; Liu, Y.-H. Low-Dark Current UV Photodetector Based on Photochemical Reduction Ag-Nanoparticles Decoration ZnO Nanostructure. IEEE Sens. J. 2024, 24, 36664–36671. [Google Scholar] [CrossRef]
  121. Daher, M.G.; Trabelsi, Y.; Ahmed, N.M.; Prajapati, Y.K.; Sorathiya, V.; Ahammad, S.H.; Priya, P.P.; Faragallah, O.S.; Rashed, A.N.Z. Detection of Basal Cancer Cells using Photodetector Based on a Novel Surface Plasmon Resonance Nanostructure Employing Perovskite Layer with an Ultra High Sensitivity. Plasmonics 2022, 17, 2365–2373. [Google Scholar] [CrossRef]
  122. Zhang, G.; Zhang, S.; Zheng, L.; Wu, H.; Wang, B.; He, Z.; Jin, Z.; Ye, C.; Wang, G. Localized Surface Plasmon Resonance Enables Si-Based Near-Infrared Photodetector. IEEE Trans. Electron Devices 2023, 70, 5497–5500. [Google Scholar] [CrossRef]
  123. Zhou, J.; Zeng, Y.; Wang, X.; Wu, C.; Cai, Z.; Gao, B.Z.; Gu, D.; Shao, Y. The capture of antibodies by antibody-binding proteins for ABO blood typing using SPR imaging-based sensing technology. Sens. Actuators B Chem. 2020, 304, 127391. [Google Scholar] [CrossRef]
  124. Singh, M.K.; Verma, V.K.; Pal, S.; Prajapati, Y.K.; Saini, J.P. Antimonene mediated long-range SPR imaging sensor with ultrahigh imaging sensitivity and figure of merit. Opt. Mater. 2021, 121, 111484. [Google Scholar] [CrossRef]
  125. Wu, W.; Yu, X.; Wu, J.; Wu, T.; Fan, Y.; Chen, W.; Zhao, M.; Wu, H.; Li, X.; Ding, S. Surface plasmon resonance imaging-based biosensor for multiplex and ultrasensitive detection of NSCLC-associated exosomal miRNAs using DNA programmed heterostructure of Au-on-Ag. Biosens. Bioelectron. 2021, 175, 112835. [Google Scholar] [CrossRef]
  126. Takemura, K. Surface Plasmon Resonance (SPR)- and Localized SPR (LSPR)-Based Virus Sensing Systems: Optical Vibration of Nano- and Micro-Metallic Materials for the Development of Next-Generation Virus Detection Technology. Biosensors 2021, 11, 250. [Google Scholar] [CrossRef] [PubMed]
  127. Kim, D.M.; Park, J.S.; Jung, S.-W.; Yeom, J.; Yoo, S.M. Biosensing Applications Using Nanostructure-Based Localized Surface Plasmon Resonance Sensors. Sensors 2021, 21, 3191. [Google Scholar] [CrossRef]
  128. Chen, J.-S.; Chen, P.-F.; Tzu-Han Lin, H.; Huang, N.-T. A Localized surface plasmon resonance (LSPR) sensor integrated automated microfluidic system for multiplex inflammatory biomarker detection. Analyst 2020, 145, 7654–7661. [Google Scholar] [CrossRef]
  129. Palani, S.; Kenison, J.P.; Sabuncu, S.; Huang, T.; Civitci, F.; Esener, S.; Nan, X. Multispectral Localized Surface Plasmon Resonance (msLSPR) Reveals and Overcomes Spectral and Sensing Heterogeneities of Single Gold Nanoparticles. ACS Nano 2023, 17, 2266–2278. [Google Scholar] [CrossRef]
  130. Tran Do, P.Q.; Thi Huong, V.; Truc Phuong, N.T.; Nguyen, T.-H.; Thi Ta, H.K.; Ju, H.; Bach Phan, T.; Phung, V.-D.; Loan Trinh, K.T.; Thi Tran, N.H. The highly sensitive determination of serotonin by using gold nanoparticles (Au NPs) with a localized surface plasmon resonance (LSPR) absorption wavelength in the visible region. RSC Adv. 2020, 10, 30858–30869. [Google Scholar] [CrossRef]
  131. Jazayeri, M.H.; Aghaie, T.; Nedaeinia, R.; Manian, M.; Nickho, H. Rapid noninvasive detection of bladder cancer using survivin antibody-conjugated gold nanoparticles (GNPs) based on localized surface plasmon resonance (LSPR). Cancer Immunol. Immunother. 2020, 69, 1833–1840. [Google Scholar] [CrossRef] [PubMed]
  132. Abdi, G.; Bahador, H. High sensitivity and optimum design of LSPR-based sensors by coupled nano-rings for cancer detection. Opt. Lasers Eng. 2024, 174, 107975. [Google Scholar] [CrossRef]
  133. Lee, J.U.; Nguyen, A.H.; Sim, S.J. A nanoplasmonic biosensor for label-free multiplex detection of cancer biomarkers. Biosens. Bioelectron. 2015, 74, 341–346. [Google Scholar] [CrossRef] [PubMed]
  134. Hammond, J.L.; Bhalla, N.; Rafiee, S.D.; Estrela, P. Localized Surface Plasmon Resonance as a Biosensing Platform for Developing Countries. Biosensors 2014, 4, 172–188. [Google Scholar] [CrossRef]
  135. Na, H.-K.; Wi, J.-S.; Son, H.Y.; Ok, J.G.; Huh, Y.-M.; Lee, T.G. Discrimination of single nucleotide mismatches using a scalable, flexible, and transparent three-dimensional nanostructure-based plasmonic miRNA sensor with high sensitivity. Biosens. Bioelectron. 2018, 113, 39–45. [Google Scholar] [CrossRef]
  136. Zeng, S.; Yong, K.-T.; Roy, I.; Dinh, X.-Q.; Yu, X.; Luan, F. A Review on Functionalized Gold Nanoparticles for Biosensing Applications. Plasmonics 2011, 6, 491–506. [Google Scholar] [CrossRef]
  137. Haes, A.J.; Zou, S.; Schatz, G.C.; Van Duyne, R.P. Nanoscale Optical Biosensor:  Short Range Distance Dependence of the Localized Surface Plasmon Resonance of Noble Metal Nanoparticles. J. Phys. Chem. B 2004, 108, 6961–6968. [Google Scholar] [CrossRef]
  138. Kim, J.; Oh, S.Y.; Shukla, S.; Hong, S.B.; Heo, N.S.; Bajpai, V.K.; Chun, H.S.; Jo, C.-H.; Choi, B.G.; Huh, Y.S.; et al. Heteroassembled gold nanoparticles with sandwich-immunoassay LSPR chip format for rapid and sensitive detection of hepatitis B virus surface antigen (HBsAg). Biosens. Bioelectron. 2018, 107, 118–122. [Google Scholar] [CrossRef]
  139. Aćimović, S.S.; Ortega, M.A.; Sanz, V.; Berthelot, J.; Garcia-Cordero, J.L.; Renger, J.; Maerkl, S.J.; Kreuzer, M.P.; Quidant, R. LSPR Chip for Parallel, Rapid, and Sensitive Detection of Cancer Markers in Serum. Nano Lett. 2014, 14, 2636–2641. [Google Scholar] [CrossRef]
  140. Law, W.-C.; Yong, K.-T.; Baev, A.; Prasad, P.N. Sensitivity Improved Surface Plasmon Resonance Biosensor for Cancer Biomarker Detection Based on Plasmonic Enhancement. ACS Nano 2011, 5, 4858–4864. [Google Scholar] [CrossRef]
  141. Ma, X.; Truong, P.L.; Anh, N.H.; Sim, S.J. Single gold nanoplasmonic sensor for clinical cancer diagnosis based on specific interaction between nucleic acids and protein. Biosens. Bioelectron. 2015, 67, 59–65. [Google Scholar] [CrossRef] [PubMed]
  142. Chen, C.; Liu, Y.; Zheng, Z.; Zhou, G.; Ji, X.; Wang, H.; He, Z. A new colorimetric platform for ultrasensitive detection of protein and cancer cells based on the assembly of nucleic acids and proteins. Anal. Chim. Acta 2015, 880, 1–7. [Google Scholar] [CrossRef] [PubMed]
  143. Udayan, G.; Marsella, A.; Valentini, P. An ultrasensitive colorimetric test for the detection of somatic rare mutations in DNA. Nanoscale 2020, 12, 2973–2979. [Google Scholar] [CrossRef]
  144. Borghei, Y.-S.; Hosseini, M.; Ganjali, M.R.; Ju, H. Colorimetric and energy transfer based fluorometric turn-on method for determination of microRNA using silver nanoclusters and gold nanoparticles. Microchim. Acta 2018, 185, 286. [Google Scholar] [CrossRef]
  145. Zhong, X.; Li, D.; Du, W.; Yan, M.; Wang, Y.; Huo, D.; Hou, C. Rapid recognition of volatile organic compounds with colorimetric sensor arrays for lung cancer screening. Anal. Bioanal. Chem. 2018, 410, 3671–3681. [Google Scholar] [CrossRef]
  146. Xu, L.; Chopdat, R.; Li, D.; Al-Jamal, K.T. Development of a simple, sensitive and selective colorimetric aptasensor for the detection of cancer-derived exosomes. Biosens. Bioelectron. 2020, 169, 112576. [Google Scholar] [CrossRef]
  147. Ratnarathorn, N.; Chailapakul, O.; Henry, C.S.; Dungchai, W. Simple silver nanoparticle colorimetric sensing for copper by paper-based devices. Talanta 2012, 99, 552–557. [Google Scholar] [CrossRef] [PubMed]
  148. Sun, J.; Lu, Y.; He, L.; Pang, J.; Yang, F.; Liu, Y. Colorimetric sensor array based on gold nanoparticles: Design principles and recent advances. TrAC Trends Anal. Chem. 2020, 122, 115754. [Google Scholar] [CrossRef]
  149. Askim, J.R.; Suslick, K.S. Hand-Held Reader for Colorimetric Sensor Arrays. Anal. Chem. 2015, 87, 7810–7816. [Google Scholar] [CrossRef]
  150. Carneiro, M.C.C.G.; Rodrigues, L.R.; Moreira, F.T.C.; Sales, M.G.F. Colorimetric Paper-Based Sensors against Cancer Biomarkers. Sensors 2022, 22, 3221. [Google Scholar] [CrossRef]
  151. Evans, E.; Gabriel, E.F.M.; Coltro, W.K.T.; Carlos, D.G. Rational selection of substrates to improve color intensity and uniformity on microfluidic paper-based analytical devices, (Communication). Analyst 2014, 139, 2127–2132. [Google Scholar] [CrossRef]
  152. Gao, X.; Xu, H.; Baloda, M.; Gurung, A.S.; Xu, L.-P.; Wang, T.; Zhang, X.; Liu, G. Visual detection of microRNA with lateral flow nucleic acid biosensor. Biosens. Bioelectron. 2014, 54, 578–584. [Google Scholar] [CrossRef]
  153. Akshaya, K.; Arthi, C.; Pavithra, A.J.; Poovizhi, P.; Antinate, S.S.; Hikku, G.S.; Jeyasubramanian, K.; Murugesan, R. Bioconjugated gold nanoparticles as an efficient colorimetric sensor for cancer diagnostics. Photodiagn. Photodyn. Ther. 2020, 30, 101699. [Google Scholar] [CrossRef]
  154. Peng, Y.; Wang, Z.; Liu, W.; Zhang, H.; Zuo, W.; Tang, H.; Chen, F.; Wang, B. Size- and shape-dependent peroxidase-like catalytic activity of MnFe2O4 Nanoparticles and their applications in highly efficient colorimetric detection of target cancer cells. Dalton Trans. 2015, 44, 12871–12877. [Google Scholar] [CrossRef] [PubMed]
  155. Miao, X.; Zhu, Z.; Jia, H.; Lu, C.; Liu, X.; Mao, D.; Chen, G. Colorimetric detection of cancer biomarker based on enzyme enrichment and pH sensing. Sens. Actuators B Chem. 2020, 320, 128435. [Google Scholar] [CrossRef]
  156. Jia, Y.; Zhang, B.; Chang, H.; Yu, F.; Zhao, Z. TiO2/SnOx-Au nanocomposite catalyzed photochromic reaction for colorimetric immunoassay of tumor marker. J. Pharm. Biomed. Anal. 2019, 169, 75–81. [Google Scholar] [CrossRef]
  157. Jia, S.; Li, P.; Koh, K.; Chen, H. A cytosensor based on NiO nanoparticle-enhanced surface plasmon resonance for detection of the breast cancer cell line MCF-7. Microchim. Acta 2016, 183, 683–688. [Google Scholar] [CrossRef]
  158. Rawat, K.A.; Bhamore, J.R.; Singhal, R.K.; Kailasa, S.K. Microwave assisted synthesis of tyrosine protected gold nanoparticles for dual (colorimetric and fluorimetric) detection of spermine and spermidine in biological samples. Biosens. Bioelectron. 2017, 88, 71–77. [Google Scholar] [CrossRef]
  159. Yuan, P.-X.; Deng, S.-Y.; Zheng, C.-Y.; Cosnier, S.; Shan, D. In situ formed copper nanoparticles templated by TdT-mediated DNA for enhanced SPR sensor-based DNA assay. Biosens. Bioelectron. 2017, 97, 1–7. [Google Scholar] [CrossRef]
  160. Kora, A.J.; Rastogi, L. Peroxidase activity of biogenic platinum nanoparticles: A colorimetric probe towards selective detection of mercuric ions in water samples. Sens. Actuators B Chem. 2018, 254, 690–700. [Google Scholar] [CrossRef]
  161. Ding, X.; Liow, C.H.; Zhang, M.; Huang, R.; Li, C.; Shen, H.; Liu, M.; Zou, Y.; Gao, N.; Zhang, Z.; et al. Surface plasmon resonance enhanced light absorption and photothermal therapy in the second near-infrared window. J. Am. Chem. Soc. 2014, 136, 15684–15693. [Google Scholar] [CrossRef] [PubMed]
  162. He, H.; Xu, X.; Wu, H.; Jin, Y. Enzymatic Plasmonic Engineering of Ag/Au Bimetallic Nanoshells and Their Use for Sensitive Optical Glucose Sensing. Adv. Mater. 2012, 24, 1736–1740. [Google Scholar] [CrossRef]
  163. Xiao, L.; Zhu, A.; Xu, Q.; Chen, Y.; Xu, J.; Weng, J. Colorimetric Biosensor for Detection of Cancer Biomarker by Au Nanoparticle-Decorated Bi2Se3 Nanosheets. ACS Appl. Mater. Interfaces 2017, 9, 6931–6940. [Google Scholar] [CrossRef]
  164. Fakhri, N.; Abarghoei, S.; Dadmehr, M.; Hosseini, M.; Sabahi, H.; Ganjali, M.R. Paper based colorimetric detection of miRNA-21 using Ag/Pt nanoclusters. Spectrochim. Acta A Mol. Biomol. Spectrosc. 2020, 227, 117529. [Google Scholar] [CrossRef]
  165. Moon, J.-S.; Kim, W.-G.; Shin, D.-M.; Lee, S.-Y.; Kim, C.; Lee, Y.; Han, J.; Kim, K.; Young Yoo, S.; Oh, J.-W. Bioinspired M-13 bacteriophage-based photonic nose for differential cell recognition. Chem. Sci. 2017, 8, 921–927. [Google Scholar] [CrossRef]
  166. Moon, J.-S.; Choi, E.J.; Jeong, N.-N.; Sohn, J.-R.; Han, D.-W.; Oh, J.-W. Research Progress of M13 Bacteriophage-Based Biosensors. Nanomaterials 2019, 9, 1448. [Google Scholar] [CrossRef] [PubMed]
  167. Sam, B.; George, L.; Varghese, A. Fluorescein Based Fluorescence Sensors for the Selective Sensing of Various Analytes. J. Fluoresc. 2021, 31, 1251–1276. [Google Scholar] [CrossRef]
  168. Mal, D.K.; Pal, H.; Chakraborty, G. A comprehensive review on recent advances in fluorescence-based bio-analytes sensing. TrAC Trends Anal. Chem. 2024, 171, 117493. [Google Scholar] [CrossRef]
  169. Liu, H.; Song, H.; Su, Y.; Lv, Y. Recent advances in black phosphorus-based optical sensors. Appl. Spectrosc. Rev. 2019, 54, 275–284. [Google Scholar] [CrossRef]
  170. Ponlakhet, K.; Phooplub, K.; Phongsanam, N.; Phongsraphang, T.; Phetduang, S.; Surawanitkun, C.; Buranachai, C.; Loilome, W.; Ngeontae, W. Smartphone-based portable fluorescence sensor with gold nanoparticle mediation for selective detection of nitrite ions. Food Chem. 2022, 384, 132478. [Google Scholar] [CrossRef]
  171. Fang, C.; Huang, Y.; Zhao, Y. Review of FRET biosensing and its application in biomolecular detection. Am. J. Transl. Res. 2023, 15, 694–709. [Google Scholar] [PubMed] [PubMed Central]
  172. Mohammadi, R.; Naderi-Manesh, H.; Farzin, L.; Vaezi, Z.; Ayarri, N.; Samandari, L.; Shamsipur, M. Fluorescence sensing and imaging with carbon-based quantum dots for early diagnosis of cancer: A review. J. Pharm. Biomed. Anal. 2022, 212, 114628. [Google Scholar] [CrossRef] [PubMed]
  173. García-Hernández, L.A.; Martínez-Martínez, E.; Pazos-Solís, D.; Aguado-Preciado, J.; Dutt, A.; Chávez-Ramírez, A.U.; Korgel, B.; Sharma, A.; Oza, G. Optical Detection of Cancer Cells Using Lab-on-a-Chip. Biosensors 2023, 13, 439. [Google Scholar] [CrossRef]
  174. Nedbal, J.; Visitkul, V.; Ortiz-Zapater, E.; Weitsman, G.; Chana, P.; Matthews, D.R.; Ng, T.; Ameer-Beg, S.M. Time-domain microfluidic fluorescence lifetime flow cytometry for high-throughput Förster resonance energy transfer screening. Cytometry A 2015, 87, 104–118. [Google Scholar] [CrossRef]
  175. Anand, P.; Fu, A.; Teoh, S.H.; Luo, K.Q. Application of a fluorescence resonance energy transfer (FRET)-based biosensor for detection of drug-induced apoptosis in a 3D breast tumor model. Biotechnol. Bioeng. 2015, 112, 1673–1682. [Google Scholar] [CrossRef]
  176. Chu, H.; Zhao, J.; Mi, Y.; Zhao, Y.; Li, L. Near-Infrared Light-Initiated Hybridization Chain Reaction for Spatially and Temporally Resolved Signal Amplification. Angew. Chem. Int. Ed. 2019, 58, 14877–14881. [Google Scholar] [CrossRef]
  177. Ma, F.; Zhang, Q.; Zhang, C. Catalytic Self-Assembly of Quantum-Dot-Based MicroRNA Nanosensor Directed by Toehold-Mediated Strand Displacement Cascade. Nano Lett. 2019, 19, 6370–6376. [Google Scholar] [CrossRef] [PubMed]
  178. He, L.; Lu, D.-Q.; Liang, H.; Xie, S.; Luo, C.; Hu, M.; Xu, L.; Zhang, X.; Tan, W. Fluorescence Resonance Energy Transfer-Based DNA Tetrahedron Nanotweezer for Highly Reliable Detection of Tumor-Related mRNA in Living Cells. ACS Nano 2017, 11, 4060–4066. [Google Scholar] [CrossRef]
  179. Wu, H.; Chen, T.-T.; Wang, X.-N.; Ke, Y.; Jiang, J.-H. RNA imaging in living mice enabled by an in vivo hybridization chain reaction circuit with a tripartite DNA probe. Chem. Sci. 2020, 11, 62–69. [Google Scholar] [CrossRef]
  180. Yang, Y.; Huang, J.; Yang, X.; Quan, K.; Wang, H.; Ying, L.; Xie, N.; Ou, M.; Wang, K. FRET Nanoflares for Intracellular mRNA Detection: Avoiding False Positive Signals and Minimizing Effects of System Fluctuations. J. Am. Chem. Soc. 2015, 137, 8340–8343. [Google Scholar] [CrossRef]
  181. Li, L.; Feng, J.; Liu, H.; Li, Q.; Tong, L.; Tang, B. Two-color imaging of microRNA with enzyme-free signal amplification via hybridization chain reactions in living cells. Chem. Sci. 2016, 7, 1940–1945. [Google Scholar] [CrossRef]
  182. Zhang, K.; Song, S.; Huang, S.; Yang, L.; Min, Q.; Wu, X.; Lu, F.; Zhu, J.-J. Lighting Up MicroRNA in Living Cells by the Disassembly of Lock-Like DNA-Programmed UCNPs-AuNPs through the Target Cycling Amplification Strategy. Small 2018, 14, 1802292. [Google Scholar] [CrossRef]
  183. Wang, B.; You, Z.; Ren, D. Target-assisted FRET signal amplification for ultrasensitive detection of microRNA. Analyst 2019, 144, 2304–2311. [Google Scholar] [CrossRef]
  184. Li, J.; Huang, J.; Yang, X.; Yang, Y.; Quan, K.; Xie, N.; Wu, Y.; Ma, C.; Wang, K. Two-Color-Based Nanoflares for Multiplexed MicroRNAs Imaging in Live Cells. Nanotheranostics 2018, 2, 96–105. [Google Scholar] [CrossRef] [PubMed]
  185. Zhu, C.; Yang, J.; Zheng, J.; Chen, S.; Huang, F.; Yang, R. Triplex-Functionalized DNA Tetrahedral Nanoprobe for Imaging of Intracellular pH and Tumor-Related Messenger RNA. Anal. Chem. 2019, 91, 15599–15607. [Google Scholar] [CrossRef] [PubMed]
  186. Sajan, S.C.; Singh, A.; Sharma, P.K.; Kumar, S. Silicon Photonics Biosensors for Cancer Cells Detection—A Review. IEEE Sens. J. 2023, 23, 3366–3377. [Google Scholar] [CrossRef]
  187. Wang, J.; Dong, J. Optical Waveguides and Integrated Optical Devices for Medical Diagnosis, Health Monitoring and Light Therapies. Sensors 2020, 20, 3981. [Google Scholar] [CrossRef]
  188. Jindal, S.; Sobti, S.; Kumar, M.; Sharma, S.; Pal, M.K. Nanocavity-Coupled Photonic Crystal Waveguide as Highly Sensitive Platform for Cancer Detection. IEEE Sens. J. 2016, 16, 3705–3710. [Google Scholar] [CrossRef]
  189. Sun, D.; Ran, Y.; Wang, G. Label-Free Detection of Cancer Biomarkers Using an In-Line Taper Fiber-Optic Interferometer and a Fiber Bragg Grating. Sensors 2017, 17, 2559. [Google Scholar] [CrossRef]
  190. Maeda, T.; Kanamori, R.; Choi, Y.-J.; Taki, M.; Noda, T.; Sawada, K.; Takahashi, K. Bio-Interface on Freestanding Nanosheet of Microelectromechanical System Optical Interferometric Immunosensor for Label-Free Attomolar Prostate Cancer Marker Detection. Sensors 2022, 22, 1356. [Google Scholar] [CrossRef]
  191. Liang, L.; Jin, L.; Ran, Y.; Sun, L.-P.; Guan, B.-O. Interferometric detection of microRNAs using a capillary optofluidic sensor. Sens. Actuators B Chem. 2017, 242, 999–1006. [Google Scholar] [CrossRef]
  192. Khan, S.; Le Calvé, S.; Newport, D. A review of optical interferometry techniques for VOC detection. Sens. Actuators Phys. 2020, 302, 111782. [Google Scholar] [CrossRef]
  193. Liu, J.; Sun, Y.; Howard, D.J.; Frye-Mason, G.; Thompson, A.K.; Ja, S.; Wang, S.-K.; Bai, M.; Taub, H.; Almasri, M.; et al. Fabry−Pérot Cavity Sensors for Multipoint On-Column Micro Gas Chromatography Detection. Anal. Chem. 2010, 82, 4370–4375. [Google Scholar] [CrossRef] [PubMed]
  194. Ran, Y.; Xu, Z.; Chen, M.; Wang, W.; Wu, Y.; Cai, J.; Long, J.; Chen, Z.-S.; Zhang, D.; Guan, B.-O. Fiber-Optic Theranostics (FOT): Interstitial Fiber-Optic Needles for Cancer Sensing and Therapy. Adv. Sci. 2022, 9, 2200456. [Google Scholar] [CrossRef] [PubMed]
  195. Loyez, M.; Hassan, E.M.; Lobry, M.; Liu, F.; Caucheteur, C.; Wattiez, R.; DeRosa, M.C.; Willmore, W.G.; Albert, J. Rapid Detection of Circulating Breast Cancer Cells Using a Multiresonant Optical Fiber Aptasensor with Plasmonic Amplification. ACS Sens. 2020, 5, 454–463. [Google Scholar] [CrossRef]
  196. Karki, B.; Sarkar, P.; Dhiman, G.; Srivastava, G.; Kumar, M. Platinum Diselenide and Graphene-Based Refractive Index Sensor for Cancer Detection. Plasmonics 2023, 19, 953–962. [Google Scholar] [CrossRef]
  197. Karki, B.; Uniyal, A.; Pal, A.; Srivastava, V. Advances in Surface Plasmon Resonance-Based Biosensor Technologies for Cancer Cell Detection. Int. J. Opt. 2022, 2022, e1476254. [Google Scholar] [CrossRef]
  198. Hma Salah, N.; Pal, A.; Rasul, H.M.; Uniyal, A. Sensitivity enhancement of the surface plasmon resonance sensor based on gallium-doped zinc oxide and silicon for cancer detection: A wavelength interrogation approach. Micro Nanostruct. 2024, 186, 207736. [Google Scholar] [CrossRef]
  199. Aldridge, P.M.; Mukhopadhyay, M.; Ahmed, S.U.; Zhou, W.; Christinck, E.; Makonnen, R.; Sargent, E.H.; Kelley, S.O. Prismatic Deflection of Live Tumor Cells and Cell Clusters. ACS Nano 2018, 12, 12692–12700. [Google Scholar] [CrossRef]
  200. Kaur, B.; Kumar, S.; Kaushik, B.K. 2D Materials-Based Fiber Optic SPR Biosensor for Cancer Detection at 1550 nm. IEEE Sens. J. 2021, 21, 23957–23964. [Google Scholar] [CrossRef]
  201. Ribaut, C.; Loyez, M.; Larrieu, J.-C.; Chevineau, S.; Lambert, P.; Remmelink, M.; Wattiez, R.; Caucheteur, C. Cancer biomarker sensing using packaged plasmonic optical fiber gratings: Towards in vivo diagnosis. Biosens. Bioelectron. 2017, 92, 449–456. [Google Scholar] [CrossRef] [PubMed]
  202. Yan, H.; Zhang, C.; Zhao, X.; Zhen, Z.; Li, Q.; Cao, J. Experimental study of liquid refractive index sensing based on a U-shaped micro-fiber. Optik 2015, 126, 1254–1257. [Google Scholar] [CrossRef]
  203. Zhang, Y.; Lei, M.; Hu, H.; Zhao, Y.; Li, J.; Gao, H. Determination of refractive index by a U-shaped multimode fiber sensor. Instrum. Sci. Technol. 2018, 46, 490–501. [Google Scholar] [CrossRef]
  204. Liu, F.; Zhang, W.; Lang, X.; Liu, X.; Singh, R.; Li, G.; Xie, Y.; Zhang, B.; Kumar, S. Development of Taper-in-Taper-Based Optical Fiber Sensors for Chemical and Biological Sensing. Photonics 2023, 10, 567. [Google Scholar] [CrossRef]
  205. Taha, B.A.; Ali, N.; Sapiee, N.M.; Fadhel, M.M.; Mat Yeh, R.M.; Bachok, N.N.; Al Mashhadany, Y.; Arsad, N. Comprehensive Review Tapered Optical Fiber Configurations for Sensing Application: Trend and Challenges. Biosensors 2021, 11, 253. [Google Scholar] [CrossRef]
  206. Zhalmuratova, D.; La, T.-G.; Yu, K.T.-T.; Szojka, A.R.A.; Andrews, S.H.J.; Adesida, A.B.; Kim, C.; Nobes, D.S.; Freed, D.H.; Chung, H.-J. Mimicking “J-Shaped” and Anisotropic Stress–Strain Behavior of Human and Porcine Aorta by Fabric-Reinforced Elastomer Composites. ACS Appl. Mater. Interfaces 2019, 11, 33323–33335. [Google Scholar] [CrossRef]
  207. Ning, W.; Hu, S.; Zhou, C.; Luo, J.; Li, Y.; Zhang, C.; Luo, Z.; Li, Y. An ultrasensitive J-shaped optical fiber LSPR aptasensor for the detection of Helicobacter pylori. Anal. Chim. Acta 2023, 1278, 341733. [Google Scholar] [CrossRef]
  208. Das, D.; Ainavarapu, S.R.K. Protein engineering using circular permutation—Structure, function, stability, and applications. FEBS J. 2024, 291, 3581–3596. [Google Scholar] [CrossRef]
  209. Paiva-Marques, W.; Reyes Gómez, F.; Oliveira, O.N.; Mejía-Salazar, J.R. Chiral Plasmonics and Their Potential for Point-of-Care Biosensing Applications. Sensors 2020, 20, 944. [Google Scholar] [CrossRef]
  210. Cheng, R.; Li, L.T.; Huang, M.; Zhu, F.; Li, Q.; Liu, H.; Gao, J.; Zhao, X.H.; Luo, F.K.; Wang, J. Highly sensitive plasmonic biosensor for hepatitis B virus DNA based on the surface etching of the active helical gold nanorods. Chem. Eng. J. 2023, 468, 143627. [Google Scholar] [CrossRef]
  211. Haroon, M.; Tahir, M.; Nawaz, H.; Majeed, M.I.; Al-Saadi, A.A. Surface-enhanced Raman scattering (SERS) spectroscopy for prostate cancer diagnosis: A review. Photodiagn. Photodyn. Ther. 2022, 37, 102690. [Google Scholar] [CrossRef] [PubMed]
  212. El-Mashtoly, S.F.; Gerwert, K. Diagnostics and Therapy Assessment Using Label-Free Raman Imaging. Anal. Chem. 2022, 94, 120–142. [Google Scholar] [CrossRef]
  213. Dong, S.; Wang, Y.; Liu, Z.; Zhang, W.; Yi, K.; Zhang, X.; Zhang, X.; Jiang, C.; Yang, S.; Wang, F.; et al. Beehive-Inspired Macroporous SERS Probe for Cancer Detection through Capturing and Analyzing Exosomes in Plasma. ACS Appl. Mater. Interfaces 2020, 12, 5136–5146. [Google Scholar] [CrossRef] [PubMed]
  214. Li, P.; Long, F.; Chen, W.; Chen, J.; Chu, P.K.; Wang, H. Fundamentals and applications of surface-enhanced Raman spectroscopy–based biosensors. Curr. Opin. Biomed. Eng. 2020, 13, 51–59. [Google Scholar] [CrossRef]
  215. Zong, C.; Xu, M.; Xu, L.-J.; Wei, T.; Ma, X.; Zheng, X.-S.; Hu, R.; Ren, B. Surface-Enhanced Raman Spectroscopy for Bioanalysis: Reliability and Challenges. Chem. Rev. 2018, 118, 4946–4980. [Google Scholar] [CrossRef] [PubMed]
  216. Linh, V.T.N.; Lee, M.-Y.; Mun, J.; Kim, Y.; Kim, H.; Han, I.W.; Park, S.-G.; Choi, S.; Kim, D.-H.; Rho, J.; et al. 3D plasmonic coral nanoarchitecture paper for label-free human urine sensing and deep learning-assisted cancer screening. Biosens. Bioelectron. 2023, 224, 115076. [Google Scholar] [CrossRef]
  217. Phyo, J.B.; Woo, A.; Yu, H.J.; Lim, K.; Cho, B.H.; Jung, H.S.; Lee, M.-Y. Label-Free SERS Analysis of Urine Using a 3D-Stacked AgNW-Glass Fiber Filter Sensor for the Diagnosis of Pancreatic Cancer and Prostate Cancer. Anal. Chem. 2021, 93, 3778–3785. [Google Scholar] [CrossRef]
  218. Cao, D.; Lin, H.; Liu, Z.; Gu, Y.; Hua, W.; Cao, X.; Qian, Y.; Xu, H.; Zhu, X. Serum-based surface-enhanced Raman spectroscopy combined with PCA-RCKNCN for rapid and accurate identification of lung cancer. Anal. Chim. Acta 2022, 1236, 340574. [Google Scholar] [CrossRef]
  219. Han, S.; Chen, C.; Chen, C.; Wu, L.; Wu, X.; Lu, C.; Zhang, X.; Chao, P.; Lv, X.; Jia, Z.; et al. Coupling annealed silver nanoparticles with a porous silicon Bragg mirror SERS substrate and machine learning for rapid non-invasive disease diagnosis. Anal. Chim. Acta 2023, 1254, 341116. [Google Scholar] [CrossRef]
  220. Xiong, C.-C.; Zhu, S.-S.; Yan, D.-H.; Yao, Y.-D.; Zhang, Z.; Zhang, G.-J.; Chen, S. Rapid and precise detection of cancers via label-free SERS and deep learning. Anal. Bioanal. Chem. 2023, 415, 3449–3462. [Google Scholar] [CrossRef]
  221. Xie, Y.; Su, X.; Wen, Y.; Zheng, C.; Li, M. Artificial Intelligent Label-Free SERS Profiling of Serum Exosomes for Breast Cancer Diagnosis and Postoperative Assessment. Nano Lett. 2022, 22, 7910–7918. [Google Scholar] [CrossRef]
  222. Plou, J.; Valera, P.S.; García, I.; Vila-Liarte, D.; Renero-Lecuna, C.; Ruiz-Cabello, J.; Carracedo, A.; Liz-Marzán, L.M. Machine Learning-Assisted High-Throughput SERS Classification of Cell Secretomes. Small 2023, 19, 2207658. [Google Scholar] [CrossRef] [PubMed]
  223. Xie, Y.; Wen, Y.; Su, X.; Zheng, C.; Li, M. Label-Free Plasmon-Enhanced Spectroscopic HER2 Detection for Dynamic Therapeutic Surveillance of Breast Cancer. Anal. Chem. 2022, 94, 12762–12771. [Google Scholar] [CrossRef] [PubMed]
  224. Fan, M.; Weng, Y.; Liu, Y.; Lu, Y.; Xu, L.; Ye, J.; Lin, D.; Qiu, S.; Feng, S. Surface-Enhanced Raman Spectroscopy-Based Optical Biosensor for Liquid Biopsy: Toward Precision Medicine. Laser Photonics Rev. 2024, 18, 2301072. [Google Scholar] [CrossRef]
  225. Su, X.; Liu, X.; Xie, Y.; Chen, M.; Zheng, C.; Zhong, H.; Li, M. Integrated SERS-Vertical Flow Biosensor Enabling Multiplexed Quantitative Profiling of Serological Exosomal Proteins in Patients for Accurate Breast Cancer Subtyping. ACS Nano 2023, 17, 4077–4088. [Google Scholar] [CrossRef] [PubMed]
  226. Gui, X.; Xie, J.; Wang, W.; Hou, B.; Min, J.; Zhai, P.; Cai, L.; Tang, J.; Zhu, R.; Wu, X.; et al. Wearable and Flexible Nanoporous Surface-Enhanced Raman Scattering Substrates for Sweat Enrichment and Analysis. ACS Appl. Nano Mater. 2023, 6, 11049–11060. [Google Scholar] [CrossRef]
  227. Shin, H.; Choi, B.H.; Shim, O.; Kim, J.; Park, Y.; Cho, S.K.; Kim, H.K.; Choi, Y. Single test-based diagnosis of multiple cancer types using Exosome-SERS-AI for early stage cancers. Nat. Commun. 2023, 14, 1644. [Google Scholar] [CrossRef]
  228. Su, X.; Xie, Y.; Liu, X.; Chen, M.; Zheng, C.; Zhong, H.; Li, M. Absolute Quantification of Serum Exosomes in Patients with an SERS-Lateral Flow Strip Biosensor for Noninvasive Clinical Cancer Diagnosis. ACS Appl. Mater. Interfaces 2023, 15, 37130–37142. [Google Scholar] [CrossRef]
  229. Su, X.; Liu, X.; Ouyang, Y.; Xie, Y.; Chen, M.; Chen, P.; Liu, J.; Wu, M.; Lin, C.; Zhong, H.; et al. SERS lateral flow strip detection of serum biomarkers for noninvasive assessment of operative microwave ablation outcomes of unresectable hepatocellular carcinoma. Chem. Eng. J. 2024, 485, 149833. [Google Scholar] [CrossRef]
  230. Dhanabalan, S.S.; Sriram, S.; Walia, S.; Avaninathan, S.R.; Carrasco, M.F.; Bhaskaran, M. Wearable Label-Free Optical Biodetectors: Progress and Perspectives. Adv. Photonics Res. 2021, 2, 2000076. [Google Scholar] [CrossRef]
  231. Zheng, J.; Zhang, W.; Li, L.; He, Y.; Wei, Y.; Dang, Y.; Nie, S.; Guo, Z. Signaling Pathway and Small-Molecule Drug Discovery of FGFR: A Comprehensive Review. Front. Chem. 2022, 10, 860985. [Google Scholar] [CrossRef] [PubMed]
  232. Han, Y.; Fang, X.; Li, H.; Zha, L.; Guo, J.; Zhang, X. Sweat Sensor Based on Wearable Janus Textiles for Sweat Collection and Microstructured Optical Fiber for Surface-Enhanced Raman Scattering Analysis. ACS Sens. 2023, 8, 4774–4781. [Google Scholar] [CrossRef]
  233. Wang, W.; Chen, Y.; Xiao, C.; Xiao, S.; Wang, C.; Nie, Q.; Xu, P.; Chen, J.; You, R.; Zhang, G.; et al. Flexible SERS wearable sensor based on nanocomposite hydrogel for detection of metabolites and pH in sweat. Chem. Eng. J. 2023, 474, 145953. [Google Scholar] [CrossRef]
  234. Taitt, C.R.; Anderson, G.P.; Ligler, F.S. Evanescent wave fluorescence biosensors: Advances of the last decade. Biosens. Bioelectron. 2016, 76, 103–112. [Google Scholar] [CrossRef]
  235. Li, C.; Yang, J.; Xu, R.; Wang, H.; Zhang, Y.; Wei, Q. Progress and Prospects of Electrochemiluminescence Biosensors Based on Porous Nanomaterials. Biosensors 2022, 12, 508. [Google Scholar] [CrossRef]
  236. Leuermann, J.; Fernández-Gavela, A.; Torres-Cubillo, A.; Postigo, S.; Sánchez-Postigo, A.; Lechuga, L.M.; Halir, R.; Molina-Fernández, Í. Optimizing the Limit of Detection of Waveguide-Based Interferometric Biosensor Devices. Sensors 2019, 19, 3671. [Google Scholar] [CrossRef]
  237. Muhammad, M.; Huang, Q. A review of aptamer-based SERS biosensors: Design strategies and applications. Talanta 2021, 227, 122188. [Google Scholar] [CrossRef] [PubMed]
  238. Ong, J.J.; Pollard, T.D.; Goyanes, A.; Gaisford, S.; Elbadawi, M.; Basit, A.W. Optical biosensors—Illuminating the path to personalized drug dosing. Biosens. Bioelectron. 2021, 188, 113331. [Google Scholar] [CrossRef]
  239. Garzón, V.; Pinacho, D.G.; Bustos, R.-H.; Garzón, G.; Bustamante, S. Optical Biosensors for Therapeutic Drug Monitoring. Biosensors 2019, 9, 132. [Google Scholar] [CrossRef]
  240. Neethirajan, S.; Ragavan, V.; Weng, X.; Chand, R. Biosensors for Sustainable Food Engineering: Challenges and Perspectives. Biosensors 2018, 8, 23. [Google Scholar] [CrossRef]
  241. Habimana, J.d.D.; Ji, J.; Sun, X. Minireview: Trends in Optical-Based Biosensors for Point-Of-Care Bacterial Pathogen Detection for Food Safety and Clinical Diagnostics. Anal. Lett. 2018, 51, 2933–2966. [Google Scholar] [CrossRef]
  242. Dey, S.; Dolci, M.; Zijlstra, P. Single-Molecule Optical Biosensing: Recent Advances and Future Challenges. ACS Phys. Chem. Au 2023, 3, 143–156. [Google Scholar] [CrossRef]
  243. Chen, C.; Wang, J. Optical biosensors: An exhaustive and comprehensive review. Analyst 2020, 145, 1605–1628. [Google Scholar] [CrossRef] [PubMed]
  244. Kundu, M.; Krishnan, P.; Kotnala, R.K.; Sumana, G. Recent developments in biosensors to combat agricultural challenges and their future prospects. Trends Food Sci. Technol. 2019, 88, 157–178. [Google Scholar] [CrossRef]
  245. Tothill, I.E. Biosensors developments and potential applications in the agricultural diagnosis sector. Comput. Electron. Agric. 2001, 30, 205–218. [Google Scholar] [CrossRef]
  246. Sharma, A.; Mishra, R.K.; Goud, K.Y.; Mohamed, M.A.; Kummari, S.; Tiwari, S.; Li, Z.; Narayan, R.; Stanciu, L.A.; Marty, J.L. Optical Biosensors for Diagnostics of Infectious Viral Disease: A Recent Update. Diagnostics 2021, 11, 2083. [Google Scholar] [CrossRef]
  247. Pham, A.T.T.; Wallace, A.; Zhang, X.; Tohl, D.; Fu, H.; Chuah, C.; Reynolds, K.J.; Ramsey, C.; Tang, Y. Optical-Based Biosensors and Their Portable Healthcare Devices for Detecting and Monitoring Biomarkers in Body Fluids. Diagnostics 2021, 11, 1285. [Google Scholar] [CrossRef]
  248. Jain, A.; Homayoun, A.; Bannister, C.W.; Yum, K. Single-walled carbon nanotubes as near-infrared optical biosensors for life sciences and biomedicine. Biotechnol. J. 2015, 10, 447–459. [Google Scholar] [CrossRef]
  249. Bird, D.T.; Ravindra, N.M. Additive Manufacturing of Sensors for Military Monitoring Applications. Polymers 2021, 13, 1455. [Google Scholar] [CrossRef]
  250. Bilal, M.; Iqbal, H.M.N. Microbial-derived biosensors for monitoring environmental contaminants: Recent advances and future outlook. Process Saf. Environ. Prot. 2019, 124, 8–17. [Google Scholar] [CrossRef]
  251. Rodriguez-Mozaz, S.; de Alda, M.J.L.; Marco, M.-P.; Barceló, D. Biosensors for environmental monitoring: A global perspective. Talanta 2005, 65, 291–297. [Google Scholar] [CrossRef] [PubMed]
  252. Abid, S.A.; Ahmed Muneer, A.; Al-Kadmy, I.M.S.; Sattar, A.A.; Beshbishy, A.M.; Batiha, G.E.-S.; Hetta, H.F. Biosensors as a future diagnostic approach for COVID-19. Life Sci. 2021, 273, 119117. [Google Scholar] [CrossRef]
  253. Maddali, H.; Miles, C.E.; Kohn, J.; O’Carroll, D.M. Optical Biosensors for Virus Detection: Prospects for SARS-CoV-2/COVID-19. ChemBioChem 2021, 22, 1176–1189. [Google Scholar] [CrossRef]
  254. de Araujo, W.R.; Lukas, H.; Torres, M.D.T.; Gao, W.; de la Fuente-Nunez, C. Low-Cost Biosensor Technologies for Rapid Detection of COVID-19 and Future Pandemics. ACS Nano 2024, 18, 1757–1777. [Google Scholar] [CrossRef]
  255. Yang, Y.; Li, J.; Sun, H.; Xi, J.; Deng, L.; Liu, X.; Li, X. A PCF Sensor Design Using Biocompatible PDMS for Biosensing. Polymers 2024, 16, 1042. [Google Scholar] [CrossRef] [PubMed]
  256. Ashrafian, M.; Olyaee, S.; Seifouri, M. Highly sensitive cancer detection using an open D-channel PCF-based SPR biosensor. Sci. Rep. 2025, 15, 10168. [Google Scholar] [CrossRef]
  257. Singh, S.; Kumar, R.; Chaudhary, B.; Bhardwaj, P.; Upaddhyay, V.K.; Upadhyay, A.; Daher, M.G. Gold Immobilized SPR-Enhanced PCF Biosensor for Detection of Cancer Cells: A Numerical Simulation. Plasmonics 2024. [Google Scholar] [CrossRef]
  258. Mao, Y.; Ren, F.; Zhou, D.; Li, Y. Highly Sensitive PCF-SPR RI Sensor for Cancer Detection Using Gold/Graphene/Ti3C2Tx-MXene Hybrid Layer. Plasmonics 2025, 20, 2279–2290. [Google Scholar] [CrossRef]
  259. Kaziz, S.; Echouchene, F.; Gazzah, M.H. Optimizing PCF-SPR sensor design through Taguchi approach, machine learning, and genetic algorithms. Sci. Rep. 2024, 14, 7837. [Google Scholar] [CrossRef]
  260. Wang, W.; Xia, L.; Xiao, X.; Li, G. Recent Progress on Microfluidics Integrated with Fiber-Optic Sensors for On-Site Detection. Sensors 2024, 24, 2067. [Google Scholar] [CrossRef]
  261. Homola, J. Surface Plasmon Resonance Sensors for Detection of Chemical and Biological Species. Chem. Rev. 2008, 108, 462–493. [Google Scholar] [CrossRef] [PubMed]
  262. Mayer, K.M.; Hafner, J.H. Localized Surface Plasmon Resonance Sensors. Chem. Rev. 2011, 111, 3828–3857. [Google Scholar] [CrossRef]
  263. Kemal Yetisen, A.; Safwan Akram, M.; Lowe, C.R. Paper-based microfluidic point-of-care diagnostic devices. Lab Chip 2013, 13, 2210–2251. [Google Scholar] [CrossRef]
  264. Medintz, I.L.; Uyeda, H.T.; Goldman, E.R.; Mattoussi, H. Quantum dot bioconjugates for imaging, labelling and sensing. Nat. Mater. 2005, 4, 435–446. [Google Scholar] [CrossRef] [PubMed]
  265. Psaltis, D.; Quake, S.R.; Yang, C. Developing optofluidic technology through the fusion of microfluidics and optics. Nature 2006, 442, 381–386. [Google Scholar] [CrossRef] [PubMed]
  266. Zavaleta, C.L.; Smith, B.R.; Walton, I.; Doering, W.; Davis, G.; Shojaei, B.; Natan, M.J.; Gambhir, S.S. Multiplexed imaging of surface enhanced Raman scattering nanotags in living mice using noninvasive Raman spectroscopy. Proc. Natl. Acad. Sci. USA 2009, 106, 13511–13516. [Google Scholar] [CrossRef]
  267. Lee, B.H.; Kim, Y.H.; Park, K.S.; Eom, J.B.; Kim, M.J.; Rho, B.S.; Choi, H.Y. Interferometric Fiber Optic Sensors. Sensors 2012, 12, 2467–2486. [Google Scholar] [CrossRef]
Figure 1. Classification of various types of cancers infecting human beings.
Biosensors 15 00292 g001
Figure 2. Medical applications of optical biosensors.
Biosensors 15 00292 g002
Figure 3. Illustration of (a) Kretschmann configuration [78], (b) Otto configuration [78].
Biosensors 15 00292 g003
Figure 4. Types of PCF SPR sensor models. (a) IMD-shaped PCF [87]. (b) EMD-shaped PCF [88]. (c) D-shaped PCF [89]. (d) Merger of IMD and EMD PCF [86]. (e) Fusion of quasi-D-shaped and EMD PCF [59].
Biosensors 15 00292 g004
Figure 5. SEM images of the fabricated PCF (a) hexagonal lattice of air holes [101], (b) lattice with six air holes [104], (c) hexagonal lattice of air holes [105], (d) hexagonal lattice of parallelogram-shaped air holes [103], (e) SEM image-slotted PCF [106], (f) hexagonal lattice of air holes with dual-core configuration [102], (g) SEM image of ultrathin PCF [106], and (h) air holes in hexagonal honeycomb PCF [107].
Biosensors 15 00292 g005
Figure 6. PCF SPR sensor models dedicated to cancer detection. (a) EMD-shaped PCF [6]. (b) Dual-core EMD-shaped PCF [108]. (c) Slotted IMD-shaped PCF [109]. (d) H-shaped PCF [110]. (e) Quad-core configuration with hexagonal-lattice PCF [111].
Biosensors 15 00292 g006
Figure 7. (a) Illustration of the enhanced signal LSPR miRNA detection system using a scalable, flexible, and transparent 3D plasmonic nanoarchitecture. The formation of a SAM incorporating a hairpin LNA probe, hybridization with miRNAs at an increased temperature, followed by the application of a biotin-tagged signaling probe, and finally interaction with HRP-conjugated streptavidin leading to an enzymatic conversion of a soluble substrate into an insoluble deposit; detecting HBsAg using a one-step LSPR sensor chip configuration, along with an improved LSPR chip design for a heterogeneous AuNP sandwich immunoassay, which uses immunocolloidal AuNPs [135]. (b) Changes in the spectral peak across different HBsAg concentrations (ranging from 1 pg/mL to 1 μg/mL HBsAg) following interaction with the chip. The inset image displays the immunological interaction occurring at the LSPR sensor chip’s active site, utilizing 15, 30, and 50 nm immunocolloidal AuNPs to amplify the signal. HBsAg levels ranging from 1 ng/mL to 100 fg/mL were evaluated using the LSPR chip. Each test was conducted six times, presenting the outcomes as an average ± standard deviation. The coefficient of variation (% CV) was maintained below 10% [138]. (c) LSPR sensor (ciciv) featuring interconnected nano-rings and a fully etched liquid area for cancerous fluid detection [132].
Biosensors 15 00292 g007
Figure 8. (a) (ai) Diagrammatic illustration of the flow and control layers that make up the microfluidic chip and the construction of the assembled chip [139]. (aii) The inset shows a conventional SEM image of the plasmonic Au sensor [139]. (aiii) Developed optical setup [139]. (b) (bi) Ultrasensitive immunoassay utilizing GNRs as amplification labels [140]. (bii) TEM image of a GNR displaying the LSPR peak at 645 nm [140]. (c) (ci) The setup involving a dark-field microscope combined with a Rayleigh light-scattering spectroscope [141]. (cii) Interactions between nucleic acids and proteins inside the sensor [141].
Biosensors 15 00292 g008
Figure 9. (a) Classification of various elements used in colorimetric sensors, such as samples, biomarkers, papers, recognition elements, and signal-readout devices [150]. (b) Categorization of PADS testing kits for analyzing urine samples and a microfluidic detection system that can identify microRNA-21 concentrations as low as 1000 pM, employing the peroxidase-mimicking activity of DNA-templated Ag/Pt nanoclusters [151] (c) LFA setup for microRNA-215 detection, along with optical measurements [152]. (d) Methodology for the preparation of AuNps for cancer cell identification [153].
Biosensors 15 00292 g009
Figure 10. (a) Cancer cell identification using MnFe2O4 [154]. (b) Cancerous biomarker identification process by analyzing UV-VIS spectrum. (bA) Separation of a target analyte using magnetic beads coated with antibodies (bB) Boosting of signal using multi-branched rolling circle amplification (mb-RCA), to increases the amount of glucose oxidase. (bC) Illustration showing the reaction caused by glucose oxidase leading to a color change, causing due to pH changes and is detected through color indicator bromocresol purple. (bD) UV–visible light absorption results measured both with and without the target protein [155].
Biosensors 15 00292 g010
Figure 12. (a) Three-dimensional (3D) visualization depicting the dielectric profile of a linear air waveguide formed via the removal of a row of dielectric holes. Parameters include a lattice constant of a = 0.8 μm, air-hole radius of r = 0.3a, Si rod length of 1.5 μm, and SiO2 layer thickness of 3 μm and the depiction illustrating the dielectric profile of a nanocavity-coupled waveguide structure [188]. (b) Illustrates the conjugation and the morphology process of the fiber surface using AFM. Ultimately, following the detection of the HER2 biomarker, the fiber surface showed the highest level of roughness, marked by the agglomeration of bio-particles [189].
Biosensors 15 00292 g012
Figure 13. (a) Illustration depicting a MEMS optical interferometric surface-stress immunosensor in cross-section [190]. (b,c) Configuration of optofluidic biosensor for biomolecular detection [191]. (d) FP sensor model combined with a GC column, light source, and detector [192,193]. (e) Showcasing the FP sensor created through the sequential application of Ag and polymer coatings to the fiber end [192,193].
Biosensors 15 00292 g013
Figure 14. (a) The device is a minimally invasive tumor theragnostic needle featuring functional optical fibers designed for tumor navigation. The system integrates an in-situ fiber tumor detector that emits an excitation laser, detects tumor-specific markers, and captures fluorescence signals. Cancer marker-sensitive fluorescent probes situated on the fiber surface interact with hypoxia markers, enabling the fiber to locate tumors for precise identification. This fiber also carries the excitation laser and collects tumor-related fluorescence, enabling precise detection and localization of tumors. Additionally, it contains a photothermal therapeutic fiber with a core-sealed rare-earth-based photosensitizer. The rare-earth elements convert laser energy to heat for targeted, efficient, and safe hyperthermia treatment. A Bragg grating monitors local temperature during therapy, ensuring controlled and accurate photothermal treatment [195]. (b) PRISM-based SPR sensor for cancer cell identification [199]. (c) Prism chip design. (ci) Prismatic deflection segregates a continuous sample flow into distinct subgroups according to the expression of surface markers. (cii) Magnetic nanoparticles (NPs) provide a more precise reflection of cell surface protein expression compared to larger magnetic microparticles. (ciii) The diagram illustrates the cobalt-based ribbon-prismatic deflection chip, comprising deflection guides composed of individual segments with angles ranging from 2 to 30 degrees. (civ) During the analysis of forces acting on a cell in the horizontal plane (excluding friction), magnetically labeled cells follow the deflection guides until the magnetic attraction towards the guide is counterbalanced with the perpendicular component of the drag force against the guide. (cv) The assessment underscores the enhancement of magnetic field strength via nickel and cobalt-based deflection guides. (cvi) When comparing factors influencing cell deflection, cobalt-based deflection demonstrates a requirement for lower particle concentration to achieve effective deflection compared to similar nickel-based guides [198].
Biosensors 15 00292 g014
Figure 16. (a) A 3D MIO structure, consisting of Au−coated TiO2, is developed to enable substantial interaction between the laser and the sample in SERS [211,213]. (b) illustrates the design and construction of SERS-based biosensors for both direct and indirect detection approaches. (bi) Direct SERS detection entails capturing intrinsic SERS signals of biomolecules from the substrate without requiring labeling molecules [214,215]. (bii) Indirect SERS detection utilizes SERS signals from Raman reporters to indirectly indicate the presence of bound targets or changes in environmental properties [214,215]. (PNPs refer to plasmonic nanoparticles.)
Biosensors 15 00292 g016
Figure 17. SERS-labeled POCT system designed for identifying EXOs, circulating tumor DNA (ctDNA) and microRNA within body fluids. (a) Multiplexed quantitative examination of serological exosome proteins using a combined SERS-VLA biosensor [225]. (b) Improved medical health monitoring through a wearable nanoporous SERS substrate that captures and analyzes sweat; this includes the highly sensitive detection and quantification of biomarkers in tears using an onsite, label-free SERS platform for diagnosing breast cancer [226]. (c) Simultaneous detection of six early-stage cancer types using machine learning-enhanced SERS analysis [227].
Biosensors 15 00292 g017
Table 1. Methodologies for cancer detection.
MethodologiesForms of
Cancers
AdvantagesLimitationsRef
BiopsyBreast,
prostate
cancer
High accuracy, provides definitive diagnosisInvasive, painful, time-consuming, risk of infection, not suitable for early detection without
visible lesions
[25,26]
Magnetic resonance imaging (MRI)Gastro intestine,
brain, prostate cancer
Non-invasive, provides high-resolution images, effective for soft tissue
examination
Expensive, time-intensive, limited availability, may require contrast agents, not always specific to cancer[27,28]
Ultrasound
Imaging
Breast, and prostate cancerNon-invasive, real-time imaging, widely available, relatively low costLimited resolution, operator-dependent, less effective for detecting small or deep tumors[29,30]
X-rayLung, colorectal
cancer
Quick, non-invasive, cost-effective, widely availableExposure to ionizing radiation, limited sensitivity for small or early-stage cancers[31,32]
Computed
tomography
(CT) scans
Breast, lung, and prostate cancerHigh-resolution, provides 3D imaging, effective for staging and monitoring tumorsHigh radiation dose, expensive, limited effectiveness in detecting small or early-stage cancers[33,34]
EndoscopyOral, gastric, and colon
cancer
Allows direct visualization of tissues, can collect biopsy samples during the procedureInvasive, uncomfortable for patients, requires sedation, limited to accessible regions[35,36]
Occult blood
detection
Colon
cancer
Non-invasive, cost-effective, simple screening toolLow specificity, prone to false positives and false negatives, requires follow-up tests for confirmation[37,38]
Prostate-specific
antigen level
detection
Prostate
cancer
Non-invasive, widely used screening tool, helpful for monitoring
progression
Low specificity, risk of overdiagnosis, elevated levels may result from non-cancerous conditions[39,40]
MammographyBreast
cancer
Non-invasive, effective for early detection, widely usedRisk of false positives and false negatives, involves exposure to low-dose radiation, less effective for dense breast tissue[41,42]
Papanicolaou testCervical
cancer
Non-invasive, cost-effective, widely used for early detectionRequires regular follow-up, subjective interpretation, less effective for adenocarcinomas[43,44]
Table 2. Cancer biomarkers reported via various calorimetric paper-based sensors.
TargetPADElementDetection SystemRangeLODRef
  Protein     C A 125   S P O T   t e s t   A b A u N P s + A g  enhancements   30   to   00   U / m L   30   U / m L [154]
  S P O T   t e s t   A b   C y s A u N P s   0.1   to   100   U / m L   0.413   U / m L [155]
  S P O T   t e s t   A b   C y s A u N P s   0.1   to   100   n g / m L   1.054   n g / m L [155]
Protein
CEA
  µ P A D   A b   H R P + T M B   0.5   to   70   ng / m L   0.015   n g / m L [156]
  µ P A D   A b   H R P + T M B   0   to   40   n g / m L   2   n g / m L [157]
  S P O T   t e s t   A b   n a n o c o m p o s i t e p e r o x i d a s e l i k e   a c t i v i t y + T M B   0.002   to   75   n g / m L   0.51   p g / m L [158]
  Protein     P S A   µ P A D   A b   A u N P s   0.5   to   50   µ g / L   360.2   n g / L [159]
  µ P A D   A b   F e 3 O 4   to   P B   3   to   80   n g / m L   2.7   n g / m L [160]
  Enzymes     A L P P E A K 1   µ P A D   A b   P N P P   30     to   500   U / m L   [161]
  S P O T t e s t   A b   A u N P s + H N B   1 × 10 9   g / m L 1 × 10 5   g / m L   1.0   n g / m L [162]
  Growth     Factor     H E R 2   L F A   a p t a m e r   A u N P s + b i o t i n + s t r e p t a v i d i n   0   to   50   n M   20   n M [163]
  Nucleic   acid     µ R N A 155   L F A   s s D N A   A u N P s + b i o t i n + s t r e p t a v i d i n   0.01   to   5   n M   0.061   n M [164]
  Nucleic   acid     µ R N A 210   L F A   s s D N A   A u N P s + b i o t i n + s t r e p t a v i d i n   0.05   to   10   n M   0.085   n M [156]
  Nucleic   acid     µ R N A 215   L F A   s s D N A   A u N P s + b i o t i n   0.075   to   0   n M   60   p M [165]
Table 3. Nanoparticles exhibiting colorimetric behavior through LSPR.
NanoparticlesDescriptionRef
  T i O 2 / S n O x A u Immunoassay sensor used for tumor marker[157]
  N i O Breast cancer detection[158]
  A u Spermidine and spermine detection[159]
  C u DNA detection at femtomolar level[160]
  P t Hg ions in water[161]
  A u C u 9 S 5 Photothermal therapy in the second
NIR window
[162]
  A u / A g Glucose sensing[163]
  B i 2 S e 3 A u Cancer biomarker detection[164]
Table 4. Biomarker detection in cancerous cells using FRET technology.
TypesBiomarkerC*D*A*DLRef
  A H   C M Y C Breast   C y 3   C y 5   0.6   p M [176]
  A H   µ R N A s Lung   Q D   C y 5   0.54   f M [177]
T*   T K 1   m R N A Liver   C y 3   C y 5   0.33   n M [178]
  A H   µ R N A s Cervical   B H Q 2   B H Q 2   0.8   p M [179]
  M B   T K 1   m R N A Liver   T A M R A   T A M R A   2.0   n M [180]
MB   µ R N A s Breast   R O X   R O X   0.18   p M [181]
AH   µ R N A s Breast   B H Q 2   B H Q 2   0.74   f M [182]
MB   µ R N A Cervical   C y 5   A u N P s   0.9   n M [183]
AH   µ R N A s Cervical   C y 5   C y 5   2.14   p M [184]
T*   S u r v i v i n   M r n a Breast   C y 5   C y 5   1.5   n M [185]
T* = Tetrahedral, C* = cancer, D* = Donar, A* = acceptor, DL = detection limit.
Table 5. Cancer analysis using body fluids adopted for SERS.
Body FluidCancerSERS PlatformMethodsRef
Urine 1Prostate/pancreatic   3 D P C N   R N N ,   C N N [216]
Urine 2Prostate/pancreatic   3 D   stack   A g   N W s G F F   S E R S   P C A ,   O P L S D A [217]
Serum 1Lung   A u   N S s   P C A   R C K N C N [218]
Serum 2Sjogren syndrome
diabetic nephropathy
  A g 2 O A g P S B   S V M [219]
Serum 3Bladder/adrenal   A g N P s   1 D C N N G R A D C A M [220]
Serum
Exosomes
Breast cancer   A u   S t s   M C R A L S ,   P C A L D A [221]
SecretomesCervical   Drop   casting   A g N P s   P C A ,   S V M [222]
H E R 2  cellsBreast cancer   A u   S t s   A N N [223]
Table 6. Comparison of the cost-effectiveness of various sensor types.
Type of SensorProduction CostRemark on Cost-EffectivenessRef
SPR sensorsModerate
to high
High fabrication cost due use of noble material coatings like Au, Ag, Pt, and require complex optical alignment[261]
LSPR sensorsLow to
moderate
Lower cost than SPR because of simpler setups and nanostructure-based signal enhancement[262]
Colorimetric sensorsLowSimple fabrication process using paper-based substrates, and no external instrumentation needed[263]
Fluorescence-based sensorsModerateRequires labeling and excitation sources sometimes can be often limited by photobleaching[264]
Photonics and
waveguide sensors
HighDue to the need to fabricate photonic chips and requirement of cleanroom facilities[265]
Raman spectroscopy sensorsHighDue to the need for high-power lasers, spectrometers, and filters[266]
Fiber-optic sensorsModerateMostly depends on fiber type, coatings, and interrogation systems[267]
Disclaimer/Publisher’s Note: The statements, opinions and data contained in all publications are solely those of the individual author(s) and contributor(s) and not of MDPI and/or the editor(s). MDPI and/or the editor(s) disclaim responsibility for any injury to people or property resulting from any ideas, methods, instructions or products referred to in the content.

