Article

Development of a Rapid-Response Fluorescent Probe for H2S: Mechanism Elucidation and Biological Applications

1
Department of Chemistry, University of Nebraska at Kearney, 2504 9th Ave, Kearney, NE 68849, USA
2
Department of Biology, University of Nebraska at Kearney, 2504 9th Ave, Kearney, NE 68849, USA
3
Facultad de Medicina Región Veracruz, Universidad Veracruzana, C. Agustín de Iturbide S/N, Zona Centro, Veracruz 91700, Mexico
*
Author to whom correspondence should be addressed.
Biosensors 2025, 15(3), 174; https://doi.org/10.3390/bios15030174
Submission received: 2 February 2025 / Revised: 20 February 2025 / Accepted: 26 February 2025 / Published: 7 March 2025

Abstract

:
Hydrogen sulfide (H2S) is an important signaling molecule involved in various physiological and pathological processes, making its accurate detection in biological systems highly desirable. In this study, two fluorescent probes (M1 and M2) based on 1,8-naphthalimide were developed for H2S detection via a nucleophilic aromatic substitution. M1 demonstrated high sensitivity and selectivity for H2S in aqueous media, with a detection limit of 0.64 µM and a strong linear fluorescence response in the range of 0–22 µM of NaHS. The reaction kinetics revealed a rapid response, with a reaction rate constant of 7.56 × 10² M−1 s−1, and M1 was most effective in the pH range of 6–10. Mechanism studies using 1H NMR titration confirmed the formation of 4-hydroxyphenyl-1,8-naphthalimide as the product of H2S-triggered nucleophilic substitution. M1 was applied in MDA-MB-231 cells for cell imaging, in which M1 provided significant fluorescence enhancement upon NaHS treatment, confirming its applicability for detecting H2S in biological environments. In comparison, M2, designed with extended conjugation for red-shifted emission, exhibited weaker sensitivity due to the reduced stability of its naphtholate product and lower solubility. These results demonstrate that M1 is a highly effective and selective fluorescent probe for detecting H2S, providing a valuable resource for investigating the biological roles of H2S in health and disease.

Graphical Abstract

1. Introduction

In biological systems, hydrogen sulfide (H2S) is an endogenous gas widely existing in various organs and tissues, including the cardiovascular system, gastrointestinal tract, immune cells, liver, and kidneys [1,2,3,4,5]. Endogenous H2S is produced via enzymatic pathways, in which cystathionine-β-synthase (CBS, EC 4.2.1.22), cystathionine-γ-lyase (CSE, EC 4.4.1.1), and 3-mecaptopyruvate sulfurtransferase (MST, EC 2.8.1.2) are the major contributors that produce endogenous H2S [6]. The concentration of H2S in human plasma is 10–300 μM, but it will vary in different locations [7]. As a signaling molecule, H2S is illustrated as a gasotransmitter and has gained significant attention alongside nitric oxide (NO) and carbon monoxide (CO) [8]. H2S exerts numerous physiological functions for immune response, signal transduction, and energy production [9,10,11]. However, paradoxical findings suggest that H2S exhibits both protective effects on cells and contributes to cell dysfunction and apoptosis [12,13,14]. To explain these contradictory facts, the cellular level of H2S is the most critical factor, which will determine the biofunctions of H2S, whether beneficial or deleterious [15]. Moreover, recent research indicated that the level of H2S is associated with major human diseases, such as Alzheimer’s disease, diabetes, and cancer [16,17,18]. Therefore, accurately measuring the level of H2S in living cells is the key factor in illustrating the pathophysiologic roles of H2S [19].
In the past decade, fluorescent probes have been intensively investigated as efficient approaches to detect H2S due to their high sensitivity, real-time response, low cost, and user-friendly operation [20,21,22]. Since H2S can dissociate into hydrosulfide (HS) in aqueous media with a high dissociation rate (pKa1 = 7.0), many fluorescent probes have been developed based on the reaction with HS, which shows a high nucleophilic character and reducing ability [23]. The most common strategies to design fluorescent probes for H2S detection include H2S-mediated azide and nitro group reduction, metal displacement, and nucleophilic aromatic substitution reactions [24,25,26,27]. Among these, the H2S-mediated azide reduction usually exhibited a relatively low rate because two equivalence HS are required to reduce the azide, forming a polysulfide intermediate [28]. Copper (Cu2+) is the most commonly used ion in the design of H2S probes based on metal displacement. Upon coordination with a metal chelator, Cu2+ induces fluorescence quenching. Adding HS⁻ displaces Cu2+ from the chelator, leading to precipitate formation and restoring the chelator’s fluorescence [29]. The sulfonyl esters and ethers based on 2,4-dinitrophenyl (DNP) and nitrobenzofurzan (NBD) platforms can efficiently react with HS via nucleophilic aromatic substitution reactions, which provides an effective mechanism to recognize H2S in different media [30,31]. After reacting with H2S, these reaction-based fluorescent probes generate a “Turn-On” or “Turn-Off” fluorescence response used for quantitative measurements of H2S [32,33].
Despite significant efforts to develop fluorescent probes for hydrogen sulfide (H2S) detection, numerous challenges remain. One major issue is the interference caused by reactive sulfur species (RSS), such as cysteine, glutathione, and polysulfides, during detection in biological environments [34]. Although RSS generally exhibit weaker nucleophilic properties and thus lower reactivity with reaction-based sensors, their high physiological concentrations (3–10 mM) can compensate for this limitation, leading to considerable interference [35]. Additionally, the inherent background fluorescence from biomolecules in biological samples further complicates detection [36]. A prolonged response time for reaction-based probes also limits their practical applicability [37].
To address these challenges, we report the development of novel fluorescent probes based on 1,8-naphthalimide (1,8-NI) for detecting H2S via nucleophilic aromatic substitution. These probes demonstrate high selectivity for H2S in aqueous media, even in the presence of biologically relevant species. Furthermore, cellular imaging studies confirm the excellent biocompatibility of these probes, enabling the effective measurement of cellular H2S in living organisms.

2. Experimental

2.1. General

All reagents used for synthesis and measurements were purchased in analytical grade from Sigma-Aldrich (St. Louis, MO, USA), Fisher Scientific (Pittsburgh, PA, USA), TCI (Portland, OR, USA), Alfa Aesar (Tewksbury, MA, USA), and Acros Organics (Waltham, MA, USA), and all were used as received unless otherwise specified. Absorption spectra were collected using a Cary Series UV–Vis Spectrophotometer (Agilent Technologies, Santa Clara, CA, USA). Fluorescence measurements were performed with a FluoroMax-4 Spectrofluorometer (Horiba Jobin Yvon, Irvine, CA, USA) using a 1 cm quartz cuvette. The excitation and emission slits were set between 1 and 5 nm. 1H and 13C NMR spectra were recorded on a Bruker 400 Ascend spectrometer at room temperature. All intermediates and final products were purified using a CombiFlash NextGen 300+ system (Teledyne ISCO, Lincoln, NE, USA). High-resolution mass spectrometry (HRMS) data were acquired at the Nebraska Center for Mass Spectrometry, University of Nebraska-Lincoln, using a GCT Mass Spectrometer (Waters, Milford, MA, USA). NaHS was used as the H2S source for solution-based measurements in this project. MDA-MB-231 epithelial cells (catalog #HTB-26) were obtained from ATCC (Manassas, VA, USA) for cell imaging experiments.

2.2. Synthetic Route and Characterization

Compound M1 and M2 were synthesized via multiple-step reactions as shown in Scheme 1. 1H NMR and 13C NMR spectroscopy were used for characterization.
2-benzyl-6-bromo-1H-benzo[de]isoquinoline-1,3(2H)-dione (1): 4-Bromo-1,8-naphthalimide (138.0 mg, 0.5 mmol) was combined with phenylmethanamine (72.0 mg, 0.67 mmol) in ethanol (4.0 mL) and refluxed for 3 h. After completion of the reaction, the solvent was removed using a rotary evaporator. The resulting solid was purified by column chromatography using a mixture of dichloromethane and hexane (3:1). A white solid product (176 mg) was obtained as the product (96%). 1H NMR (400 MHz, DMSO-d6) δ: 5.25 (s, 2H), 7.21–7.41 (m, 5H), 8.01 (t, J = 8.0 Hz, 1H), 8.24 (d, J = 7.8 Hz, 1H), 8.37 (d, J = 8.0 Hz, 1H), 8.54–8.64 (m, 2H). 13C NMR (100 MHz, DMSO-d6) δ: 43.6, 122.4, 123.2, 127.6, 128.1, 128.9, 129.4, 129.9, 130.4, 131.8, 131.9, 132.4, 133.4, 137.6, 163.4, 163.5.
2-benzyl-6-(4-hydroxyphenyl)-1H-benzo[de]isoquinoline-1,3(2H)-dione (2): Compound 1 (183 mg, 0.5 mmol) was mixed with 4-hydroxyphenylboronic acid (89.7 mg, 0.65 mmol), triphenylphosphine (28.9 mg, 0.11 mmol), and t-BuOK (61.5 mg, 0.55 mmol) in isopropanol (5 mL). The mixture was heated at 80 °C for 2 h. Upon completion of the reaction, the mixture was poured into 12% HCl (50 mL) and extracted with dichloromethane (50 mL). The resulting yellow solid was further purified by column chromatography using a mixture of dichloromethane and ethyl acetate (9:1). The final product was obtained as a yellow powder, yielding 180 mg (95%). 1H NMR (400 MHz, DMSO-d6) δ: 5.28 (s, 2H), 6.99 (d, J = 8.2 Hz, 2H), 7.20–7.44 (m, 7H), 7.76 (d, J = 7.6 Hz, 1H), 7.86 (t, J = 7.6Hz, 1H), 8.35 (d, J = 8.2Hz, 1H), 8.51–8.58 (m, 2H), 9.88 (s, 1H). 13C NMR (100 MHz, DMSO-d6) δ: 43.3, 116.1, 120.8, 122.7, 127.5, 127.8, 127.9, 128.2, 128.6, 128.8, 129.1, 129.9, 131.2, 131.4, 131.7, 133.2, 137.8, 147.1, 158.4, 163.8, 164.0.
4-(2-benzyl-1,3-dioxo-2,3-dihydro-1H-benzo[de]isoquinolin-6-yl)phenyl 2,4-dinitrobenzene-Sulfonate (M1): Compound 2 (185 mg, 0.5 mmol) was dissolved in pyridine (2 mL) and reacted with 2,4-dinitrobenzenesulfonyl chloride (266 mg, 1 mmol) at 120 °C for 3 h. After completion of the reaction, the mixture was poured into a 12% HCl solution (20 mL) to precipitate the crude product. The crude product was purified by column chromatography using a mixture of dichloromethane and hexane (6:1). The final product (219 mg) was obtained as a white solid (72%). 1H NMR (400 MHz, DMSO-d6) δ: 5.27 (s, 2H), 7.08–7.47 (m, 7H), 7.61–7.70 (m, 2H), 7.81 (d, J = 7.4 Hz, 1H), 7.87 (t, J = 8.1 Hz. 1H), 8.18 (d, J = 8.6, 1H), 8.41 (d, J = 8.6 Hz, 1H), 8.50–8.61 (m, 2H), 8.67 (d, J = 8.0 Hz, 1H), 9.16 (s, 1H). 13C NMR (100 MHz, DMSO-d6) δ: 42.9, 121.5, 122.1, 122.8, 122.9, 127.5, 127.9, 128.0, 128.3, 128.4, 128.7, 128.8, 129.7, 131.0, 131.3, 131.6, 132.4, 132.5, 134.1, 137.7, 138.6, 144.9, 148.6, 149.0, 152.0, 163.7, 163.9.
2-benzyl-6-(6-hydroxynaphthalen-2-yl)-1H-benzo[de]isoquinoline-1,3(2H)-dione (3): Compound 1 (505 mg, 1.4 mmol) was mixed with (6-hydroxynaphthalen-2-yl)boronic acid (200 mg, 1.1 mmol), triphenylphosphine (58 mg, 0.22 mmol), and t-BuOK (123 mg, 1.1 mmol) in isopropanol (6 mL). The mixture was heated at 60 °C for 3 h. Upon completion of the reaction, the mixture was poured into 12% HCl (50 mL) to collect a yellow solid as the crude product. The yellow solid was further purified by column chromatography using pure dichloromethane. The final product was obtained as a yellow powder, yielding 503 mg (85%). 1H NMR (400 MHz, DMSO-d6) δ: 5.21 (s, 2H), 7.15–7.42 (m, 7H), 7.58 (d, J = 4.8 Hz, 1H), 7.83–7.95 (m, 4H), 8.01 (s, 1H), 8.37 (d, J = 4.8Hz, 1H), 8.54–8.63 (m, 2H), 9.99 (s, 1H). 13C NMR (100 MHz, DMSO-d6) δ: 43.4, 109.1, 127.0, 127.6, 127.9, 128.0, 128.1, 128.3, 128.6, 128.8, 128.9, 129.4, 130.0, 130.5, 131.2, 131.6, 132.9, 133.3, 134.8, 137.8, 147.2, 156.7, 163.9, 164.1.
6-(2-benzyl-1,3-dioxo-2,3-dihydro-1H-benzo[de]isoquinolin-6-yl)naphthalen-2-yl 2,4-dinitrobenzenesulfonate (M2): Compound 3 (140 mg, 0.33 mmol) was dissolved in pyridine (2.5 mL) and reacted with 2,4-dinitrobenzenesulfonyl chloride (217 mg, 0.82 mmol) at 110 °C for 3 h. After completion of the reaction, the mixture was poured into a 12% HCl solution (20 mL) to precipitate the crude product. The crude product was purified by column chromatography using a mixture of dichloromethane and ethyl acetate (3:1). The final product (132 mg) was obtained as a white solid (61%). 1H NMR (400 MHz, CDCl3) δ: 5.32 (s, 2H), 7.21–7.44 (m, 6H), 7.60 (d, J = 4.4 Hz 2H), 7.80 (d, J = 4.4 Hz, 1H), 7.88–8.00 (m, 3H), 8.18 (d, J = 4.4 Hz, 1H), 8.23–8.31 (m, 2H), 8.36 (d, J = 3.6 Hz, 1H), 8.50 (d, J = 4.8He, 1H), 8.59–8.69 (m, 2H), 8.98 (d, J = 1.2 Hz, 1H). 13C NMR (100 MHz, CDCl3-d6) δ: 43.8, 117.3, 119.0, 120.6, 122.1, 122.3, 123.0, 127.2, 127.5, 128.0, 128.2, 128.5, 128.8, 128.9, 129.0, 129.1, 129.2, 130.2, 131.1, 131.4, 131.5, 131.6, 132.5, 133.7, 136.9, 137.3, 139.9, 141.8, 146.2, 152.0, 155.9, 164.1, 164.3.

2.3. Cell Culture and Imaging

MDA-MB-231 epithelial cells (ATCC, Manassas, VA, USA) were grown in DMEM media containing 5% FBS, 100 µg /mL of streptomycin, and 100 IU/mL of penicillin for all experiments. The cells were incubated in a humidified atmosphere containing 5% CO2 set at 37 °C. For imaging, 600,000 cells were seeded in each well of a Cellvis 6 well glass bottom plate (Fisher Scientific, Pittsburgh, PA, USA, catalog #NC0452316). Upon reaching 75% confluency, cells were treated with 0–300 µM of an aqueous NaHS solution and left to incubate for an hour at 37 °C. Post-incubation, the media were removed, and the cells were washed with cold PBS followed by fresh DMEM media, on which a 10 µM M1 probe (dissolved in DMSO) was added. Following a 45 min incubation period at 37 °C, media were removed from the wells, and cells were washed with cold PBS twice. All cell imaging was performed with wells containing PBS instead of DMEM to minimize background fluorescence.
All imaging was performed using an Olympus FV3000 laser scanning confocal microscope (Olympus, Tokyo, Japan). Images were taken using either a 20× or 60× oil immersion objective. Images for each sample were taken using the same microscope settings using a 405 nm laser at 0.2% transmissivity.

3. Result and Discussion

3.1. Synthesis

To synthesize probes M1 and M2, commercially available 4-bromo-1,8-naphthalic anhydride first reacted with benzylamine to yield compound 1. Subsequently, Suzuki coupling reactions introduced phenyl and naphthalene groups at position 4 of compound 1, forming compounds 2 and 3. The coupling reaction yielded 95% and 85% yields for compounds 2 and 3, respectively. Next, compounds 2 and 3 reacted with 2,4-dinitrosulfonyl chloride to yield the desired probes M1 and M2.

3.2. Photophysical Properties of M1 and M2

The photophysical properties of compounds M1 and M2 were investigated in five different solvents: DMSO, MeCN, acetone, MeOH, and THF, as summarized in Table 1. Both compounds exhibited significant solvatochromic behavior, with absorption maxima observed in the 345–363 nm range and fluorescence emission maxima in the 422–501 nm range.
The dinitrobenzene sulfonate group in M1 and M2 exhibited a markable fluorescence quenching effect, resulting in low quantum yields, particularly in polar solvents such as DMSO. Notably, M2, which features an extended naphthalene moiety with increased π-conjugation compared to M1, displayed bathochromic shifts in both absorption and emission spectra. The increased conjugation significantly contributed to the red shift, highlighting the critical influence of structural modifications on their optical characteristics.

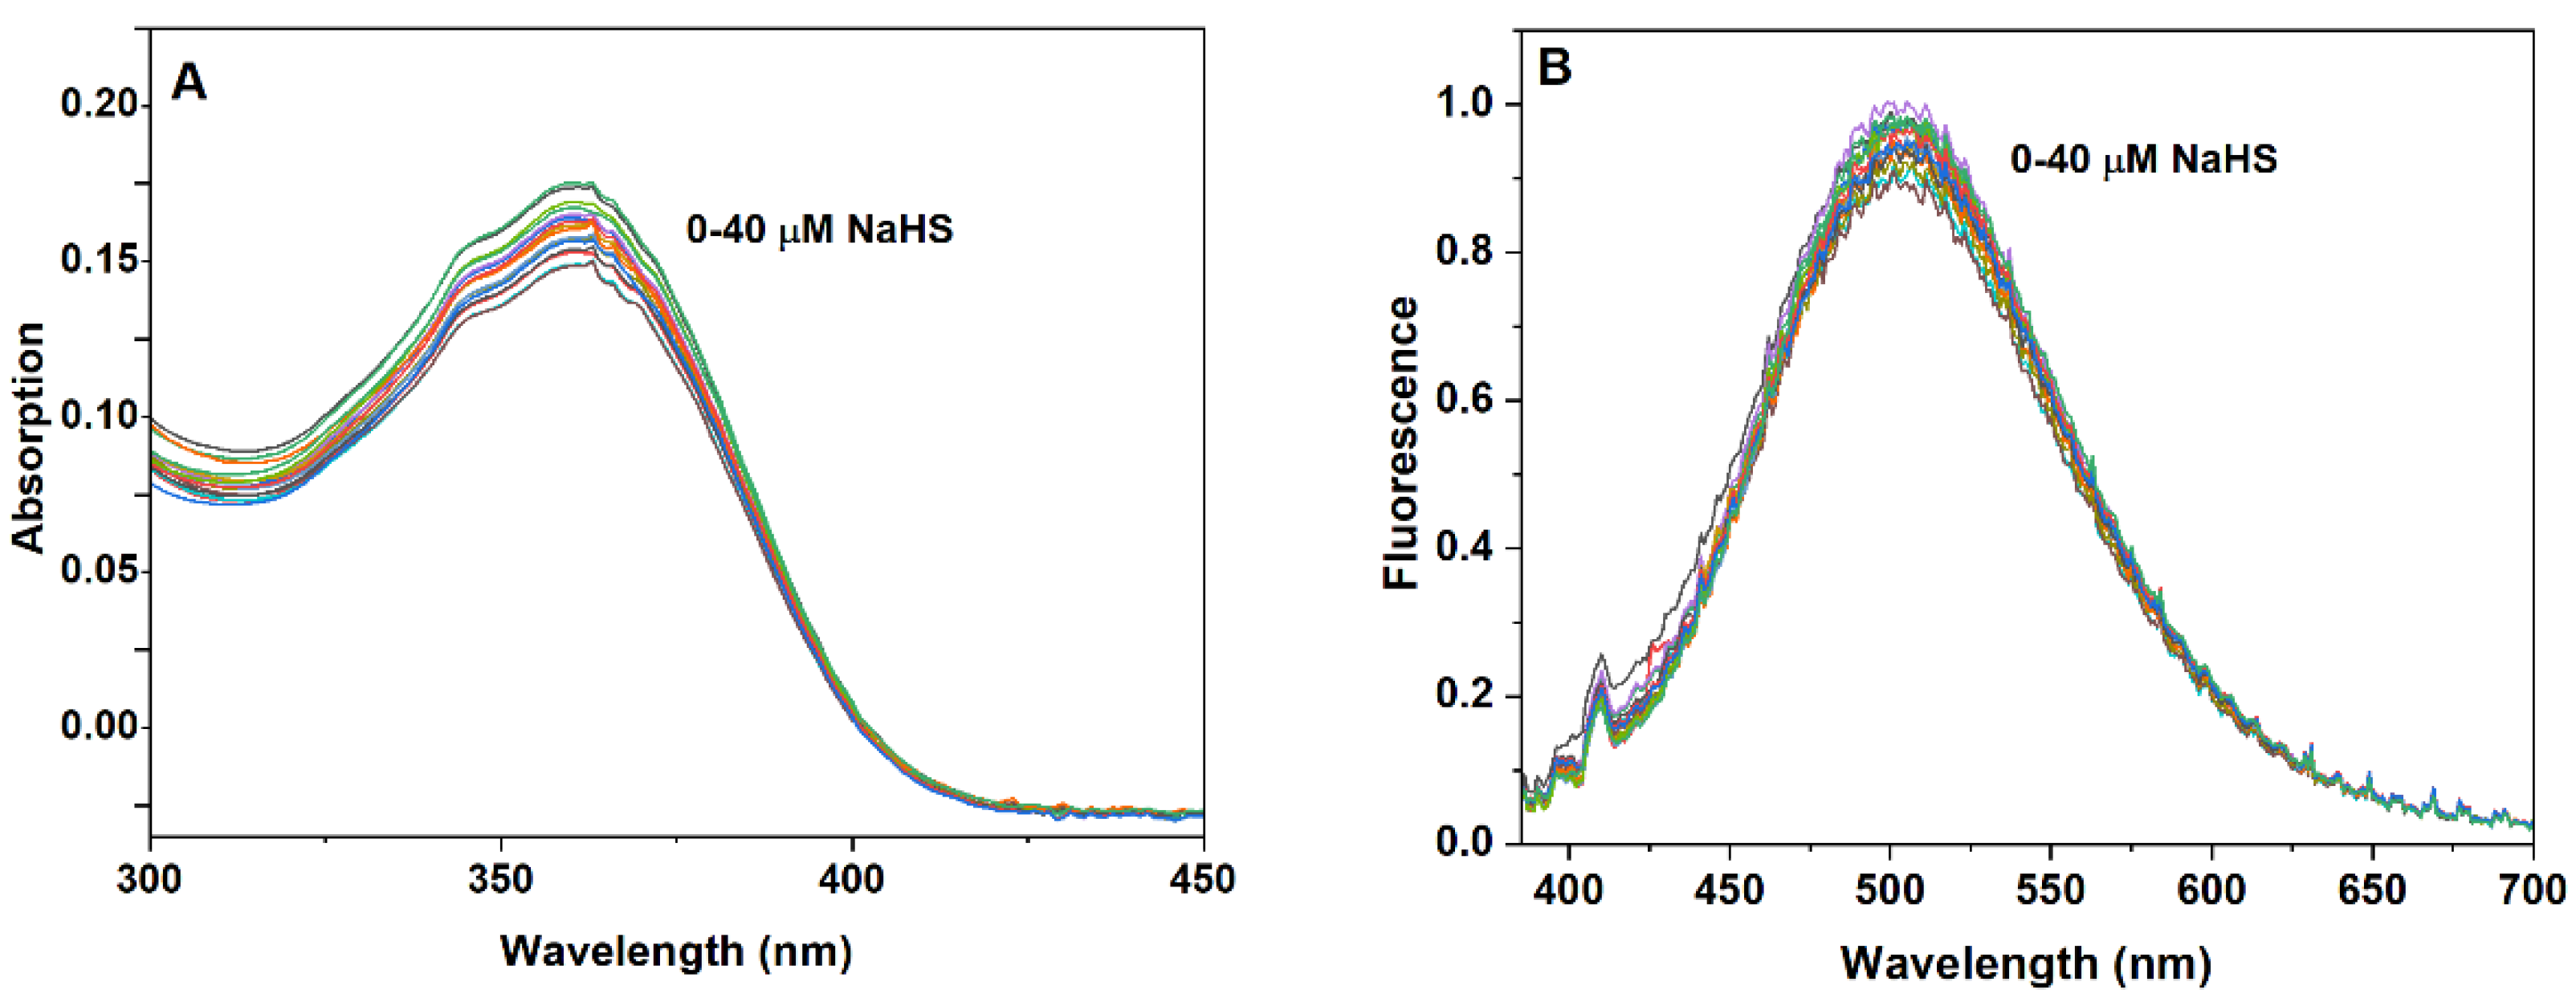
3.3. Quantitative Detection of H2S

To assess the sensing capability of M1 to H2S, M1 (10 μM) was incubated with different amounts of NaHS (0–40 μM) for 20 min at room temperature. Due to the high dissociation rate of H2S in aqueous media, NaHS was utilized as the H2S resource for all measurements. The absorption and fluorescence emission spectra were collected after 20 min incubation, as shown in Figure 1. To consider balancing signal strength and biocompatibility, a 1:1 (v/v) mixture of acetonitrile and water (MeCN/H2O) was chosen as the medium to conduct these measurements.
The maximum absorption of free M1 was observed at 347 nm. As a sulfonate ester, M1 showed a high reaction rate with NaHS via a nucleophilic aromatic substitution reaction to yield a phenol derivative, leading to a significant change in both absorption and emission spectra. In the presence of NaHS, the maximum absorption changed from 347 nm to 376 nm, indicating the formation of 4-hydroxyphenyl-1,8-naphthalimide. Notably, a new absorption peak at 441 nm was observed, corresponding to the phenolate species generated by the rapid deprotonation of 4-hydroxyphenyl-1,8-naphthalimide (Figure 1A,B).
The maximum fluorescence emission spectra were observed at 423 nm with an excitation at 365 nm. Following the addition of NaHS, the emission peak of M1 at 423 nm rapidly decreased, while a new emission peak appeared at 510 nm. This spectral shift corresponds to the formation of 4-hydroxyphenyl-1,8-naphthalimide via the H2S-triggered substitution reaction (Figure 1C,D). Interestingly, no fluorescence emission was observed when the absorption wavelength at 441 nm was used as the excitation.
Absorption and emission spectral analysis confirmed the high sensitivity of M1 to NaHS. Upon the addition of 40 μM of NaHS, spectral changes reached a plateau, indicating the completion of the H2S-triggered nucleophilic aromatic substitution reaction. Moreover, the fluorescence emission intensity at 510 nm exhibited a strong linear correlation with NaHS concentrations in the 0–22 μM range (Figure 1E). The limit of detection (LOD) was calculated to be 0.64 μM (0.0218 ppm) using the equation LOD = 3δ/S, where δ is the standard deviation and S is the slope of the calibration curve.
Fluorescence emission spectra were used to investigate the reaction kinetics of M1 with NaHS under identical experimental conditions. Upon mixing NaHS (40 μM) with M1 (10 μM) in a 1:1 (v/v) MeCN/H2O solution at room temperature, fluorescence spectra were recorded over 30 min (λex = 365 nm). After initiating the reaction, the emission at 432 nm decreased rapidly, while a concurrent emission enhancement at 510 nm was observed. Both intensity changes reached a plateau within 10 min, indicating reaction completion (Figure 1F). Kinetic analysis using a pseudo-second-order model yielded a reaction rate constant of 7.56 × 10² M−1 s−1. Compared to other reaction-based H2S probes, M1 showed a short response time to H2S (Table S1).

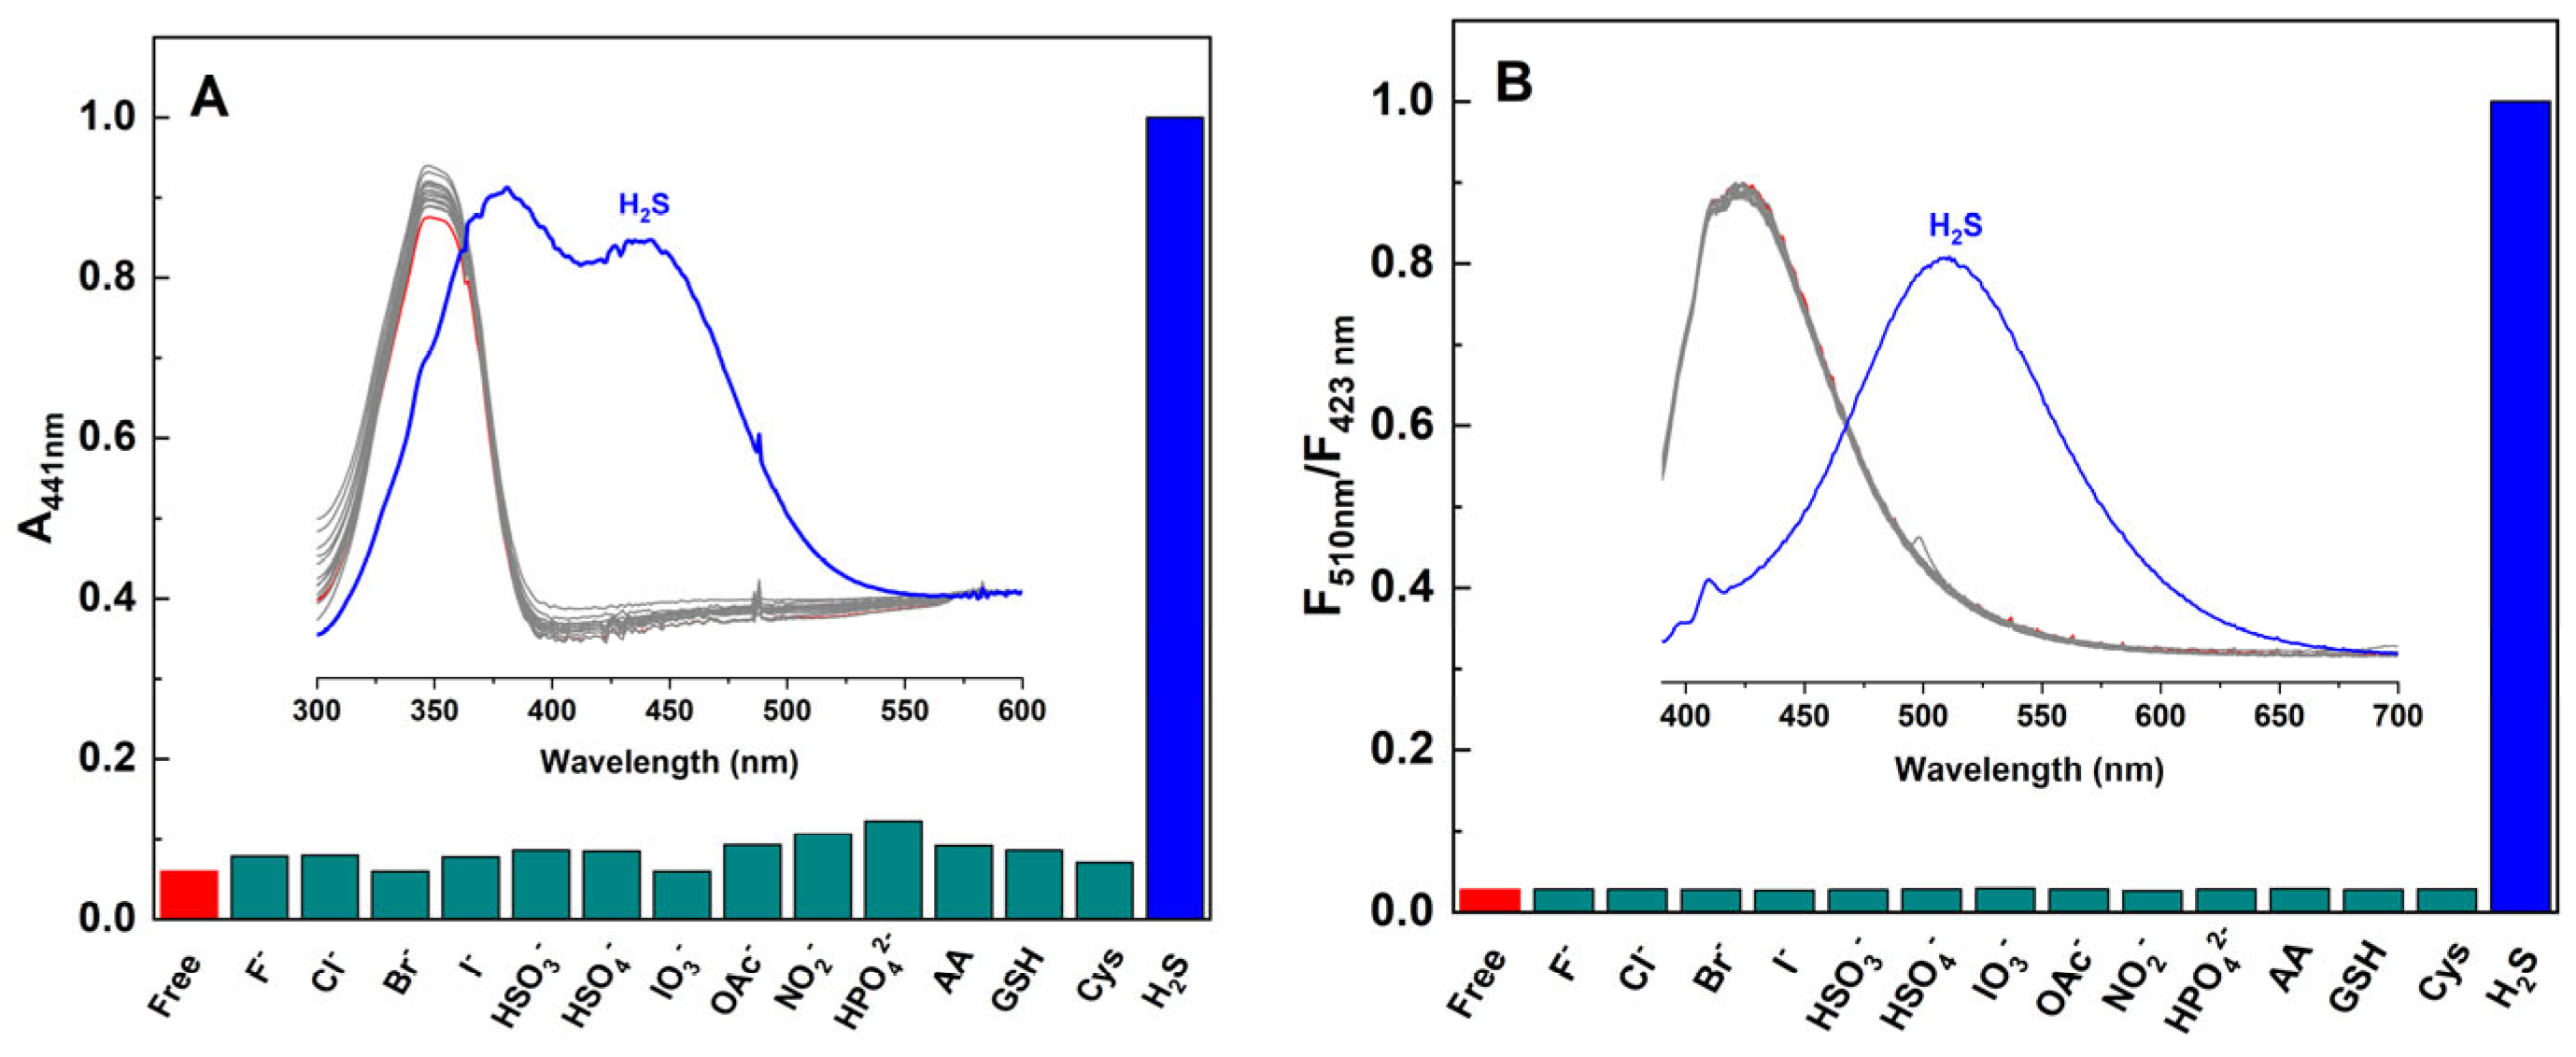
3.4. Selectivity of M1 to H2S

To evaluate the selectivity of M1 for H2S detection, 13 nucleophilic species (F, Cl, Br, I, HSO3, HSO4, IO3, OAc, NO2, HPO4, ascorbic acid, GSH, and Cys) were tested under identical conditions. Each species (40 μM) was incubated with M1 (10 μM) in a 1:1 (v/v) MeCN/H2O mixture at room temperature for 20 min, and the absorption and emission spectra were recorded. As shown in Figure 2, only H2S induced a remarkable red shift in both the absorption and emission spectra, while all other species showed negligible spectral changes. This demonstrates that M1 exhibits high selectivity toward H2S due to its specific nucleophilic aromatic substitution mechanism. The absence of interference from biologically relevant nucleophiles supports the probe’s potential for accurate H2S detection in complex systems.

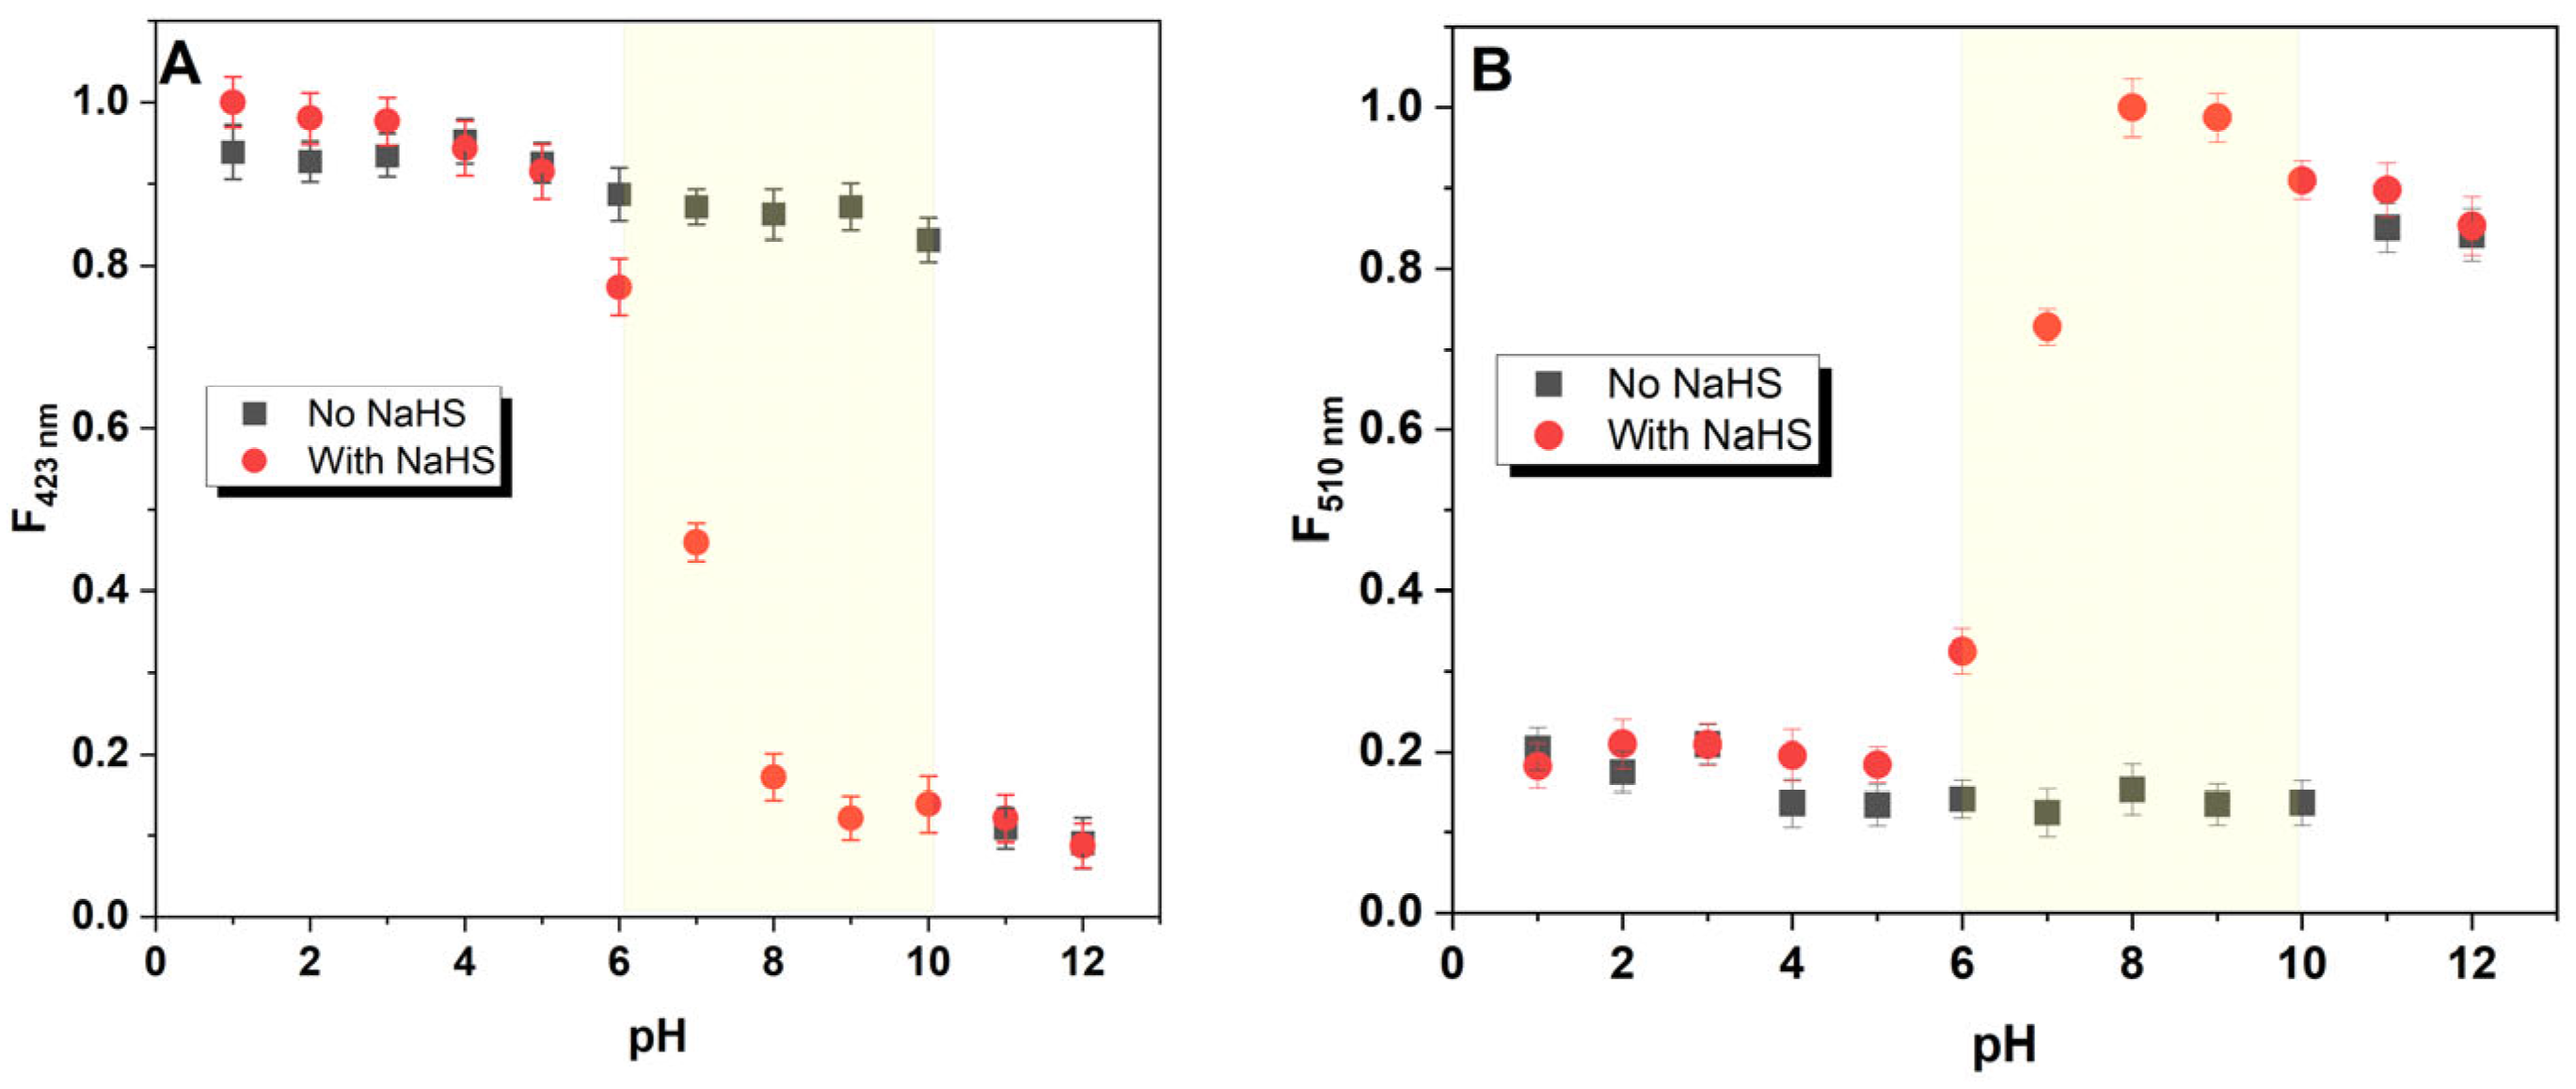
3.5. pH Effect on the Sensing Capability of M1

As a sulfonate ester, M1 is sensitive to changes in pH due to the potential hydrolysis of the ester group. Additionally, M1 is designed for quantitatively detecting H2S, whose nucleophilicity is highly pH-dependent. This pH dependency significantly influences the reaction rate between M1 and H2S, thereby affecting the probe’s response time. To investigate the pH-dependent sensing capability, M1 (10 μM) was measured in a 1:1 (v/v) mixture of MeCN and pH buffer (pH 1–12) at room temperature. Fluorescence spectra were recorded after 20 min of incubation. Theoretically, M1 is expected to exhibit fluorescence quenching at 423 nm and enhancement at 510 nm upon reacting with NaHS. The pH-dependent fluorescence response of M1 in the presence of NaHS was investigated across the pH range of 1–12 (Figure 3). In media with pH 1–6, no significant emission changes were observed at 423 nm or 510 nm, likely due to the protonation of HS, which reduced its nucleophilicity and slowed the reaction with M1. In contrast, at pH 6–10, the addition of NaHS to M1 resulted in fluorescence quenching at 423 nm and enhancement at 510 nm, with the strongest response observed at pH 9. This pH condition provided the maximum fluorescence signal for H2S detection. At pH 10–12, fluorescence changes at 423 nm and 510 nm were detected even in the absence of NaHS, indicating that OH reacted with M1, causing similar spectral changes. These results suggested that pH 6–10 is the optimal pH range for M1 to detect H2S with minimal interference.

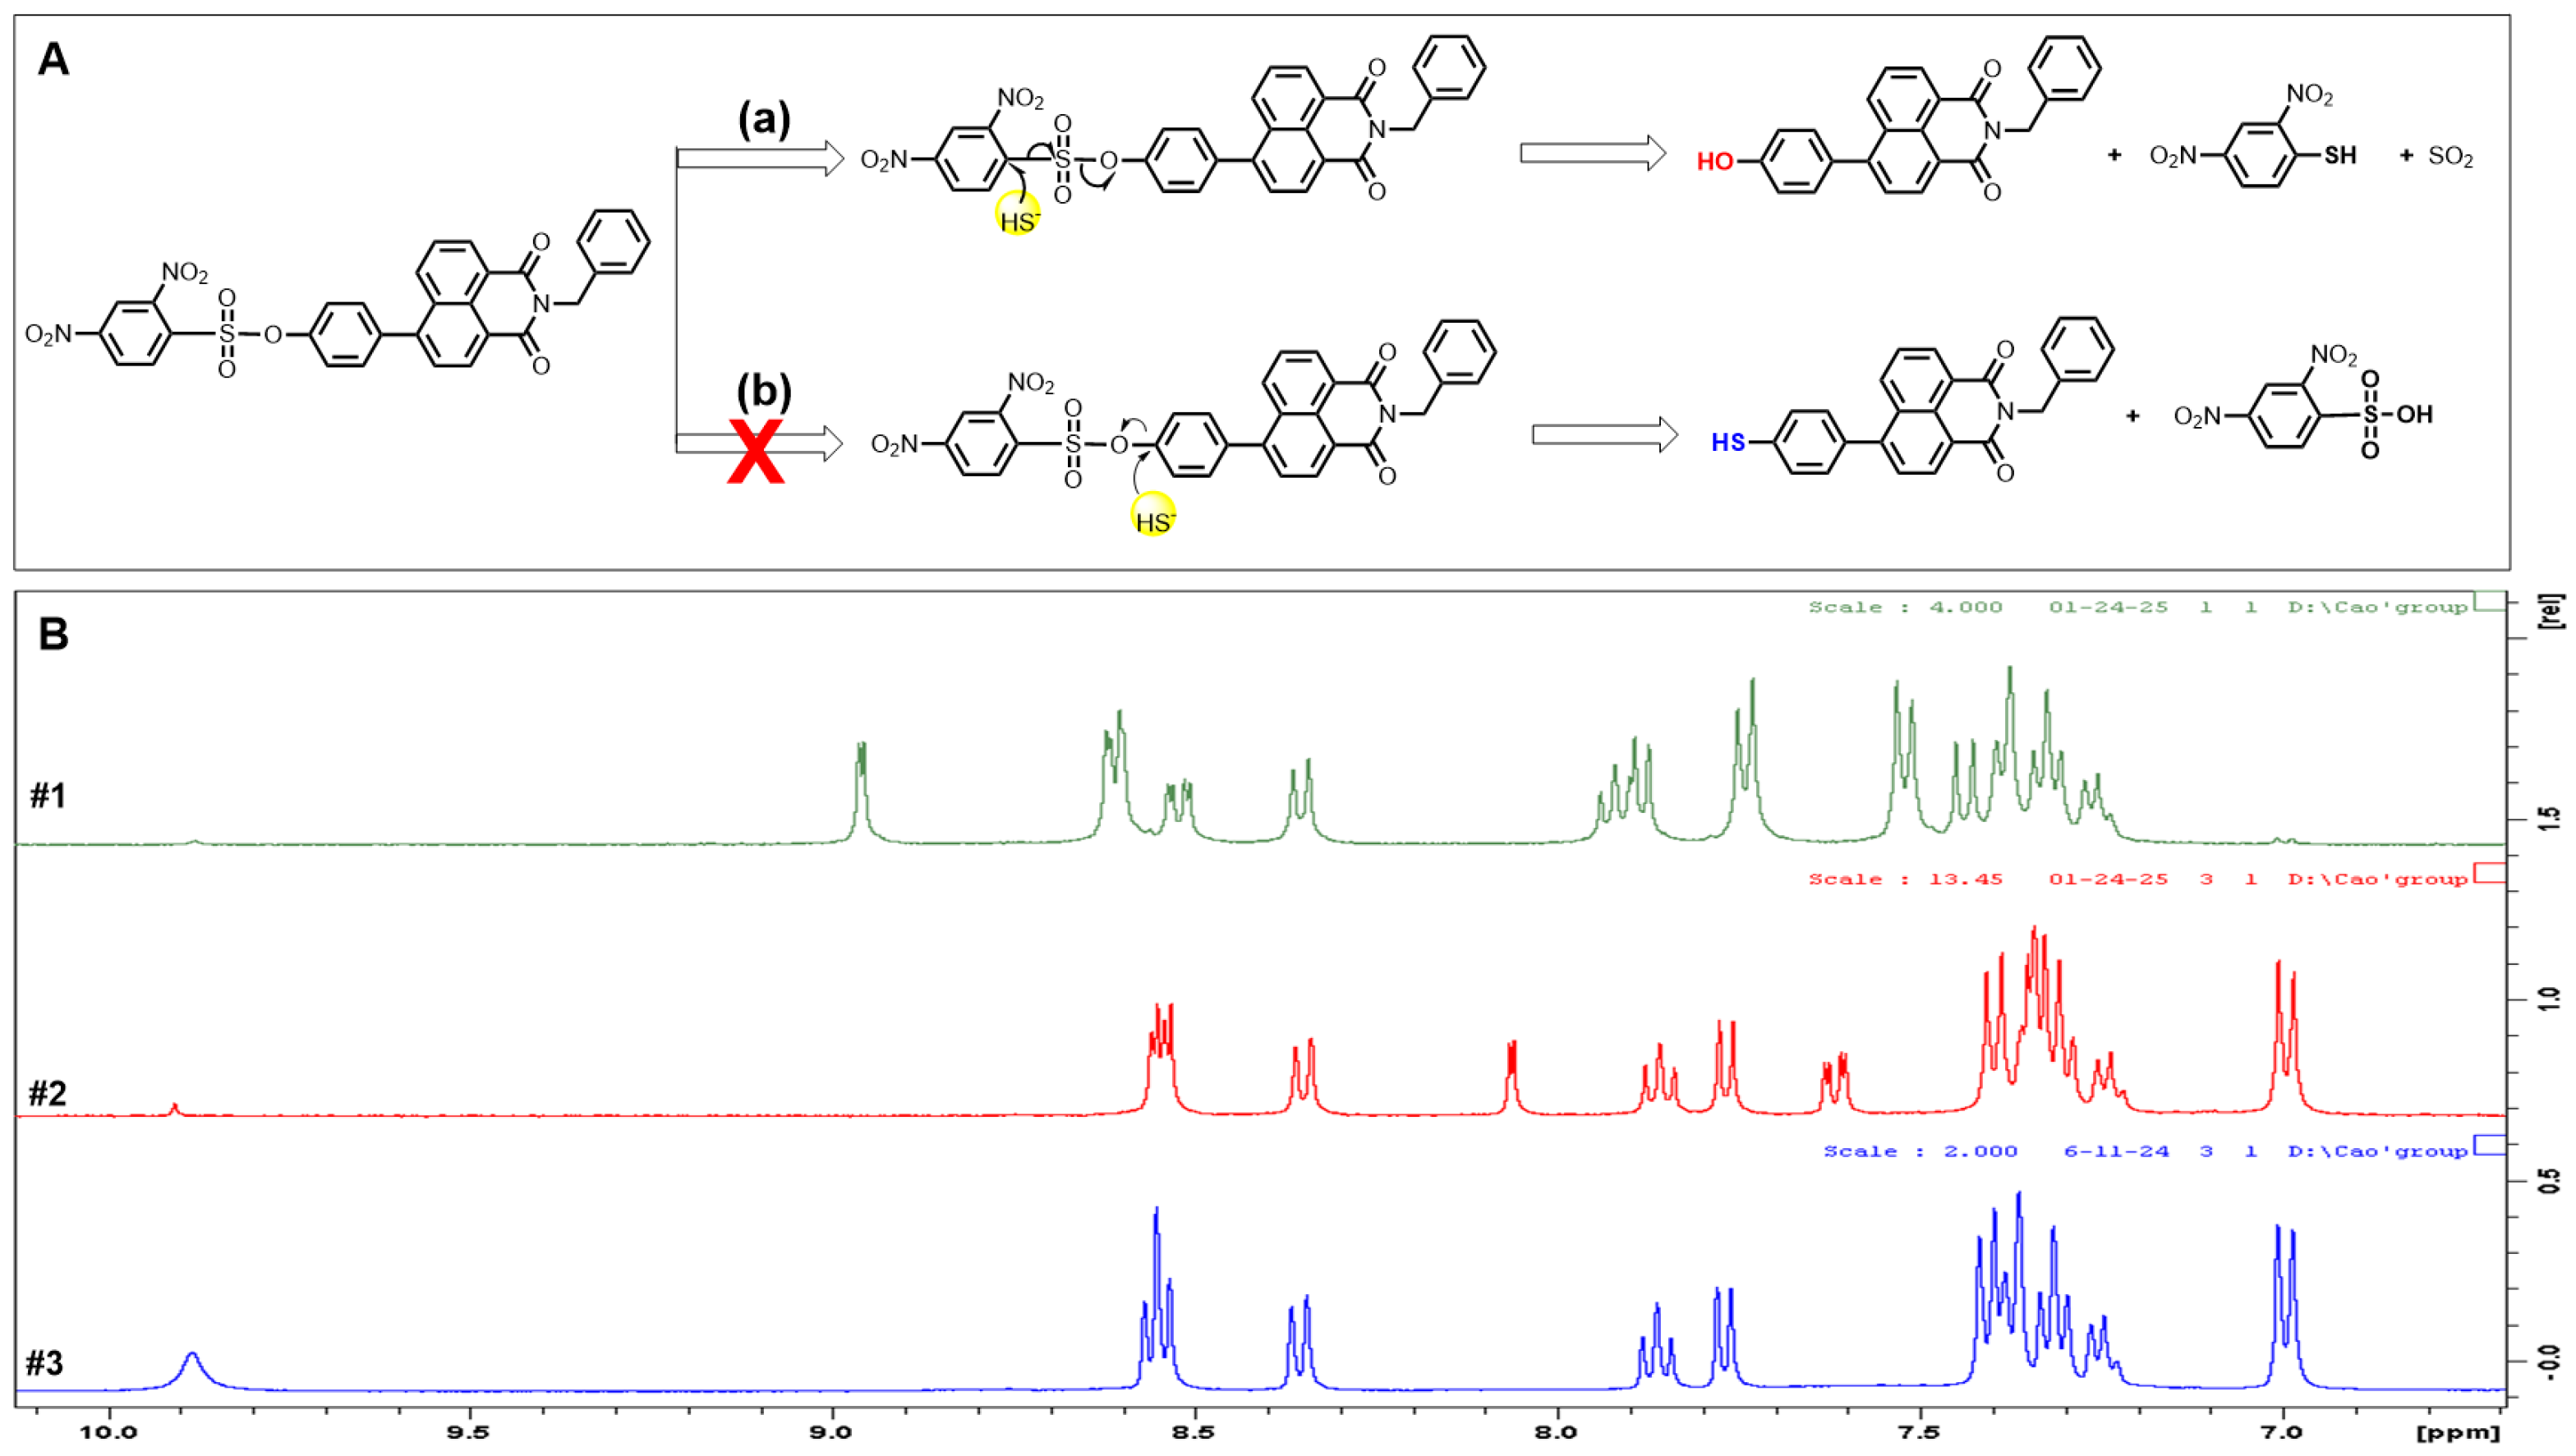
3.6. The Sensing Mechanism for H2S

Since M1 employs nucleophilic substitution as its sensing mechanism for H2S detection, the nucleophile (H2S) can potentially target two reactive sites: the dinitrobenzene moiety or the phenyl ring attached to the 1,8-naphthalimide core, leading to distinct products and fluorescence emissions (Scheme 2). To confirm the H2S-triggered nucleophilic substitution mechanism of M1, 1H NMR titration experiments were performed. As shown in Scheme 2, the 1H NMR spectra were obtained for M1 (Panel #1), a mixture of M1 and NaHS (Panel #2), and 4-hydroxyphenyl-1,8-naphthalimide (Panel #3). Upon reacting with NaHS, M1 yielded a product with an identical 1H NMR spectrum to 4-hydroxyphenyl-1,8-naphthalimide, including a characteristic peak at 9.90 ppm corresponding to the phenol group. These results conclusively demonstrate that M1 undergoes a nucleophilic substitution reaction with NaHS, using mechanism (a) to yield 4-hydroxyphenyl-1,8-naphthalimide as the product.

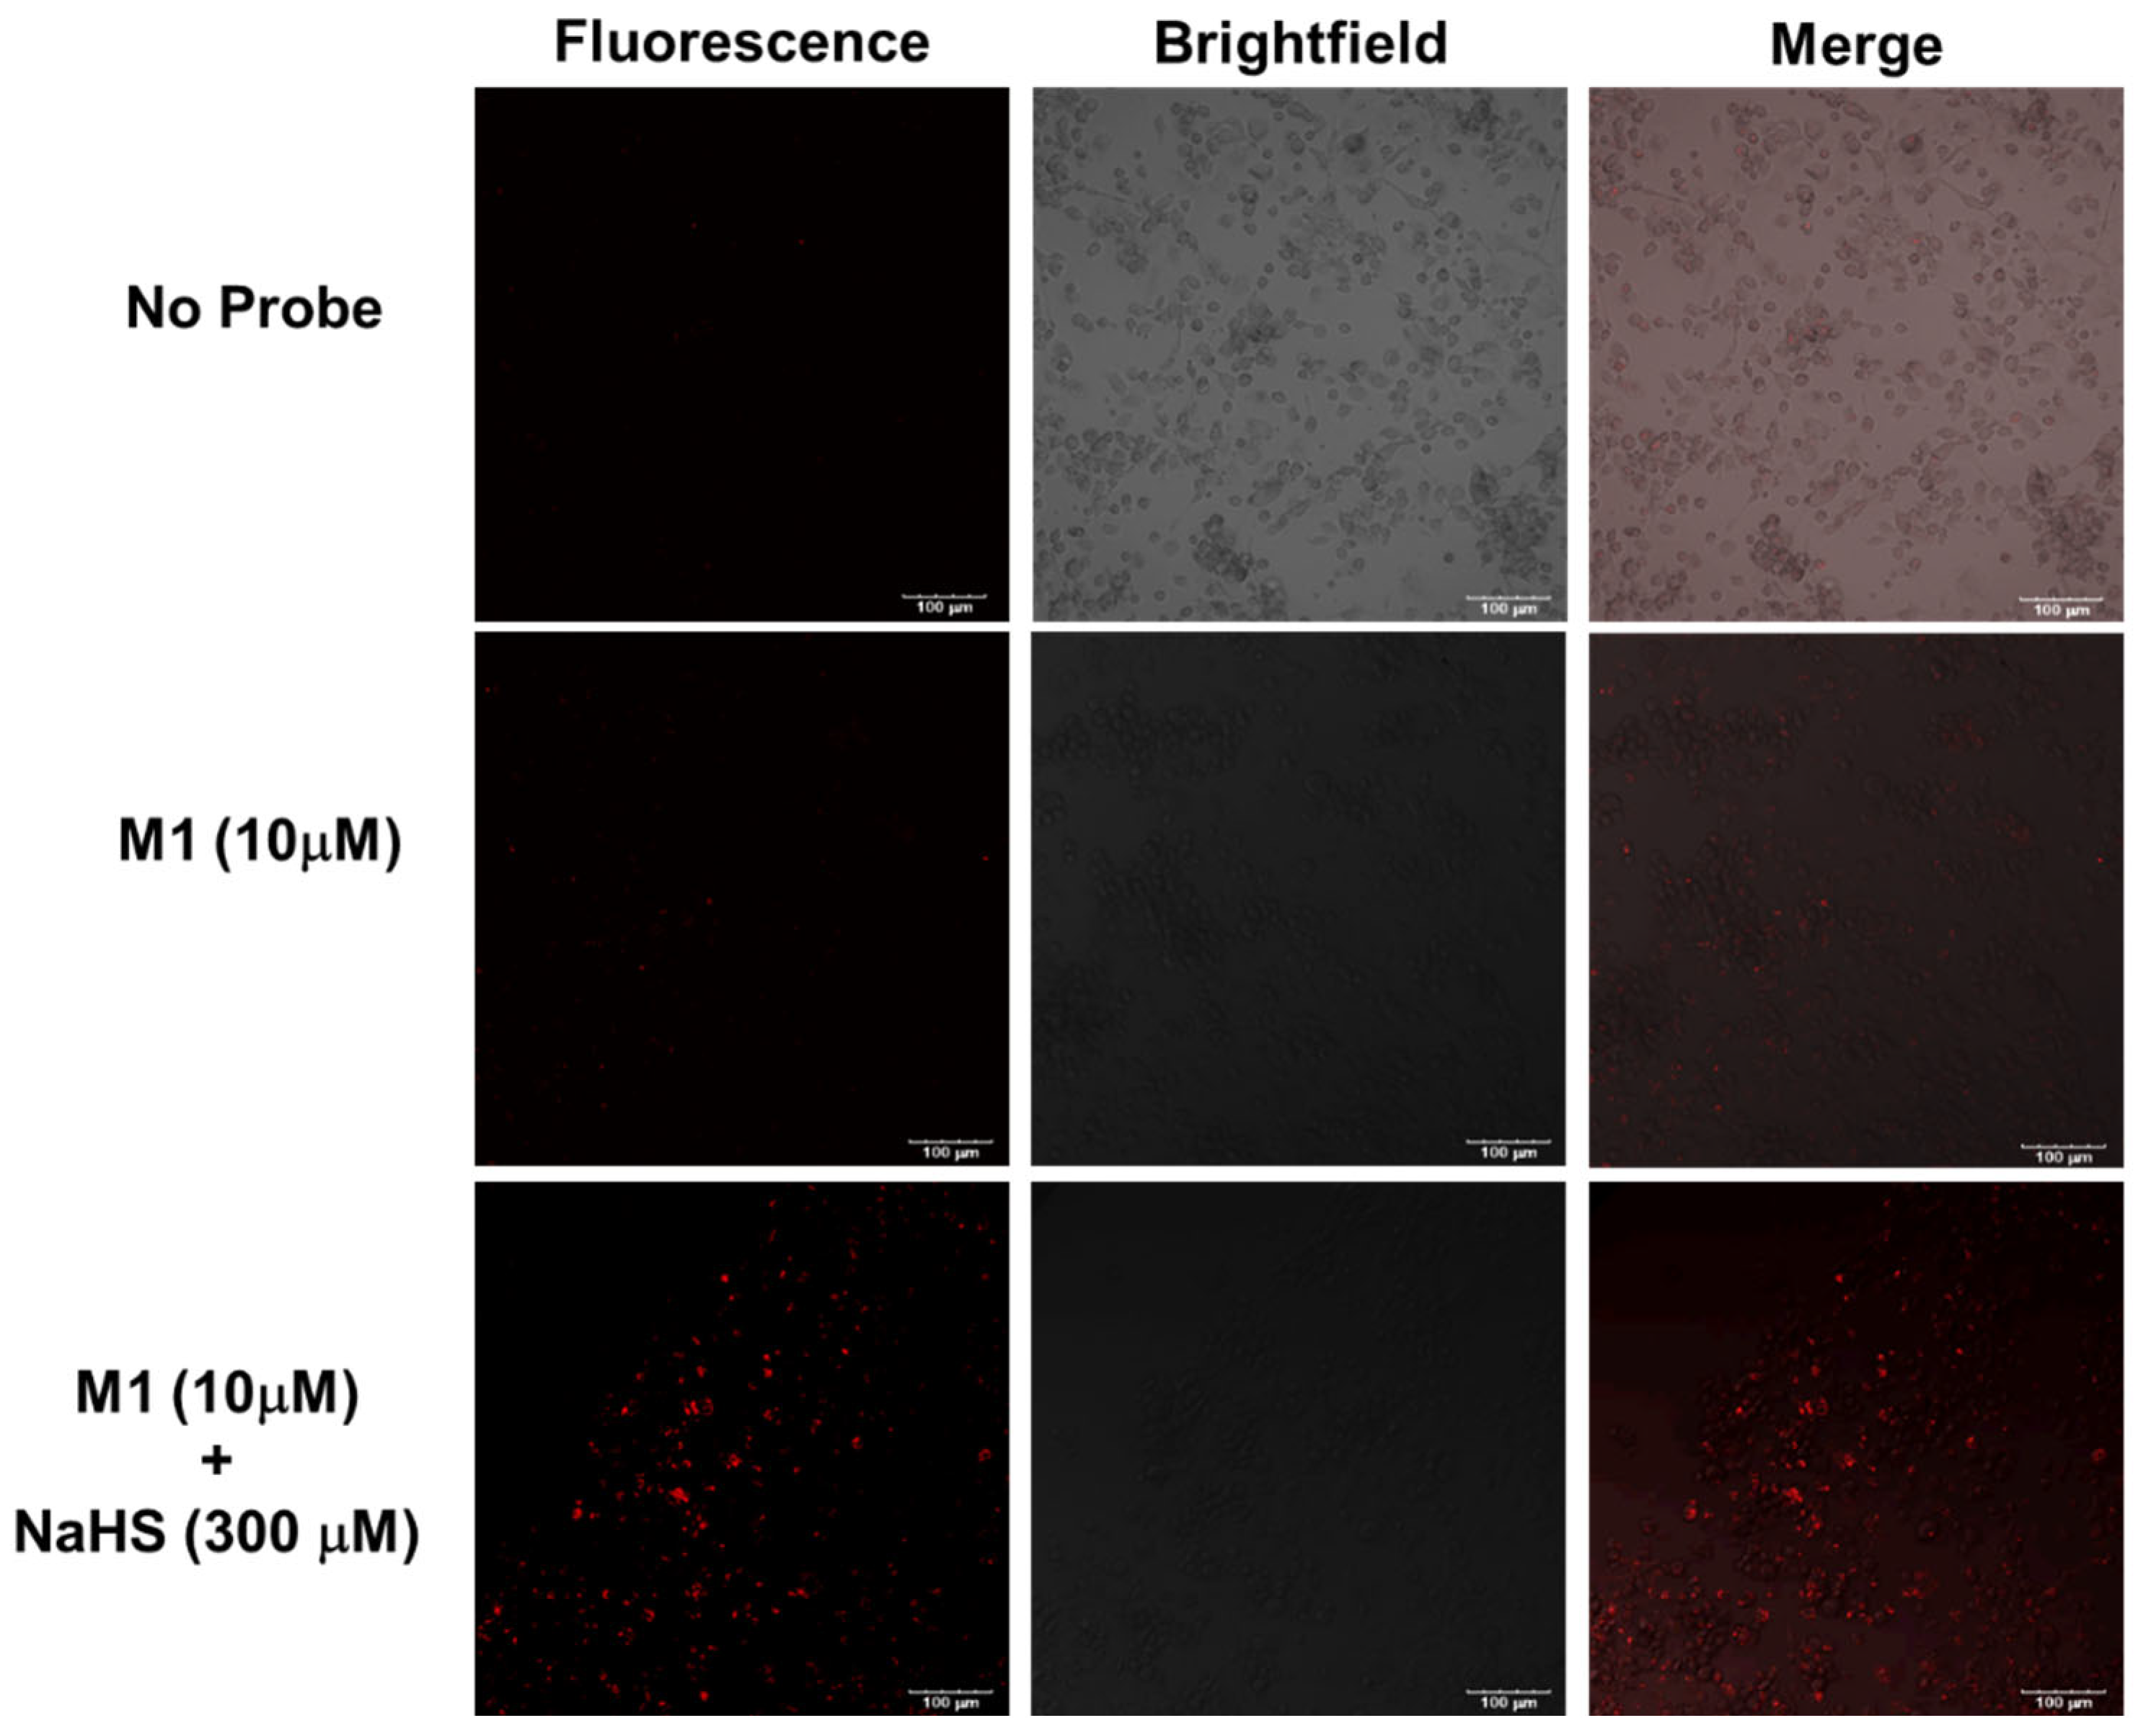
3.7. Detection of Cellular H2S in MDA-MB-231 Cells

MDA-MB-231 epithelial cells (ATCC, Manassas, VA, USA) were cultured in DMEM supplemented with 5% FBS, 100 μg/mL of streptomycin, and 100 IU/mL of penicillin and incubated at 37 °C with 5% CO2. For imaging experiments, 600,000 cells were seeded into each well of a Cellvis 6-well glass-bottom plate (Fisher Scientific, Pittsburgh, PA, USA; catalog #NC0452316) until they reached approximately 75% confluency. At this time, the cells were treated with a 0–300 μM aqueous NaHS solution for 1 h at 37 °C, and the media were aspirated and washed with cold PBS. After the wash, the cells were incubated with 10 μM of M1 in DMEM for 45 min at 37 °C. Subsequently, the media were removed, cells were washed twice with cold PBS, and imaging was performed. To reduce background fluorescence, imaging was performed using wells containing PBS instead of DMEM. The results show that M1 exhibited no detectable fluorescence in MDA-MB-231 cells, but a significant fluorescence enhancement was observed following the addition of 300 μM of NaHS (Figure 4), therefore demonstrating that M1 functioned effectively as a probe for detecting H2S in a cellular environment.

3.8. Sensing Capability of M2

To compare with M1, M2 was synthesized with extended conjugation, aiming to achieve fluorescence emission at a longer wavelength. The sensing performance of M2 was evaluated under the same experimental conditions as M1. M2 (10 μM) was titrated with NaHS (0–40 μM) at room temperature, and the absorption and emission spectra were collected after 20 min of incubation in a 1:1 MeCN/H2O mixture (Figure 5). M2 displayed an absorption at 361 nm and an emission at 511 nm. However, neither absorption nor emission exhibited significant changes in response to NaHS within the tested concentration range (0–40 μM).
Compared to M1, M2 showed significantly weaker sensitivity to H2S, likely because it reacts with H2S to yield a sulfonate ester rather than producing SO2 and naphthol. The presence of the sulfonyl group in the product induced a quenching effect, leading to a reduced fluorescence response. Additionally, M2 showed lower solubility in MeCN compared to M1, which may further contribute to its low sensitivity to H2S. Due to its poor sensitivity to H2S, a pH-dependent sensing study was not conducted for M2.

4. Conclusions

In this study, we developed and characterized two novel 1,8-naphthalimide-based fluorescent probes, M1 and M2, for the selective detection of H2S in biological systems. M1 exhibited a high sensitivity and selectivity for H2S, with a detection limit of 0.64 µM and a rapid response rate, attributed to its efficient nucleophilic aromatic substitution mechanism. M1 showed distinct spectral changes in absorption and emission spectra in the presence of H2S, making it a tool with multiple windows for the quantitative detection of H2S in aqueous media over a physiologically relevant pH range (pH 6–10). Mechanism studies were conducted using 1H NMR titration, confirming the formation of a phenol derivative rather than a thiol derivative as the reaction product. Moreover, M1’s biocompatibility and ability to detect H2S in living MDA-MB-231 cells further validated its potential as a practical tool for studying H2S in biological environments. In contrast, M2, designed with extended conjugation for red-shifted fluorescence, displayed lower sensitivity to H2S due to the reduced stability of its reaction product and decreased solubility in the aqueous medium. These findings provided a valuable tool for advancing our understanding of the physiological and pathological roles of H2S in major human diseases.

Supplementary Materials

The following supporting information can be downloaded at https://www.mdpi.com/article/10.3390/bios15030174/s1, Table S1: The comparison of detection parameters of M1 with other H2S probes. References [38,39,40,41,42] are cited in the Supplementary Materials.

Author Contributions

Investigation, T.D., H.H.-S., S.C., M.M.V.G., L.B., R.G. and K.A.C.; Supervision, H.C. All authors have read and agreed to the published version of the manuscript.

Funding

The funding support from the Nebraska EPSCoR via the Undergraduate Research Experience (URE) program (H.C.) and the National Institute of General Medical Sciences of the National Institutes of Health (5P20GM103427 and 1U54GM115458; K.A.C.). This work was performed in the UNK INSpRE core facility.

Institutional Review Board Statement

Not applicable.

Informed Consent Statement

Not applicable.

Data Availability Statement

Data are contained within the article.

Conflicts of Interest

The authors declare no conflict of interest.

References

  1. Kolluru, G.K.; Shackelford, R.E.; Shen, X.; Dominic, P.; Kevil, C.G. Sulfide regulation of cardiovascular function in health and disease. Nat. Rev. Cardiol. 2023, 20, 109–125. [Google Scholar] [CrossRef] [PubMed]
  2. Linden, D.R. Hydrogen sulfide signaling in the gastrointestinal tract. Antioxid. Redox Signal. 2014, 20, 818–830. [Google Scholar] [CrossRef]
  3. Dilek, N.; Papapetropoulos, A.; Toliver-Kinsky, T.; Szabo, C. Hydrogen sulfide: An endogenous regulator of the immune system. Pharmacol. Res. 2020, 161, 105119. [Google Scholar] [CrossRef]
  4. Nguyen, T.T.P.; Nguyen, P.L.; Park, S.H.; Jung, C.H.; Jeon, T.I. Hydrogen Sulfide and Liver Health: Insights into Liver Diseases. Antioxid. Redox Signal. 2024, 40, 122–144. [Google Scholar] [CrossRef] [PubMed]
  5. Dugbartey, G.J. Physiological role of hydrogen sulfide in the kidney and its therapeutic implications for kidney diseases. Biomed. Pharmacother. 2023, 166, 115396. [Google Scholar] [CrossRef] [PubMed]
  6. Hosoki, R.; Matsuki, N.; Kimura, H. The Possible role of hydrogen sulfide as an endogenous smooth muscle relaxant in synergy with nitric oxide. Biochem. Biophys. Res. Commun. 1997, 237, 527–531. [Google Scholar] [CrossRef]
  7. Whitfield, N.L.; Kreimier, E.L.; Verdial, F.C.; Skovgaard, N.; Olson, K.R. Reappraisal of H2S/sulfide concentration in vertebrate blood and its potentialsignificance in ischemic preconditioning and vascular signaling. Am. J. Physiol. Regul. Integr. Comp. Physiol. 2008, 294, R1930–R1937. [Google Scholar] [CrossRef]
  8. Gadalla, M.M.; Snyder, S.H. Hydrogen sulfide as a gasotransmitter. J. Neurochem. 2010, 113, 14–26. [Google Scholar] [CrossRef]
  9. Pozzi, G.; Gobbi, G.; Masselli, E.; Carubbi, C.; Presta, V.; Ambrosini, L.; Vitale, M.; Mirandola, P. Buffering adaptive immunity by hydrogen sulfide. Cells 2022, 11, 325. [Google Scholar] [CrossRef]
  10. Li, L.; Rose, P.; Moore, P.K. Hydrogen sulfide and cell signaling. Annu. Rev. Pharmacol. Toxicol. 2011, 51, 169–187. [Google Scholar] [CrossRef]
  11. Fu, M.; Zhang, W.; Wu, L.; Yang, G.; Li, H.; Wang, R. Hydrogen sulfide (H2S) metabolism in mitochondria and its regulatory role in energy production. Proc. Natl. Acad. Sci. USA 2012, 21, 2943–2948. [Google Scholar] [CrossRef]
  12. Zhu, L.; Duan, W.; Wu, G.; Zhang, D.; Wang, L.; Chen, D.; Chen, Z.; Yang, B. Protective effect of hydrogen sulfide on endothelial cells through Sirt1-FoxO1-mediated autophagy. Ann. Transl. Med. 2020, 8, 1586. [Google Scholar] [CrossRef]
  13. Paul, B.D.; Snyder, S.H.; Kashfi, K. Effects of hydrogen sulfide on mitochondrial function and cellular bioenergetics. Redox Biol. 2021, 38, 101772. [Google Scholar] [CrossRef] [PubMed]
  14. Hu, L.; Lu, M.; Wu, Z.; Wong, P.T.; Bian, J. Hydrogen sulfide inhibits rotenone-induced apoptosis via preservation of mitochondrial function. Mol. Pharmacol. 2009, 75, 27–34. [Google Scholar] [CrossRef]
  15. Kolluru, G.K.; Shen, X.; Bir, S.C.; Kevil, C.G. Hydrogen sulfide chemical biology: Pathophysiological roles and detection. Nitric Oxide 2013, 30, 5–20. [Google Scholar] [CrossRef]
  16. Paul, B.D.; Pieper, A.A. Neuroprotective signaling by hydrogen sulfide and its dysregulation in Alzheimer’s disease. Curr. Opin. Chem. Biol. 2024, 82, 102511. [Google Scholar] [CrossRef]
  17. Szabo, C. Roles of hydrogen sulfide in the pathogenesis of diabetes mellitus and its complications. Antioxid. Redox Signal. 2012, 17, 68–80. [Google Scholar] [CrossRef] [PubMed]
  18. Khattak, S.; Rauf, M.A.; Khan, N.H.; Zhang, Q.Q.; Chen, H.J.; Muhammad, P.; Ansari, M.A.; Alomary, M.N.; Jahangir, M.; Zhang, C.Y.; et al. Hydrogen sulfide biology and its role in cancer. Molecules 2022, 25, 3389. [Google Scholar] [CrossRef] [PubMed]
  19. Yang, M.; Zhou, Y.; Wang, K.; Luo, C.; Xie, M.; Shi, X.; Lin, X. Review of Chemical Sensors for Hydrogen Sulfide Detection in Organisms and Living Cells. Sensors 2023, 23, 3316. [Google Scholar] [CrossRef]
  20. Wang, K.; Bi, C.; Zelenkov, L.; Liu, X.; Song, M.; Wang, W.; Makarov, S.; Yin, W. Fluorescent sensing for the detection and quantification of sulfur-containing gases. ACS Sens. 2024, 9, 5708–5727. [Google Scholar] [CrossRef]
  21. Fosnacht, K.G.; Pluth, M.D. Activity-based fluorescent probes for hydrogen sulfide and related reactive sulfur species. Chem. Rev. 2024, 124, 4124–4257. [Google Scholar] [CrossRef]
  22. Ranjana, M.; Kulkarni, R.M.; Sunil, D. Small molecule optical probes for detection of H2S in water samples: A review. ACS Omega 2024, 21, 14672–14691. [Google Scholar]
  23. May, P.M.; Batka, D.; Hefter, G.; Königsberger, E.; Rowland, D. Goodbye to S2- in Aqueous Solution. Chem. Commun. 2018, 54, 1980–1983. [Google Scholar] [CrossRef]
  24. Peng, H.; Cheng, Y.; Dai, C.; King, A.L.; Predmore, B.L.; Lefer, D.J.; Wang, B. A fluorescent probe for fast and quantitative detection of hydrogen sulfide in blood. Angew. Chem. Int. Ed. 2011, 50, 9672–9675. [Google Scholar] [CrossRef] [PubMed]
  25. Montoya, L.A.; Pluth, M.D. Selective turn-on fluorescent probes for imaging hydrogen sulfide in living cells. Chem. Commun. 2012, 48, 4767–4769. [Google Scholar] [CrossRef] [PubMed]
  26. Kaushik, R.; Ghosh, A.; Jose, D.A. Recent progress in hydrogen sulphide (H2S) sensors by metal displacement approach. Coord. Chem. Rev. 2017, 347, 141–157. [Google Scholar] [CrossRef]
  27. Chen, S.; Li, H.; Hou, P. A novel imidazo [1,5-A] pyridine-based fluorescent probe with a large stokes shift for imaging hydrogen sulfide. Sens. Actuators B 2018, 256, 1086–1092. [Google Scholar] [CrossRef]
  28. Henthorn, H.A.; Pluth, M.D. Mechanistic insights into the H2S-mediated reduction of aryl azides commonly used in H2S detection. J. Am. Chem. Soc. 2015, 137, 15330–15336. [Google Scholar] [CrossRef]
  29. Zhu, T.; Ren, N.; Liu, X.; Dong, Y.; Wang, R.; Gao, J.; Sun, J.; Zhu, Y.; Wang, L.; Fan, C.; et al. Probing the intracellular dynamics of nitric oxide and hydrogen sulfide using an activatable NIR II fluorescence reporter. Angew. Chem. Int. Ed. 2021, 60, 8450–8454. [Google Scholar] [CrossRef]
  30. Hong, Y.; Zhang, P.; Wang, H.; Yu, M.; Gao, Y.; Chen, J. Photoswitchable AIE nanoprobe for lysosomal hydrogen sulfide detection and reversible dual-color Imaging. Sens. Actuators B 2018, 272, 340–347. [Google Scholar] [CrossRef]
  31. Ismail, I.; Chen, Z.; Ji, X.; Sun, L.; Yi, L.; Xi, Z. A fast-response red shifted fluorescent probe for detection of H2S in living cells. Molecules 2020, 25, 437. [Google Scholar] [CrossRef] [PubMed]
  32. Sun, W.; Li, W.; Li, J.; Zhang, J.; Du, L.; Li, M. Naphthalimide-based fluorescent off/on probes for the detection of thiols. Tetrahedron 2012, 68, 5363–5367. [Google Scholar] [CrossRef]
  33. Xiao, P.; Liu, J.; Wang, Z.; Tao, F.; Yang, L.; Yuan, G.; Sun, W.; Zhang, X. A color turn-on fluorescent probe for real-time detection of hydrogen sulfide and identification of food spoilage. Chem. Commun. 2021, 57, 5012–5015. [Google Scholar] [CrossRef]
  34. Echizen, H.; Hanaoka, K. Recent advances in probe design to detect reactive sulfur species and in the chemical reactions employed for fluorescence switching. J. Clin. Biochem. Nutr. 2021, 68, 9–17. [Google Scholar] [CrossRef]
  35. Liu, Y.; Yu, Y.; Zhao, Q.; Tang, C.; Zhang, H.; Qin, Y.; Feng, X.; Zhang, J. Fluorescent probes based on nucleophilic aromatic substitution reactions for reactive sulfur and selenium species: Recent progress, applications, and design strategies. Coord. Chem. Rev. 2021, 427, 213601. [Google Scholar] [CrossRef] [PubMed]
  36. Jin, X.; Ma, X.; Zhou, H.; Chen, J.; Li, M.; Yang, J.; Bai, H.; She, M. Construction of Dcm-Based NIR fluorescent probe for visualization detection of H2S in solution and nanofibrous film. Spectrochim. Acta Part A 2021, 257, 119764. [Google Scholar] [CrossRef]
  37. Chan, J.; Dodani, S.C.; Chang, C.J. Reaction-based small-molecule fluorescent probes for chemoselective bioimaging. Nat. Chem. 2012, 4, 973–984. [Google Scholar] [CrossRef]
  38. Wan, D.; Pan, T.; Ou, P.; Zhou, R.; Ouyang, Z.; Luo, L.; Xiao, Z.; Peng, Y. Construct a lysosome-targeting and highly selective fluorescent probe for imaging of hydrogen sulfide in living cells and inflamed tissues. Spectrochim. Acta Part A Mol. Biomol. Spectrosc. 2021, 249, 119311. [Google Scholar] [CrossRef]
  39. Wang, H.; Li, Y.; Yang, S.; Tian, H.; Liang, S.; Sun, B. Dual-function fluorescent probe for detection of hydrogen sulfide and water content in dimethyl sulfoxide. ACS Omega 2019, 4, 10695–10701. [Google Scholar] [CrossRef]
  40. Shang, Z.; Meng, Q.; Tian, D.; Wang, Y.; Zhang, Z.; Zhang, Z.; Zhang, R. Red-emitting fluorescent probe for hydrogen sulfide detection and its applications in food freshness determination and in vivo bioimaging. Food Chem. 2023, 427, 136701. [Google Scholar] [CrossRef]
  41. Sun, Y.; Tang, X.; Zhang, K.; Liu, K.; Li, Z.; Zhao, L. Hydrogen sulfide detection and zebrafish imaging by a designed sensitive and selective fluorescent probe based on resorufin. Spectrochim. Acta Part A Mol. Biomol. Spectrosc. 2022, 264, 120265. [Google Scholar] [CrossRef] [PubMed]
  42. Feng, W.; Xiao, Q.; Wang, L.; Yang, Y. A new fluorescent probe for hydrogen sulfide detection in solution and living cells. Molecules 2023, 28, 6195. [Google Scholar] [CrossRef] [PubMed]
Scheme 1. The synthetic routes to prepare M1 and M2.
Biosensors 15 00174 sch001
Figure 1. M1 (10 μM) is titrated with NaHS (0–40 μM) in a 1:1 (v/v) mixture of MeCN/H2O at room temperature. Spectra are recorded after 20 min of incubation. (A) Absorption spectra of M1 in the presence of increasing concentrations of NaHS. (B) Changes in the absorption of M1 at 347 nm and 441 nm. (C) Fluorescence spectra of M1 with increasing concentrations of NaHS (λex = 365 nm). (D) Changes in fluorescence emission of M1 at 423 nm and 510 nm. (E) Linear correlation between fluorescence intensity at 510 nm and NaHS concentration. (F) After incubating M1 (10 μM) with NaHS (40 μM) in a 1:1 (v/v) mixture of MeCN/H2O at room temperature, the fluorescence emission changes at 423 nm and 510 nm stabilize within 10 min.
Biosensors 15 00174 g001
Figure 2. M1 (10 μM) is incubated with a series of potential interferents, including F, Cl, Br, I, HSO3, HSO4, IO3, OAc, NO2, HPO4, ascorbic acid, GSH, and Cys (40 μM) to evaluate its selectivity for H2S. The reactions are conducted in a 1:1 (v/v) mixture of MeCN/H2O at room temperature, and spectra are recorded after 20 min of incubation. (A) Absorption spectra of M1 in the presence of various species. (B) Fluorescence spectra of M1 in the presence of various species (λex = 365 nm). Blue lines represent the spectra of M1 in the presence of H2S, while the gray lines correspond to the spectra of free M1 and its interactions with F, Cl, Br, I, HSO3, HSO4, IO3, OAc, NO2, HPO4, ascorbic acid, GSH, and Cys.
Biosensors 15 00174 g002
Figure 3. The pH-dependent H2S sensing of M1 (10 μM) is evaluated in 1:1 MeCN/buffer (pH 1–12) with 40 μM H2S: (A) Fluorescence emission changes in M1 at 423 nm are monitored in the presence and absence of H2S (λex = 365 nm). (B) Fluorescence emission changes in M1 at 510 nm are recorded with and without H2S (λex = 365 nm).
Biosensors 15 00174 g003
Scheme 2. (A) Two proposed reaction mechanisms for the nucleophilic substitution employed by M1 for detecting H2S. Theoretically, H2S can attack dinitrobenzene moiety (a) or naphthalene ring (b) to complete the substitution reaction. The 1H NMR titration data supported mechanism (a). (B) The 1H NMR titration for M1 with the addition of NaHS in DMSO-d6/H2O.
Biosensors 15 00174 sch002
Figure 4. Apply M1 (10 μM) in MDA-MB-231 cells for cell imaging. NaHS (300 µM) is incubated with M1 for 45 min incubation at 37 °C. UV filter is used with an excitation at 365 nm.
Biosensors 15 00174 g004
Figure 5. M2 (10 μM) is incubated with NaHS (0–40 μM) in a 1:1 (v/v) mixture of MeCN/H2O at room temperature. Spectra are recorded after 20 min of incubation. (A) Absorption spectra of M2 in the presence of increasing concentrations of NaHS. (B) Fluorescence spectra of M2 in the presence of increasing concentrations of NaHS.
Biosensors 15 00174 g005
Table 1. The photophysical properties of M1 and M2 in different solvents.
M1M2
λabελemΦλabελemΦ
(nm)(M−1 cm−1)(nm) (nm)(M−1 cm−1)(nm)
DMSO35214,2204220.00736318,7204830.008
MeCN34519,4404230.02736123,2204780.010
Acetone34519,2604920.04235724,1804250.002
MeOH34821,1804310.02835911,8204360.037
THF34620,5204740.07735525,0204210.028
Disclaimer/Publisher’s Note: The statements, opinions and data contained in all publications are solely those of the individual author(s) and contributor(s) and not of MDPI and/or the editor(s). MDPI and/or the editor(s) disclaim responsibility for any injury to people or property resulting from any ideas, methods, instructions or products referred to in the content.

