Detection of IgG Antibodies Against COVID-19 N-Protein by Hybrid Graphene–Nanorod Sensor

 , ,
, ,  , and
, and
Abstract

1. Introduction
2. Materials and Methods
3. Results
Supplementary Materials
Author Contributions
Funding
Institutional Review Board Statement
Informed Consent Statement
Data Availability Statement
Conflicts of Interest
References
- Zhou, P.; Yang, X.-L.; Wang, X.-G.; Hu, B.; Zhang, L.; Zhang, W.; Si, H.-R.; Zhu, Y.; Li, B.; Huang, C.-L.; et al. A pneumonia outbreak associated with a new coronavirus of probable bat origin. Nature 2020, 579, 270–273. [Google Scholar] [CrossRef] [PubMed]
- World Health Organization. WHO Director-General’s Opening Remarks at the Media Briefing on COVID-19—11 March 2020. 2020. Available online: https://www.who.int/director-general/speeches/detail/who-director-general-s-opening-remarks-at-the-media-briefing-on-covid-19---11-march-2020 (accessed on 20 January 2024).
- Centers for Disease Control and Prevention (CDC/USA). Symptoms of COVID-19. 2022. Available online: https://www.cdc.gov/covid/signs-symptoms/?CDC_AAref_Val=https://www.cdc.gov/coronavirus/2019-ncov/symptoms-testing/symptoms (accessed on 23 January 2024).
- Centers for Disease Control and Prevention (CDC/USA). Infection Control Guidance: SARS-CoV-2. 2024. Available online: https://www.cdc.gov/covid/hcp/infection-control/?CDC_AAref_Val=https://www.cdc.gov/coronavirus/2019-ncov/hcp/infection-control-recommendations.html (accessed on 30 January 2024).
- Kumar, S.; Nyodu, R.; Maurya, V.K.; Saxena, S.K. Morphology, Genome Organization, Replication, and Pathogenesis of Severe Acute Respiratory Syndrome Coronavirus 2 (SARS-CoV-2). In Medical Virology: From Pathogenesis to Disease Control; Springer: Singapore, 2020. [Google Scholar] [CrossRef]
- Maghsood, F.; Ghorbani, A.; Yadegari, H.; Golsaz-Shirazi, F.; Amiri, M.M.; Shokri, F. SARS-CoV-2 nucleocapsid: Biological functions and implication for disease diagnosis and vaccine design. Rev. Med. Virol. 2023, 33, e2431. [Google Scholar] [CrossRef]
- Alvim, R.G.; Lima, T.M.; Rodrigues, D.A.; Marsili, F.F.; Bozza, V.B.; Higa, L.M.; Monteiro, F.L.; Abreu, D.P.; Leitão, I.C.; Carvalho, R.S.; et al. From a recombinant key antigen to an accurate, affordable serological test: Lessons learnt from COVID-19 for future pandemics. Biochem. Eng. J. 2022, 186, 108537. [Google Scholar] [CrossRef] [PubMed]
- Caddy, S.L.; Vaysburd, M.; Papa, G.; Wing, M.; O’connell, K.; Stoycheva, D.; Foss, S.; Andersen, J.T.; Oxenius, A.; James, L.C. Viral nucleoprotein antibodies activate TRIM21 and induce T cell immunity. EMBO J. 2021, 40, e106228. [Google Scholar] [CrossRef]
- Okba, N.M.A.; Müller, M.A.; Li, W.; Wang, C.; GeurtsvanKessel, C.H.; Corman, V.M.; Lamers, M.M.; Sikkema, R.S.; De Bruin, E.; Chandler, F.D.; et al. Severe Acute Respiratory Syndrome Coronavirus 2−Specific Antibody Responses in Coronavirus Disease Patients. Emerg. Infect. Dis. 2020, 26, 1478–1488. [Google Scholar] [CrossRef]
- Perera, R.A.; Mok, C.K.; Tsang, O.T.; Lv, H.; Ko, R.L.; Wu, N.C.; Yuan, M.; Leung, W.S.; MC Chan, J.; Chik, T.S.; et al. Serological assays for severe acute respiratory syndrome coronavirus 2 (SARS-CoV-2), March 2020. Euro Surveill. 2020, 25, 2000421. [Google Scholar] [CrossRef]
- Ludolf, F.; Ramos, F.F.; Bagno, F.F.; Oliveira-Da-Silva, J.A.; Reis, T.A.R.; Christodoulides, M.; Vassallo, P.F.; Ravetti, C.G.; Nobre, V.; da Fonseca, F.G.; et al. Detecting anti–SARS-CoV-2 antibodies in urine samples: A noninvasive and sensitive way to assay COVID-19 immune conversion. Sci. Adv. 2022, 8, eabn7424. [Google Scholar] [CrossRef] [PubMed]
- Bagno, F.F.; Sérgio, S.A.; Figueiredo, M.M.; Godoi, L.C.; Andrade, L.A.; Salazar, N.C.; Soares, C.P.; Aguiar, A.; Almeida, F.J.; da Silva, E.D.; et al. Development and validation of an enzyme-linked immunoassay kit for diagnosis and surveillance of COVID-19. J. Clin. Virol. Plus 2022, 2, 100101. [Google Scholar] [CrossRef]
- Sakamoto, S.; Putalun, W.; Vimolmangkang, S.; Phoolcharoen, W.; Shoyama, Y.; Tanaka, H.; Morimoto, S. Enzyme-linked immunosorbent assay for the quantitative/qualitative analysis of plant secondary metabolites. J. Nat. Med. 2018, 72, 32–42. [Google Scholar] [CrossRef]
- Human SARS-CoV-2 Spike (Trimer) IgG ELISA Kit. ThermoFisher Scientific. Available online: https://www.thermofisher.com/elisa/product/Human-SARS-CoV-2-Spike-Trimer-IgG-ELISA-Kit/BMS2325 (accessed on 13 January 2024).
- Ang, G.; Chan, K.; Yean, C.; Yu, C. Lateral Flow Immunoassays for SARS-CoV-2. Diagnostics 2022, 12, 2854. [Google Scholar] [CrossRef]
- Li, Z.; Yi, Y.; Luo, X.; Xiong, N.; Liu, Y.; Li, S.; Sun, R.; Wang, Y.; Hu, B.; Chen, W.; et al. Development and clinical application of a rapid IgM-IgG combined antibody test for SARS-CoV-2 infection diagnosis. J. Med. Virol. 2020, 92, 1518–1524. [Google Scholar] [CrossRef] [PubMed]
- Geim, A.K.; Novoselov, K.S. The rise of graphene. Nat. Mater. 2007, 6, 183–191. [Google Scholar] [CrossRef] [PubMed]
- Abergel, D.S.L.; Apalkov, V.; Berashevich, J.; Ziegler, K.; Chakraborty, T. Properties of graphene: A theoretical perspective. Adv. Phys. 2010, 59, 261–482. [Google Scholar] [CrossRef]
- Lee, C.; Wei, X.; Kysar, J.W.; Hone, J. Measurement of the Elastic Properties and Intrinsic Strength of Monolayer Graphene. Science 2008, 321, 385–388. [Google Scholar] [CrossRef]
- Béraud, A.; Sauvage, M.; Bazán, C.M.; Tie, M.; Bencherif, A.; Bouilly, D. Graphene field-effect transistors as bioanalytical sensors: Design, operation and performance. Analyst 2021, 146, 403–428. [Google Scholar] [CrossRef] [PubMed]
- Halder, A.; Zhang, M.; Chi, Q. Electroactive and biocompatible functionalization of graphene for the development of biosensing platforms. Biosens. Bioelectron. 2017, 87, 764–771. [Google Scholar] [CrossRef]
- Matsumoto, K.; Maehashi, K.; Ohno, Y.; Inoue, K. Recent advances in functional graphene biosensors. J. Phys. D Appl. Phys. 2014, 47, 094005. [Google Scholar] [CrossRef]
- Bai, S.; Shen, X. Graphene–inorganic nanocomposites. RSC Adv. 2012, 2, 64–98. [Google Scholar] [CrossRef]
- Turcheniuk, K.; Boukherroub, R.; Szunerits, S. Gold–graphene nanocomposites for sensing and biomedical applications. J. Mater. Chem. B 2015, 3, 4301–4324. [Google Scholar] [CrossRef]
- Mao, S.; Lu, G.; Yu, K.; Bo, Z.; Chen, J. Specific Protein Detection Using Thermally Reduced Graphene Oxide Sheet Decorated with Gold Nanoparticle-Antibody Conjugates. Adv. Mater. 2010, 22, 3521–3526. [Google Scholar] [CrossRef]
- Abraham, S.; Nirala, N.R.; Pandey, S.; Srivastava, M.; Srivastava, S.; Walkenfort, B.; Srivastava, A. Functional graphene–gold nanoparticle hybrid system for enhanced electrochemical biosensing of free cholesterol. Anal. Methods 2015, 7, 3993–4002. [Google Scholar] [CrossRef]
- Cai, B.; Wang, S.; Huang, L.; Ning, Y.; Zhang, Z.; Zhang, G.-J. Ultrasensitive Label-Free Detection of PNA–DNA Hybridization by Reduced Graphene Oxide Field-Effect Transistor Biosensor. ACS Nano 2014, 8, 2632–2638. [Google Scholar] [CrossRef] [PubMed]
- Lerner, M.B.; Matsunaga, F.; Han, G.H.; Hong, S.J.; Xi, J.; Crook, A.; Perez-Aguilar, J.M.; Park, Y.W.; Saven, J.G.; Liu, R.; et al. Scalable Production of Highly Sensitive Nanosensors Based on Graphene Functionalized with a Designed G Protein-Coupled Receptor. Nano Lett. 2014, 14, 2709–2714. [Google Scholar] [CrossRef] [PubMed]
- Dong, X.; Shi, Y.; Huang, W.; Chen, P.; Li, L. Electrical Detection of DNA Hybridization with Single-Base Specificity Using Transistors Based on CVD-Grown Graphene Sheets. Adv. Mater. 2010, 22, 1649–1653. [Google Scholar] [CrossRef]
- Ambrosi, A.; Chua, C.K.; Bonanni, A.; Pumera, M. Electrochemistry of Graphene and Related Materials. Chem. Rev. 2014, 114, 7150–7188. [Google Scholar] [CrossRef]
- Szunerits, S.; Maalouli, N.; Wijaya, E.; Vilcot, J.-P.; Boukherroub, R. Recent advances in the development of graphene-based surface plasmon resonance (SPR) interfaces. Anal. Bioanal. Chem. 2013, 405, 1435–1443. [Google Scholar] [CrossRef]
- Gil, B.; Keshavarz, M.; Wales, D.; Darzi, A.; Yeatman, E. Orthogonal Surface-Enhanced Raman Scattering/Field-Effect Transistor Detection of Breast and Colorectal Cancer-Derived Exosomes using Graphene as a Tag-Free Diagnostic Template. Adv. NanoBiomed. Res. 2023, 3, 2300055. [Google Scholar] [CrossRef]
- Viswanathan, S.; Narayanan, T.N.; Aran, K.; Fink, K.D.; Paredes, J.; Ajayan, P.M.; Filipek, S.; Miszta, P.; Tekin, H.C.; Inci, F.; et al. Graphene–protein field effect biosensors: Glucose sensing. Mater. Today 2015, 18, 513–522. [Google Scholar] [CrossRef]
- Szunerits, S.; Rodrigues, T.; Bagale, R.; Happy, H.; Boukherroub, R.; Knoll, W. Graphene-based field-effect transistors for biosensing: Where is the field heading to? Anal. Bioanal. Chem. 2023, 416, 2137–2150. [Google Scholar] [CrossRef]
- Cui, T.-R.; Qiao, Y.-C.; Gao, J.-W.; Wang, C.-H.; Zhang, Y.; Han, L.; Yang, Y.; Ren, T.-L. Ultrasensitive Detection of COVID-19 Causative Virus (SARS-CoV-2) Spike Protein Using Laser Induced Graphene Field-Effect Transistor. Molecules 2021, 26, 6947. [Google Scholar] [CrossRef]
- Shahdeo, D.; Chauhan, N.; Majumdar, A.; Ghosh, A.; Gandhi, S. Graphene-Based Field-Effect Transistor for Ultrasensitive Immunosensing of SARS-CoV-2 Spike S1 Antigen. ACS Appl. Bio Mater. 2022, 5, 3563–3572. [Google Scholar] [CrossRef] [PubMed]
- Silvestri, A.; Zayas-Arrabal, J.; Vera-Hidalgo, M.; Di Silvio, D.; Wetzl, C.; Martinez-Moro, M.; Zurutuza, A.; Torres, E.; Centeno, A.; Maestre, A.; et al. Ultrasensitive detection of SARS-CoV-2 spike protein by graphene field-effect transistors. Nanoscale 2023, 15, 1076–1085. [Google Scholar] [CrossRef] [PubMed]
- Park, I.; Lim, J.; You, S.; Hwang, M.T.; Kwon, J.; Koprowski, K.; Kim, S.; Heredia, J.; de Ramirez, S.A.S.; Valera, E.; et al. Detection of SARS-CoV-2 Virus Amplification Using a Crumpled Graphene Field-Effect Transistor Biosensor. ACS Sens. 2021, 6, 4461–4470. [Google Scholar] [CrossRef]
- Gao, J.; Wang, C.; Chu, Y.; Han, Y.; Gao, Y.; Wang, Y.; Wang, C.; Liu, H.; Han, L.; Zhang, Y. Graphene oxide-graphene Van der Waals heterostructure transistor biosensor for SARS-CoV-2 protein detection. Talanta 2022, 240, 123197. [Google Scholar] [CrossRef] [PubMed]
- Kim, S.; Ryu, H.; Tai, S.; Pedowitz, M.; Rzasa, J.R.; Pennachio, D.J.; Hajzus, J.R.; Milton, D.K.; Myers-Ward, R.; Daniels, K.M. Real-time ultra-sensitive detection of SARS-CoV-2 by quasi-freestanding epitaxial graphene-based biosensor. Biosens. Bioelectron. 2022, 197, 113803. [Google Scholar] [CrossRef]
- Seo, G.; Lee, G.; Kim, M.J.; Baek, S.-H.; Choi, M.; Ku, K.B.; Lee, C.-S.; Jun, S.; Park, D.; Kim, H.G.; et al. Rapid Detection of COVID-19 Causative Virus (SARS-CoV-2) in Human Nasopharyngeal Swab Specimens Using Field-Effect Transistor-Based Biosensor. ACS Nano 2020, 14, 5135–5142. [Google Scholar] [CrossRef]
- Kang, H.; Wang, X.; Guo, M.; Dai, C.; Chen, R.; Yang, L.; Wu, Y.; Ying, T.; Zhu, Z.; Wei, D.; et al. Ultrasensitive Detection of SARS-CoV-2 Antibody by Graphene Field-Effect Transistors. Nano Lett. 2021, 21, 7897–7904. [Google Scholar] [CrossRef]
- Liu, H.; Yang, A.; Song, J.; Wang, N.; Lam, P.; Li, Y.; Law, H.K.-W.; Yan, F. Ultrafast, sensitive, and portable detection of COVID-19 IgG using flexible organic electrochemical transistors. Sci. Adv. 2021, 7, eabg8387. [Google Scholar] [CrossRef]
- Mattioli, I.A.; Castro, K.R.; Macedo, L.J.; Sedenho, G.C.; Oliveira, M.N.; Todeschini, I.; Vitale, P.M.; Ferreira, S.C.; Manuli, E.R.; Pereira, G.M.; et al. Graphene-based hybrid electrical-electrochemical point-of-care device for serologic COVID-19 diagnosis. Biosens. Bioelectron. 2022, 199, 113866. [Google Scholar] [CrossRef]
- Torrente-Rodríguez, R.M.; Lukas, H.; Tu, J.; Min, J.; Yang, Y.; Xu, C.; Rossiter, H.B.; Gao, W. SARS-CoV-2 RapidPlex: A Graphene-Based Multiplexed Telemedicine Platform for Rapid and Low-Cost COVID-19 Diagnosis and Monitoring. Matter 2020, 3, 1981–1998. [Google Scholar] [CrossRef]
- Novodchuk, I.; Kayaharman, M.; Prassas, I.; Soosaipillai, A.; Karimi, R.; Goldthorpe, I.; Abdel-Rahman, E.; Sanderson, J.; Diamandis, E.; Bajcsy, M.; et al. Electronic field effect detection of SARS-CoV-2 N-protein before the onset of symptoms. Biosens. Bioelectron. 2022, 210, 114331. [Google Scholar] [CrossRef] [PubMed]
- Pereira, C.L.; Cadore, A.; Rezende, N.P.; Gadelha, A.; Soares, E.A.; Chacham, H.; Campos, L.C.; Lacerda, R.G. Reversible doping of graphene field effect transistors by molecular hydrogen: The role of the metal/graphene interface. 2D Mater. 2019, 6, 025037. [Google Scholar] [CrossRef]
- Alves, A.P.P.; Meireles, L.M.; Ferrari, G.A.; Cunha, T.H.R.; Paraense, M.O.; Campos, L.C.; Lacerda, R.G. Highly sensitive and reusable ion-sensor based on functionalized graphene. Appl. Phys. Lett. 2020, 117, 033105. [Google Scholar] [CrossRef]
- Silvestre, I.; de Morais, E.A.; Melo, A.O.; Campos, L.C.; Goncalves, A.-M.B.; Cadore, A.R.; Ferlauto, A.S.; Chacham, H.; Mazzoni, M.S.C.; Lacerda, R.G. Asymmetric Effect of Oxygen Adsorption on Electron and Hole Mobilities in Bilayer Graphene: Long- and Short-Range Scattering Mechanisms. ACS Nano 2013, 7, 6597–6604. [Google Scholar] [CrossRef]
- Yu, C.; Irudayaraj, J. Multiplex Biosensor Using Gold Nanorods. Anal. Chem. 2006, 79, 572–579. [Google Scholar] [CrossRef] [PubMed]
- Chu, C.-H.; Sarangadharan, I.; Regmi, A.; Chen, Y.-W.; Hsu, C.-P.; Chang, W.-H.; Lee, G.-Y.; Chyi, J.-I.; Chen, C.-C.; Shiesh, S.-C.; et al. Beyond the Debye length in high ionic strength solution: Direct protein detection with field-effect transistors (FETs) in human serum. Sci. Rep. 2017, 7, 5256. [Google Scholar] [CrossRef]
- Casiraghi, C.; Pisana, S.; Novoselov, K.S.; Geim, A.K.; Ferrari, A.C. Raman fingerprint of charged impurities in graphene. Appl. Phys. Lett. 2007, 91, 233108. [Google Scholar] [CrossRef]
- Das, A.; Pisana, S.; Chakraborty, B.; Piscanec, S.; Saha, S.K.; Waghmare, U.V.; Novoselov, K.S.; Krishnamurthy, H.R.; Geim, A.K.; Ferrari, A.C.; et al. Monitoring dopants by Raman scattering in an electrochemically top-gated graphene transistor. Nat. Nanotechnol. 2008, 3, 210–215. [Google Scholar] [CrossRef]
- Ferrari, A.C.; Meyer, J.C.; Scardaci, V.; Casiraghi, C.; Lazzeri, M.; Mauri, F.; Piscanec, S.; Jiang, D.; Novoselov, K.S.; Roth, S.; et al. Raman Spectrum of Graphene and Graphene Layers. Phys. Rev. Lett. 2006, 97, 187401. [Google Scholar] [CrossRef]
- Liu, H.; Liu, Y.; Zhu, D. Chemical doping of graphene. J. Mater. Chem. 2011, 21, 3335–3345. [Google Scholar] [CrossRef]
- Prado, M.C.; Nascimento, R.; Moura, L.G.; Matos, M.J.S.; Mazzoni, M.S.C.; Cancado, L.G.; Chacham, H.; Neves, B.R.A. Two-Dimensional Molecular Crystals of Phosphonic Acids on Graphene. ACS Nano 2011, 5, 394–398. [Google Scholar] [CrossRef] [PubMed]
- Lin, Y.; Liu, K.; Wang, C.; Li, L.; Liu, Y. Electrochemical Immunosensor for Detection of Epidermal Growth Factor Reaching Lower Detection Limit: Toward Oxidized Glutathione as a More Efficient Blocking Reagent for the Antibody Functionalized Silver Nanoparticles and Antigen Interaction. Anal. Chem. 2015, 87, 8047–8051. [Google Scholar] [CrossRef] [PubMed]
- Martín-Yerga, D.; Costa-García, A. Towards a blocking-free electrochemical immunosensing strategy for anti-transglutaminase antibodies using screen-printed electrodes. Bioelectrochemistry 2015, 105, 88–94. [Google Scholar] [CrossRef] [PubMed]


| Sample Name (This Work) | Sample Name (ELISA) | Results (This Work) [*] | Results (ELISA) [a.u.] | Classification (This Work) | Classification (ELISA) |
|---|---|---|---|---|---|
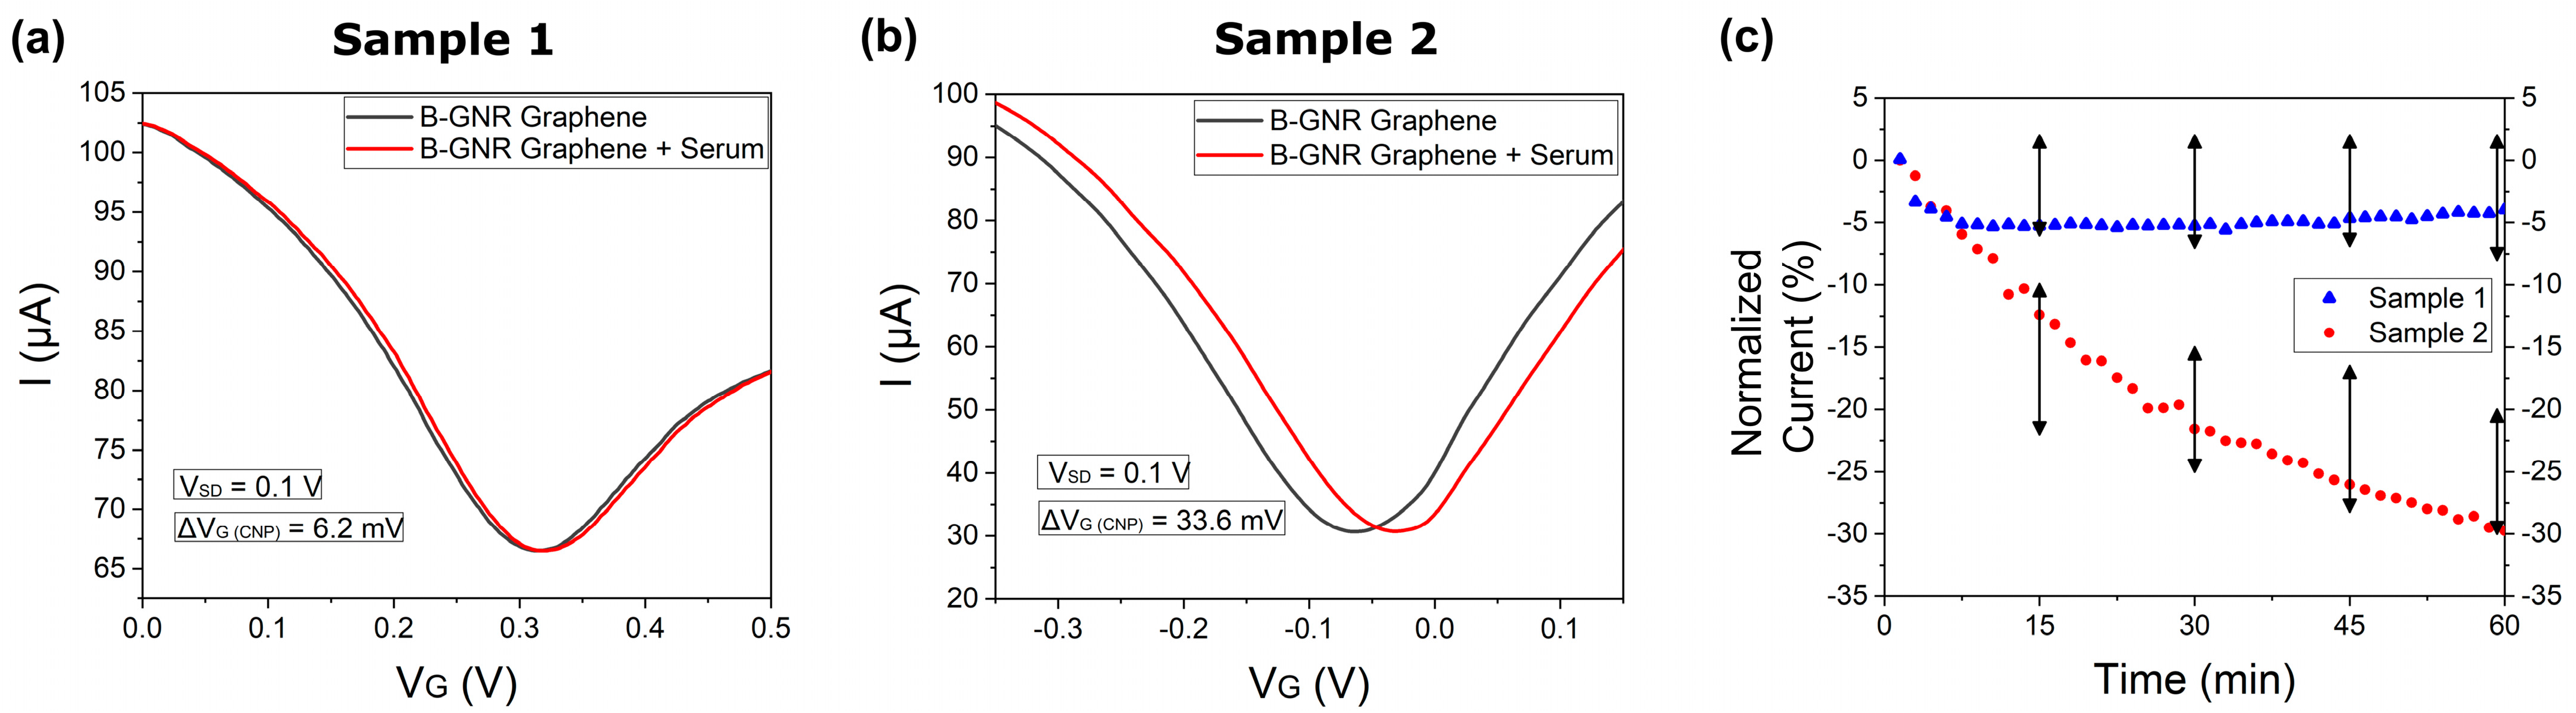
| 1 | SCT 14 | −3.7 | 0.4 | Negative | Negative |
| 2 | SPF 139 | −31.2 | 8.4 | Positive | Positive |
| 3 | SCT 18 | 2.1 | 0.2 | Negative | Negative |
| 4 | SPF 214 | −26.5 | 1.5 | Positive | Positive |
| 5 | SCT 12 | −22.2 | 0.5 | Positive | Negative |
| 6 | SPF 070 | −25.3 | 5.4 | Positive | Positive |
| 7 | SCT 13 | −6.7 | 0.3 | Negative | Negative |
| 8 | SPF 220 | −28.4 | 7.4 | Positive | Positive |
| 9 | SCT 11 | −3.4 | 0.4 | Negative | Negative |
| 10 | SPF 179 | −28.7 | 6.1 | Positive | Positive |
Disclaimer/Publisher’s Note: The statements, opinions and data contained in all publications are solely those of the individual author(s) and contributor(s) and not of MDPI and/or the editor(s). MDPI and/or the editor(s) disclaim responsibility for any injury to people or property resulting from any ideas, methods, instructions or products referred to in the content. |
© 2025 by the authors. Licensee MDPI, Basel, Switzerland. This article is an open access article distributed under the terms and conditions of the Creative Commons Attribution (CC BY) license (https://creativecommons.org/licenses/by/4.0/).
Share and Cite
Boaventura, R.V.A.; Pereira, C.L.; Junqueira, C.; Gonçalves, K.B.; Rezende, N.P.; Borges, I.A.; Barcelos, R.C.; Oréfice, F.B.; Bagno, F.F.; Fonseca, F.G.; et al. Detection of IgG Antibodies Against COVID-19 N-Protein by Hybrid Graphene–Nanorod Sensor. Biosensors 2025, 15, 164. https://doi.org/10.3390/bios15030164
Boaventura RVA, Pereira CL, Junqueira C, Gonçalves KB, Rezende NP, Borges IA, Barcelos RC, Oréfice FB, Bagno FF, Fonseca FG, et al. Detection of IgG Antibodies Against COVID-19 N-Protein by Hybrid Graphene–Nanorod Sensor. Biosensors. 2025; 15(3):164. https://doi.org/10.3390/bios15030164
Chicago/Turabian StyleBoaventura, R. V. A., C. L. Pereira, C. Junqueira, K. B. Gonçalves, N. P. Rezende, I. A. Borges, R. C. Barcelos, F. B. Oréfice, F. F. Bagno, F. G. Fonseca, and et al. 2025. "Detection of IgG Antibodies Against COVID-19 N-Protein by Hybrid Graphene–Nanorod Sensor" Biosensors 15, no. 3: 164. https://doi.org/10.3390/bios15030164
APA StyleBoaventura, R. V. A., Pereira, C. L., Junqueira, C., Gonçalves, K. B., Rezende, N. P., Borges, I. A., Barcelos, R. C., Oréfice, F. B., Bagno, F. F., Fonseca, F. G., Corrêa, A., Jr., Gomes, L. S., & Lacerda, R. G. (2025). Detection of IgG Antibodies Against COVID-19 N-Protein by Hybrid Graphene–Nanorod Sensor. Biosensors, 15(3), 164. https://doi.org/10.3390/bios15030164