Molecular Rapid Test for Identification of Tuna Species


 ,
,  and
and
Abstract
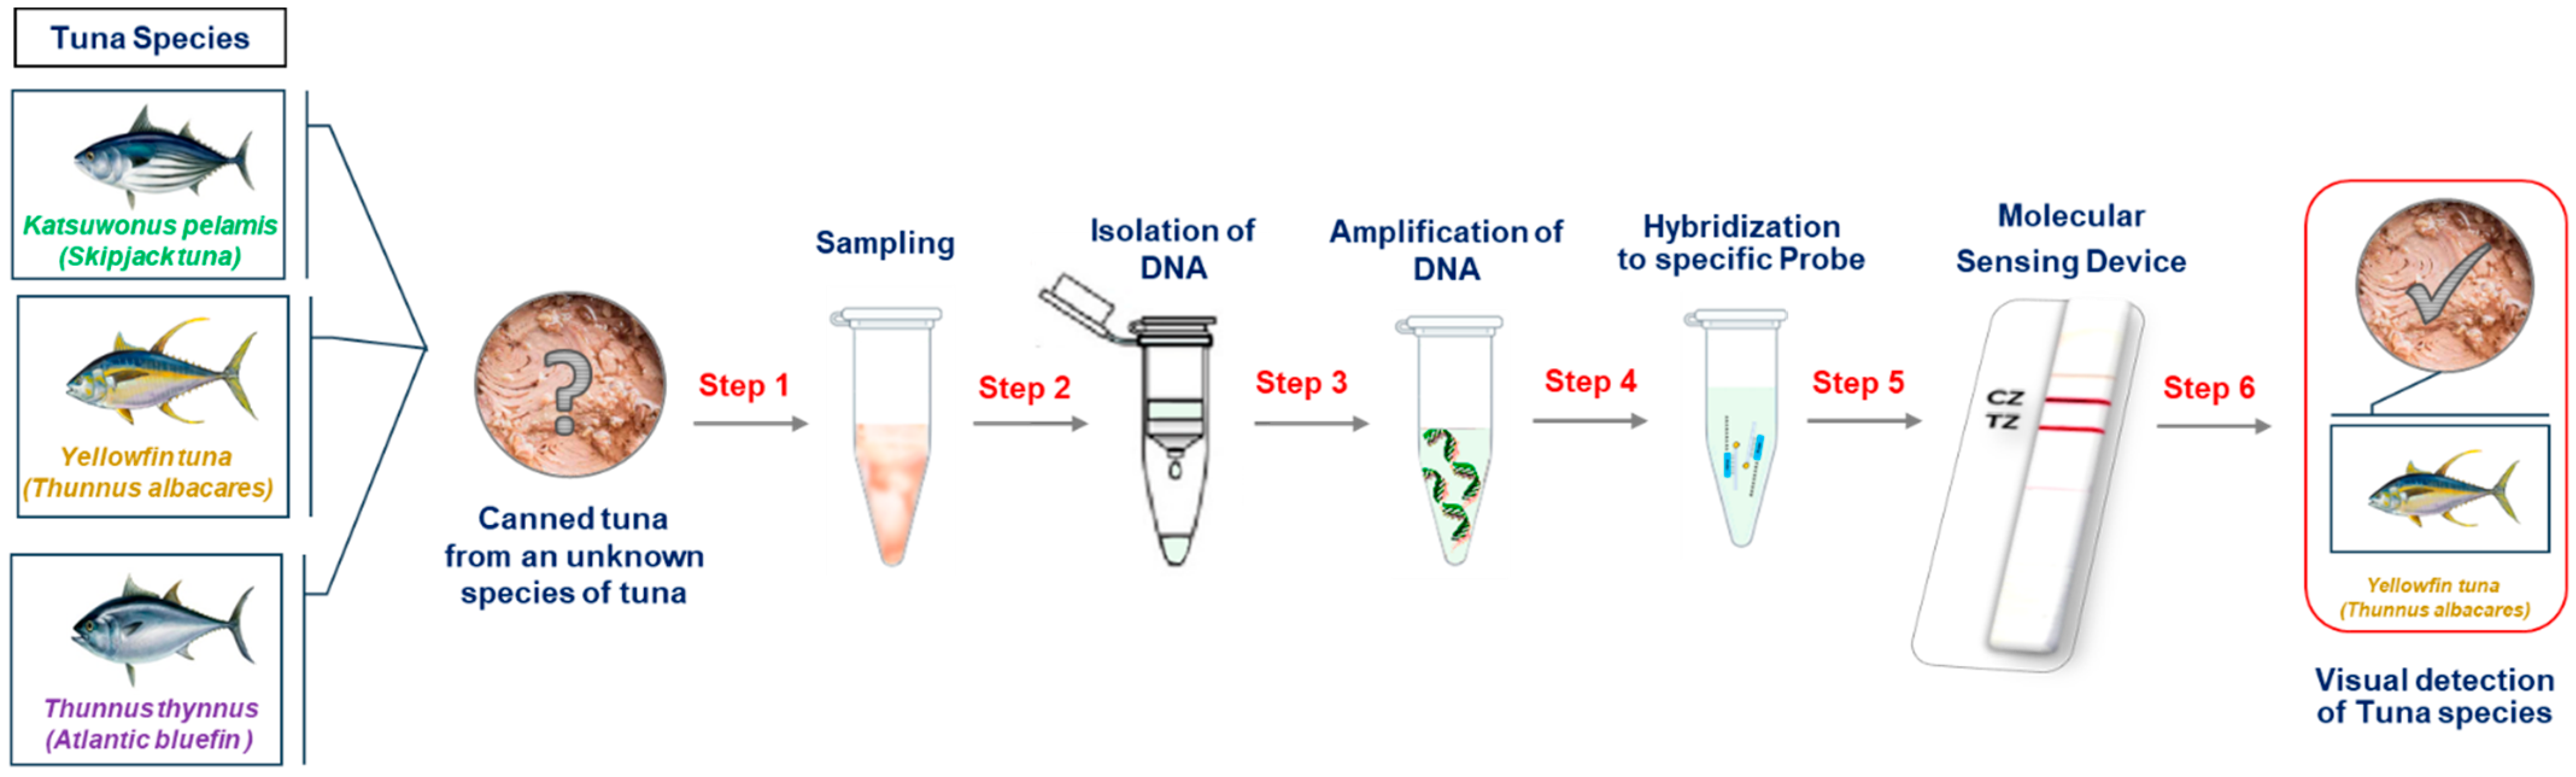
1. Introduction
2. Experimental Section
2.1. Materials
2.2. Apparatus
2.3. Fish Samples
2.4. Preparation of PolydA-Probe and PolydT-dT30 Probe: Tailing Reaction
2.5. Statistical Methods
3. Results and Discussion
3.1. Optimization Studies
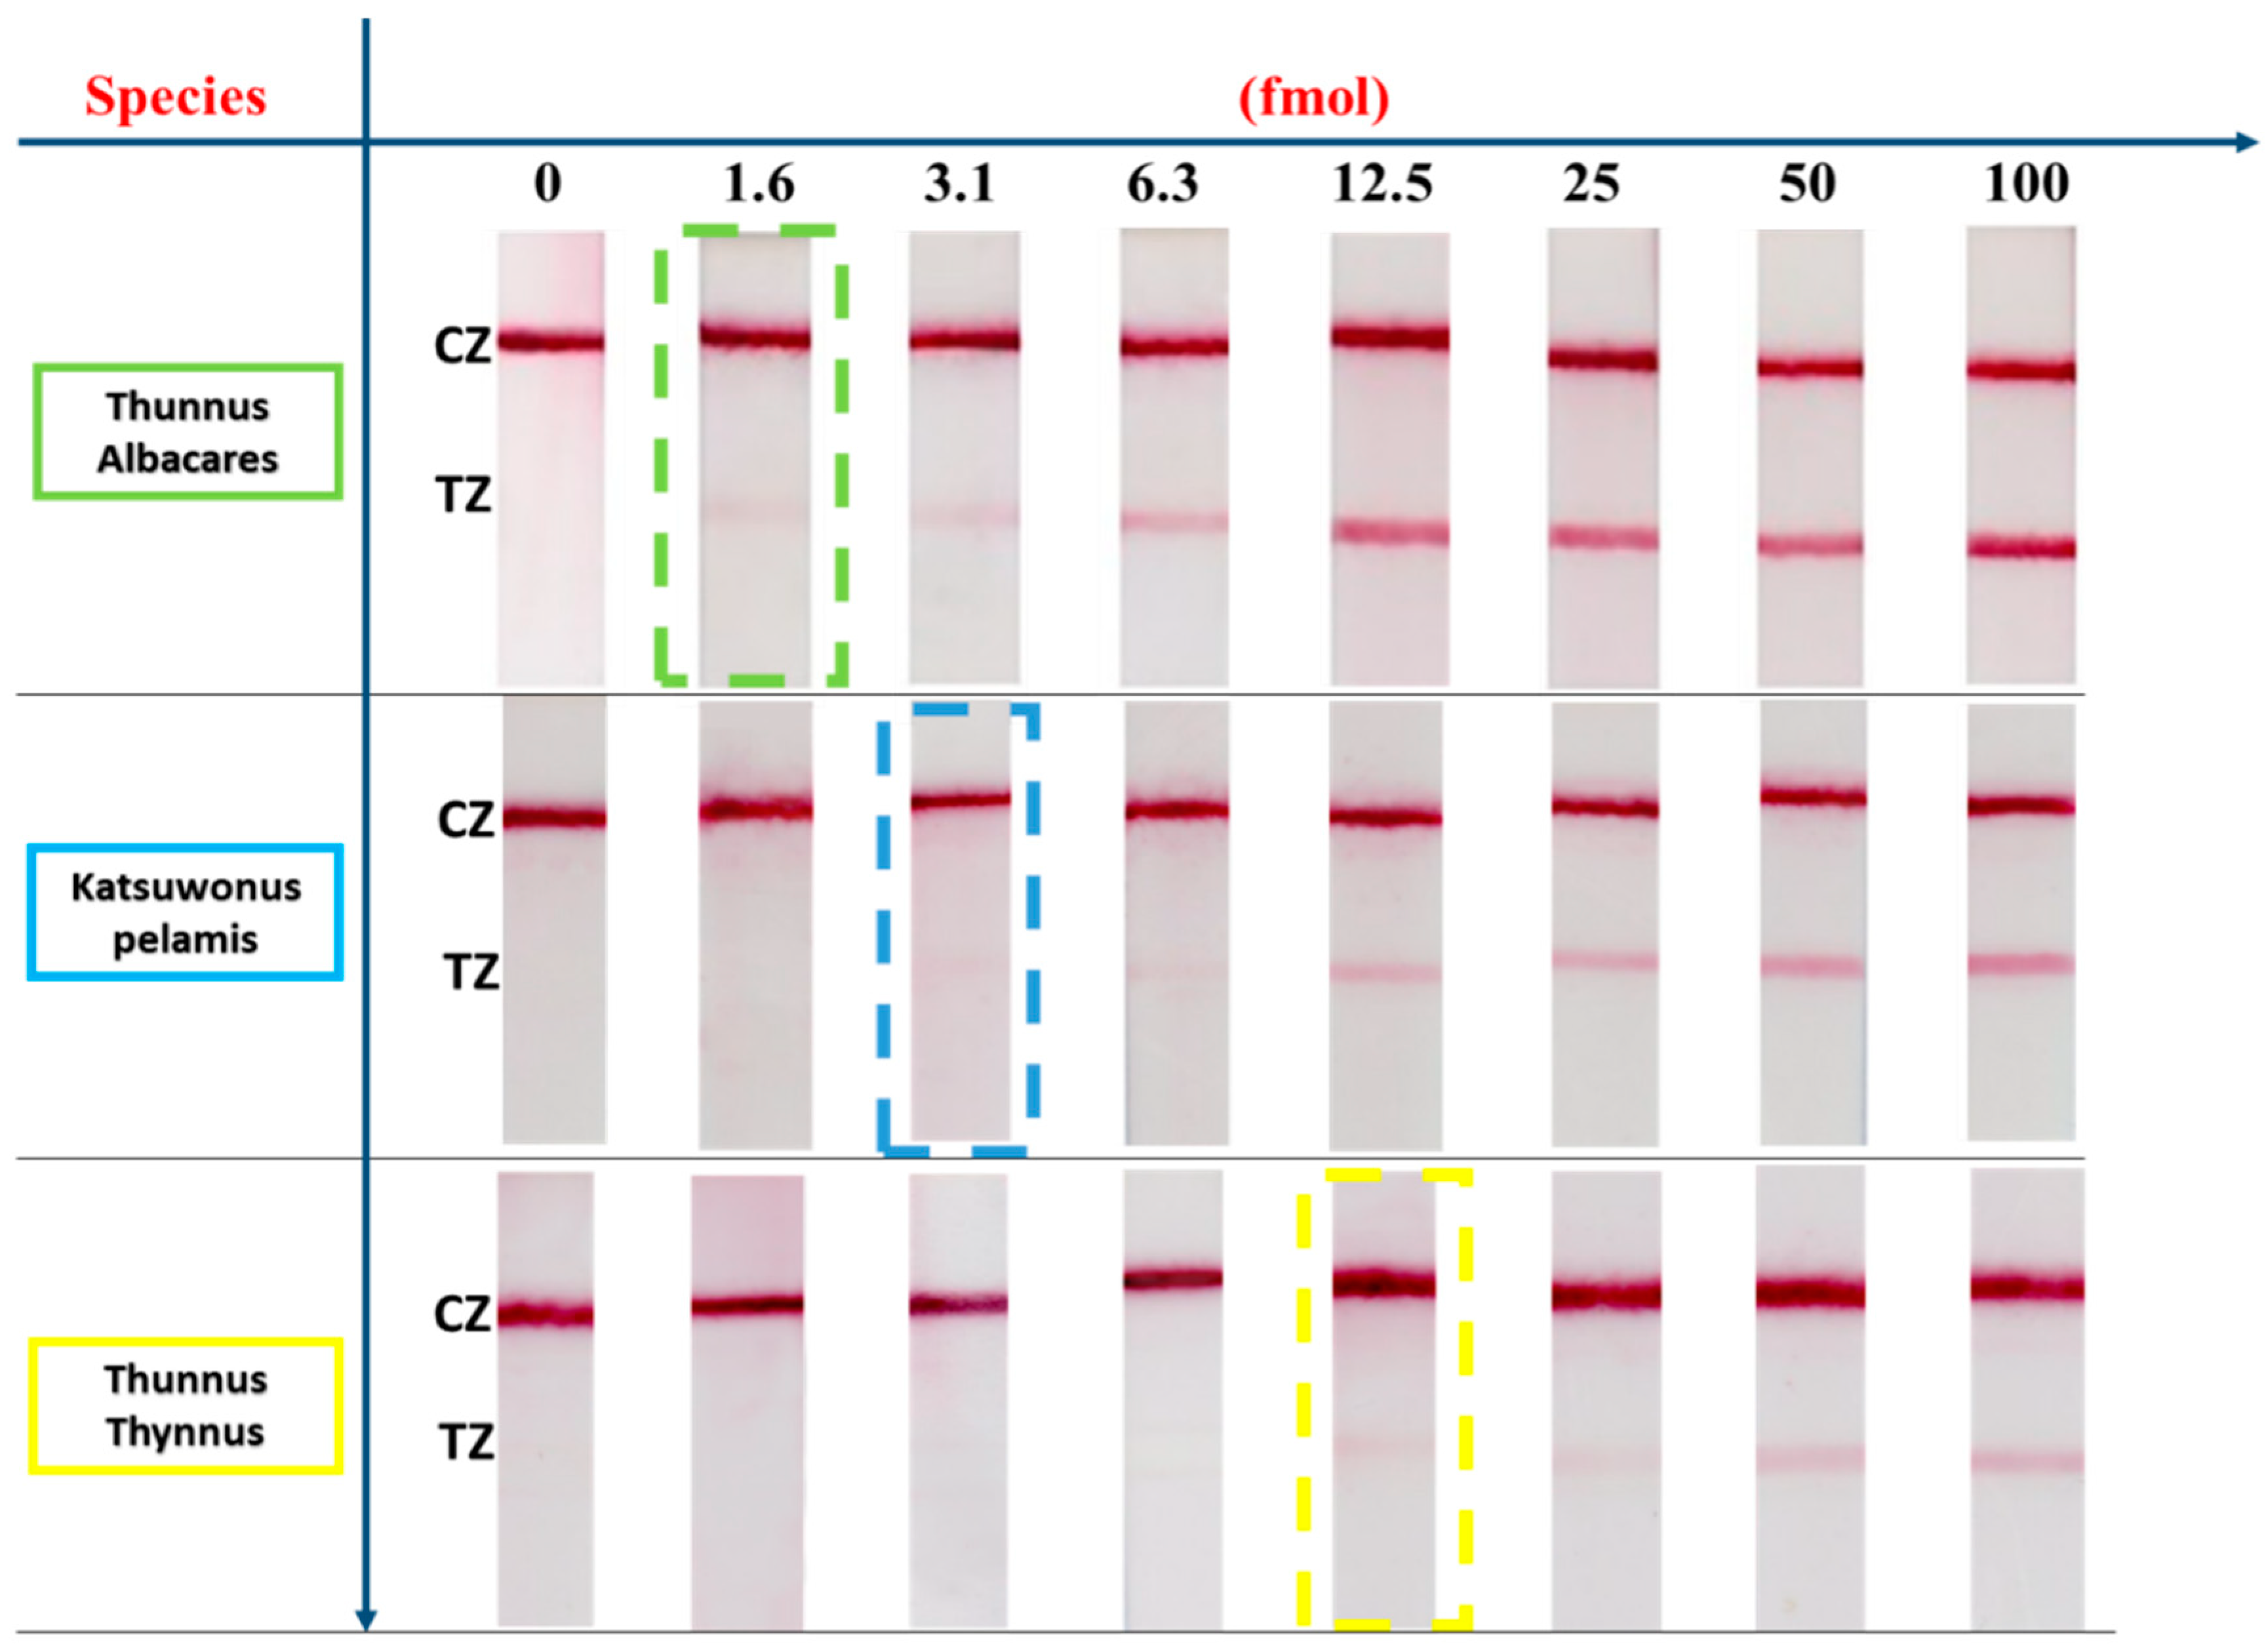
3.2. Effect of the Amount of Amplification Product on the Visual Signal
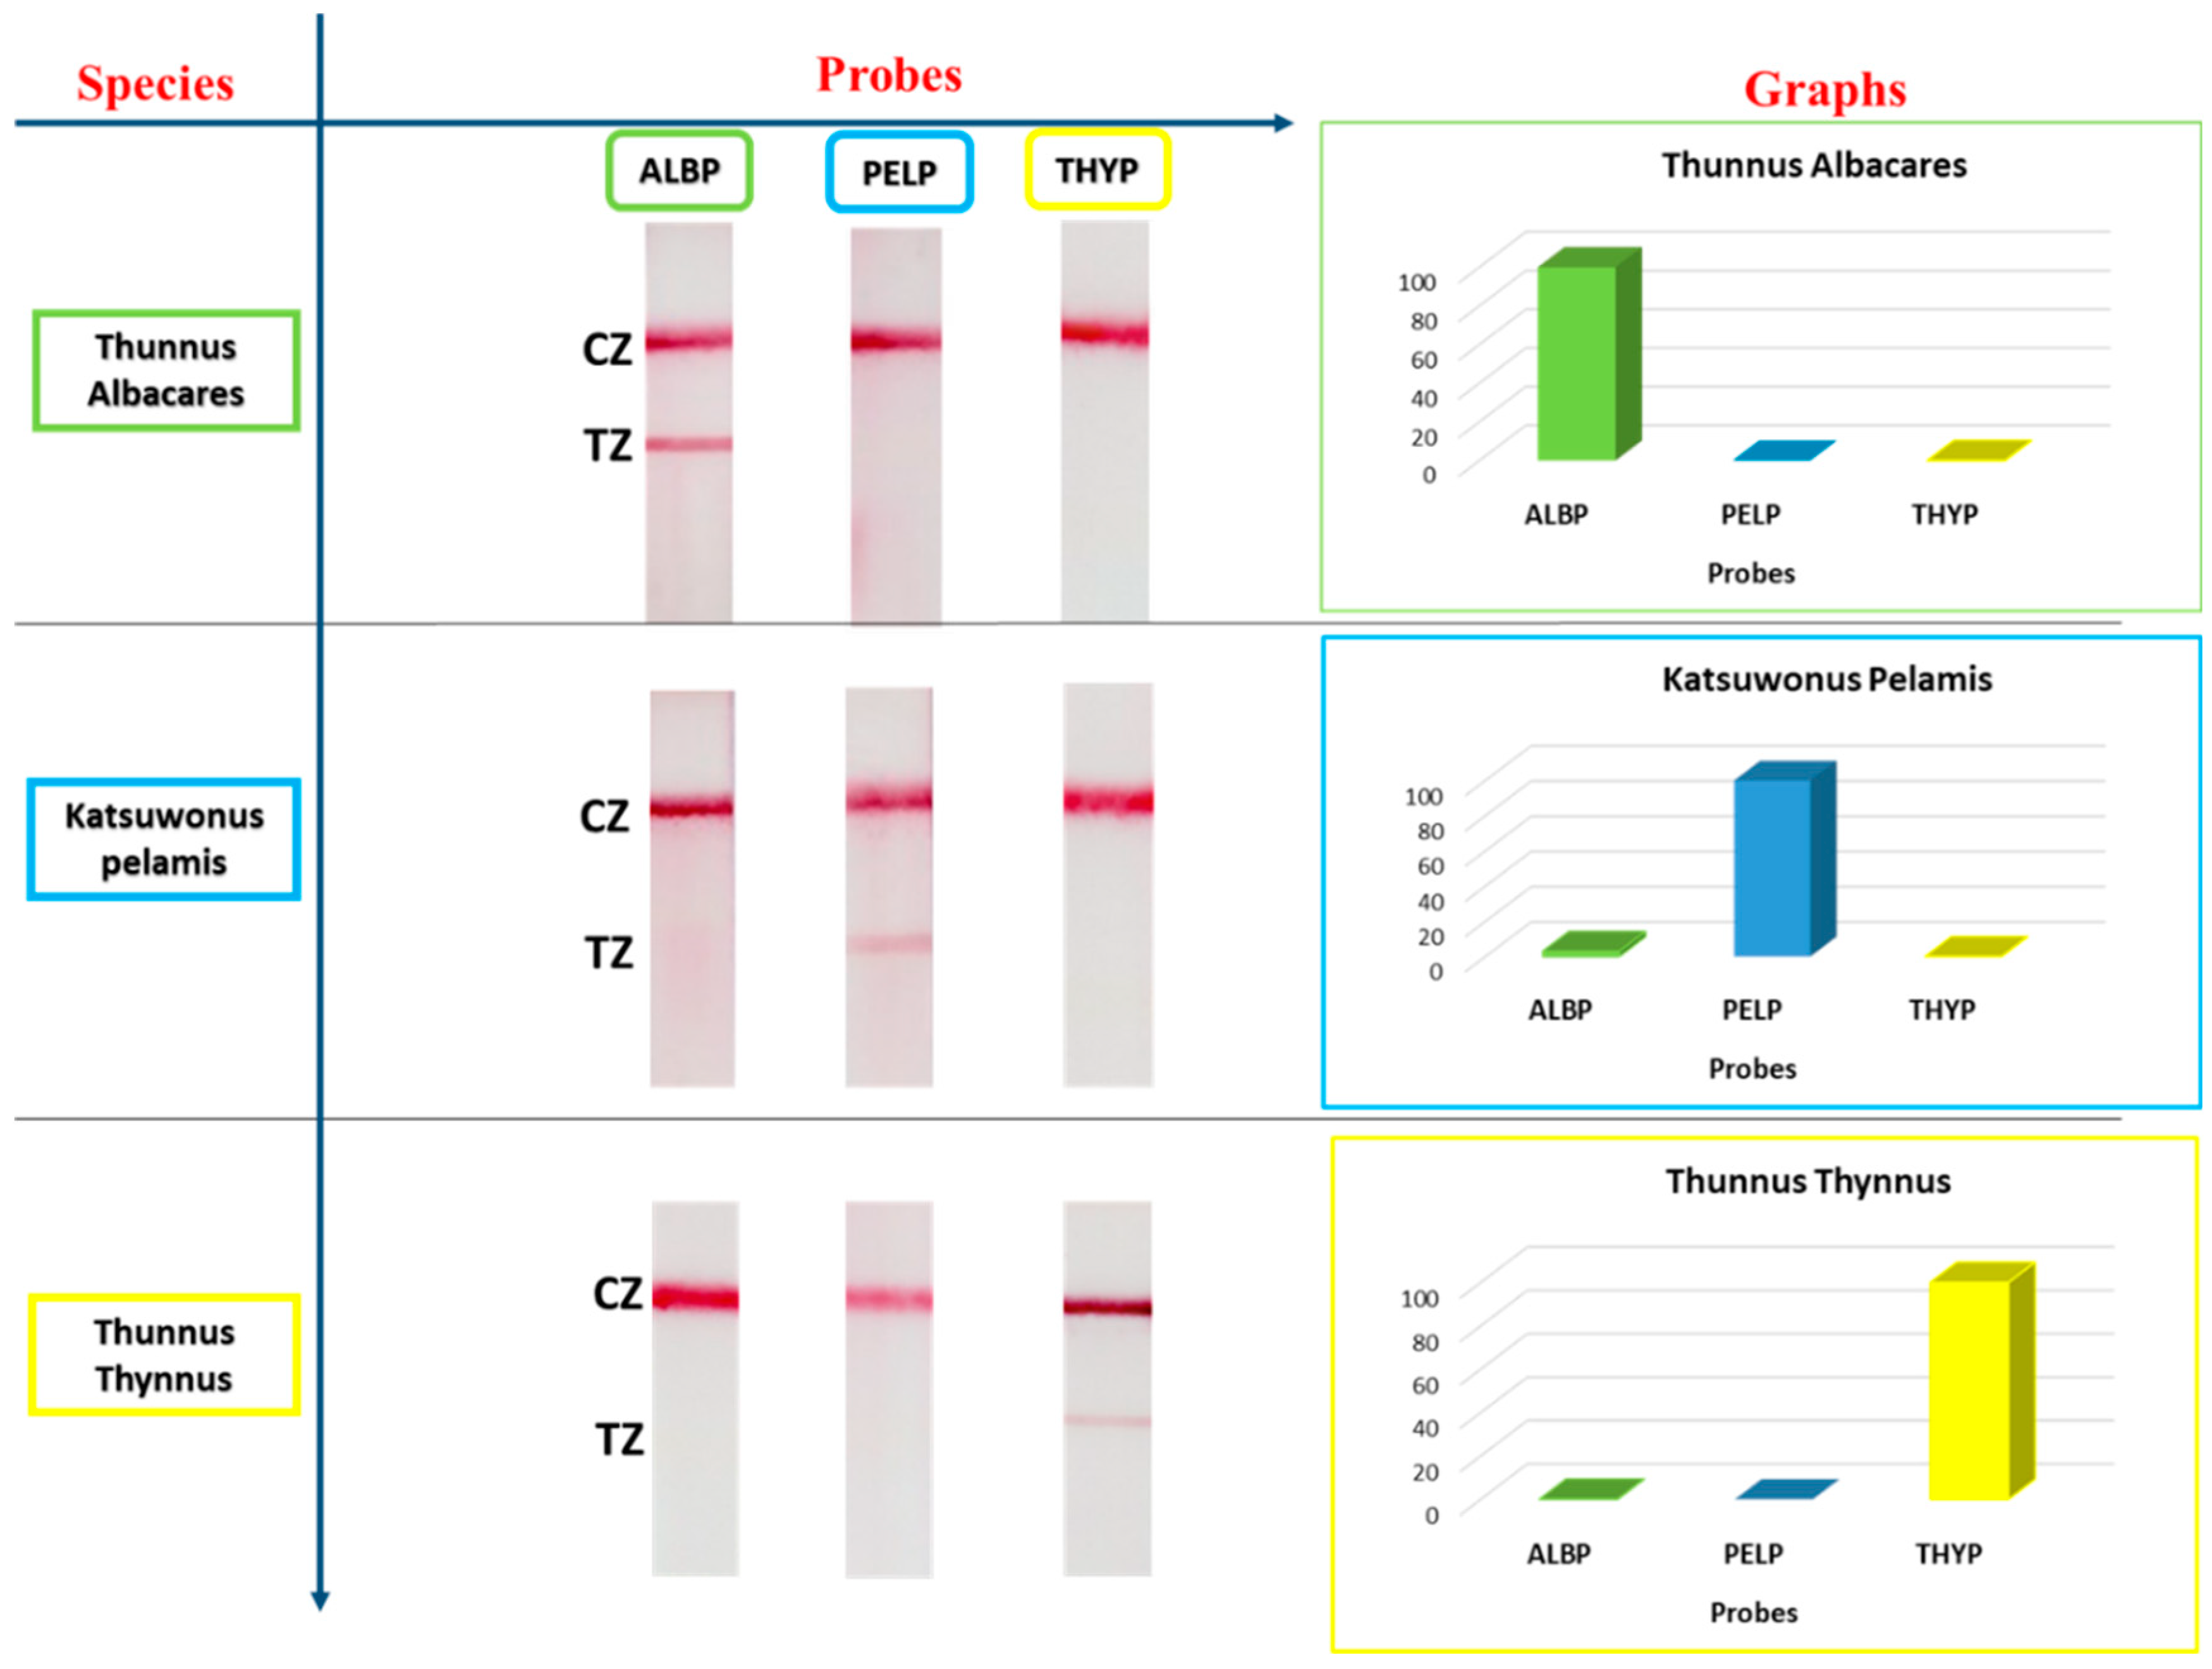
3.3. Specificity
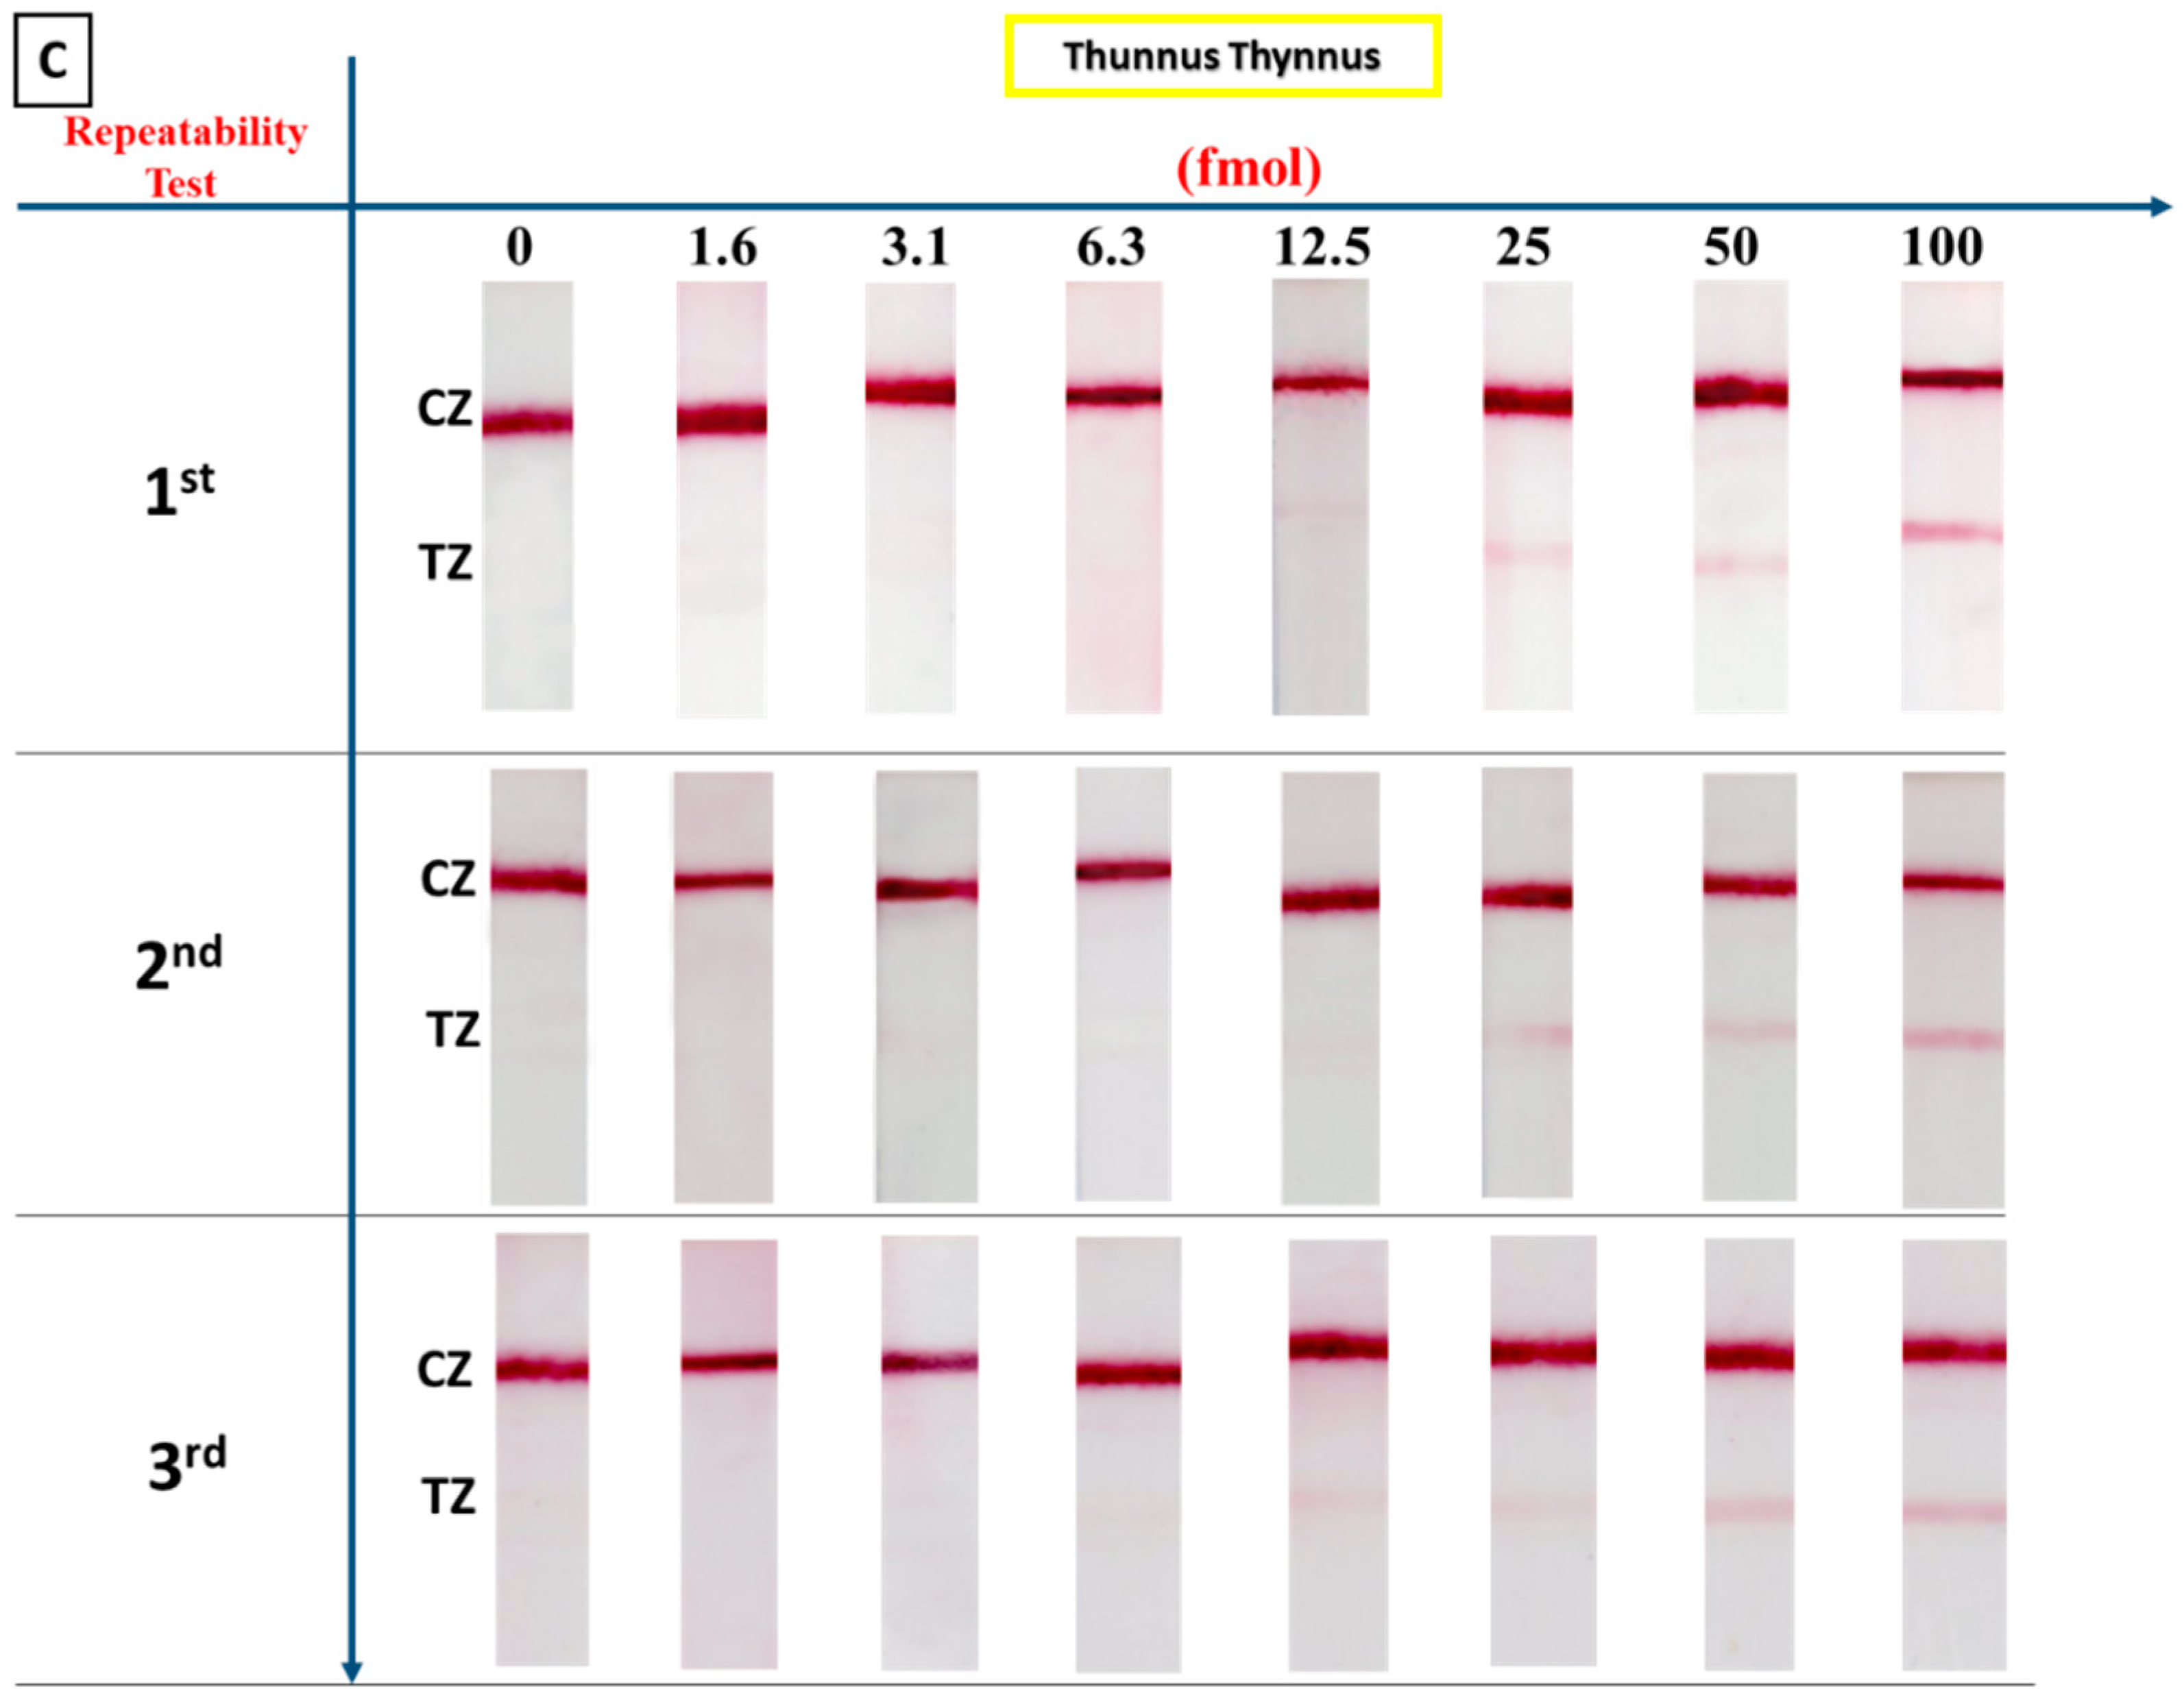
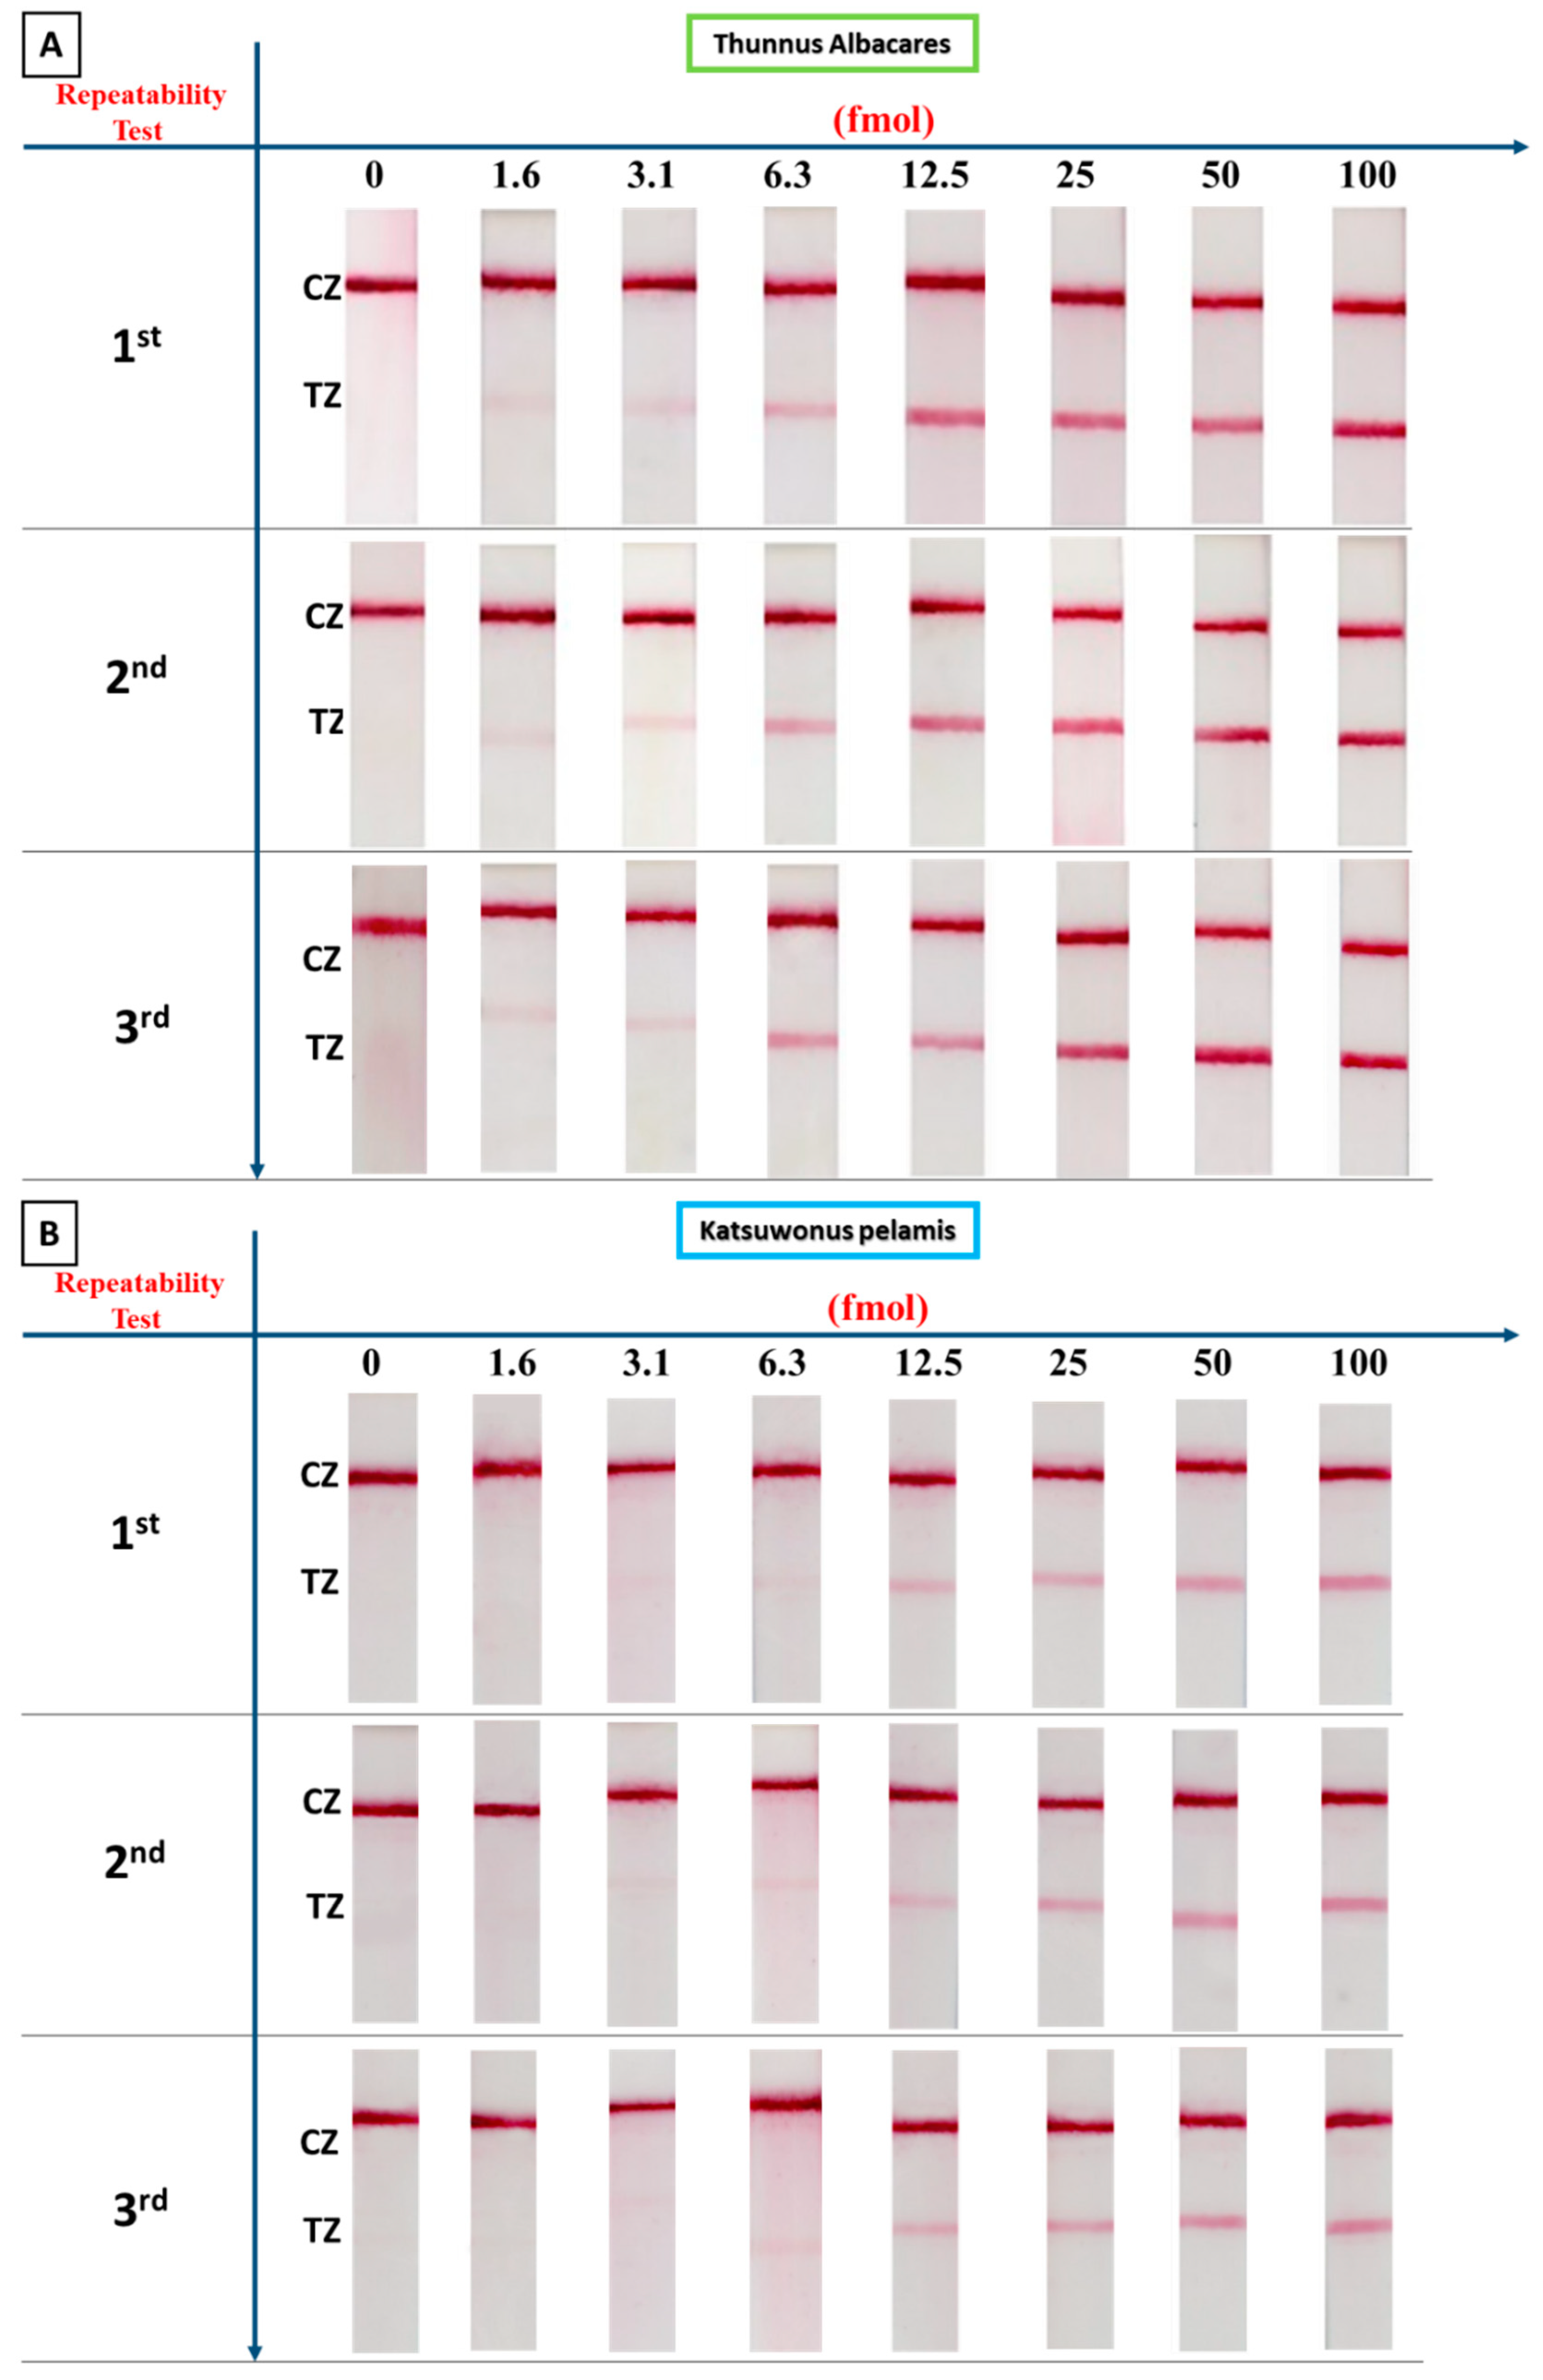
3.4. Precision
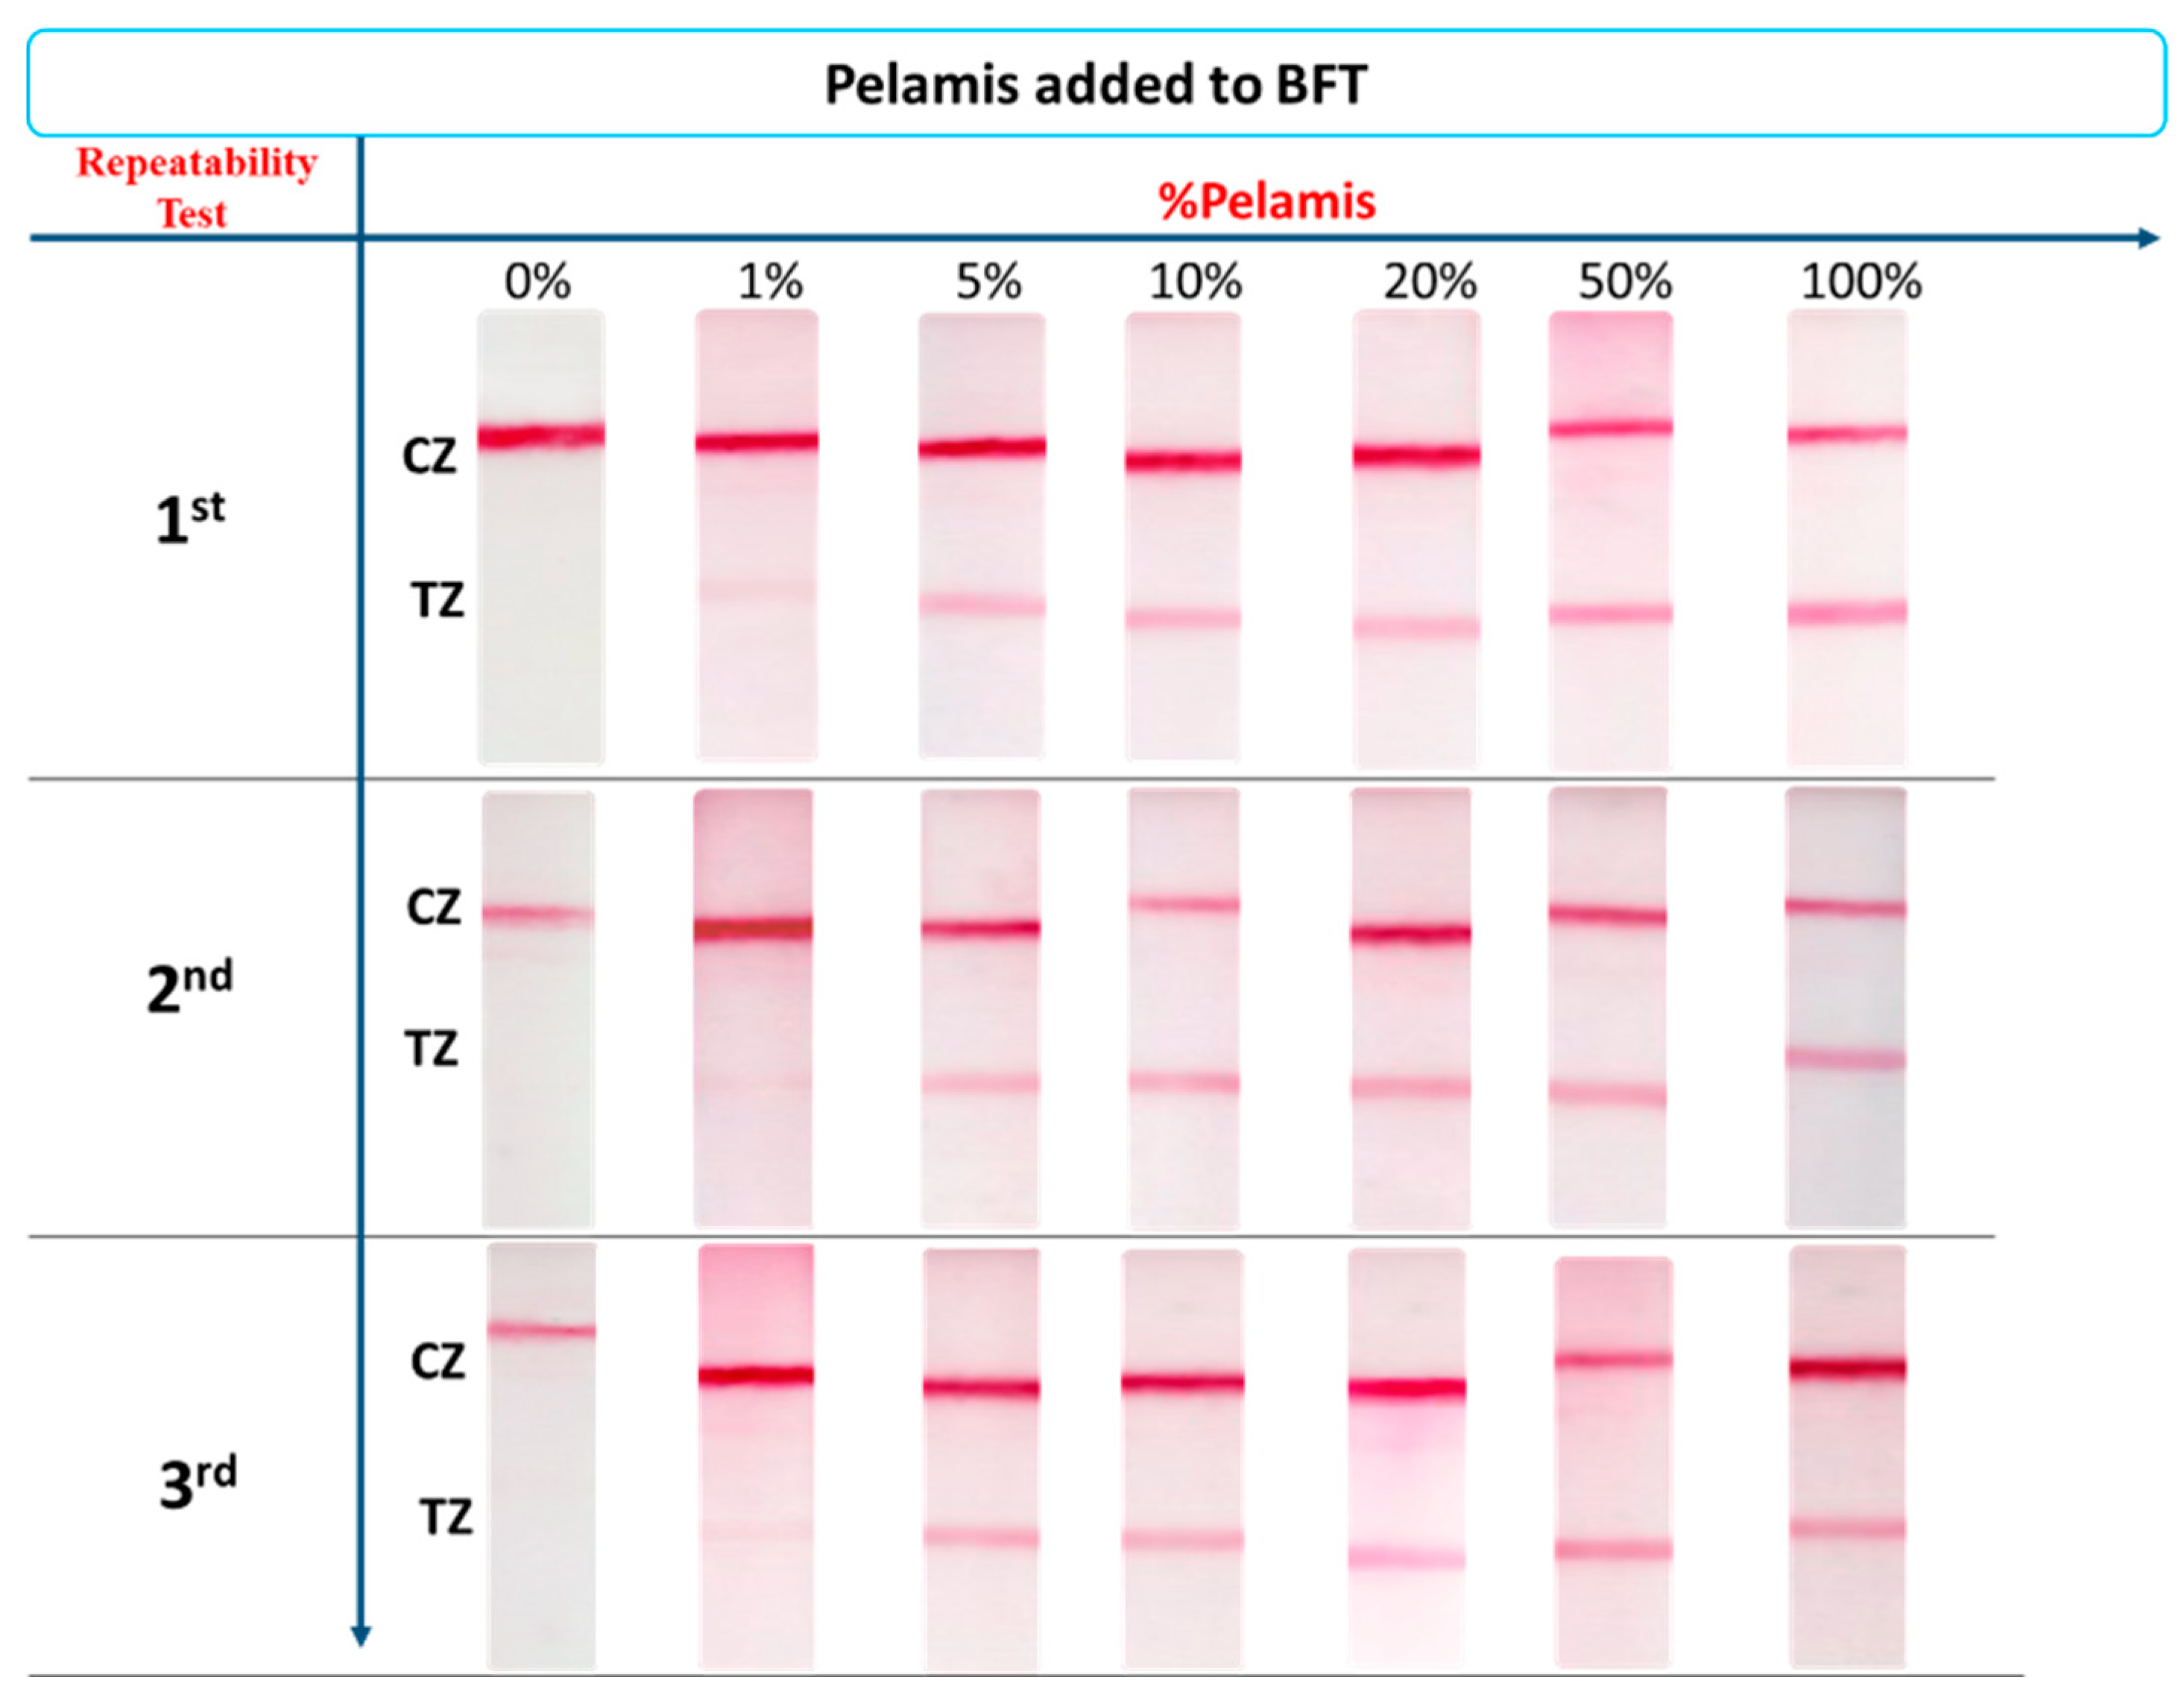
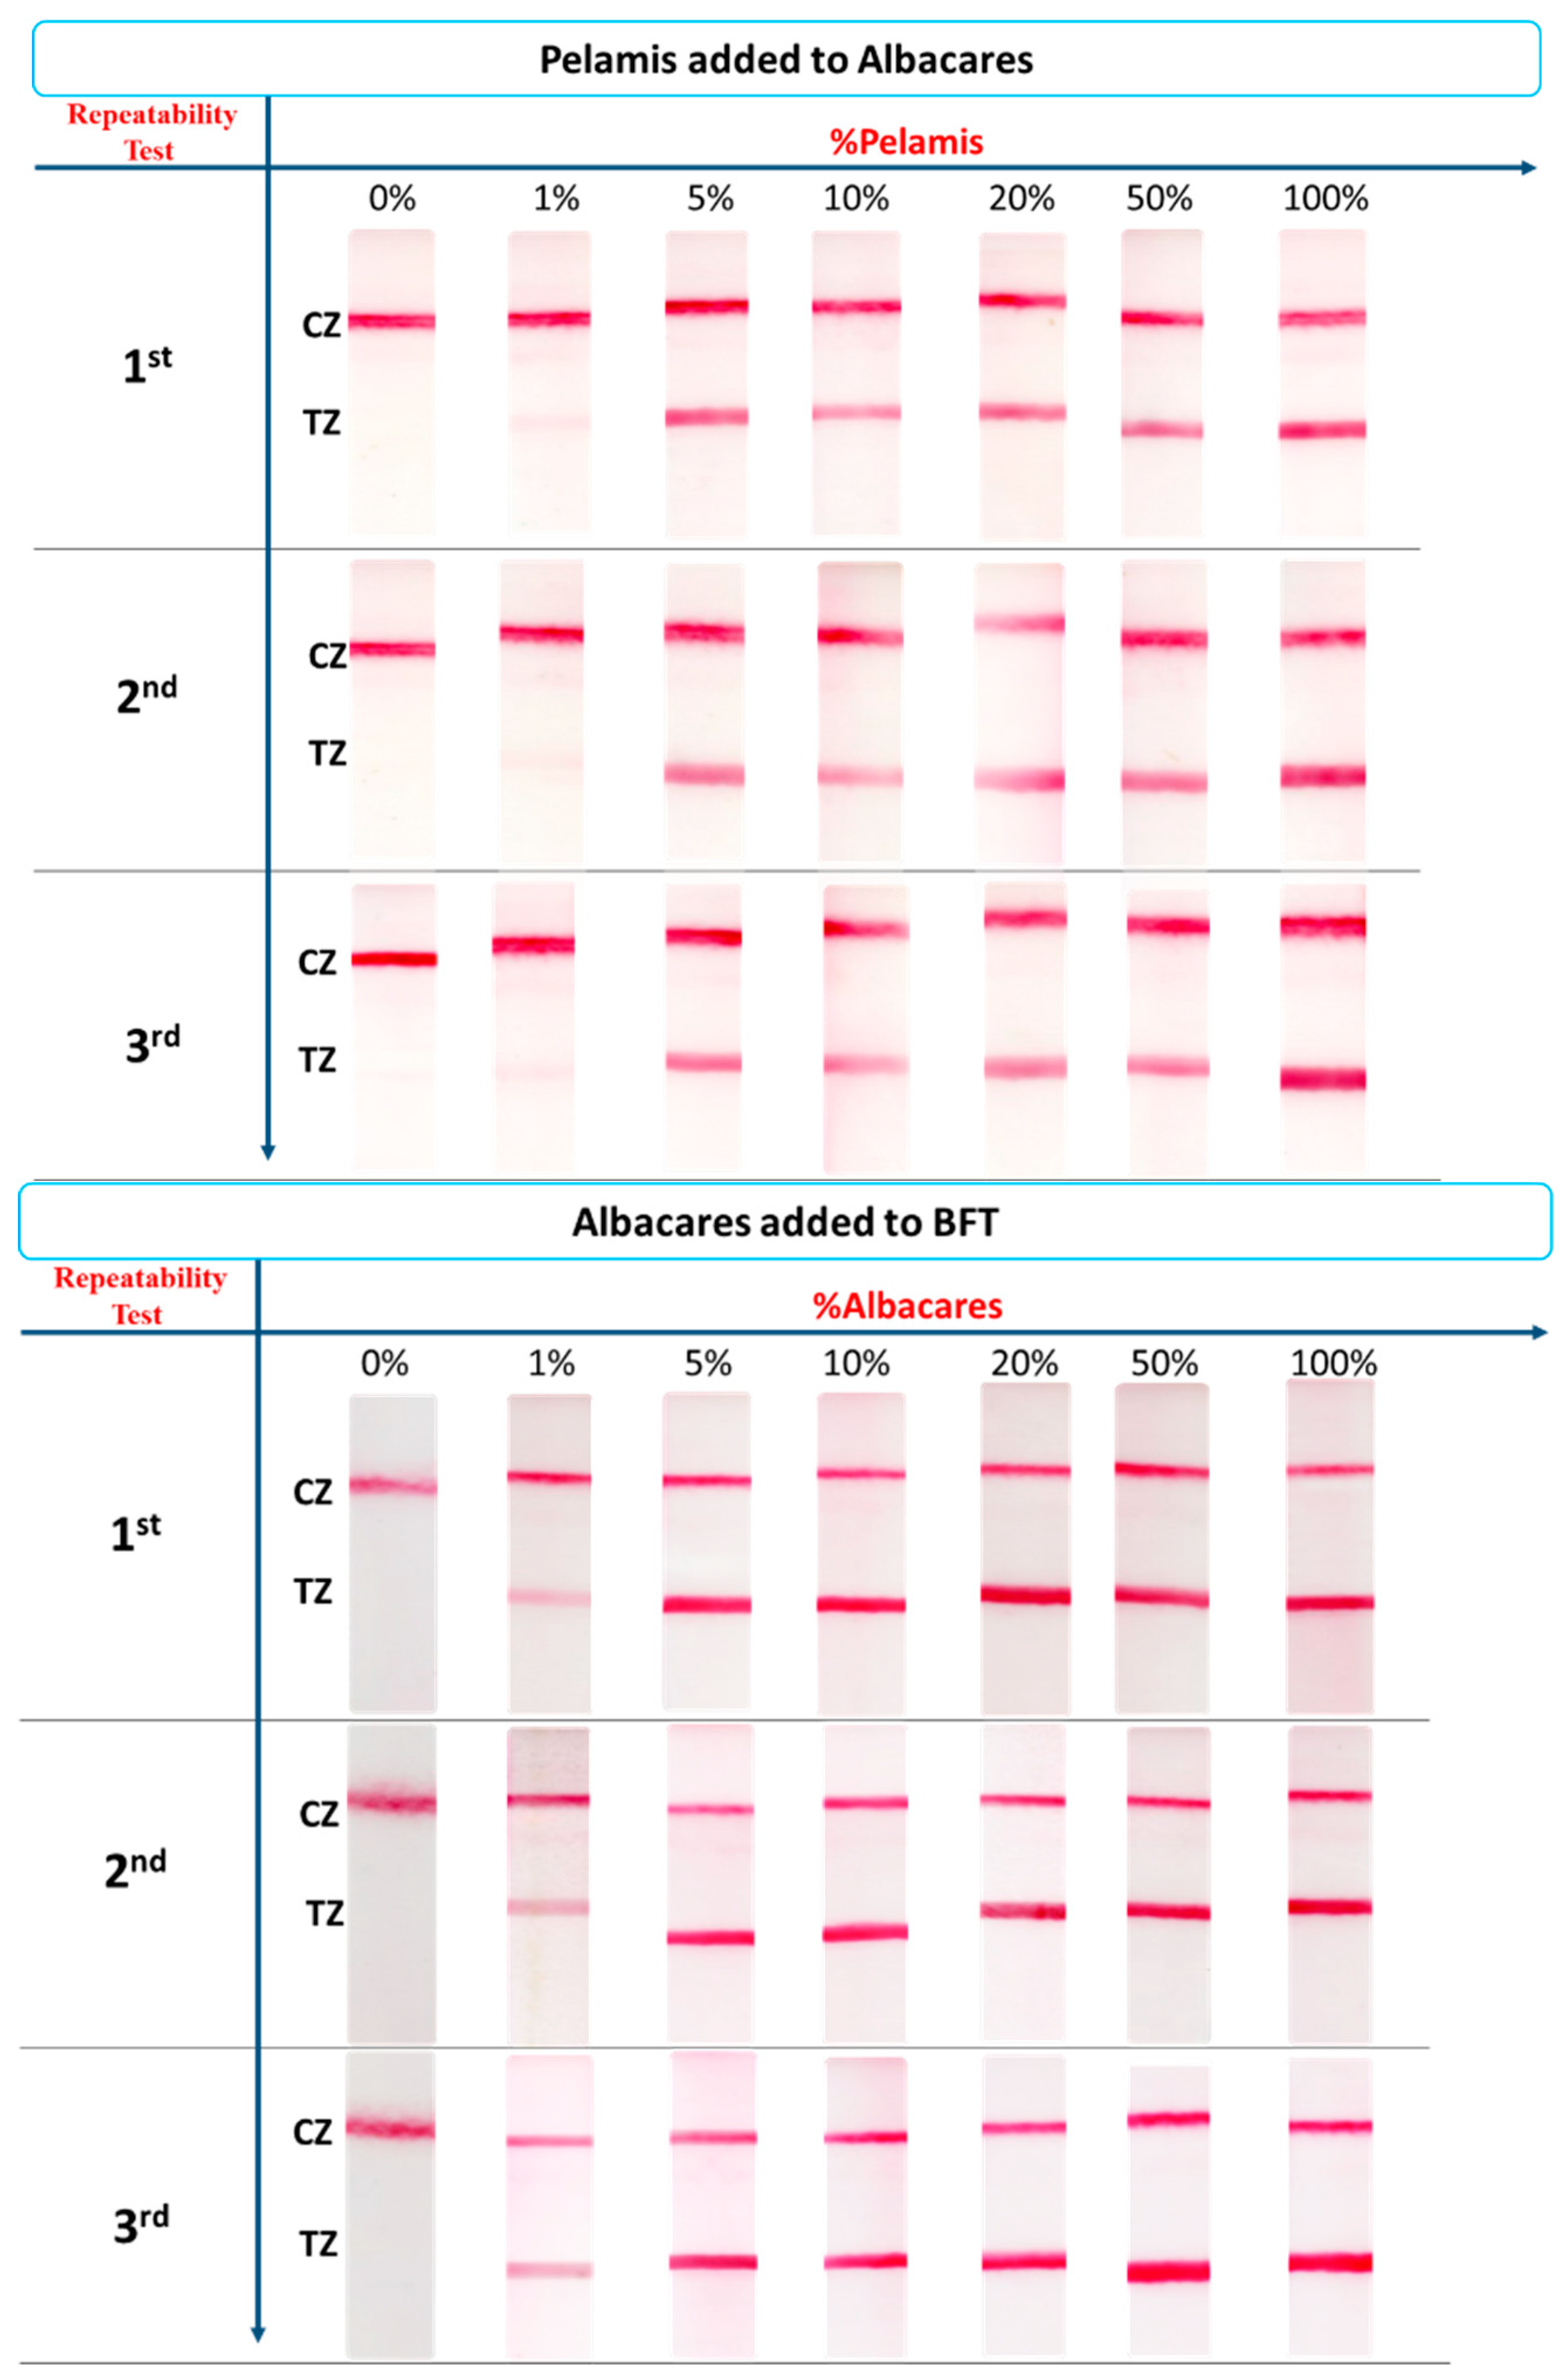
3.5. Application of the Method to the Detection of Fish Adulteration in Heat-Processed Fish Mixtures
4. Optimized Protocols and Methods
4.1. DNA Isolation from Fish Tissue
4.2. Polymerase Chain Reaction (PCR)
4.3. Preparation of Conjugated Gold Nanoparticles with Anti-Biotin Antibody
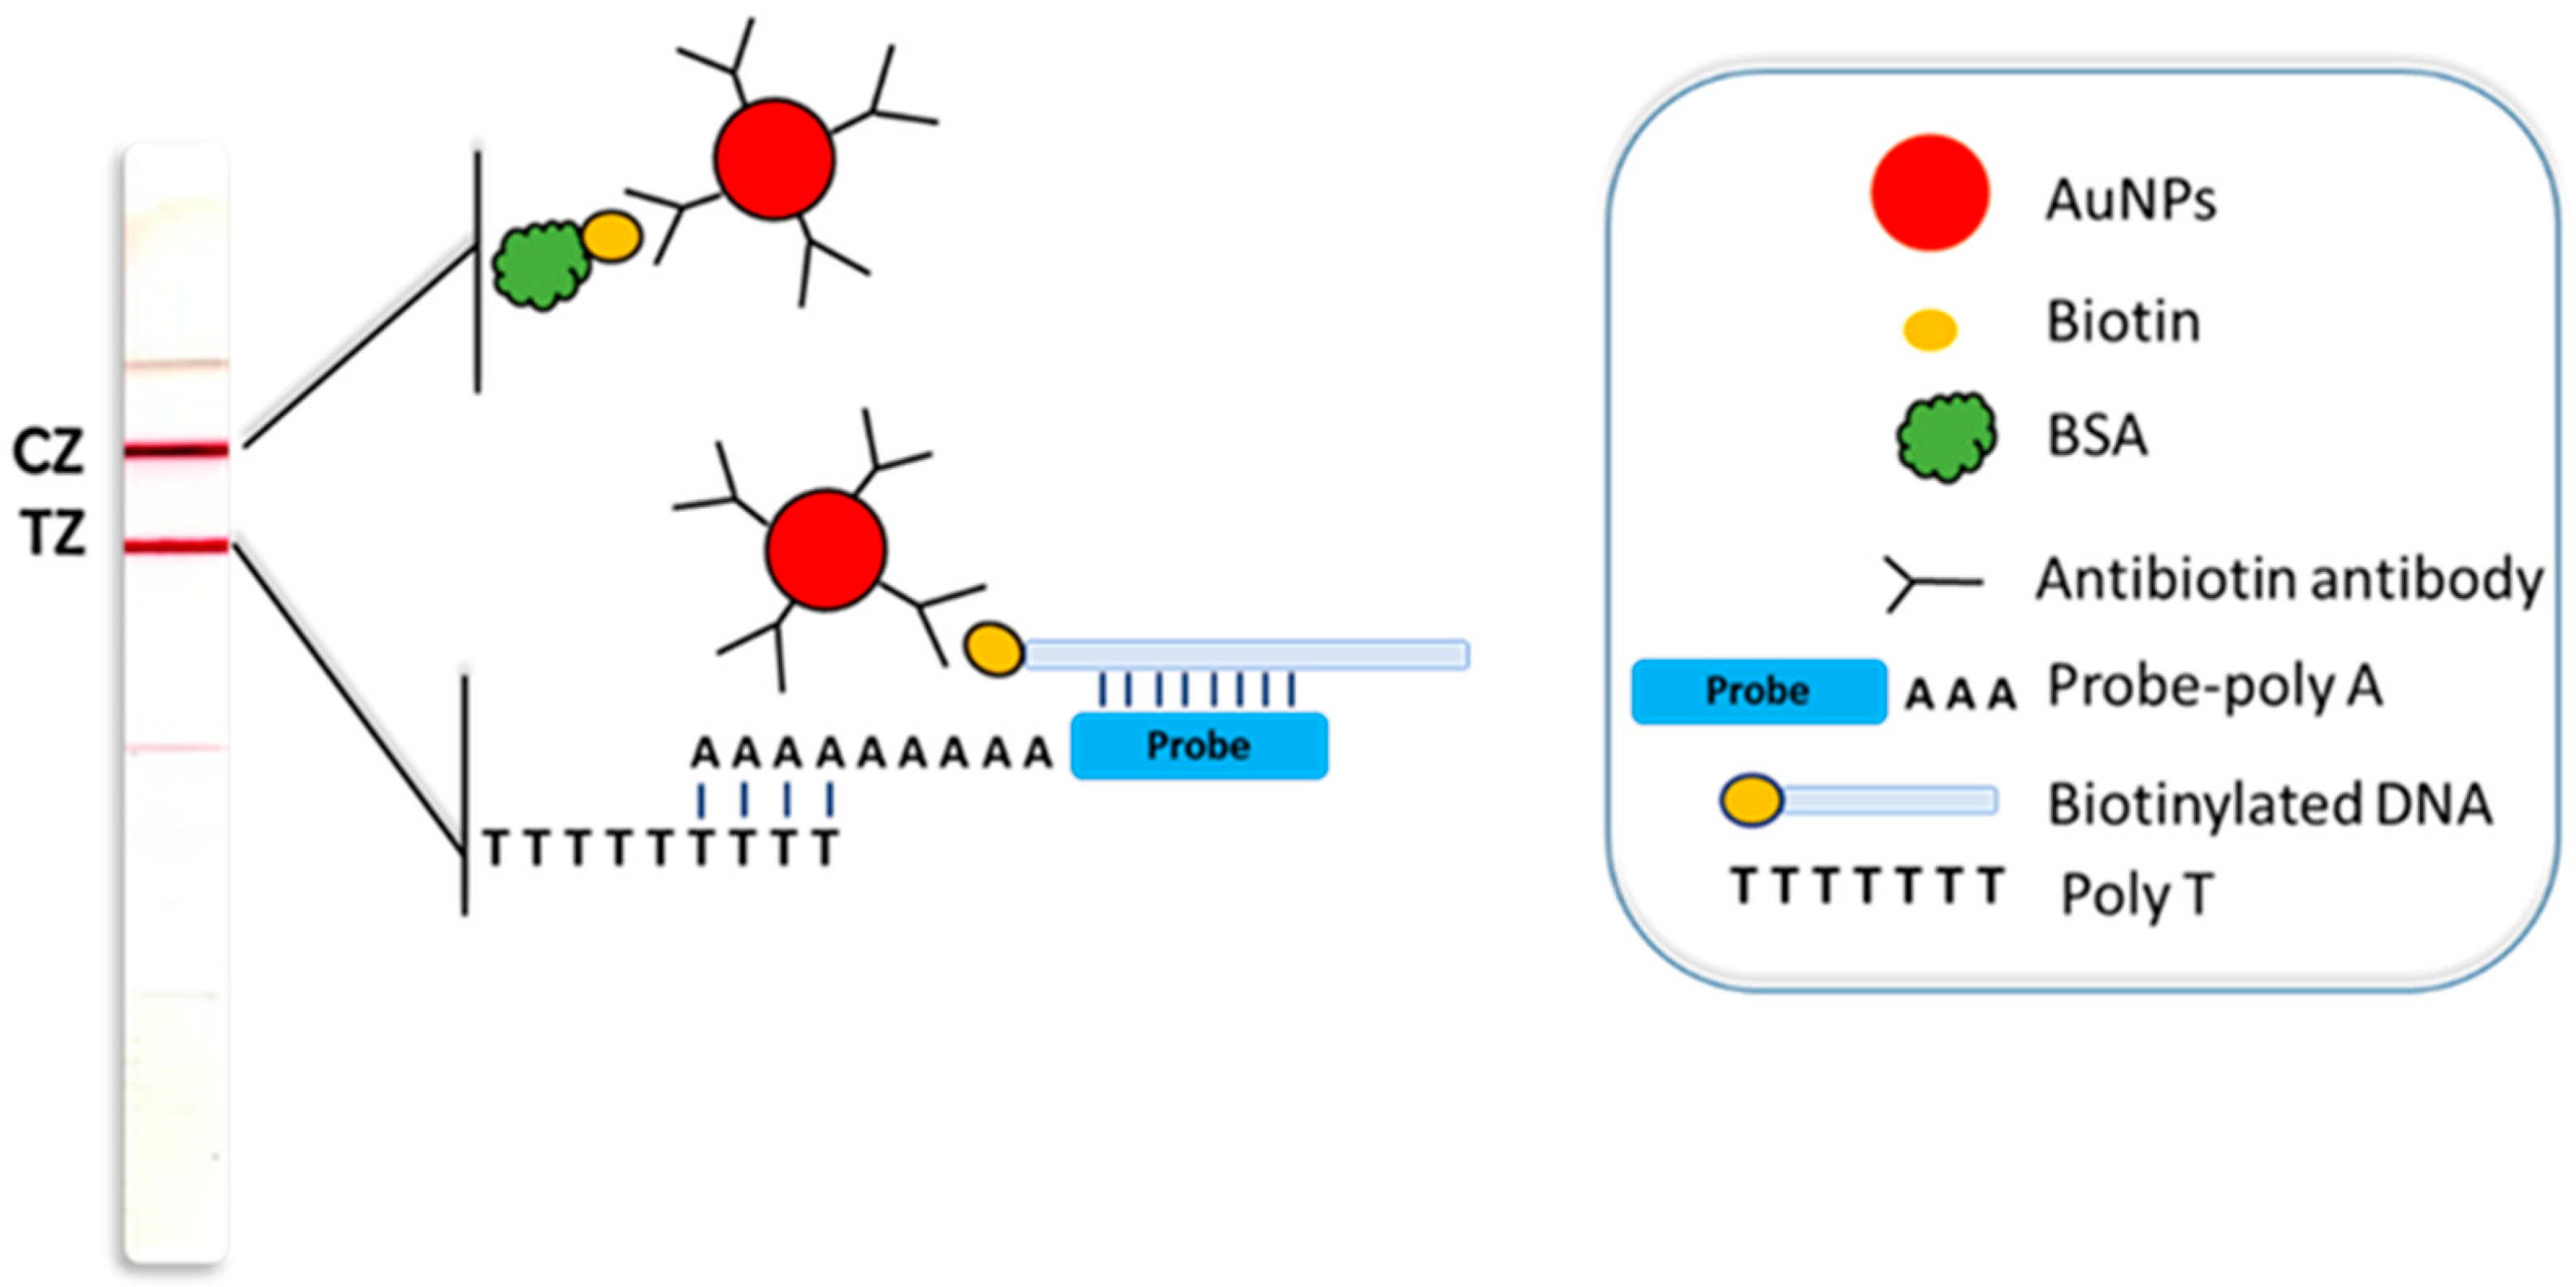
4.4. Construction of the Sensing Device
4.5. Molecular Rapid Test for Visual Detection of Tuna Species
5. Conclusions
Supplementary Materials
Author Contributions
Funding
Institutional Review Board Statement
Informed Consent Statement
Data Availability Statement
Conflicts of Interest
References
- DawanS, J.; Ahn, J. Application of DNA Barcoding for Ensuring Food Safety and Quality. Food Sci. Biotechnol. 2022, 31, 1355–1364. [Google Scholar] [CrossRef]
- World Tuna Day 2022_ History, Significance and All You Need to Know. Available online: https://www.freepressjournal.in/lifestyle/world-tuna-day-2022-history-significance-and-all-you-need-to-know (accessed on 20 December 2023).
- Xiong, X.; Xu, W.; Guo, L.; An, J.; Huang, L.; Qian, H.; Cui, X.; Li, Y.; Cao, M.; Xiong, X.; et al. Development of Loop-Mediated Isothermal Amplification (LAMP) Assay for Rapid Screening of Skipjack Tuna (Katsuwonus Pelamis) in Processed Fish Products. J. Food Compos. Anal. 2021, 102, 104038. [Google Scholar] [CrossRef]
- Chaudhary, V.; Kajla, P.; Dewan, A.; Pandiselvam, R.; Socol, C.T.; Maerescu, C.M. Spectroscopic Techniques for Authentication of Animal Origin Foods. Front. Nutr. 2022, 9, 979205. [Google Scholar] [CrossRef]
- Salihah, N.T.; Hossain, M.M.; Lubis, H.; Ahmed, M.U. Trends and Advances in Food Analysis by Real-Time Polymerase Chain Reaction. J. Food Sci. Technol. 2016, 53, 2196–2209. [Google Scholar] [CrossRef]
- Chen, J.; Tang, H.; Wang, M.; Wei, H.; Ou, C. Explorative Study for the Rapid Detection of Adulterated Surimi Using Gas Chromatography-Ion Mobility Spectrometry. Food Chem. 2024, 439, 138083. [Google Scholar] [CrossRef] [PubMed]
- Dierickx, K.; Presslee, S.; Harvey, V.L. Rapid Collagen Peptide Mass Fingerprinting as a Tool to Authenticate Pleuronectiformes in the Food Industry. Food Control 2023, 148, 109680. [Google Scholar] [CrossRef]
- Varunjikar, M.S.; Moreno-Ibarguen, C.; Andrade-Martinez, J.S.; Tung, H.S.; Belghit, I.; Palmblad, M.; Olsvik, P.A.; Reyes, A.; Rasinger, J.D.; Lie, K.K. Comparing Novel Shotgun DNA Sequencing and State-of-the-Art Proteomics Approaches for Authentication of Fish Species in Mixed Samples. Food Control 2022, 131, 108417. [Google Scholar] [CrossRef]
- Chien, H.J.; Huang, Y.H.; Zheng, Y.F.; Wang, W.C.; Kuo, C.Y.; Wei, G.J.; Lai, C.C. Proteomics for Species Authentication of Cod and Corresponding Fishery Products. Food Chem. 2022, 374, 131631. [Google Scholar] [CrossRef]
- Gu, S.; Deng, X.; Shi, Y.; Cai, Y.; Huo, Y.; Guo, D.; Han, F. Identification of Peptide Biomarkers for Authentication of Atlantic Salmon and Rainbow Trout with Untargeted and Targeted Proteomics Approaches and Quantitative Detection of Adulteration. J. Chromatogr. B Analyt. Technol. Biomed. Life Sci. 2020, 1155, 122194. [Google Scholar] [CrossRef] [PubMed]
- Nessen, M.A.; Van Der Zwaan, D.J.; Grevers, S.; Dalebout, H.; Staats, M.; Kok, E.; Palmblad, M. Authentication of Closely Related Fish and Derived Fish Products Using Tandem Mass Spectrometry and Spectral Library Matching. J. Agric. Food Chem. 2016, 64, 3669–3677. [Google Scholar] [CrossRef]
- Barik, S.K.; Banerjee, S.; Bhattacharjee, S.; Das Gupta, S.K.; Mohanty, S.; Mohanty, B.P. Proteomic Analysis of Sarcoplasmic Peptides of Two Related Fish Species for Food Authentication. Appl. Biochem. Biotechnol. 2013, 171, 1011–1021. [Google Scholar] [CrossRef]
- Mazzeo, M.F.; De Giulio, B.; Guerriero, G.; Ciarcia, G.; Malorni, A.; Russo, G.L.; Siciliano, R.A. Fish Authentication by MALDI-TOF Mass Spectrometry. J. Agric. Food Chem. 2008, 56, 11071–11076. [Google Scholar] [CrossRef]
- Terova, G.; Pisanu, S.; Roggio, T.; Preziosa, E.; Saroglia, M.; Addis, M.F. Proteomic Profiling of Sea Bass Muscle by Two-Dimensional Gel Electrophoresis and Tandem Mass Spectrometry. Fish Physiol. Biochem. 2014, 40, 311–322. [Google Scholar] [CrossRef]
- Abdullah, A.; Rehbein, H. Authentication of Closely Related Scombrid, Catfish and Tilapia Species by PCR-Based Analysis and Isoelectric Focusing of Parvalbumin. Eur. Food Res. Technol. 2015, 241, 497–511. [Google Scholar] [CrossRef]
- Bossier, P.; Cooreman, K. A Databank Able to Be Used for Identifying and Authenticating Commercial Flatfish (Pleuronectiformes) Products at the Species Level Using Isoelectric Focusing of Native Muscle Proteins. Int. J. Food Sci. Technol. 2000, 35, 563–568. [Google Scholar] [CrossRef]
- Asensio, L.; González, I.; Pavón, M.A.; García, T.; Martín, R. An Indirect ELISA and a PCR Technique for the Detection of Grouper (Epinephelus Marginatus) Mislabeling. Food Addit. Contam. Part A Chem. Anal. Control Expo. Risk Assess. 2008, 25, 677–683. [Google Scholar] [CrossRef]
- Asensio, L.; González, I.; García, T.; Martín, R. Determination of Food Authenticity by Enzyme-Linked Immunosorbent Assay (ELISA). Food Control 2008, 19, 1–8. [Google Scholar] [CrossRef]
- Asensio, L.; Samaniego, L. Rapid Identification of Grouper and Wreck Fish Meals by ELISA: A Field Study in Restaurants. Int. J. Food Sci. Technol. 2009, 44, 1585–1589. [Google Scholar] [CrossRef]
- Taylor, W.J.; Patel, N.P.; Jones, J.L. Antibody-Based Methods for Assessing Seafood Authenticity. Food Agric. Immunol. 1994, 6, 305–314. [Google Scholar] [CrossRef]
- Kvasnička, F. Capillary Electrophoresis in Food Authenticity. J. Sep. Sci. 2005, 28, 813–825. [Google Scholar] [CrossRef]
- Wong, E.H.K.; Hanner, R.H. DNA Barcoding Detects Market Substitution in North American Seafood. Food Res. Int. 2008, 41, 828–837. [Google Scholar] [CrossRef]
- Servusova, E.; Piskata, Z. Identification of Selected Tuna Species in Commercial Products. Molecules 2021, 26, 1137. [Google Scholar] [CrossRef]
- Lee, G.Y.; Suh, S.M.; Lee, Y.M.; Kim, H.Y. Multiplex PCR Assay for Simultaneous Identification of Five Types of Tuna (Katsuwonus Pelamis, Thunnus Alalonga, T. Albacares, T. Obesus and T. Thynnus). Foods 2022, 11, 280. [Google Scholar] [CrossRef]
- Krcmar, P.; Piskata, Z.; Servusova, E. Identification of Tuna Species Thunnus Albacares and Katsuwonus Pelamis in Canned Products by Real-Time PCR Method. Acta Vet. 2019, 88, 323–328. [Google Scholar] [CrossRef]
- Lopez, I.; Pardo, M.A. Application of Relative Quantification TaqMan Real-Time Polymerase Chain Reaction Technology for the Identification and Quantification of Thunnus Alalunga and Thunnus Albacares. J. Agric. Food Chem. 2005, 53, 4554–4560. [Google Scholar] [CrossRef]
- Terio, V.; Di Pinto, P.; Decaro, N.; Parisi, A.; Desario, C.; Martella, V.; Buonavoglia, C.; Tantillo, M.G. Identification of Tuna Species in Commercial Cans by Minor Groove Binder Probe Real-Time Polymerase Chain Reaction Analysis of Mitochondrial DNA Sequences. Mol. Cell. Probes 2010, 24, 352–356. [Google Scholar] [CrossRef]
- Chuang, P.S.; Chen, M.I.; Shiao, J.C. Identification of Tuna Species by a Real-Time Polymerase Chain Reaction Technique. Food Chem. 2012, 133, 1055–1061. [Google Scholar] [CrossRef]
- Liu, S.; Xu, K.; Wu, Z.; Xie, X.; Feng, J. Identification of Five Highly Priced Tuna Species by Quantitative Real-Time Polymerase Chain Reaction. Mitochondrial DNA 2016, 27, 3270–3279. [Google Scholar] [CrossRef]
- Bojolly, D.; Doyen, P.; Le Fur, B.; Christaki, U.; Verrez-Bagnis, V.; Grard, T. Development of a QPCR Method for the Identification and Quantification of Two Closely Related Tuna Species, Bigeye Tuna (Thunnus Obesus) and Yellowfin Tuna (Thunnus Albacares), in Canned Tuna. J. Agric. Food Chem. 2017, 65, 913–920. [Google Scholar] [CrossRef]
- Bottero, M.T.; Dalmasso, A.; Cappelletti, M.; Secchi, C.; Civera, T. Differentiation of Five Tuna Species by a Multiplex Primer-Extension Assay. J. Biotechnol. 2007, 129, 575–580. [Google Scholar] [CrossRef]
- Santaclara, F.J.; Velasco, A.; Pérez-Martín, R.I.; Quinteiro, J.; Rey-Méndez, M.; Pardo, M.A.; Jimenez, E.; Sotelo, C.G. Development of a Multiplex PCR-ELISA Method for the Genetic Authentication of Thunnus Species and Katsuwonus Pelamis in Food Products. Food Chem. 2015, 180, 9–16. [Google Scholar] [CrossRef]
- Kappel, K.; Haase, I.; Käppel, C.; Sotelo, C.G.; Schröder, U. Species Identification in Mixed Tuna Samples with Next-Generation Sequencing Targeting Two Short Cytochrome b Gene Fragments. Food Chem. 2017, 234, 212–219. [Google Scholar] [CrossRef]
- Xu, W.; Li, Q.; Xue, H.; Fei, Y.; Cui, X.; Cao, M.; Xiong, X.; Xiong, X.; Yang, Y.; Wang, L. Establishment of a Rapid Method for Skipjack Tuna (Katsuwonus Pelamis) Authentication Using Molecular Beacons in Loop-Mediated Isothermal Amplification. Food Chem. 2022, 382, 132365. [Google Scholar] [CrossRef]


| Species | Targeted Gene | Name of Primer and Probes | Sequences (5′→3′) | Size of Amplicon (bp) | Reference |
|---|---|---|---|---|---|
| Yellowfin tuna— Thunnus albacares | D-loop region | Forward primer (ALBF) | CGAGATTTAAGACCTACCATAACAAC | 85 | [1] |
| Reverse primer (BALBR) | Biotin-TGCGCTTAAATTTACCTGACTT | ||||
| Probe (ALBP) | TCGTCTAAGCCATACCAAGTATCCC | ||||
| Skipjack tuna— Katsuwonus pelamis | Cytb | Forward primer (PELF) | GGTCCTAGCTCTTCTTGCA | 238 | [2] |
| Reverse primer (BPELR) | Biotin-TGCAAGTGGGAAGAAGATG | ||||
| Probe (PELP) | CCCTTCATTATCATCGGCCA | This study | |||
| Atlantic Bluefin— Thunnus thynnus | NADH5 | Forward primer (THYF) | AACTCTTTATCGGGTGGGAG | 200 | [2] |
| Reverse primer (BTHYR) | Biotin-AGCGGTTACGAACATTTGCTTC | ||||
| Probe (THYP) | CTGCTCTACAAGCGGTAGTA | This study |
Disclaimer/Publisher’s Note: The statements, opinions and data contained in all publications are solely those of the individual author(s) and contributor(s) and not of MDPI and/or the editor(s). MDPI and/or the editor(s) disclaim responsibility for any injury to people or property resulting from any ideas, methods, instructions or products referred to in the content. |
© 2024 by the authors. Licensee MDPI, Basel, Switzerland. This article is an open access article distributed under the terms and conditions of the Creative Commons Attribution (CC BY) license (https://creativecommons.org/licenses/by/4.0/).
Share and Cite
Gkini, I.P.; Christopoulos, P.; Conides, A.; Kalogianni, D.P.; Christopoulos, T.K. Molecular Rapid Test for Identification of Tuna Species. Biosensors 2024, 14, 82. https://doi.org/10.3390/bios14020082
Gkini IP, Christopoulos P, Conides A, Kalogianni DP, Christopoulos TK. Molecular Rapid Test for Identification of Tuna Species. Biosensors. 2024; 14(2):82. https://doi.org/10.3390/bios14020082
Chicago/Turabian StyleGkini, Isidora P., Panagiotis Christopoulos, Alexis Conides, Despina P. Kalogianni, and Theodore K. Christopoulos. 2024. "Molecular Rapid Test for Identification of Tuna Species" Biosensors 14, no. 2: 82. https://doi.org/10.3390/bios14020082
APA StyleGkini, I. P., Christopoulos, P., Conides, A., Kalogianni, D. P., & Christopoulos, T. K. (2024). Molecular Rapid Test for Identification of Tuna Species. Biosensors, 14(2), 82. https://doi.org/10.3390/bios14020082