Effects of Game-Related Tasks for the Diagnosis and Classification of Gaming Disorder


 , and
, and
Abstract
1. Introduction
2. Materials and Methods
2.1. Subjects
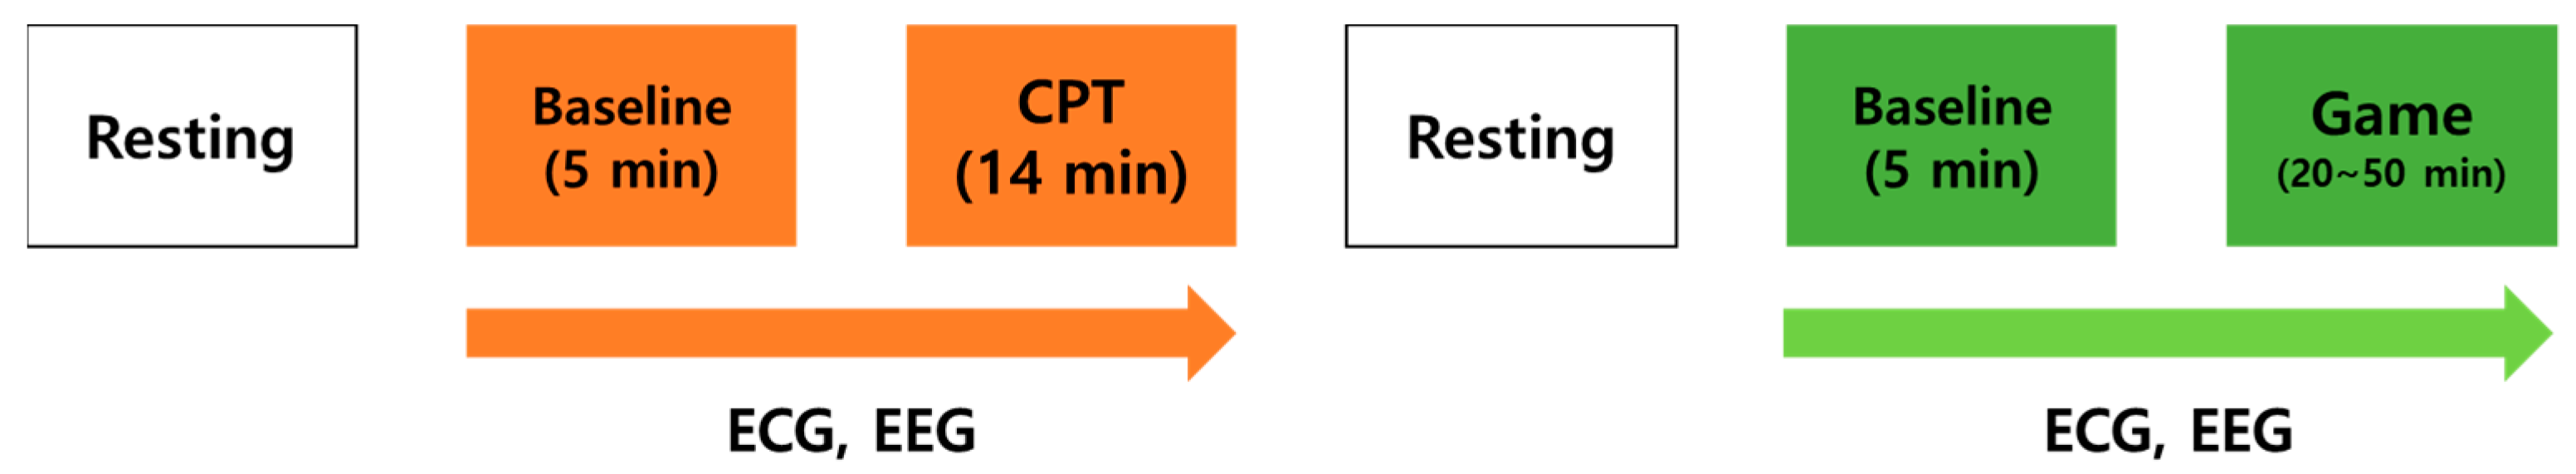
2.2. Procedure
2.3. Data Acquisition and Preprocessing
2.4. Data Analysis
3. Results
3.1. Demographics and Clinical Characteristics
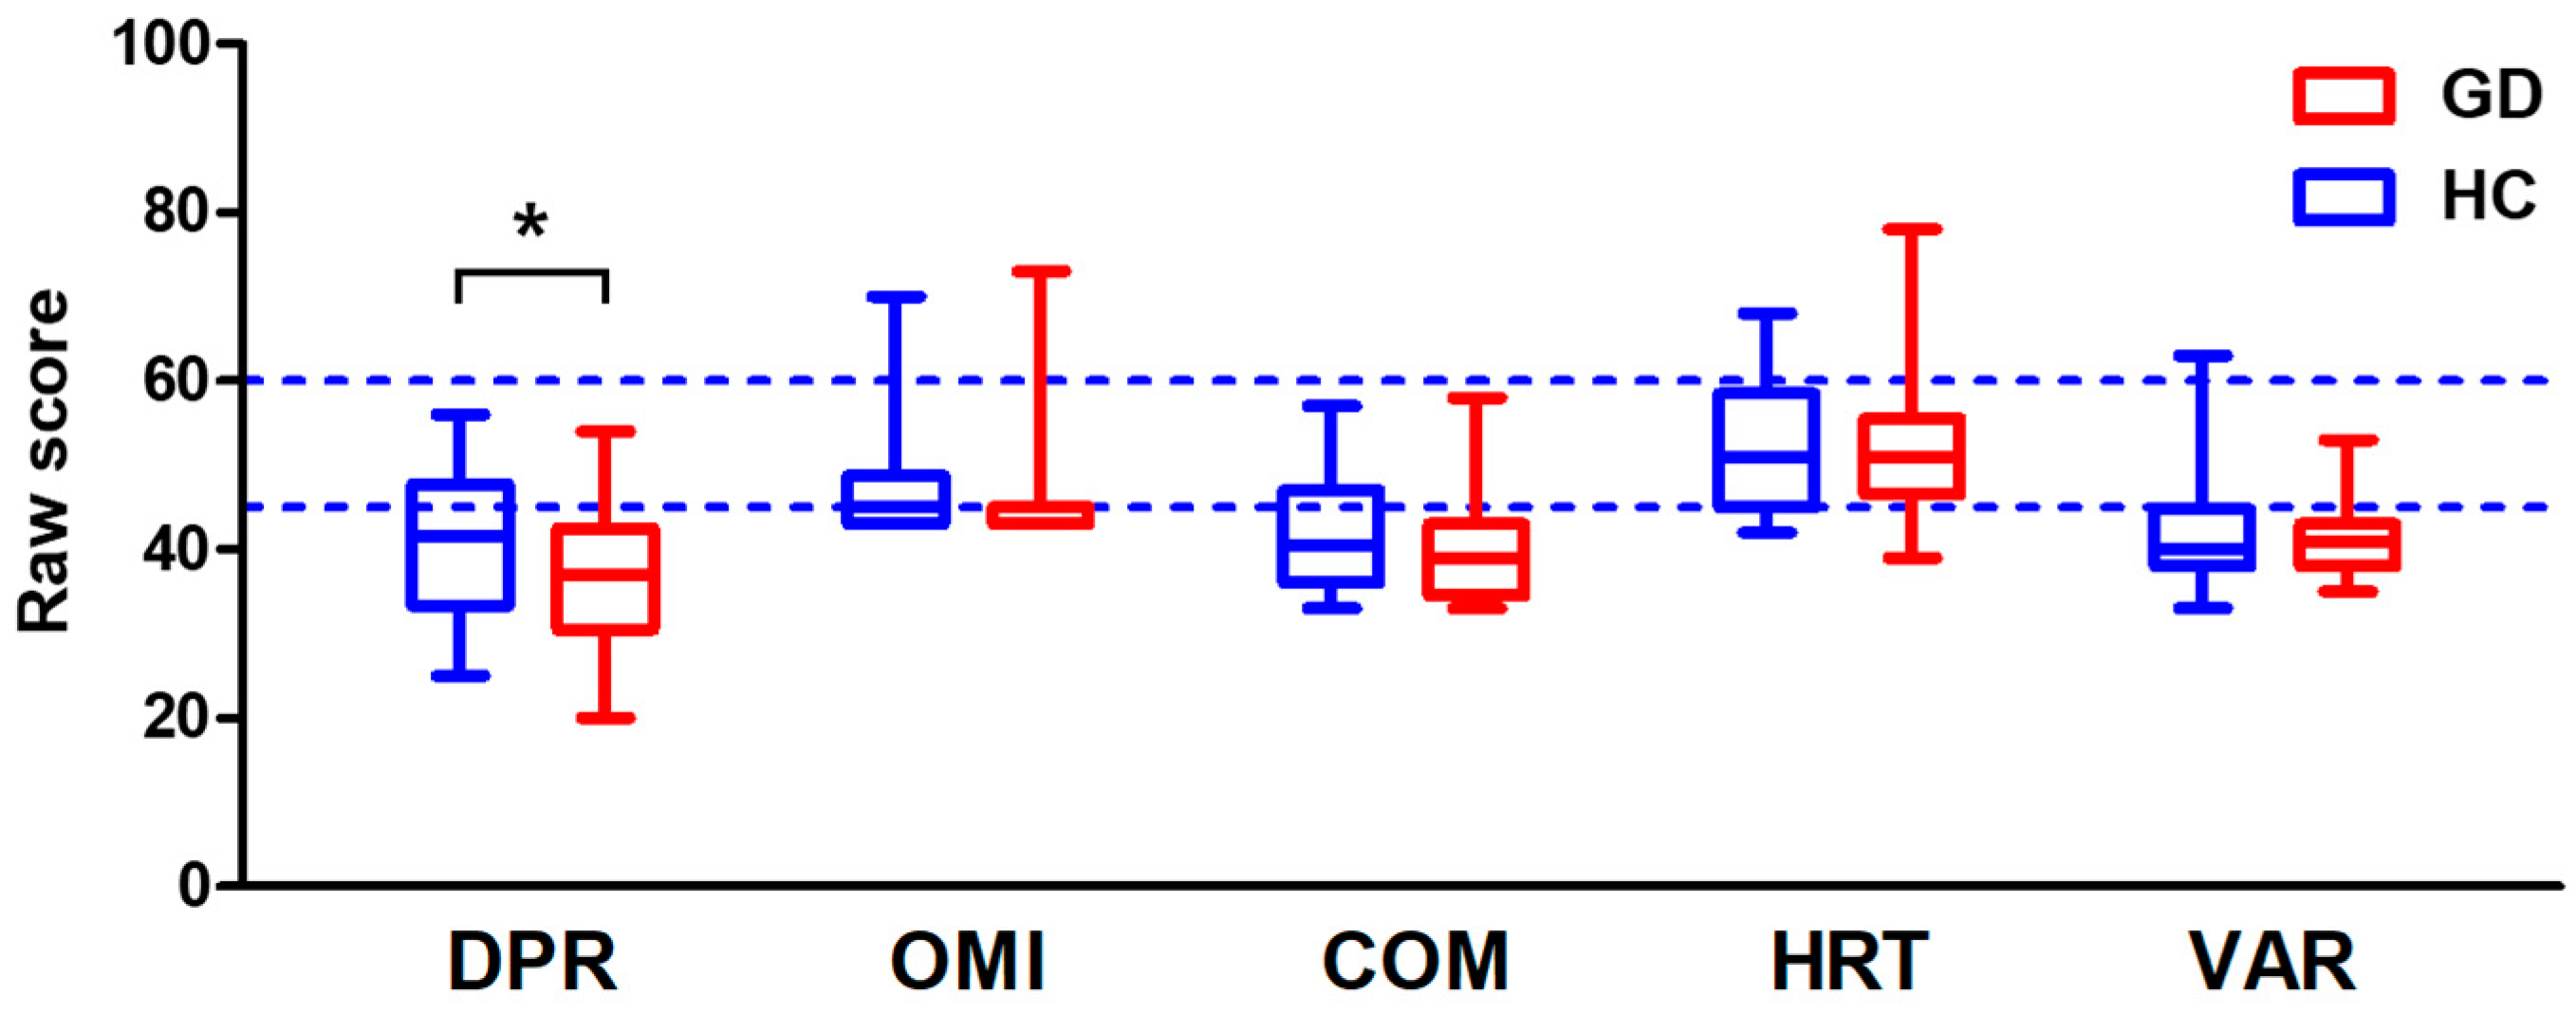
3.2. CPT Score
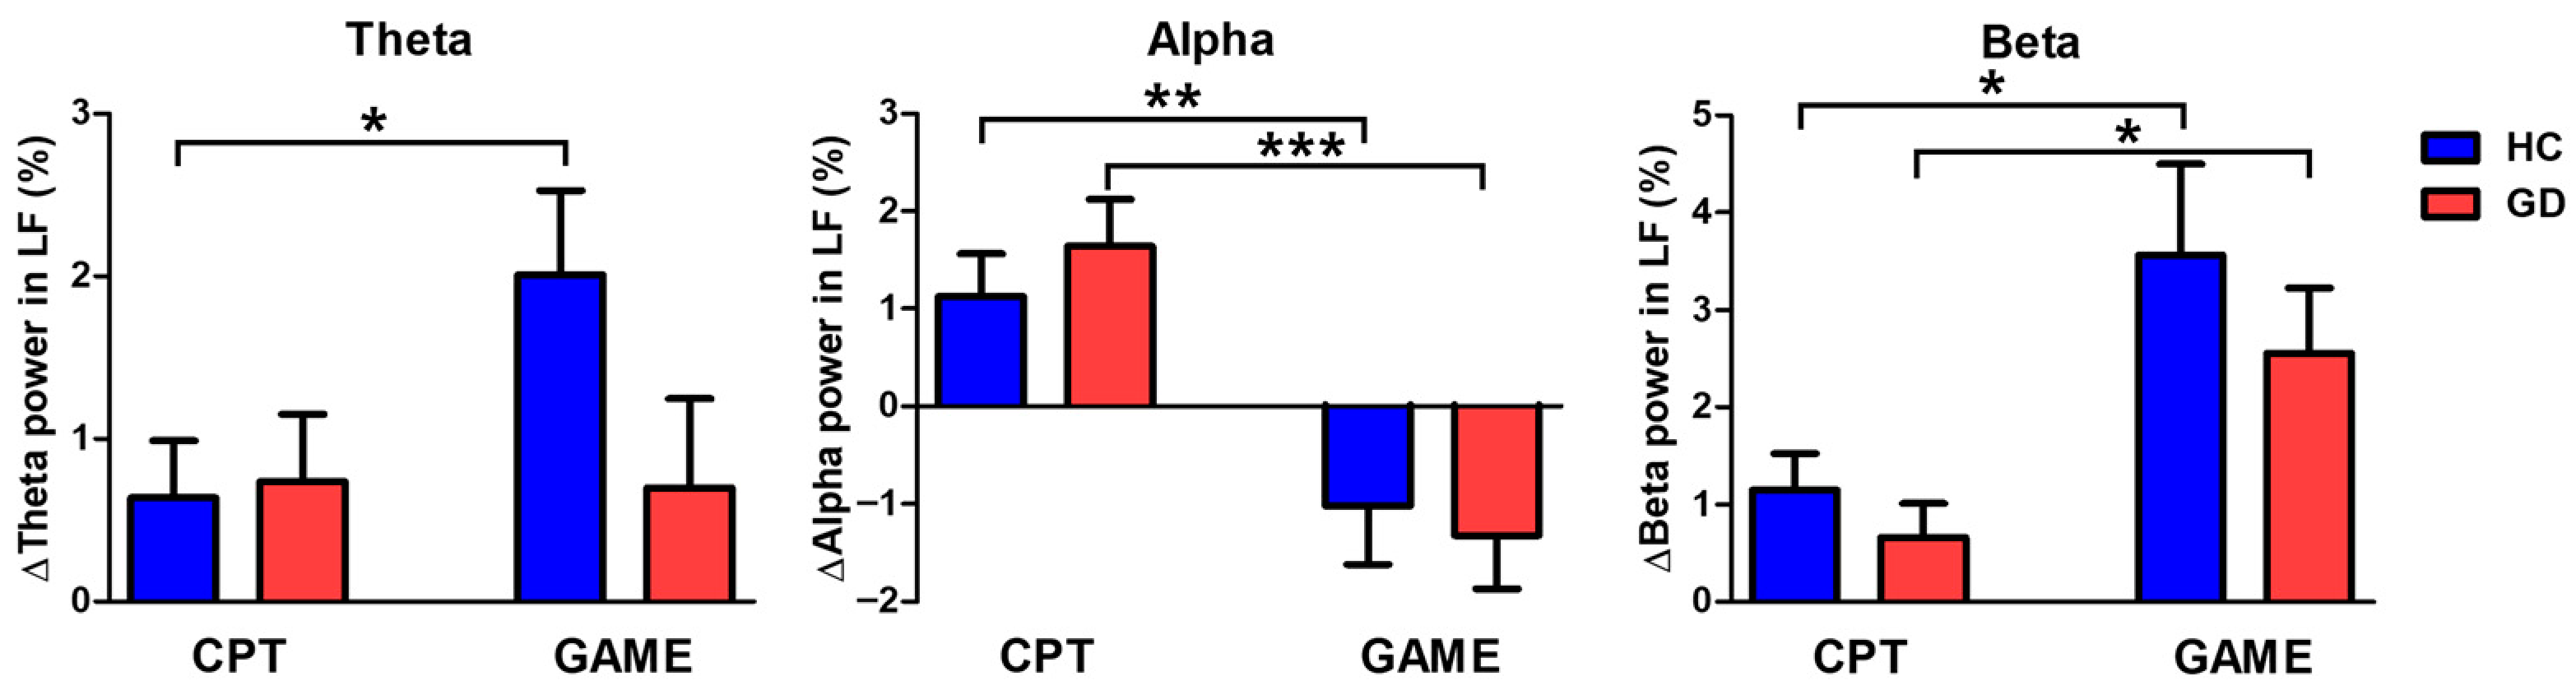
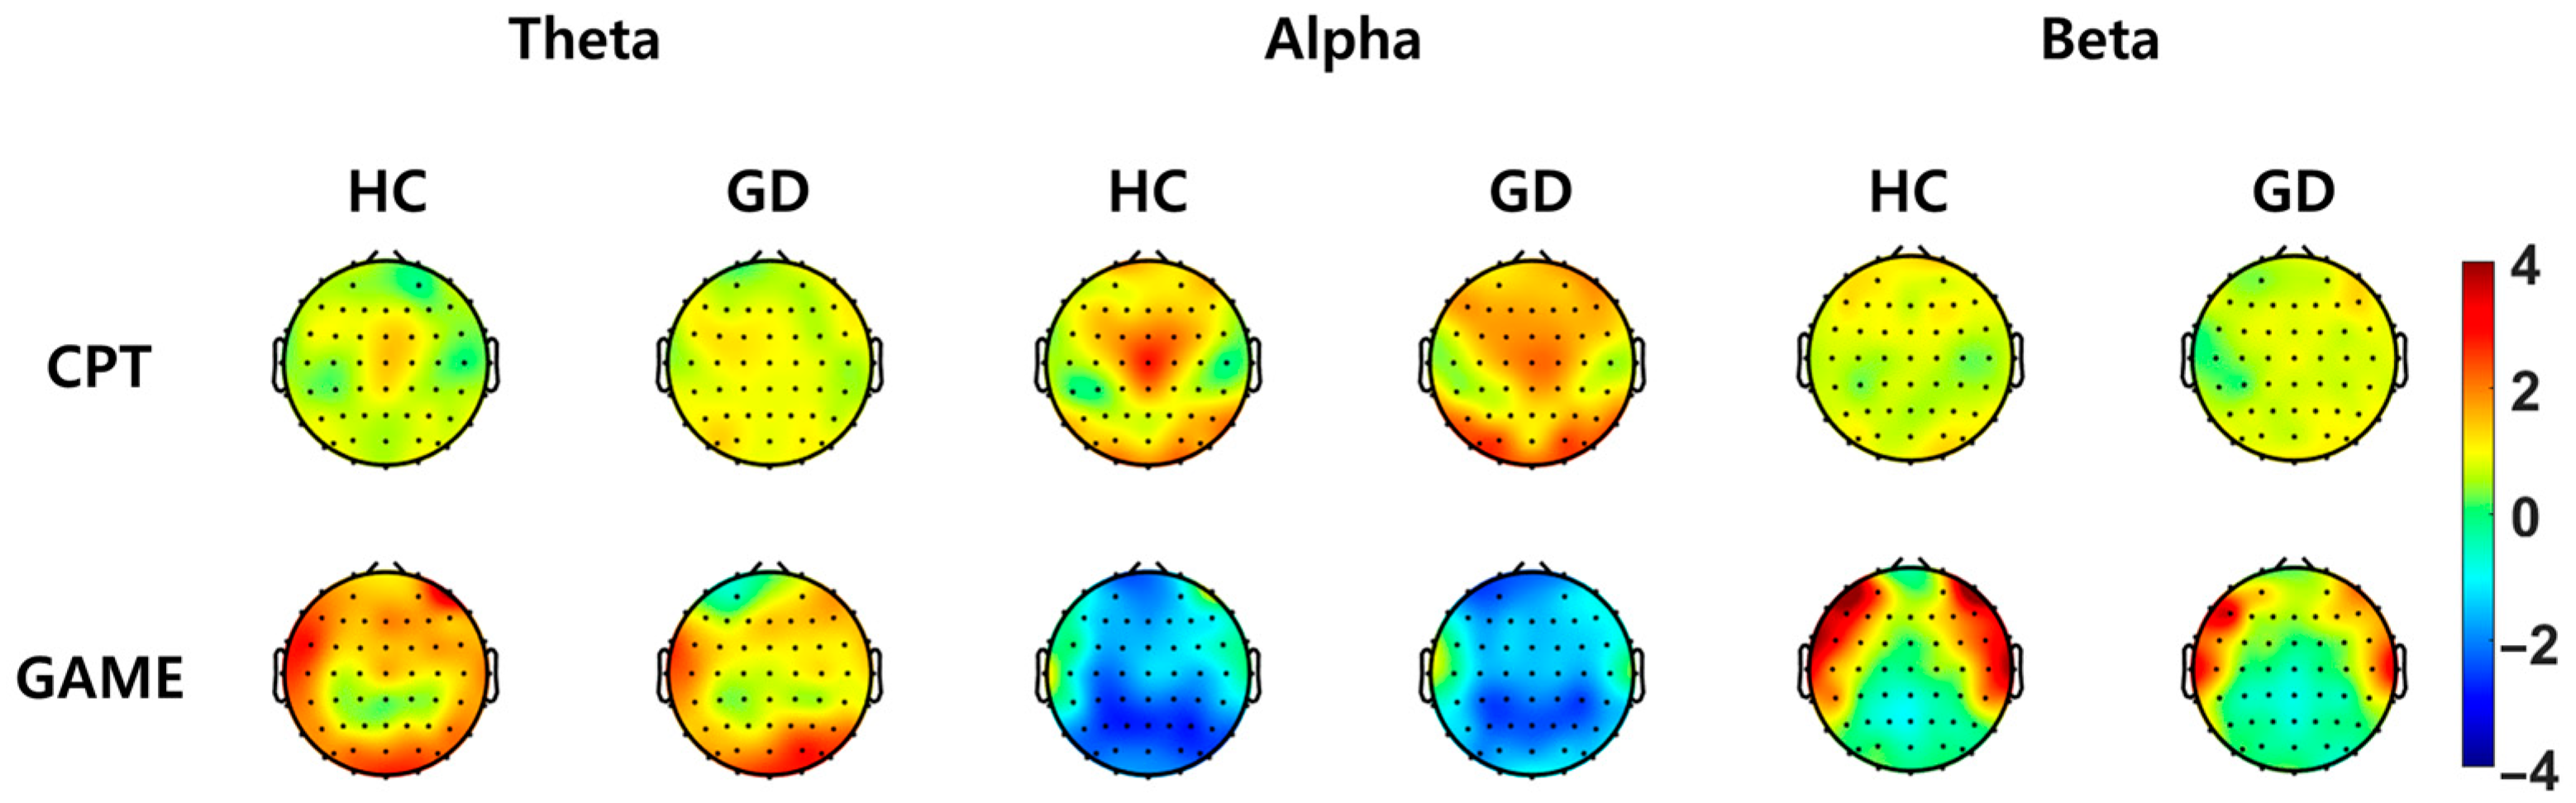
3.3. Brain Activity
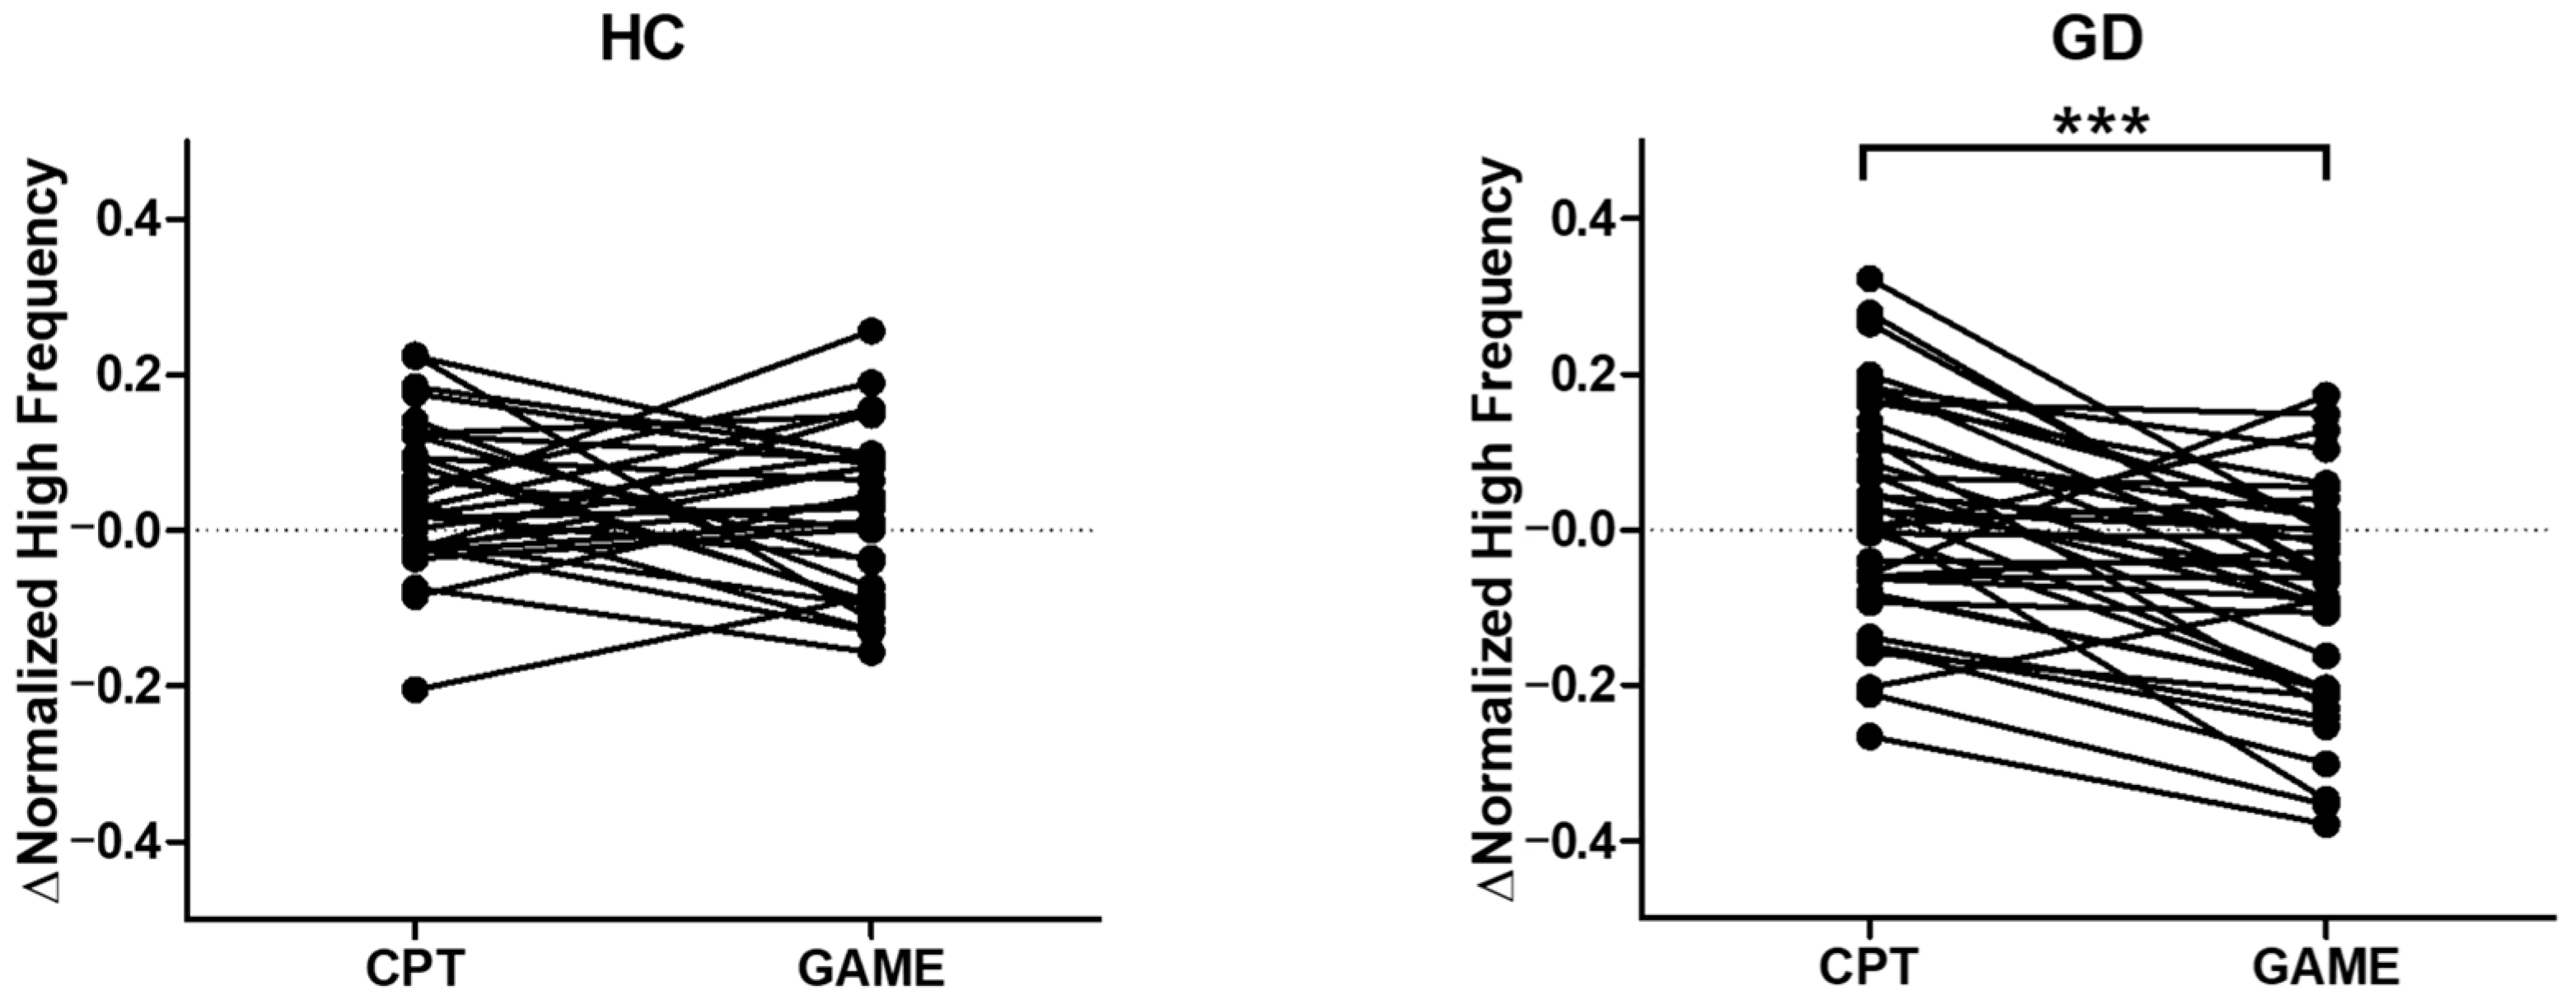
3.4. Parasympathetic Activity Comparison
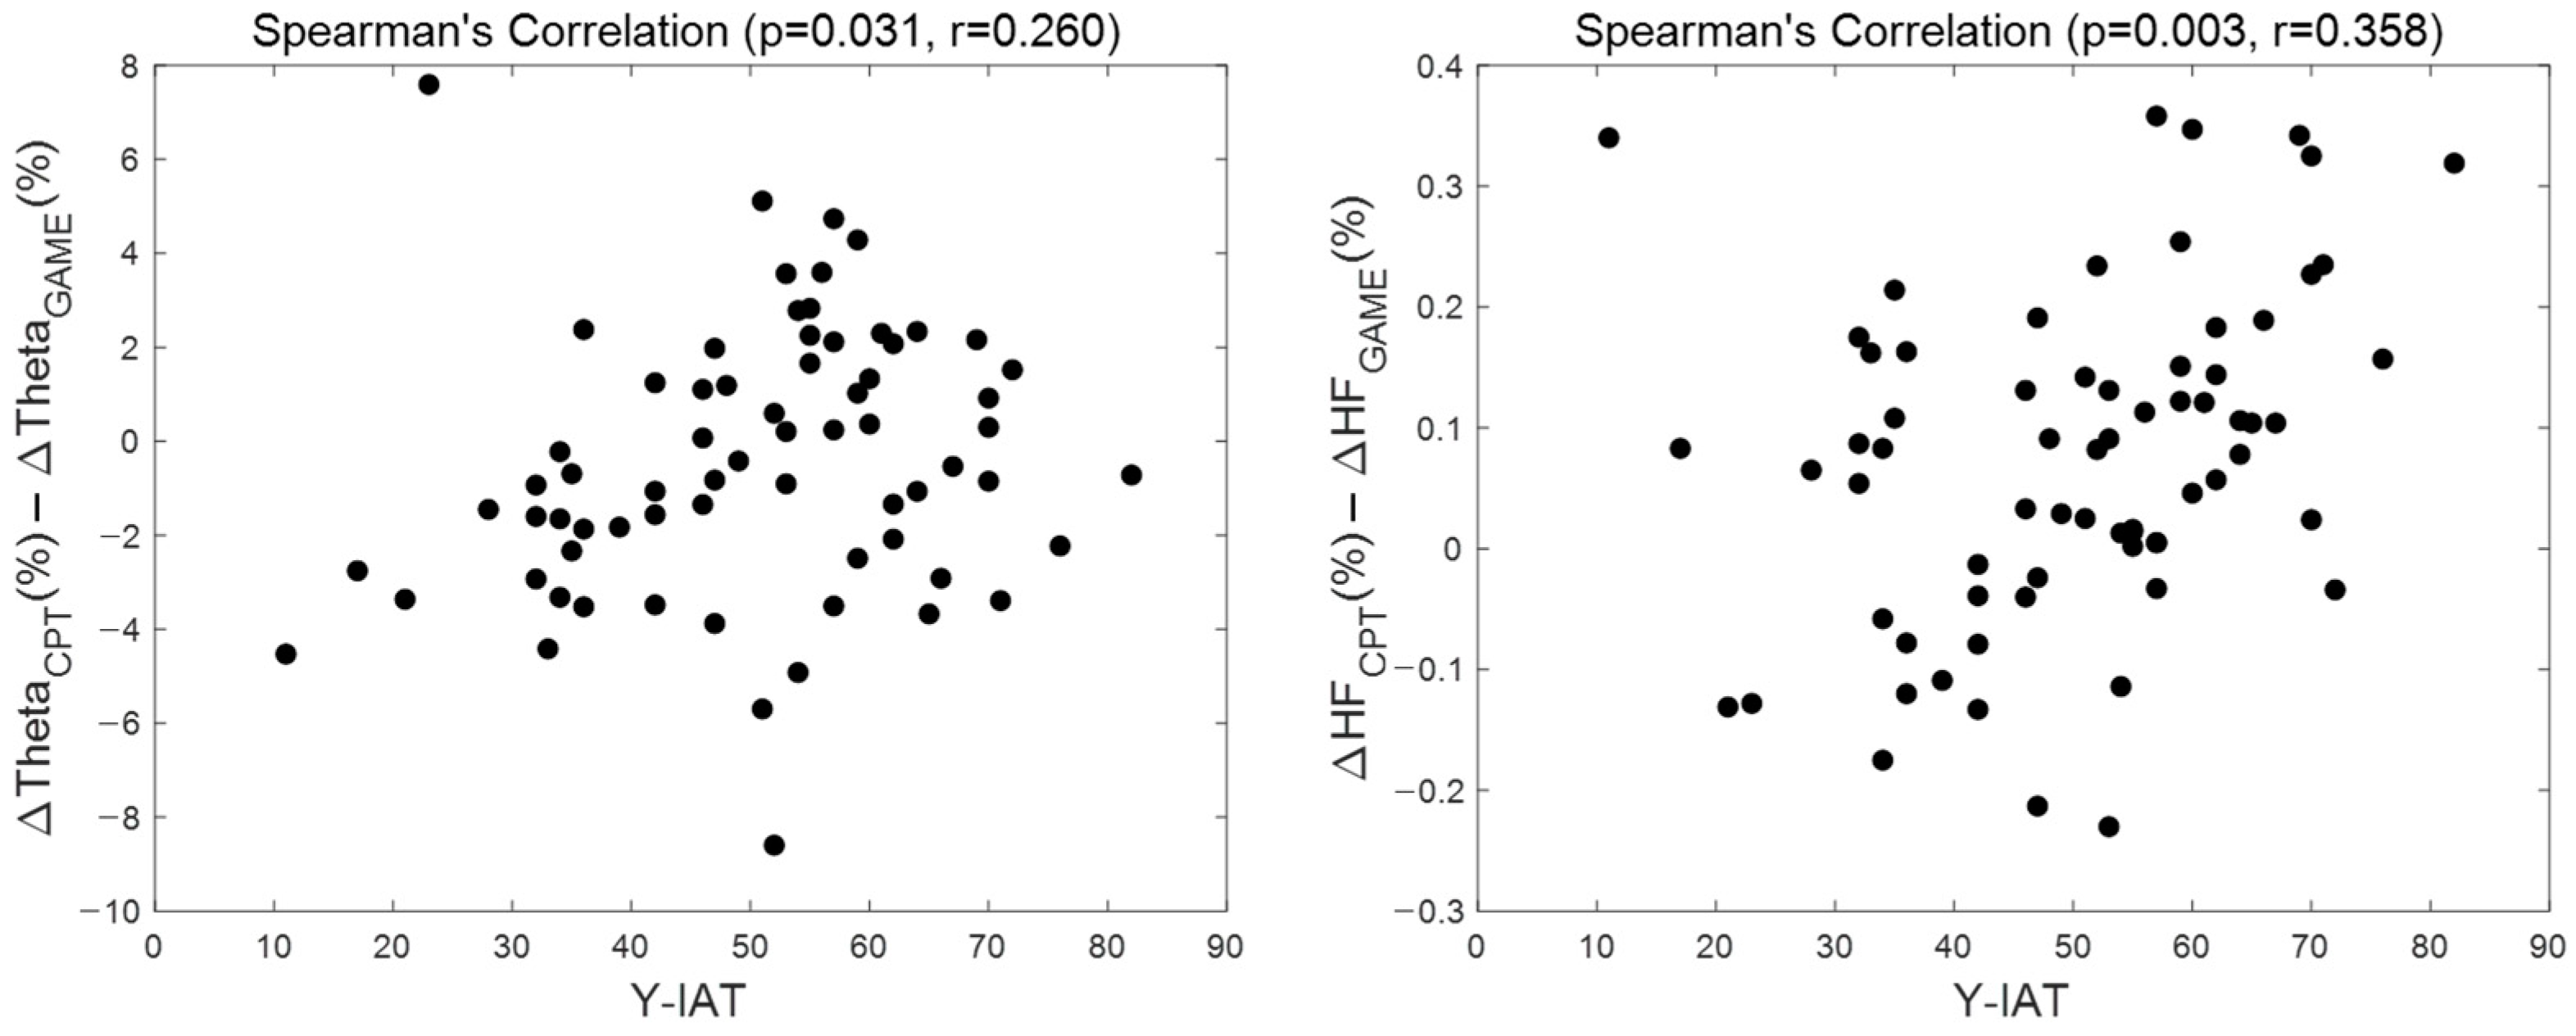
3.5. Correlation Analysis
4. Discussion
Author Contributions
Funding
Institutional Review Board Statement
Informed Consent Statement
Data Availability Statement
Conflicts of Interest
References
- Kiraly, O.; Koncz, P.; Griffiths, M.D.; Demetrovics, Z. Gaming disorder: A summary of its characteristics and aetiology. Compr. Psychiatry 2023, 122, 152376. [Google Scholar] [CrossRef] [PubMed]
- Kuss, D.J. Internet gaming addiction: Current perspectives. Psychol. Res. Behav. Manag. 2013, 6, 125–137. [Google Scholar] [CrossRef] [PubMed]
- World Health Organization. International Classification of Diseases Eleventh Revision (ICD-11), 11th ed.; World Health Organization: Geneva, Switzerland, 2022. [Google Scholar]
- Griffiths, M.D. The role of context in online gaming excess and addiction: Some case study evidence. Int. J. Ment. Health Addict. 2010, 8, 119–125. [Google Scholar] [CrossRef]
- Zhou, W.; Zheng, H.; Wang, M.; Zheng, Y.; Chen, S.; Wang, M.-J.; Dong, G.-H. The imbalance between goal-directed and habitual systems in internet gaming disorder: Results from the disturbed thalamocortical communications. J. Psychiatr. Res. 2021, 134, 121–128. [Google Scholar] [CrossRef] [PubMed]
- Ricci, V.; De Berardis, D.; Maina, G.; Martinotti, G. Internet Gaming Disorders and Early Onset Psychosis in Young People: A Case Study and Clinical Observations. Int. J. Environ. Res. Public Health 2023, 20, 3920. [Google Scholar] [CrossRef]
- Dong, G.; Li, H.; Wang, L.; Potenza, M.N. Cognitive control and reward/loss processing in Internet gaming disorder: Results from a comparison with recreational Internet game-users. Eur. Psychiatry 2017, 44, 30–38. [Google Scholar] [CrossRef]
- Dong, G.; Lin, X.; Potenza, M.N. Decreased functional connectivity in an executive control network is related to impaired executive function in Internet gaming disorder. Prog. Neuro-Psychopharmacol. Biol. Psychiatry 2015, 57, 76–85. [Google Scholar] [CrossRef]
- Wang, Y.; Wu, L.; Wang, L.; Zhang, Y.; Du, X.; Dong, G. Impaired decision-making and impulse control in Internet gaming addicts: Evidence from the comparison with recreational Internet game users. Addict. Biol. 2017, 22, 1610–1621. [Google Scholar] [CrossRef]
- Kool, W.; McGuire, J.T.; Wang, G.J.; Botvinick, M.M. Neural and behavioral evidence for an intrinsic cost of self-control. PLoS ONE 2013, 8, e72626. [Google Scholar] [CrossRef]
- King, D.L.; Chamberlain, S.R.; Carragher, N.; Billieux, J.; Stein, D.; Mueller, K.; Potenza, M.N.; Rumpf, H.J.; Saunders, J.; Starcevic, V.; et al. Screening and assessment tools for gaming disorder: A comprehensive systematic review. Clin. Psychol. Rev. 2020, 77, 101831. [Google Scholar] [CrossRef]
- Brand, M.; Rumpf, H.J.; King, D.L.; Potenza, M.N.; Wegmann, E. Clarifying terminologies in research on gaming disorder and other addictive behaviors: Distinctions between core symptoms and underlying psychological processes. Curr. Opin. Psychol. 2020, 36, 49–54. [Google Scholar] [CrossRef] [PubMed]
- Long, K.; Zhang, X.; Wang, N.; Lei, H. Heart Rate Variability during Online Video Game Playing in Habitual Gamers: Effects of Internet Addiction Scale, Ranking Score and Gaming Performance. Brain Sci. 2023, 14, 29. [Google Scholar] [CrossRef]
- Rahayu, F.S.; Nugroho, L.E.; Ferdiana, R.; Setyohadi, D.B. Research trend on the use of IT in Digital Addiction: An investigation using a systematic literature review. Future Internet 2020, 12, 174. [Google Scholar] [CrossRef]
- Ahn, H.M.; Chung, H.J.; Kim, S.H. Altered brain reactivity to game cues after gaming experience. Cyberpsychology Behav. Soc. Netw. 2015, 18, 474–479. [Google Scholar] [CrossRef] [PubMed]
- Liu, L.; Yip, S.W.; Zhang, J.T.; Wang, L.J.; Shen, Z.J.; Liu, B.; Ma, S.S.; Yao, Y.W.; Fang, X.Y. Activation of the ventral and dorsal striatum during cue reactivity in Internet gaming disorder. Addict. Biol. 2017, 22, 791–801. [Google Scholar] [CrossRef]
- Nie, J.; Zhang, W.; Chen, J.; Li, W. Impaired inhibition and working memory in response to internet-related words among adolescents with internet addiction: A comparison with attention-deficit/hyperactivity disorder. Psychiatry Res. 2016, 236, 28–34. [Google Scholar] [CrossRef]
- Zhou, Z.; Yuan, G.; Yao, J. Cognitive biases toward Internet game-related pictures and executive deficits in individuals with an Internet game addiction. PLoS ONE 2012, 7, e48961. [Google Scholar] [CrossRef]
- Zhang, Y.; Lin, X.; Zhou, H.; Xu, J.; Du, X.; Dong, G. Brain activity toward gaming-related cues in internet gaming disorder during an addiction Stroop task. Front. Psychol. 2016, 7, 714. [Google Scholar] [CrossRef]
- Hong, S.J.; Lee, D.; Park, J.; Namkoong, K.; Lee, J.; Jang, D.P.; Lee, J.E.; Jung, Y.C.; Kim, I.Y. Altered Heart Rate Variability During Gameplay in Internet Gaming Disorder: The Impact of Situations During the Game. Front. Psychiatry 2018, 9, 429. [Google Scholar] [CrossRef]
- Riccio, C.A.; Reynolds, C.R.; Lowe, P.; Moore, J.J. The continuous performance test: A window on the neural substrates for attention? Arch. Clin. Neuropsychol. 2002, 17, 235–272. [Google Scholar] [CrossRef]
- Riccio, C.A.; Reynolds, C.R.; Lowe, P.A. Clinical Applications of Continuous Performance Tests: Measuring Attention and Impulsive Responding in Children and Adults; John Wiley & Sons Inc: Hoboken, NJ, USA, 2001. [Google Scholar]
- Stevens, M.W.; Dorstyn, D.; Delfabbro, P.H.; King, D.L. Global prevalence of gaming disorder: A systematic review and meta-analysis. Aust. N. Z. J. Psychiatry 2021, 55, 553–568. [Google Scholar] [CrossRef] [PubMed]
- Young, K.S.; De Abreu, C.N. Internet Addiction: A Handbook and Guide to Evaluation and Treatment; John Wiley & Sons: Hoboken, NJ, USA, 2010. [Google Scholar]
- Widyanto, L.; McMurran, M. The psychometric properties of the internet addiction test. Cyberpsychology Behav. 2004, 7, 443–450. [Google Scholar] [CrossRef] [PubMed]
- Lee, K.; Lee, H.-K.; Gyeong, H.; Yu, B.; Song, Y.-M.; Kim, D. Reliability and validity of the Korean version of the Internet Addiction Test among college students. J. Korean Med. Sci. 2013, 28, 763–768. [Google Scholar] [CrossRef]
- Kuss, D.J.; Griffiths, M.D.; Pontes, H.M. Chaos and confusion in DSM-5 diagnosis of Internet Gaming Disorder: Issues, concerns, and recommendations for clarity in the field. J. Behav. Addict. 2017, 6, 103–109. [Google Scholar] [CrossRef] [PubMed]
- American Psychiatric Association. Diagnostic and Statistical Manual of Mental Disorders: DSM-5™, 5th ed.; American Psychiatric Association: Washington, DC, USA, 2013; Volume 5. [Google Scholar]
- Petry, N.M.; O’Brien, C.P. Internet gaming disorder and the DSM-5. Addiction 2013, 108, 1186–1187. [Google Scholar] [CrossRef] [PubMed]
- Saunders, J.B.; Aasland, O.G.; Babor, T.F.; de la Fuente, J.R.; Grant, M. Development of the Alcohol Use Disorders Identification Test (AUDIT): WHO Collaborative Project on Early Detection of Persons with Harmful Alcohol Consumption—II. Addiction 1993, 88, 791–804. [Google Scholar] [CrossRef] [PubMed]
- Patton, J.H.; Stanford, M.S.; Barratt, E.S. Factor structure of the Barratt impulsiveness scale. J. Clin. Psychol. 1995, 51, 768–774. [Google Scholar] [CrossRef]
- Beck, A.T.; Epstein, N.; Brown, G.; Steer, R.A. An inventory for measuring clinical anxiety: Psychometric properties. J. Consult. Clin. Psychol. 1988, 56, 893–897. [Google Scholar] [CrossRef]
- Beck, A.T.; Ward, C.H.; Mendelson, M.; Mock, J.; Erbaugh, J. An inventory for measuring depression. Arch. Gen. Psychiatry 1961, 4, 561–571. [Google Scholar] [CrossRef]
- Ward, M.F.; Wender, P.H.; Reimherr, F.W. The Wender Utah Rating Scale: An aid in the retrospective diagnosis of childhood attention deficit hyperactivity disorder. Am. J. Psychiatry 1993, 150, 885–890. [Google Scholar] [CrossRef]
- Conners, C.K.; Epstein, J.N.; Angold, A.; Klaric, J. Continuous performance test performance in a normative epidemiological sample. J. Abnorm. Child. Psychol. 2003, 31, 555–562. [Google Scholar] [CrossRef]
- Keith Conners, C.; Sitarenios, G.; Ayearst, L. Conners’ Continuous Performance Test; Multi-Health Systems: North Tonawanda, NY, USA, 2018. [Google Scholar]
- Pan, J.; Tompkins, W.J. A real-time QRS detection algorithm. IEEE Trans. Biomed. Eng. 1985, 32, 230–236. [Google Scholar] [CrossRef]
- Singh, D.; Vinod, K.; Saxena, S.C. Sampling frequency of the RR interval time series for spectral analysis of heart rate variability. J. Med. Eng. Technol. 2004, 28, 263–272. [Google Scholar] [CrossRef] [PubMed]
- Sayers, B.M. Analysis of heart rate variability. Ergonomics 1973, 16, 17–32. [Google Scholar] [CrossRef] [PubMed]
- Lee, S.; Hwang, H.B.; Park, S.; Kim, S.; Ha, J.H.; Jang, Y.; Hwang, S.; Park, H.K.; Lee, J.; Kim, I.Y. Mental Stress Assessment Using Ultra Short Term HRV Analysis Based on Non-Linear Method. Biosensors 2022, 12, 465. [Google Scholar] [CrossRef]
- Forte, G.; Favieri, F.; Casagrande, M. Heart rate variability and cognitive function: A systematic review. Front. Neurosci. 2019, 13, 710. [Google Scholar] [CrossRef] [PubMed]
- Kouneiher, F.; Charron, S.; Koechlin, E. Motivation and cognitive control in the human prefrontal cortex. Nat. Neurosci. 2009, 12, 939–945. [Google Scholar] [CrossRef]
- Cavanagh, J.F.; Frank, M.J. Frontal theta as a mechanism for cognitive control. Trends Cogn. Sci. 2014, 18, 414–421. [Google Scholar] [CrossRef]
- Singh, A.; Richardson, S.P.; Narayanan, N.; Cavanagh, J.F. Mid-frontal theta activity is diminished during cognitive control in Parkinson’s disease. Neuropsychologia 2018, 117, 113–122. [Google Scholar] [CrossRef]
- Ha, J.; Park, S.; Im, C.H.; Kim, L. Classification of Gamers Using Multiple Physiological Signals: Distinguishing Features of Internet Gaming Disorder. Front. Psychol. 2021, 12, 714333. [Google Scholar] [CrossRef]
- Kim, J.; Park, J.; Park, Y.M.; Jang, D.; Namkoong, K.; Jung, Y.-C.; Kim, I.Y. Diminished frontal theta activity during gaming in young adults with internet gaming disorder. Front. Neurosci. 2019, 13, 1183. [Google Scholar] [CrossRef] [PubMed]
- Kardan, O.; Adam, K.C.S.; Mance, I.; Churchill, N.W.; Vogel, E.K.; Berman, M.G. Distinguishing cognitive effort and working memory load using scale-invariance and alpha suppression in EEG. Neuroimage 2020, 211, 116622. [Google Scholar] [CrossRef]
- Wianda, E.; Ross, B. The roles of alpha oscillation in working memory retention. Brain Behav. 2019, 9, e01263. [Google Scholar] [CrossRef] [PubMed]
- Katahira, K.; Yamazaki, Y.; Yamaoka, C.; Ozaki, H.; Nakagawa, S.; Nagata, N. EEG Correlates of the Flow State: A Combination of Increased Frontal Theta and Moderate Frontocentral Alpha Rhythm in the Mental Arithmetic Task. Front. Psychol. 2018, 9, 300. [Google Scholar] [CrossRef] [PubMed]
- Tzagarakis, C.; Thompson, A.; Rogers, R.D.; Pellizzer, G. The Degree of Modulation of Beta Band Activity During Motor Planning Is Related to Trait Impulsivity. Front. Integr. Neurosci. 2019, 13, 1. [Google Scholar] [CrossRef]
- Hansen, A.L.; Johnsen, B.H.; Thayer, J.F. Vagal influence on working memory and attention. Int. J. Psychophysiol. 2003, 48, 263–274. [Google Scholar] [CrossRef]
- Segerstrom, S.C.; Nes, L.S. Heart rate variability reflects self-regulatory strength, effort, and fatigue. Psychol. Sci. 2007, 18, 275–281. [Google Scholar] [CrossRef] [PubMed]
- Silvani, A.; Calandra-Buonaura, G.; Dampney, R.A.; Cortelli, P. Brain-heart interactions: Physiology and clinical implications. Philos. Trans. A Math. Phys. Eng. Sci. 2016, 374, 20150181. [Google Scholar] [CrossRef]
- Thayer, J.F.; Hansen, A.L.; Saus-Rose, E.; Johnsen, B.H. Heart rate variability, prefrontal neural function, and cognitive performance: The neurovisceral integration perspective on self-regulation, adaptation, and health. Ann. Behav. Med. 2009, 37, 141–153. [Google Scholar] [CrossRef]
- Sakurai, K.; Li, H.; Inamura, N.; Masuoka, N.; Hisatsune, T. Relationship between elevated impulsivity and cognitive declines in elderly community-dwelling individuals. Sci. Rep. 2020, 10, 21032. [Google Scholar] [CrossRef]
- Heatherton, T.F.; Wagner, D.D. Cognitive neuroscience of self-regulation failure. Trends Cogn. Sci. 2011, 15, 132–139. [Google Scholar] [CrossRef] [PubMed]
- Overmeyer, R.; Fürtjes, S.; Ersche, K.D.; Ehrlich, S.; Endrass, T. Self-regulation is negatively associated with habit tendencies: A validation of the German Creature of Habit Scale. Personal. Individ. Differ. 2020, 163, 110029. [Google Scholar] [CrossRef]
- Safarina, N.; Halimah, L. Self-control and online game addiction in early adult gamers. J. Phys. Conf. Ser. 2019, 1375, 012094. [Google Scholar] [CrossRef]
- Yang, S.Y. Effects of Self-efficacy and Self-control on Internet Addiction in Middle School Students: A Social Cognitive Theory-Driven Focus on the Mediating Influence of Social Support. Child. Health Nurs. Res. 2020, 26, 357–365. [Google Scholar] [CrossRef]


| Control (n = 30) | Gaming Disorder (n = 39) | p-Value | |
|---|---|---|---|
| Young internet addiction test | 36.72 (9.17) | 61.41 (7.74) | 0.001 ** |
| Korean internet gaming disorder scale | 65.91 (12.42) | 83.88 (12.53) | 0.001 ** |
| Age, years | 22.81 (2.46) | 23.07 (2.48) | 0.660 |
| Full scale intelligence Quotient | 111.72 (10.26) | 110.57 (14.95) | 0.713 |
| Beck depression inventory | 7.88 (5.94) | 9.76 (7.64) | 0.261 |
| Beck anxiety inventory | 4.97 (5.63) | 7.83 (6.45) | 0.054 |
| Barratt impulsiveness scale—non-planning | 21.53 (3.15) | 22.49 (3.48) | 0.235 |
| Barratt impulsiveness scale—motor | 14.5 (3.08) | 15.05 (3.64) | 0.503 |
| Barratt impulsiveness scale—attentional | 13.06 (2.87) | 14.85 (3.04) | 0.014 * |
| Alcohol use disorder identification test | 9.28 (5.3) | 10.39 (6.99) | 0.465 |
| Conner’s adult hyperactivity restlessness | 47.78 (4.21) | 48 (5.48) | 0.855 |
| Wender Utah rating sale for ADHD | 24.72 (17.42) | 27.17 (17.68) | 0.561 |
Disclaimer/Publisher’s Note: The statements, opinions and data contained in all publications are solely those of the individual author(s) and contributor(s) and not of MDPI and/or the editor(s). MDPI and/or the editor(s) disclaim responsibility for any injury to people or property resulting from any ideas, methods, instructions or products referred to in the content. |
© 2024 by the authors. Licensee MDPI, Basel, Switzerland. This article is an open access article distributed under the terms and conditions of the Creative Commons Attribution (CC BY) license (https://creativecommons.org/licenses/by/4.0/).
Share and Cite
Choi, J.; Choi, Y.; Jung, Y.-C.; Lee, J.; Lee, J.; Park, E.; Kim, I.Y. Effects of Game-Related Tasks for the Diagnosis and Classification of Gaming Disorder. Biosensors 2024, 14, 42. https://doi.org/10.3390/bios14010042
Choi J, Choi Y, Jung Y-C, Lee J, Lee J, Park E, Kim IY. Effects of Game-Related Tasks for the Diagnosis and Classification of Gaming Disorder. Biosensors. 2024; 14(1):42. https://doi.org/10.3390/bios14010042
Chicago/Turabian StyleChoi, Jeongbong, Youngseok Choi, Young-Chul Jung, Jeyeon Lee, Jongshill Lee, Eunkyoung Park, and In Young Kim. 2024. "Effects of Game-Related Tasks for the Diagnosis and Classification of Gaming Disorder" Biosensors 14, no. 1: 42. https://doi.org/10.3390/bios14010042
APA StyleChoi, J., Choi, Y., Jung, Y.-C., Lee, J., Lee, J., Park, E., & Kim, I. Y. (2024). Effects of Game-Related Tasks for the Diagnosis and Classification of Gaming Disorder. Biosensors, 14(1), 42. https://doi.org/10.3390/bios14010042