Abstract
In this work, we obtained three new phosphorescent iridium complexes (Ir1–Ir3) of general stoichiometry [Ir(N^C)2(N^N)]Cl decorated with oligo(ethylene glycol) fragments to make them water-soluble and biocompatible, as well as to protect them from aggregation with biomolecules such as albumin. The major photophysical characteristics of these phosphorescent complexes are determined by the nature of two cyclometallating ligands (N^C) based on 2-pyridine-benzothiophene, since quantum chemical calculations revealed that the electronic transitions responsible for the excitation and emission are localized mainly at these fragments. However, the use of various diimine ligands (N^N) proved to affect the quantum yield of phosphorescence and allowed for changing the complexes’ sensitivity to oxygen, due to the variations in the steric accessibility of the chromophore center for O2 molecules. It was also found that the N^N ligands made it possible to tune the biocompatibility of the resulting compounds. The wavelengths of the Ir1–Ir3 emission maxima fell in the range of 630–650 nm, the quantum yields reached 17% (Ir1) in a deaerated solution, and sensitivity to molecular oxygen, estimated as the ratio of emission lifetime in deaerated and aerated water solutions, displayed the highest value, 8.2, for Ir1. The obtained complexes featured low toxicity, good water solubility and the absence of a significant effect of biological environment components on the parameters of their emission. Of the studied compounds, Ir1 and Ir2 were chosen for in vitro and in vivo biological experiments to estimate oxygen concentration in cell lines and tumors. These sensors have demonstrated their effectiveness for mapping the distribution of oxygen and for monitoring hypoxia in the biological objects studied.
1. Introduction
The development and application of transition metal phosphorescent complexes, such as non-invasive molecular oxygen sensors, is a topical area of research. The possibility of using such complexes in biomedical experiments is particularly important, since tracking changes in O2 concentration is a fundamental issue in the studies of metabolic processes, as well as for diagnosing various pathologies and evaluating the efficiency of the therapy used [1,2,3,4]. The sensory response of phosphorescent complexes to the presence of molecular oxygen is based on the effective energy transfer from the excited triplet state of phosphors to the ground triplet state of O2 molecules to give phosphorescence quenching, accompanied by a decrease in emission intensity and in the lifetime of the excited state [5,6,7].
In early studies, phosphorescence intensity was actively used as an analytical signal to determine oxygen concentration. In the ratiometric approach, the sensor response was quantified by comparison of the phosphorescence intensity with that of a certain oxygen-independent external or internal standard; fluorescence emission was commonly used as the latter. However, this approach makes analytical systems more complicated (at least two emitters have to be used in the measurements) and suffers from the dependence of the results on the optical properties of the samples under study, as well as the possible influence of different factors, other than oxygen concentration, on the luminescence of the reference emitter (pH, temperature, viscosity, etc.). The lifetime response of oxygen concentration variations is free from the above drawbacks, does not depend on the sensor concentration that makes phosphorescence lifetime measurements more reliable and results in a wide use of phosphoresce lifetime imaging (PLIM) in different analytical and biomedical applications, including oxygen sensing [7,8,9,10].
For the successful application of phosphorescent oxygen sensors in biology, they should be soluble in physiological (aqueous) media, demonstrate low toxicity and high stability and exhibit good photophysical characteristics (high quantum yield, sensitivity to the presence of molecular oxygen, emission and excitation in a required wavelength range). It is also worth noting that, in order to verify the practicable applicability of oxygen sensors in biomedical experiments, it is necessary to test them in various model biological media, since different factors, such as variations in pH values, temperature, salinity, viscosity, ions and the presence of biomacromolecules (primarily albumin, which has in its structure so-called “hydrophobic pockets”), can significantly affect the photophysical characteristics of the sensor.
Among the most effective phosphorescent oxygen sensors which are also commercially available, it is worth mentioning those obtained in the research groups of Sergei Vinogradov (University of Pennsylvania) [11,12,13,14,15,16,17,18,19,20] and Dmitri Papkovsky (University College Cork) [21,22,23,24,25,26,27,28,29,30,31,32,33,34,35]. These sensors are based on Pt and Pd porphyrin chromophores, which are highly sensitive to oxygen and also protected from the external effects of the biological environment by either being encapsulated within dendrimer layers and subsequently modified by attaching large, linear poly(ethylene glycol) (PEG) chains [11,12,13,14,15,16,17,18,19,20] or by embedding the chromophore into hydrophilic nanoparticles [21,22,23,24,25,26,27,28,29,30,31,32,33,34,35]. However, despite their significant advantages, these sensors are used predominantly to measure the oxygen concentration in the extracellular environment due to the impenetrability of the cell membrane and their instability in an intracellular environment. Cell penetration can be increased by chromophore functionalization with relatively small glucose moiety [36], but it has been shown [37] that the obtained compounds display partial aggregation in aqueous solutions that is undesirable for biological applications. Platinum porphyrins’ conjugation with peptides [38] made it possible to design a cell-penetrating oxygen sensor, but this was based on rather complicated chemistry. It is also worth noting that porphyrin emitters also have rather high lifetimes of their excited states (from tens to hundreds of microseconds) that considerably lengthen the time of information acquisition compared with some other phosphorescent compounds, e.g., iridium complexes, which display essentially shorter lifetimes from hundreds of nanoseconds to a few microseconds.
Exploration of Ir(III) orthometallated complexes as oxygen sensors has a rather long and rich history, beginning with a key publication [39] demonstrating the applicability of this type of emitter for the detection of hypoxia in biomedical research. Later (see a mini-review [40] and recent review [41] for a complete list of references), in the works of Dr. S. Tobita et al. and several other research teams [36,42,43,44,45,46,47], it has been demonstrated that Ir(III) molecular emitters can be successfully applied in in vitro and in vivo biomedical studies to qualitatively detect hypoxia in the tumor microenvironment [45,48] and to measure oxygen concentration in cell cultures by using a ratiometric approach [49] or time-resolved techniques, such as PLIM [50,51]. Moreover, in some cases, directed subcellular localization is possible; for example, in mitochondria [44,52], which makes it possible to track (especially with simultaneous FLIM imaging of the NADH and other coenzymes) metabolic processes and their variations with changes in nutritional conditions, oxygenation, etc. Significantly shorter values of the lifetimes of iridium complexes compared with the platinum and palladium porphyrins (by one or two orders of magnitude) allow for much faster signal accumulation in PLIM experiments, making it possible to increase the acquisition rate and/or real-time image resolution. Nevertheless, it must be mentioned that the iridium chromophores display lower brightness compared with the above-mentioned Pt and Pd porphyrins, which is determined not by their quantum yields (which are quite comparable), but by the lower extinction coefficient of these samples. Nevertheless, the versatility of the photophysical characteristics of iridium complexes achieved by variations in the donor properties of the ligands and simpler synthetic methods open the way for their further modification and vectorization, making Ir(III) complexes the compounds of choice for the preparation of oxygen sensors for particular biological studies.
As for many other phosphorescent transition metal complexes, their hydrophobicity and insolubility in aqueous media remain issues to be solved. One of the useful approaches consists of chromophore conjugation with synthetic [45] or natural [53,54] water-soluble polymers. Recently, we have designed and synthesized a number of oxygen sensors based on iridium complexes [52,55,56,57,58,59,60,61,62,63,64,65], which exhibit good sensitivity to molecular oxygen. The chromophores in these compounds are shielded from interaction with the bio-environment by relatively short oligo(ethylene glycol) tails, which makes intracellular internalization possible and to simultaneously impart water solubility and increase the biocompatibility of these molecules.
In this article, we present the synthesis, characterization and photophysical study of three novel phosphorescent [Ir(N^C)2(N^N)]Cl complexes (Ir1–Ir3) containing the same N^C metallated and different N^N diimine ligands. The oxygen-sensing properties of the most effective emitters (Ir1 and Ir2) were investigated in model physiological media and in living cells, as well as through in vivo experiments in a mice tumor model by using time-resolved phosphorescent lifetime imaging.
2. Materials and Methods
NMR spectra (1D 1H, 2D 1H-1H COSY and NOESY) were recorded on a Bruker 400 MHz Avance (Billerica, MA, USA); chemical shift values were referenced to the solvent residual signals. Mass spectra were recorded on a Bruker maXis HRMS-ESI-QTOF in the ESI+ mode.
Reagents: methyl 6-(benzo[b]thiophen-2-yl)nicotinate [66], 2,5,8,12,15,18-hexaoxanonadecan-10-amine [67] and N^N1-N^N3 ligands [52,60,62] were obtained according to the published procedures. The synthesis of 6-(benzo[b]thiophen-2-yl)nicotinic acid, N^C ligand, [Ir2(N^C)4Cl2] dimer and the target complexes Ir1–Ir3 are described in the Supplementary Information file. Other solvents and reagents were received form BLD Pharmatech (Shanghai, China), Merck (Darmstadt, Germany), Vekton (St. Petersburg, Russia) and used without additional purification.
Details of synthetic and separation procedures, photophysical experiments and computational studies, as well as data concerning the description of installations and methods for conducting biological experiments, are given in the Supplementary Materials.
3. Results and Discussion
3.1. Synthesis and Characterization
A derivative of pyridine–benzothiophene was chosen as a cyclometallating ligand, since it is known that iridium complexes based on it exhibit emissions in the red region of the spectrum [68,69,70], which can be useful for in vivo studies, since such luminescence will be within the transparency window of biological tissues (≥600 nm).
To impart water solubility, biocompatibility and low toxicity to the target compounds, as well as to protect them from nonspecific interactions with biomolecules, we introduced short-branched oligo(ethylene glycol) substituents into the structure of the cyclometallating and diimine ligands. The scheme of the corresponding modification and obtaining a new N^C ligand is given below (Scheme 1), while the modification reactions of the corresponding N^N ligands are described in the previous literature [52,60,62].
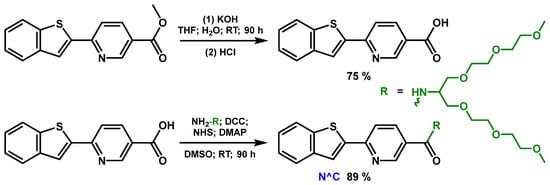
Scheme 1.
Synthetic scheme of the new ligand N^C.
In the next stage of the synthesis (Scheme 2, upper part), upon the reaction of this cyclometallating ligand N^C and iridium(III) chloride, we isolated a new dimeric complex [Ir2(N^C)4Cl2], which we further used as a starting material in obtaining the target phosphorescent compounds, Ir1–Ir3. The synthesis of the target complexes (Scheme 2, bottom part) was carried out by replacing the labile chloride ligands in the [Ir2(N^C)4Cl2] dimer with diimine N^N chelates, with simultaneous dissociation of the dimer, to obtain the [Ir(N^C)2(N^N#)]Cl complexes in good preparative yields (59–95%), where the N^N# diimine ligands were also modified with oligo(ethylene glycol) residues.
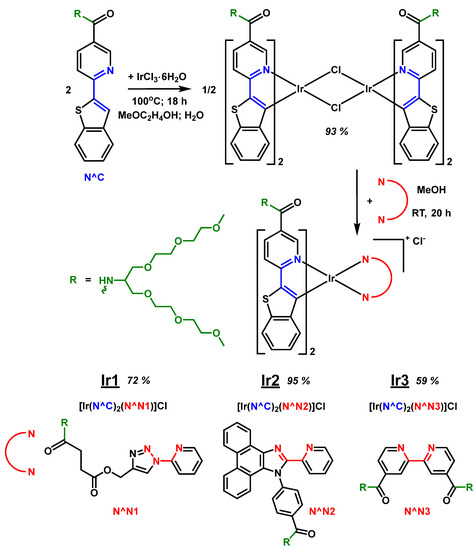
Scheme 2.
Scheme of synthesis of new Ir(III) dimer [Ir2(N^C)4Cl2] and new complexes Ir1–Ir3.
The compounds obtained (ligands, iridium(III) dimer and the target iridium complexes) were comprehensively characterized by NMR spectroscopy and mass spectrometry. It should be noted that, due to the presence of a large number of oligo(ethylene glycol) substituents in the structure of the target complexes, we failed to obtain these compounds either in the form of high-quality single crystals, suitable for X-ray diffraction analysis, or as a polycrystalline material, suitable for elemental analysis of the CHNS content. Nevertheless, the number, multiplicity, location and integral intensities of 1H signals in 1D NMR spectra, as well as their cross-correlations in 2D 1H-1H COSY and NOESY NMR spectra, made it possible to reliably establish the structure and composition of these compounds (Figures S1–S17 in the Supplementary Materials). Additionally, these conclusions were confirmed by high-resolution ESI+ mass spectrometry; see Figures S3–S18. In the obtained mass spectra, the main signals corresponded to the molecular ions of these complexes, both in pure form and with the addition of H+ or Na+ cations. The isotopic distribution patterns were also in excellent agreement with those calculated for these particles.
We also carried out quantum chemical calculations, which included optimization of the ground state structure (as an example, the optimized structure of the Ir1–0 complex is shown in Figure 1). Note that for the sake of simplicity in the optimization procedure, we used a model structural pattern, which differs from the structures of the Ir1–Ir3 compounds in that oligo(ethylene glycol) groups were replaced by methyl substituents to reduce the calculation time. It should be noted that such substitution is reasonable, since neither oligo(ethylene glycol) nor methyl substituents noticeably affect the central core structure and photophysical characteristics, being remote from the chromophoric center and having a similar nature from the viewpoint of donor–acceptor properties. The optimized structures for the Ir2 and Ir3 complexes are shown in Figures S22 and S23 in the Supplementary Materials. The obtained characteristics of the optimized structures (ligand disposition in the coordination octahedron, bond lengths and angles) are not exceptional and fit the structures of closely analogous complexes well, synthesized and characterized previously [68,69,70]. The obtained structural parameters of the optimized patterns are summarized in Tables S9–S11; see Supplementary Materials. It is also important to note that the optimized structural motifs of Ir1–Ir3 are in complete agreement with the data of proton NMR spectroscopy in terms of the ligand environment symmetry and intramolecular non-bonding proton contacts observed in the NOESY spectra, which additionally confirm the correctness of the complexes’ composition and structure determination by this method.
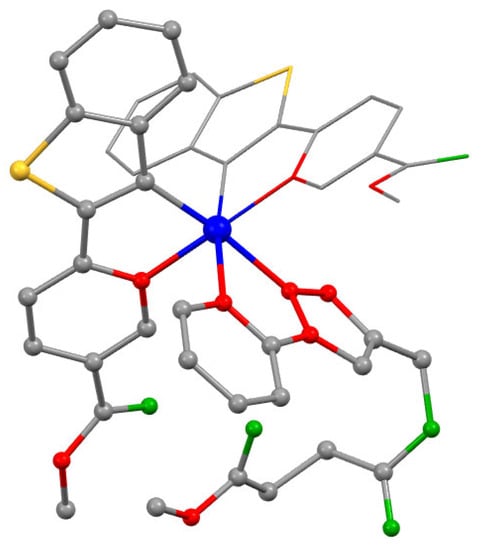
Figure 1.
Optimized structure of the model Ir1–0 complex (hydrogen atoms are omitted for clarity). The calculations have been simplified by substitution of OEG pendants in Ir1 complex for methyl groups in Ir1–0 structure. Atom colors: Ir—blue; S—yellow; O—green; N—red; C—gray.
3.2. Photophysical Study
All compounds obtained exhibited luminescence in the red region of the visible spectrum. The absorption and emission spectra of Ir1–Ir3 are shown in Figure 2, and numerical spectroscopic data, together with emission quantum yields and lifetimes in aqueous aerated and deaerated solutions, are summarized in Table 1 and Table S1 (see the Supplementary Materials). The lifetimes were also measured in model physiological media: 0.01M phosphate-buffered saline (PBS) solution (pH = 7.4) containing bovine serum albumin (BSA, 70 µM) and in Dulbecco’s Modified Eagle Medium (DMEM) solution with 10% of fetal bovine serum (FBS).
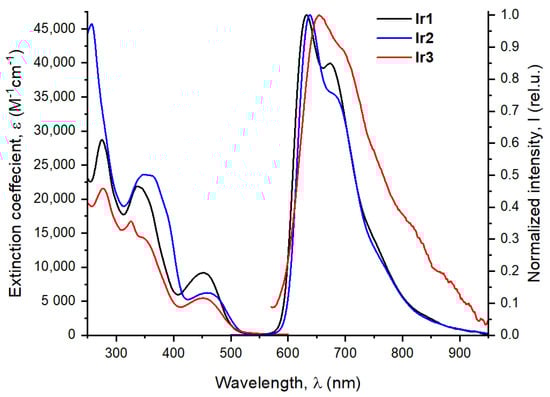
Figure 2.
Absorption and emission spectra for complexes Ir1–Ir3 in water (310 K, λex 365 nm).

Table 1.
Photophysical data for complexes Ir1–Ir3 in aqueous solutions at 310 K.
The absorption spectra of the studied iridium complexes exhibit strong high-energy bands in the range 250–350 nm and low energy absorption at ca. 450 nm with the tail extending below 550 nm. DFT analysis of the absorption spectra (see Tables S3–S8) showed that the observed high-energy bands may be assigned to a combination of the transitions between the aromatic systems of the N^C and N^N ligands with some admixture of the metal to ligand charge transfers (1MLCT). The low-energy bands at ca 450 nm may be associated with intraligand and ligand-to-ligand charge transfer (1LLCT and 1ILCT) localized at two N^C ligands with a minor admixture of 1MLCT transitions to N^C to the N^C ligands. The lowest calculated S0 ⟶ S1 transition, which has a very low oscillator strength, is located well below 500 nm and is associated with electron density transfer to the N^N ligand from N^C ligands and iridium ion.
Ir1–Ir3 demonstrated luminesce in an aqueous solution in the red region of the visible spectrum, showing slightly structured emission bands with the maxima at 632, 638 and 655 nm, respectively; see Figure 2 and Table 1. These complexes displayed large Stokes shifts of ca. 17–200 nm, lifetimes in the microsecond domain and strong sensitivity to the presence of molecular oxygen, is indicative of the triplet nature of the emissive excited state, i.e., phosphorescence. Ir1 and Ir2 exhibit rather intense luminescence with the quantum yields 17.3% and 8.5%, respectively, in a deaerated aqueous solution. On the contrary, Ir3 was a very weak emitter with an emission intensity two orders of magnitude lower compared to its congeners, which makes its application as an oxygen sensor in biological experiments impossible.
The DFT and TD-DFT calculations gave the emission wavelengths, which were in very good agreement with the experimental data (Table S2). Analysis of the nature of emissive transitions (T1 ⟶ S0) for the studied complexes showed that the character of Ir3 emission is essentially different from those revealed for Ir1 and Ir2; see Figure 3 and interfragment charge transfer Tables S4, S6 and S8. In the complexes Ir1 and Ir2, the relaxation processes occur through the 3ILCT and 3MLCT transitions associated with the N^C cyclometallating ligand. For Ir3, the excited-state relaxation is mainly associated with the diimine N^N ligand, and, as a consequence, 3MLCT (N^N ⟶ Ir) and 3LLCT (N^N ⟶ N^C) transitions are observed. Such a significant difference in the nature of the phosphorescence processes is most probably responsible for the strong difference in emission quantum yield (of the order of 0.1% in deaerated water) of Ir3 as compared to Ir1 and Ir2. One of the possible explanations of this observation may be the higher contribution of rotational non-radiative channels to excited-state relaxation for Ir3 due to the presence of two {–C(O)NHR} substituents at the diimine ligand compared to only one substituent at the N^C ligands in Ir1 and Ir2.
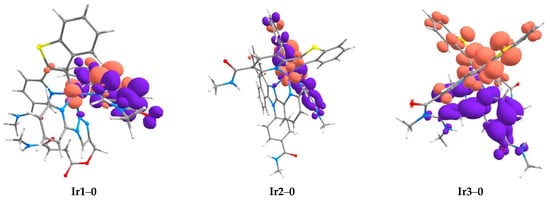
Figure 3.
Natural transition orbitals (NTO) for T1 ⟶ S0 transitions in Ir1–0, Ir2–0 and Ir3–0. Violet and terracotta colors show decrease and increase in electron density, respectively. The calculations have been simplified by substitution of OEG pendants for methyl groups in the structure of the complexes. Atom colors: Ir—lilac; S—yellow; O—red; N—blue; C—gray, H—white.
The noticeably higher phosphorescence quantum yields of Ir1 and Ir2, as well as their high sensitivity to the variations in molecular oxygen concentration in solution, led us to choose these compounds for the further studies of their sensor properties and their applicability as luminescent oxygen probes in biosystems. To calibrate the dependence of Ir1 and Ir2 excited state lifetimes on oxygen concentration, we carried out the measurements in water and in model biological solutions containing typical components of intracellular media: PBS buffer with the addition of bovine serum albumin—BSA and DMEM with the addition of 10% fetal bovine serum—FBS; see Table 1 and Figure 4. The experiments in the model solutions make it possible to reveal the effect of salinity, pH and the presence of the main protein component of plasma (albumin) on the sensors’ characteristics. The obtained data (Table S1) indicate lifetime independence on pH and media salinity. Aqueous solutions were studied for comparison.
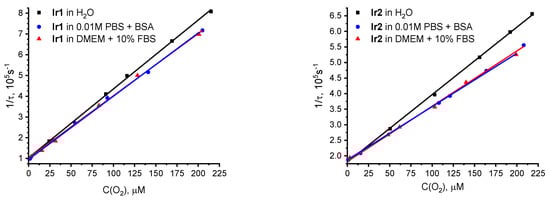
Figure 4.
Stern–Volmer oxygen-quenching plots of Ir1 (left) and Ir2 (right) in aqueous solution, 0.01 M PBS (pH 7.4) with 70 µM of BSA and in DMEM with 10% of FBS. T = 37 °C, excitation at 355 nm.
The obtained calibration curves (Figure 4) indicated that the growth (DMEM + 10 % FBS) and model biological media (PBS with 70 mM BSA) had an almost identical effect on the behavior of these sensors. The slope of the Stern–Volmer curves in these media for both complexes coincided under the limits of experimental uncertainty and obviously differed from that in pure water. This observation can be explained by an increase in solution viscosity in the presence of biological macromolecules that reduces the rate of oxygen diffusion in the sample under study and causes a drop in the Stern–Volmer quenching constant. It is also impossible to exclude a reversible non-covalent interaction of the chromophores with hydrophobic pockets of albumin, which may shield the complexes from collisions with oxygen molecules that increase the observed excited state lifetime. The obtained data indicate that the oligo(ethylene glycol) moieties are unable to completely shield the chromophore from the effects of the bio-environment, which in turn implies the use of calibration curves obtained in model physiological media for the estimation of oxygen concentration in biological samples. It is worth noting that Ir1 and Ir2 demonstrated high dark stability and low photobleaching rate under irradiation with 355 and 365 nm.
Thus, the obtained data clearly indicate that the phosphorescent complexes Ir1 and Ir2 are suitable for application in functional bioimaging as promising oxygen sensors, since they exhibit appreciable quantum yields, high sensitivity to the presence of molecular oxygen and good solubility and stability in aqueous solutions, including model biological media.
3.3. Biological Experiments
Using the MTT assay, it was found that all the compounds tested were non-toxic for cultured cancer cells CT26 (murine colorectal carcinoma cell line) and HCT116 (human colorectal carcinoma cell line) in the concentration range studied. Upon incubation with the complexes for 24 h, more than 90% of tumor cells remained viable at concentrations of 150 μM and below (Figure 5 and Figure S24 in Supplementary Materials).
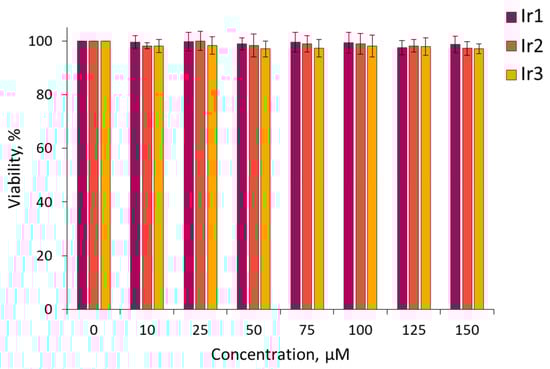
Figure 5.
MTT assay for viability of CT26 cells after incubation with Ir1–Ir3 complexes. Mean ± SD. N = 3 repeats by 10 wells.
Next, the ability of Ir1, Ir2 and Ir3 to accumulate in living cancer cells was investigated. As mentioned above, Ir3 featured a very low-emission quantum yield that gave an extremely weak luminescence signal inside cells, thus making this complex unsuitable for further biological testing. Using laser scanning microscopy, it was shown that Ir1 and Ir2 successfully penetrated into cultured cancer cells (Figure 6); the phosphorescence intensity of both complexes increased stepwise in the time period from 1 to 24 h of incubation. Complex Ir2 displayed more intense luminescence compared to Ir1 under normoxic conditions, due to a higher extinction coefficient at 405 nm (excitation wavelength in cell internalization experiments). Inside the cells, the complexes were distributed heterogeneously as granules in the cytoplasm and also as a homogenous fraction in the cytosol.
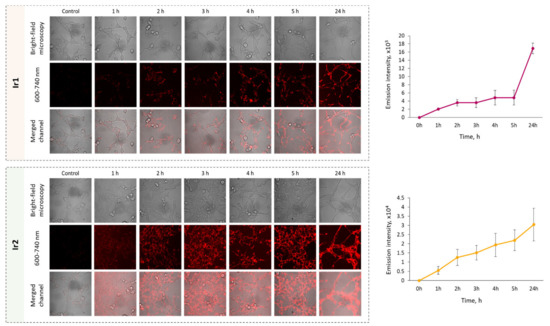
Figure 6.
Dynamics of internalization of Ir1 and Ir2 complexes into CT26 cells in vitro. Control—cells without the complexes. Mean ± SD. N = 50–70 cells. Scale bar = 50 µm.
After 3 h of incubation, the subcellular localization of Ir1 and Ir2 was analyzed using co-staining with organelle-specific dyes (Figure 7). It was found that both complexes colocalized moderately with lysosomes (M1 = 0.584 for Ir1 and M1 = 0.769 for Ir2) and almost did not colocalize with mitochondria (M1 = 0.236 for Ir1, M1 = 0.316 for Ir2).
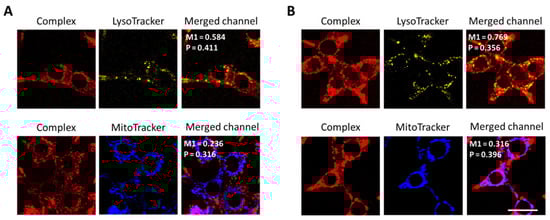
Figure 7.
Colocalization of Ir1 (A) and Ir2 (B) complexes with cell organelles. The signal of the complexes was detected in the range 600–740 nm, lysosomes were visualized using a LysoTracker Yellow HCK-123 (detected in the range 520–570 nm) and mitochondria with MitoTracker 405 Blue (detected in the range 420–470 nm). The figures show the Pearson (P) and Manders (M1) colocalization coefficients. Scale bar = 20 µm.
In order to assess the applicability of the Ir1 and Ir2 sensors for determination of the oxygen concentration inside cells, we conducted PLIM experiments, both under conditions of normal oxygenation and hypoxia simulation. In the course of the imaging experiments, we did not observe emission intensity degradation that is indicative of the sensors’ stability in physiological media. These experiments demonstrated that upon modeling hypoxia, the phosphorescence lifetime of the Ir1 and Ir2 complexes increased by approximately two times—from 3.8 µs and 3.5 µs to 8.1 µs and 6.3 µs, respectively, indicating the high sensitivity of both complexes localized in cell cytoplasm to variations of oxygen content (Figure 8). It also should be noted that the difference between normoxic and hypoxic phosphorescence lifetimes were slightly more pronounced for Ir1 (4.3 µs) than for Ir2 (2.8 µs), and therefore the Ir1 complex was used for further in vivo testing on mouse tumor models.
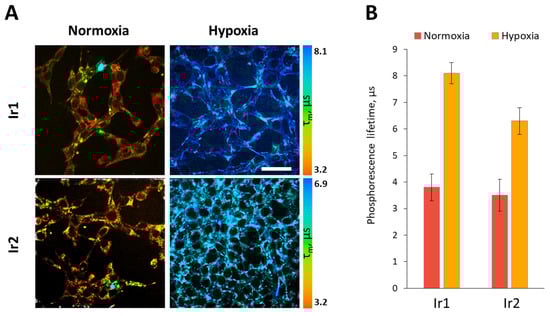
Figure 8.
Phosphorescence lifetime variations of Ir1 and Ir2 complexes in CT26 cells upon modeling of hypoxic conditions in vitro. (A). Representative PLIM images of cells in normoxia and hypoxia. Scale bar = 50 µm. (B) Quantification of the phosphorescence lifetime in the cell cytoplasm. Mean ± SD, N = 50 cells.
After 30 min of local administration of Ir1 into tumors in vivo at the concentration of 250 µM, the phosphorescence signal was detected primarily in the cytoplasm of tumor cells. Inside the cells, the complex was distributed more homogeneously in comparison with cultured cells in vitro. We also checked the intensity of phosphorescence after 3 h and 6h of local sensor administration (Figure S26 in Supplementary Materials) and did not observe significant changes. Therefore, for greater convenience and reliability of the experiment, we used the smallest incubation interval—30 min.
In CT26 tumor cells in vivo, the phosphorescence lifetime of Ir1 was 7.4 ± 0.8 μs on average (Figure 9). In HCT116 tumor xenografts, the phosphorescence lifetime of Ir1 was 8.6 ± 0.5 μs, indicating their more hypoxic status (Figure S25 in Supplementary Materials).
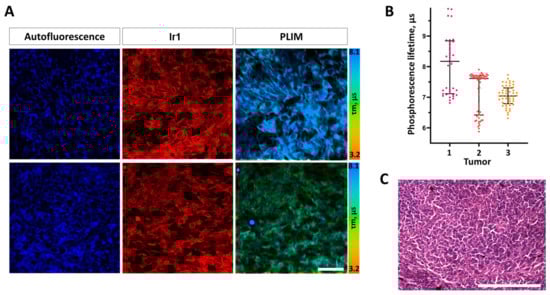
Figure 9.
In vivo PLIM of mouse colorectal tumor CT26 with the Ir1 complex. (A) Representative microscopic images of cellular autofluorescence, Ir1 luminescence intensity and phosphorescence lifetimes in two fields of view. Scale bar = 50 µm. (B) Quantification of the phosphorescence lifetime in tumors. Dot plots for three tumors; each dot corresponds to a single cell. Median (Q1; Q3). (C) Histological verification of the tumor, H&E. Scale bar = 150 µm.
However, within each CT26 tumor, a high heterogeneity of phosphorescence lifetime, and consequently oxygen distribution, was observed at the cellular level. In the same tumors, the phosphorescence lifetimes varied from ~6.8 µs to ~9.7 µs, which, in general, corresponded with the values of the phosphorescence lifetimes typical of different degrees of hypoxia and the lifetime data measured for this complex in cuvette experiments (Table 1).
It is important to note that the dose of the complex used did not induce any acute toxic effect on mice and did not change the typical histological structure of the tumor tissue, thus proving the potential biocompatibility of these phosphorescent O2 probes. Therefore, the conducted in vitro and in vivo experiments showed the high potential of the new Ir1 complex for assessing tissue oxygenation using PLIM.
4. Conclusions
We have obtained and comprehensively characterized three new target iridium complexes, [Ir(N^C)2(N^N#)]Cl, with various diimine N^N ligands in their composition. These complexes were decorated with short-branched oligo(ethylene glycol) groups to give them water solubility, biocompatibility and low toxicity.
These compounds exhibited oxygen-dependent phosphorescence. The study of their photophysical properties made it possible to determine the two most promising sensors for further biological testing. The quantum yields of these complexes were moderate and reached 17% in deaerated water. The emission wavelengths were in the transparency window of biological tissues.
Biological studies showed that these compounds have low toxicity. Cellular in vitro experiments proved that these sensors exhibit a significant lifetime response to changes in the oxygen concentration in the sample. Simulation of hypoxia in cells led to a two- and threefold increase of these values. The effectiveness of these sensors allowed their application in in vivo experiments on living mice tumor models. In these experiments, the sensors also made it possible to record the presence of significant hypoxia in tumors, as well as their heterogeneity.
Thus, we have obtained and studied very promising new molecular oxygen sensors based on low-toxicity biocompatible phosphorescent iridium complexes.
Supplementary Materials
The Supplementary Information file and optimized structures of complexes Ir1–0, Ir2–0, Ir3–0 can be downloaded at: https://www.mdpi.com/article/10.3390/bios13070680/s1. References [68,69,70,71,72,73,74,75,76,77,78,79] are cited in the Supplementary Materials. Figure S1: 1H NMR spectrum of 6-(benzo[b]thiophen-2-yl)nicotinic acid, (CD3)2SO, 298 K; Figure S2: 1H-1H COSY NMR spectrum of 6-(benzo[b]thiophen-2-yl)nicotinic acid, (CD3)2SO, 298 K; Figure S3: ESI+ mass spectrum of 6-(benzo[b]thiophen-2-yl)nicotinic acid ([M+H]+cation area), solvent—methanol; Figure S4: 1H NMR spectrum of N^C, CDCl3, 298 K; Figure S5: 1H-1H COSY NMR spectra of N^C, CDCl3, 298 K; Figure S6: ESI+ mass spectrum of N^C ([M+Na]+cation area), solvent—methanol; Figure S7: 1H NMR spectrum of dissociated dimer [Ir2(N^C)4Cl2], (CD3)2SO, 298 K (top—full view, bottom—aliphatic area); Figure S8: 1H-1H COSY NMR spectrum of dissociated dimer [Ir2(N^C)4Cl2], (CD3)2SO, 298 K; Figure S9: ESI+ mass spectrum of dissociated dimer ([Ir(N^C)2Cl+Na]+cation area), solvent—methanol; Figure S10: 1H NMR spectrum of Ir1, CD3OD, 298 K (top—full view, bottom—aliphatic area); Figure S11: 1H-1H COSY NMR spectrum of Ir1, CD3OD, 298 K; Figure S12: ESI+ mass spectrum of Ir1 ([M+Na]2+cation area), solvent—methanol; Figure S13: 1H NMR spectrum of Ir2, CD3OD, 298 K (top—full view, bottom—aliphatic area); Figure S14: 1H-1H COSY NMR spectrum of Ir2, CD3OD, 298 K; Figure S15: ESI+ mass spectrum of Ir2 ([M+Na]2+cation area), solvent—methanol; Figure S16: 1H NMR spectrum of Ir3, CD3OD, 298 K (top—full view, bottom—aliphatic area). Peak assignments: * -toluene in CD3OD impurities; Figure S17: 1H-1H COSY NMR spectrum of Ir3, CD3OD, 298 K; Figure S18: ESI+ mass spectrum of Ir3 ([M+Na]2+cation area), solvent—methanol; Figure S19: Absorption spectra of Ir1: experimental (red) and calculated (black) lines with oscillator strengths of electronic transitions (bars); Figure S20: Absorption spectra of Ir2: experimental (red) and calculated (black) lines with oscillator strengths of electronic transitions (bars); Figure S21: Absorption spectra of Ir3: experimental (red) and calculated (black) lines with oscillator strengths of electronic transitions (bars); Figure S22: Optimized structure of the model Ir2–0 complex (hydrogen atoms are omitted for clarity). The calculations have been simplified by substitution of OEG pendants in Ir2 complex for methyl groups in Ir2–0 structure. Atom colors: Ir—blue; S—yellow; O—green; N—red; C—gray; Figure S23: Optimized structure of the model Ir3–0 complex (hydrogen atoms are omitted for clarity). The calculations have been simplified by substitution of OEG pendants in Ir3 complex for methyl groups in Ir3–0 structure. Atom colors: Ir—blue; S—yellow; O—green; N—red; C—gray; Figure S24: MTT assay for viability of HCT116 cells after incubation with complexes Ir1–Ir3. Mean ± SD. N = 3 repeats by 10 wells; Figure S25: In vivo PLIM of human colorectal tumor HCT116 with the Ir1 complex. Representative microscopic images of cellular autofluorescence, Ir1 luminescence intensity, PLIM (scale bar = 50 µm.) and histological verification (scale bar = 150 µm); Figure S26: In vivo PLIM of mouse colorectal tumor CT26 with the Ir1 complex. Representative microscopic images of Ir1 luminescence intensity, PLIM at 30 min, 3 h and 6 h after sensor injection. Scale bar = 50 µm; Table S1: Values of excitation state lifetime of complexes Ir1 and Ir2 in various aqueous media and at different oxygen concentrations. Excitation at 355 nm, T = 37 °C, C (Complex) = 10 µM; Table S2: Calculated and experimental wavelength of emission maxima of complexes Ir1–Ir3; Table S3: Calculated absorption maxima (λ) and oscillator strengths (f) of complex Ir1; Table S4: Natural transition orbitals (NTO) for Ir1–0; violet and terracotta colors show decrease and increase in electron density, respectively. The calculations have been simplified by substitution of OEG pendants of Ir1 complex for methyl groups in Ir1–0 structure. Atom colors: Ir—lilac; S—yellow; O—red; N—blue; C—gray; H—white. The data for the corresponding interfragment charge transfer (IFCT) are given below the figures. Diagonal values represent intraligand transitions; off-diagonal values represent a charge transfer from “Donor” to “Acceptor”; Table S5: Calculated absorption maxima (λ) and oscillator strengths (f) of complex Ir2; Table S6: Natural transition orbitals (NTO) for Ir2–0; violet and terracotta colors show decrease and increase in electron density, respectively. The calculations have been simplified by substitution of OEG pendants of Ir2 complex for methyl groups in Ir2–0 structure. Atom colors: Ir—lilac; S—yellow; O—red; N—blue; C—gray; H—white. The data for the corresponding interfragment charge transfer (IFCT) are given below the figures. Diagonal values represent intraligand transitions; off-diagonal values represent a charge transfer from “Donor” to “Acceptor”; Table S7: Calculated absorption maxima (λ) and oscillator strengths (f) of complex Ir3; Table S8: Natural transition orbitals (NTO) for Ir3–0; violet and terracotta colors show decrease and increase in electron density, respectively. The calculations have been simplified by substitution of OEG pendants of Ir3 complex for methyl groups in Ir3–0 structure. Atom colors: Ir—lilac; S—yellow; O—red; N—blue; C—gray; H—white. The data for the corresponding interfragment charge transfer (IFCT) are given below the figures. Diagonal values represent intraligand transitions; off-diagonal values represent a charge transfer from “Donor” to “Acceptor”; Table S9: The key structural parameters of complex Ir1–0 (R = NHMe) and its literature analog; Table S10: The key structural parameters of complex Ir2–0 (R = NHMe) and its literature analog; Table S11: The key structural parameters of complex Ir3–0 (R = NHMe) and its literature analog.
Author Contributions
Conceptualization, S.P.T. and I.S.K.; methodology, I.S.K., V.V.S. and M.V.S.; software, D.O.K.; validation, M.V.S.; formal analysis, M.S., D.O.K., V.V.S., M.V.S. and A.D.K.; investigation, M.S., D.O.K., V.V.S. and A.D.K.; resources, M.S., D.O.K., V.V.S. and A.D.K.; data curation, V.V.S. and I.S.K.; writing—original draft preparation, I.S.K., M.S., D.O.K. and A.D.K.; writing—review and editing, S.P.T. and M.V.S.; visualization, M.S., D.O.K., I.S.K., M.V.S. and A.D.K.; supervision, S.P.T.; project administration, I.S.K.; funding acquisition, I.S.K. All authors have read and agreed to the published version of the manuscript.
Funding
This research was funded by the Russian Science Foundation, grant number 18-73-10021.
Institutional Review Board Statement
Biological studies were approved by the Local Ethics Committee of the Privolzhsky Research Medical University (protocol #15 from 23 September 2022).
Informed Consent Statement
Not applicable.
Data Availability Statement
No data are available.
Acknowledgments
In commemoration of the 300th anniversary of St Petersburg State University’s founding, this work was performed using the equipment of the Centers for Magnetic Resonance, for Optical and Laser Materials Research, for Chemical Analysis and Materials Research, Computer Center and Cryogenic Centre of Research Park of St. Petersburg State University.
Conflicts of Interest
The authors declare no conflict of interest.
References
- Semenza, G.L. Life with Oxygen. Science 2007, 318, 62–64. [Google Scholar] [CrossRef] [PubMed]
- Semenza, G.L. Hypoxia-Inducible Factors in Physiology and Medicine. Cell 2012, 148, 399–408. [Google Scholar] [CrossRef] [PubMed]
- Clanton, T.L.; Hogan, M.C.; Gladden, L.B. Regulation of Cellular Gas Exchange, Oxygen Sensing, and Metabolic Control. Compr. Physiol. 2013, 3, 1135–1190. [Google Scholar] [CrossRef] [PubMed]
- Tsai, A.G.; Johnson, P.C.; Intaglietta, M. Oxygen Gradients in the Microcirculation. Physiol. Rev. 2003, 83, 933–963. [Google Scholar] [CrossRef]
- Borisov, S.M. CHAPTER 1. Fundamentals of Quenched Phosphorescence O2 Sensing and Rational Design of Sensor Materials. In Quenched-Phosphorescence Detection of Molecular Oxygen: Applications in Life Sciences; The Royal Society of Chemistry: London, UK, 2018; pp. 1–18. [Google Scholar] [CrossRef]
- Carraway, E.R.; Demas, J.N.; DeGraff, B.A.; Bacon, J.R. Photophysics and photochemistry of oxygen sensors based on luminescent transition-metal complexes. Anal. Chem. 1991, 63, 337–342. [Google Scholar] [CrossRef]
- Baggaley, E.; Weinstein, J.A.; Williams, J.A.G. Time-Resolved Emission Imaging Microscopy Using Phosphorescent Metal Complexes: Taking FLIM and PLIM to New Lengths BT—Luminescent and Photoactive Transition Metal Complexes as Biomolecular Probes and Cellular Reagents; Lo, K.K.-W., Ed.; Springer: Berlin/Heidelberg, Germany, 2015; pp. 205–256. [Google Scholar] [CrossRef]
- Chelushkin, P.S.; Tunik, S.P. Phosphorescence Lifetime Imaging (PLIM): State of the Art and Perspectives. In Progress in Photon Science: Recent Advances; Yamanouchi, K., Tunik, S., Makarov, V., Eds.; Springer International Publishing: Cham, Switzerland, 2019; pp. 109–128. [Google Scholar] [CrossRef]
- Jenkins, J.; Dmitriev, R.I.; Papkovsky, D.B. Imaging Cell and Tissue O2 by TCSPC-PLIM. In Advanced Time-Correlated Single Photon Counting Applications; Springer Series in Chemical Physics; Springer: Berlin/Heidelberg, Germany, 2015; Volume 111, pp. 225–247. [Google Scholar] [CrossRef]
- Baggaley, E.; Botchway, S.W.; Haycock, J.W.; Morris, H.; Sazanovich, I.V.; Williams, J.A.G.; Weinstein, J.A. Long-lived metal complexes open up microsecond lifetime imaging microscopy under multiphoton excitation: From FLIM to PLIM and beyond. Chem. Sci. 2013, 5, 879–886. [Google Scholar] [CrossRef]
- Sakadžić, S.; Roussakis, E.; A Yaseen, M.; Mandeville, E.T.; Srinivasan, V.J.; Arai, K.; Ruvinskaya, S.; Devor, A.; Lo, E.H.; A Vinogradov, S.; et al. Two-photon high-resolution measurement of partial pressure of oxygen in cerebral vasculature and tissue. Nat. Methods 2010, 7, 755–759. [Google Scholar] [CrossRef]
- Roussakis, E.; Spencer, J.A.; Lin, C.P.; Vinogradov, S.A. Two-Photon Antenna-Core Oxygen Probe with Enhanced Performance. Anal. Chem. 2014, 86, 5937–5945. [Google Scholar] [CrossRef]
- Spencer, J.A.; Ferraro, F.; Roussakis, E.; Klein, A.; Wu, J.; Runnels, J.M.; Zaher, W.; Mortensen, L.J.; Alt, C.; Turcotte, R.; et al. Direct measurement of local oxygen concentration in the bone marrow of live animals. Nature 2014, 508, 269. [Google Scholar] [CrossRef]
- Şencan, I.; Esipova, T.V.; Yaseen, M.A.; Fu, B.; Boas, D.A.; Vinogradov, S.A.; Shahidi, M.; Sakadžić, S. Two-photon phosphorescence lifetime microscopy of retinal capillary plexus oxygenation in mice. J. Biomed. Opt. 2018, 23, 126501. [Google Scholar] [CrossRef]
- Pogue, B.W.; Feng, J.; LaRochelle, E.P.; Bruža, P.; Lin, H.; Zhang, R.; Shell, J.R.; Dehghani, H.; Davis, S.C.; Vinogradov, S.A.; et al. Maps of in vivo oxygen pressure with submillimetre resolution and nanomolar sensitivity enabled by Cherenkov-excited luminescence scanned imaging. Nat. Biomed. Eng. 2018, 2, 254–264. [Google Scholar] [CrossRef]
- Cao, X.; Allu, S.R.; Jiang, S.; Jia, M.; Gunn, J.R.; Yao, C.; LaRochelle, E.P.; Shell, J.R.; Bruza, P.; Gladstone, D.J.; et al. Tissue pO2 distributions in xenograft tumors dynamically imaged by Cherenkov-excited phosphorescence during fractionated radiation therapy. Nat. Commun. 2020, 11, 573. [Google Scholar] [CrossRef]
- Christodoulou, C.; Spencer, J.A.; Yeh, S.-C.A.; Turcotte, R.; Kokkaliaris, K.D.; Panero, R.; Ramos, A.; Guo, G.; Seyedhassantehrani, N.; Esipova, T.V.; et al. Live-animal imaging of native haematopoietic stem and progenitor cells. Nature 2020, 578, 278–283. [Google Scholar] [CrossRef]
- Şencan, I.; Esipova, T.; Kılıç, K.; Li, B.; Desjardins, M.; A Yaseen, M.; Wang, H.; E Porter, J.; Kura, S.; Fu, B.; et al. Optical measurement of microvascular oxygenation and blood flow responses in awake mouse cortex during functional activation. J. Cereb. Blood Flow Metab. 2020, 42, 510–525. [Google Scholar] [CrossRef]
- Esipova, T.V.; Barrett, M.J.; Erlebach, E.; Masunov, A.E.; Weber, B.; Vinogradov, S.A. Oxyphor 2P: A High-Performance Probe for Deep-Tissue Longitudinal Oxygen Imaging. Cell Metab. 2019, 29, 736–744. [Google Scholar] [CrossRef]
- Esipova, T.V.; Karagodov, A.; Miller, J.; Wilson, D.F.; Busch, T.M.; Vinogradov, S.A. Two New “Protected” Oxyphors for Biological Oximetry: Properties and Application in Tumor Imaging. Anal. Chem. 2011, 83, 8756–8765. [Google Scholar] [CrossRef]
- McQuaid, R.M.; Mrochen, M.; Dmitriev, R.; Papkovski, D.; Vohnsen, B. In-Vitro Estimation of O2 Concentrations during Corneal Cross-Linking (CXL) for Porcine Corneas and Collagen Type-I Gels. Investig. Ophthalmol. Vis. Sci. 2017, 58, 5674. [Google Scholar]
- Dmitriev, R.I.; Borisov, S.M.; Jenkins, J.; Papkovsky, D.B. Multi-parametric imaging of tumor spheroids with ultra-bright and tunable nanoparticle O2 probes. In Imaging, Manipulation, and Analysis of Biomolecules, Cells, and Tissues XIII; SPIE: Washington, DC, USA, 2015. [Google Scholar] [CrossRef]
- Dmitriev, R.I.; Borisov, S.M.; Düssmann, H.; Sun, S.; Müller, B.J.; Prehn, J.; Baklaushev, V.P.; Klimant, I.; Papkovsky, D.B. Versatile Conjugated Polymer Nanoparticles for High-Resolution O2 Imaging in Cells and 3D Tissue Models. ACS Nano 2015, 9, 5275–5288. [Google Scholar] [CrossRef]
- Tsytsarev, V.; Akkentli, F.; Pumbo, E.; Tang, Q.; Chen, Y.; Erzurumlu, R.S.; Papkovsky, D.B. Planar implantable sensor for in vivo measurement of cellular oxygen metabolism in brain tissue. J. Neurosci. Methods 2017, 281, 1–6. [Google Scholar] [CrossRef]
- Zhdanov, A.V.; Okkelman, I.A.; Golubeva, A.V.; Doerr, B.; Hyland, N.P.; Melgar, S.; Shanahan, F.; Cryan, J.F.; Papkovsky, D.B. Quantitative analysis of mucosal oxygenation using ex vivo imaging of healthy and inflamed mammalian colon tissue. Cell. Mol. Life Sci. 2016, 74, 141–151. [Google Scholar] [CrossRef]
- Okkelman, I.A.; Foley, T.; Papkovsky, D.B.; Dmitriev, R.I. Live cell imaging of mouse intestinal organoids reveals heterogeneity in their oxygenation. Biomaterials 2017, 146, 86–96. [Google Scholar] [CrossRef] [PubMed]
- Papkovsky, D.B.; Dmitriev, R.I. Imaging of oxygen and hypoxia in cell and tissue samples. Cell. Mol. Life Sci. 2018, 75, 2963–2980. [Google Scholar] [CrossRef] [PubMed]
- Papkovsky, D.B.; Dmitriev, R.I.; Borisov, S. Imaging of oxygenation in 3D tissue models with multi-modal phosphorescent probes. In Multiphoton Microscopy in the Biomedical Sciences XV; SPIE: Washington, DC, USA, 2015. [Google Scholar] [CrossRef]
- Zhdanov, A.V.; Golubeva, A.V.; A Okkelman, I.; Cryan, J.F.; Papkovsky, D. Imaging of oxygen gradients in giant umbrella cells: An ex vivo PLIM study. Am. J. Physiol. Physiol. 2015, 309, C501–C509. [Google Scholar] [CrossRef] [PubMed]
- Dmitriev, R.I.; Papkovsky, D.B. Multi-parametric O2 Imaging in Three-Dimensional Neural Cell Models with the Phosphorescent Probes. Methods Mol. Biol. 2015, 1254, 55–71. [Google Scholar] [CrossRef] [PubMed]
- Lukina, M.M.; Sirotkina, M.A.; Orlova, A.G.; Dudenkova, V.V.; Komarova, A.D.; Plekhanov, A.A.; Snopova, L.B.; Zagaynova, E.V.; Papkovsky, D.B.; Shcheslavskiy, V.I.; et al. Effects of Irinotecan on Tumor Vasculature and Oxygenation: An in vivo Study on Colorectal Cancer Model. IEEE J. Sel. Top. Quantum Electron. 2020, 27, 1–8. [Google Scholar] [CrossRef]
- Kondrashina, A.V.; Dmitriev, R.I.; Borisov, S.M.; Klimant, I.; O’Brien, I.; Nolan, Y.M.; Zhdanov, A.V.; Papkovsky, D.B. A Phosphorescent Nanoparticle-Based Probe for Sensing and Imaging of (Intra)Cellular Oxygen in Multiple Detection Modalities. Adv. Funct. Mater. 2012, 22, 4931–4939. [Google Scholar] [CrossRef]
- Dmitriev, R.I.; Papkovsky, D.B. Optical probes and techniques for O2 measurement in live cells and tissue. Cell. Mol. Life Sci. 2012, 69, 2025–2039. [Google Scholar] [CrossRef]
- Tsytsarev, V.; Arakawa, H.; Borisov, S.; Pumbo, E.; Erzurumlu, R.S.; Papkovsky, D.B. In vivo imaging of brain metabolism activity using a phosphorescent oxygen-sensitive probe. J. Neurosci. Methods 2013, 216, 146–151. [Google Scholar] [CrossRef]
- Dmitriev, R.I.; Zhdanov, A.V.; Nolan, Y.M.; Papkovsky, D.B. Imaging of neurosphere oxygenation with phosphorescent probes. Biomaterials 2013, 34, 9307–9317. [Google Scholar] [CrossRef]
- Dmitriev, R.I.; Kondrashina, A.V.; Koren, K.; Klimant, I.; Zhdanov, A.V.; Pakan, J.M.P.; McDermott, K.W.; Papkovsky, D.B. Small molecule phosphorescent probes for O2 imaging in 3D tissue models. Biomater. Sci. 2014, 2, 853–866. [Google Scholar] [CrossRef]
- Zanetti, C.; Gaspar, R.D.L.; Zhdanov, A.V.; Maguire, N.M.; Joyce, S.A.; Collins, S.G.; Maguire, A.R.; Papkovsky, D.B. Heterosubstituted Derivatives of PtPFPP for O2 Sensing and Cell Analysis: Structure–Activity Relationships. Bioconjugate Chem. 2022, 33, 2161–2169. [Google Scholar] [CrossRef]
- Dmitriev, R.I.; O’donnell, N.; Papkovsky, D.B. Metallochelate Coupling of Phosphorescent Pt-Porphyrins to Peptides, Proteins, and Self-Assembling Protein Nanoparticles. Bioconjugate Chem. 2016, 27, 439–445. [Google Scholar] [CrossRef]
- Zhang, S.; Hosaka, M.; Yoshihara, T.; Negishi, K.; Iida, Y.; Tobita, S.; Takeuchi, T. Phosphorescent Light–Emitting Iridium Complexes Serve as a Hypoxia-Sensing Probe for Tumor Imaging in Living Animals. Cancer Res 2010, 70, 4490–4498. [Google Scholar] [CrossRef]
- Tobita, S.; Yoshihara, T. Intracellular and in vivo oxygen sensing using phosphorescent iridium(III) complexes. Curr. Opin. Chem. Biol. 2016, 33, 39–45. [Google Scholar] [CrossRef]
- Zhou, J.; Li, J.; Zhang, K.Y.; Liu, S.; Zhao, Q. Phosphorescent iridium(III) complexes as lifetime-based biological sensors for photoluminescence lifetime imaging microscopy. Coord. Chem. Rev. 2022, 453, 214334. [Google Scholar] [CrossRef]
- Mizukami, K.; Katano, A.; Shiozaki, S.; Yoshihara, T.; Goda, N.; Tobita, S. In vivo O2 imaging in hepatic tissues by phosphorescence lifetime imaging microscopy using Ir(III) complexes as intracellular probes. Sci. Rep. 2020, 10, 21053. [Google Scholar] [CrossRef]
- Koren, K.; Dmitriev, R.I.; Borisov, S.M.; Papkovsky, D.B.; Klimant, I. Complexes of IrIII-Octaethylporphyrin with Peptides as Probes for Sensing Cellular O2. Chembiochem 2012, 13, 1184–1190. [Google Scholar] [CrossRef]
- Wang, X.-H.; Peng, H.; Yang, L.; You, F.-T.; Teng, F.; Hou, L.; Wolfbeis, O.S. Targetable Phosphorescent Oxygen Nanosensors for the Assessment of Tumor Mitochondrial Dysfunction by Monitoring the Respiratory Activity. Angew. Chem. Int. Ed. 2014, 53, 12471–12475. [Google Scholar] [CrossRef]
- Zheng, X.; Wang, X.; Mao, H.; Wu, W.; Liu, B.; Jiang, X. Hypoxia-specific ultrasensitive detection of tumours and cancer cells in vivo. Nat. Commun. 2015, 6, 5834. [Google Scholar] [CrossRef]
- Zhang, K.Y.; Gao, P.; Sun, G.; Zhang, T.; Li, X.; Liu, S.; Zhao, Q.; Lo, K.K.-W.; Huang, W. Dual-Phosphorescent Iridium(III) Complexes Extending Oxygen Sensing from Hypoxia to Hyperoxia. J. Am. Chem. Soc. 2018, 140, 7827–7834. [Google Scholar] [CrossRef]
- Chen, Z.; Yan, P.; Zou, L.; Zhao, M.; Jiang, J.; Liu, S.; Zhang, K.Y.; Huang, W.; Zhao, Q. Using Ultrafast Responsive Phosphorescent Nanoprobe to Visualize Elevated Peroxynitrite In Vitro and In Vivo via Ratiometric and Time-Resolved Photoluminescence Imaging. Adv. Health Mater. 2018, 7, e1800309. [Google Scholar] [CrossRef] [PubMed]
- Zeng, Y.; Liu, Y.; Shang, J.; Ma, J.; Wang, R.; Deng, L.; Guo, Y.; Zhong, F.; Bai, M.; Zhang, S.; et al. Phosphorescence Monitoring of Hypoxic Microenvironment in Solid-Tumors to Evaluate Chemotherapeutic Effects Using the Hypoxia-Sensitive Iridium (III) Coordination Compound. PLoS ONE 2015, 10, e0121293. [Google Scholar] [CrossRef] [PubMed]
- Yoshihara, T.; Yamaguchi, Y.; Hosaka, M.; Takeuchi, T.; Tobita, S. Ratiometric Molecular Sensor for Monitoring Oxygen Levels in Living Cells. Angew. Chem. Int. Ed. 2012, 51, 4148–4151. [Google Scholar] [CrossRef] [PubMed]
- Yoshihara, T.; Hosaka, M.; Terata, M.; Ichikawa, K.; Murayama, S.; Tanaka, A.; Mori, M.; Itabashi, H.; Takeuchi, T.; Tobita, S. Intracellular and in Vivo Oxygen Sensing Using Phosphorescent Ir(III) Complexes with a Modified Acetylacetonato Ligand. Anal. Chem. 2015, 87, 2710–2717. [Google Scholar] [CrossRef]
- Hirakawa, Y.; Yoshihara, T.; Kamiya, M.; Mimura, I.; Fujikura, D.; Masuda, T.; Kikuchi, R.; Takahashi, I.; Urano, Y.; Tobita, S.; et al. Quantitating intracellular oxygen tension in vivo by phosphorescence lifetime measurement. Sci. Rep. 2015, 5, 17838. [Google Scholar] [CrossRef]
- Samandarsangari, M.; Kritchenkov, I.S.; Kozina, D.O.; Komarova, A.D.; Shirmanova, M.V.; Tunik, S.P. Phosphorescent O2-Probes Based on Ir(III) Complexes for Bioimaging Applications. Chemosensors 2023, 11, 263. [Google Scholar] [CrossRef]
- Zeng, Y.; Zhang, S.; Jia, M.; Liu, Y.; Shang, J.; Guo, Y.; Xu, J.; Wu, D. Hypoxia-sensitive bis(2-(2′-benzothienyl)pyridinato-N,C3′)iridium[poly(n-butyl cyanoacrylate]/chitosan nanoparticles and their phosphorescence tumor imaging in vitro and in vivo. Nanoscale 2013, 5, 12633–12644. [Google Scholar] [CrossRef]
- Solomatina, A.I.; Chelushkin, P.S.; Su, S.-H.; Wu, C.-H.; Chou, P.-T.; Tunik, S.P. Combined fluorophore and phosphor conjugation: A new design concept for simultaneous and spatially localized dual lifetime intracellular sensing of oxygen and pH. Chem. Commun. 2021, 58, 419–422. [Google Scholar] [CrossRef]
- Kritchenkov, I.S.; Chelushkin, P.S.; Sokolov, V.V.; Pavlovskiy, V.V.; Porsev, V.V.; Evarestov, R.A.; Tunik, S.P. Near-Infrared [Ir(N∧C)2(N∧N)]+ Emitters and Their Noncovalent Adducts with Human Serum Albumin: Synthesis and Photophysical and Computational Study. Organometallics 2019, 38, 3740–3751. [Google Scholar] [CrossRef]
- Shirmanova, M.V.; Shcheslavskiy, V.I.; Lukina, M.M.; Dudenkova, V.V.; Kritchenkov, I.; Solomatina, A.; Tunik, S.P. Molecular oxygen mapping in biological samples by time-correlated single photon counting technique and Ir(III)-based complexes. In Optical Biopsy XVIII: Toward Real-Time Spectroscopic Imaging and Diagnosis; SPIE: Washington, DC, USA, 2020. [Google Scholar] [CrossRef]
- Kritchenkov, I.; Solomatina, A.; Chelushkin, P.; Shirmanova, M.; Kornilova, E.; Rueck, A.; Tunik, S. Phosphorescent Ir(III) oxygen sensors for bioimaging. In Proceedings of the 2022 International Conference Laser Optics (ICLO), Saint Petersburg, Russia, 20–24 June 2022; p. 1. [Google Scholar] [CrossRef]
- Rueck, A.C.; Schäfer, P.; von Einem, B.; Kalinina, S. Metabolic NADH/FAD/FMN FLIM and oxygen PLIM: Multiphoton luminescence lifetime imaging on the way to clinical diagnosis. In Multiphoton Microscopy in the Biomedical Sciences XX; SPIE: Washington, DC, USA, 2020. [Google Scholar] [CrossRef]
- Kritchenkov, I.S.; Zhukovsky, D.D.; Mohamed, A.; Korzhikov-Vlakh, V.A.; Tennikova, T.B.; Lavrentieva, A.; Scheper, T.; Pavlovskiy, V.V.; Porsev, V.V.; Evarestov, R.A.; et al. Functionalized Pt(II) and Ir(III) NIR Emitters and Their Covalent Conjugates with Polymer-Based Nanocarriers. Bioconjugate Chem. 2020, 31, 1327–1343. [Google Scholar] [CrossRef]
- Kritchenkov, I.S.; Elistratova, A.A.; Sokolov, V.V.; Chelushkin, P.S.; Shirmanova, M.V.; Lukina, M.M.; Dudenkova, V.V.; Shcheslavskiy, V.I.; Kalinina, S.; Reeß, K.; et al. A biocompatible phosphorescent Ir(iii) oxygen sensor functionalized with oligo(ethylene glycol) groups: Synthesis, photophysics and application in PLIM experiments. New J. Chem. 2020, 44, 10459–10471. [Google Scholar] [CrossRef]
- Kuznetsov, K.M.; Kritchenkov, I.S.; Shakirova, J.R.; Gurzhiy, V.V.; Pavlovskiy, V.V.; Porsev, V.V.; Sokolov, V.V.; Tunik, S.P. Red-to-NIR Iridium(III) Emitters: Synthesis, Photophysical and Computational Study, the Effects of Cyclometallating and β-Diketonate Ligands. Eur. J. Inorg. Chem. 2021, 2021, 2163–2170. [Google Scholar] [CrossRef]
- Kritchenkov, I.S.; Solomatina, A.I.; Kozina, D.O.; Porsev, V.V.; Sokolov, V.V.; Shirmanova, M.V.; Lukina, M.M.; Komarova, A.D.; Shcheslavskiy, V.I.; Belyaeva, T.N.; et al. Biocompatible Ir(III) Complexes as Oxygen Sensors for Phosphorescence Lifetime Imaging. Molecules 2021, 26, 2898. [Google Scholar] [CrossRef]
- Elistratova, A.A.; Kritchenkov, I.S.; Lezov, A.A.; Gubarev, A.S.; Solomatina, A.I.; Kachkin, D.V.; Shcherbina, N.A.; Liao, Y.-C.; Liu, Y.-C.; Yang, Y.-Y.; et al. Lifetime oxygen sensors based on block copolymer micelles and non-covalent human serum albumin adducts bearing phosphorescent near-infrared iridium(III) complex. Eur. Polym. J. 2021, 159, 110761. [Google Scholar] [CrossRef]
- Kitchenkov, I.S.; Melnikov, A.S.; Serdobintsev, P.S.; Khodorkovskii, M.A.; Pavlovskii, V.V.; Porsev, V.V.; Tunik, S.P. Energy Transfer Processes in the Excited States of an {[Ir(N C)2(N N)]+-Rhodamine} Dyad: An Experimental and Theoretical Study. Chemphotochem 2022, 6, e202200048. [Google Scholar] [CrossRef]
- Kritchenkov, I.S.; Mikhnevich, V.G.; Stashchak, V.S.; Solomatina, A.I.; Kozina, D.O.; Sokolov, V.V.; Tunik, S.P. Novel NIR-Phosphorescent Ir(III) Complexes: Synthesis, Characterization and Their Exploration as Lifetime-Based O2 Sensors in Living Cells. Molecules 2022, 27, 3156. [Google Scholar] [CrossRef]
- Choi, D.; Jung, K.; Cho, M. Iridium Phosphorescent Dendrimer, Method of Preparing the Same and Electrolumnescent Device Including the Iridium Phosphorescent Denormer. U.S. Patent Application No. 8,420,231, 16 April 2013. [Google Scholar]
- Samudrala, R.; Zhang, X.; Wadkins, R.M.; Mattern, D.L. Synthesis of a non-cationic, water-soluble perylenetetracarboxylic diimide and its interactions with G-quadruplex-forming DNA. Bioorganic Med. Chem. 2007, 15, 186–193. [Google Scholar] [CrossRef]
- Lai, P.-N.; Teets, T.S. Ancillary Ligand Effects on Red-Emitting Cyclometalated Iridium Complexes. Chem. A Eur. J. 2019, 25, 6026–6037. [Google Scholar] [CrossRef]
- Solomatina, A.I.; Kuznetsov, K.M.; Gurzhiy, V.V.; Pavlovskiy, V.V.; Porsev, V.V.; Evarestov, R.A.; Tunik, S.P. Luminescent organic dyes containing a phenanthro[9,10-D]imidazole core and [Ir(N^C)(N^N)]+ complexes based on the cyclometalating and diimine ligands of this type. Dalton Trans. 2020, 49, 6751–6763. [Google Scholar] [CrossRef]
- Huang, Y.-C.; Li, Z.-B.; Guo, H.-Q.; Mu, D.; Li, H.-Y.; Lu, A.-D.; Li, T.-Y. Synthesis, structures, photophysical properties, and theoretical study of four cationic iridium(III) complexes with electron-withdrawing groups on the neutral ligands. Inorganica Chim. Acta 2019, 496, 119060. [Google Scholar] [CrossRef]
- Conway, J.; Warren, S.C.; Herrmann, D.; Murphy, K.J.; Cazet, A.; Vennin, C.; Shearer, R.F.; Killen, M.; Magenau, A.; Mélénec, P.; et al. Intravital Imaging to Monitor Therapeutic Response in Moving Hypoxic Regions Resistant to PI3K Pathway Targeting in Pancreatic Cancer. Cell Rep. 2018, 23, 3312–3326. [Google Scholar] [CrossRef] [PubMed]
- Parshina, Y.P.; Komarova, A.D.; Bochkarev, L.N.; Kovylina, T.A.; Plekhanov, A.A.; Klapshina, L.G.; Konev, A.N.; Mozherov, A.M.; Shchechkin, I.D.; Sirotkina, M.A.; et al. Simultaneous Probing of Metabolism and Oxygenation of Tumors In Vivo Using FLIM of NAD(P)H and PLIM of a New Polymeric Ir(III) Oxygen Sensor. Int. J. Mol. Sci. 2022, 23, 10263. [Google Scholar] [CrossRef] [PubMed]
- Frisch, M.J.; Trucks, G.W.; Schlegel, H.B.; Scuseria, G.E.; Robb, M.A.; Cheeseman, J.R.; Scalmani, G.; Barone, V.; Petersson, G.A.; Nakatsuji, X.; et al. Gaussian 16, Revision B.01. 2016. Available online: https://gaussian.com/citation/ (accessed on 1 June 2023).
- Austin, A.; Petersson, G.A.; Frisch, M.J.; Dobek, F.J.; Scalmani, G.; Throssell, K. A Density Functional with Spherical Atom Dispersion Terms. J. Chem. Theory Comput. 2012, 8, 4989–5007. [Google Scholar] [CrossRef] [PubMed]
- Dolg, M.; Wedig, U.; Stoll, H.; Preuss, H. Energy-adjusted ab initio pseudopotentials for the first row transition elements. J. Chem. Phys. 1987, 86, 866–872. [Google Scholar] [CrossRef]
- Tomasi, J.; Mennucci, B.; Cammi, R. Quantum Mechanical Continuum Solvation Models. Chem. Rev. 2005, 105, 2999–3094. [Google Scholar] [CrossRef]
- O’Boyle, N.M.; Tenderholt, A.L.; Langner, K.M. cclib: A library for package-independent computational chemistry algorithms. J. Comput. Chem. 2008, 29, 839–845. [Google Scholar] [CrossRef]
- Martin, R.L. Natural transition orbitals. J. Chem. Phys. 2003, 118, 4775–4777. [Google Scholar] [CrossRef]
- Lu, T.; Chen, F. Multiwfn: A multifunctional wavefunction analyzer. J. Comput. Chem. 2012, 33, 580–592. [Google Scholar] [CrossRef]


Disclaimer/Publisher’s Note: The statements, opinions and data contained in all publications are solely those of the individual author(s) and contributor(s) and not of MDPI and/or the editor(s). MDPI and/or the editor(s) disclaim responsibility for any injury to people or property resulting from any ideas, methods, instructions or products referred to in the content. |
© 2023 by the authors. Licensee MDPI, Basel, Switzerland. This article is an open access article distributed under the terms and conditions of the Creative Commons Attribution (CC BY) license (https://creativecommons.org/licenses/by/4.0/).