Abstract
In this work, a simple, low-cost, green, and mild method for the preparation of three-dimensional nanocomposite materials of gold nanorods (Au NRs)@TiO2 is reported. The surface of Au NRs was coated with TiO2 in situ reduction at room temperature without a complicated operation. The synthetic Au NRs@TiO2 nanocomposites were used as surface-enhanced Raman spectroscopy (SERS) active substrates for the reusable and sensitive detection of environmental pollutants. The results showed that the pollutants on Au NRs@TiO2 nanocomposites have higher SERS activity and reproducibility than those on the Au NR substrate without the presence of TiO2. Moreover, the SERS substrate can be readily recycled by UV-assisted self-cleaning to remove residual analyte molecules. Malachite green (MG) and crystal violet (CV) were used as examples to demonstrate the feasibility of the proposed sensor for the sensitive detection of environmental pollutants. The results showed that the limit of detections (LODs) were 0.75 μg/L and 0.50 μg/L for MG and CV, respectively, with the recoveries ranging from 86.67% to 91.20% and 83.70% to 89.00%. Meanwhile, the SERS substrate can be easily regenerated by UV light irradiation. Our investigation revealed that within three cycles, the Au NRs@TiO2 substrates still maintained the high SERS enhancement effect that they showed when first used for SERS detection. These results indicated that the method can be used to detect MG and CV in really complex samples. Due to the high sensitivity, reusability, and portability and the rapid detection property of the proposed sensor, it can have potential applications in the on-site detection of environmental pollutants in a complex sample matrix.
1. Introduction
Environmental pollutants pose a serious danger to human health. Organic dye is one of the major contaminants of the environment. Both MG (malachite green) and CV (crystal violet) are used as dye molecules and veterinary drugs. These compounds have been banned in fish farming because of their high teratogenicity, toxicity, and carcinogenicity [1,2,3]. However, because of the low cost and high efficiency of MG and CV, they are still used illegally. Currently, several methods have been reported for the analysis of these compounds, such as spectrophotometry [4,5], high-performance liquid chromatography (HPLC) [6], liquid chromatography-tandem mass spectrometry (LC-MS) [7], and gas-chromatography-mass spectrometry(GC-MS) [8]. These methods can be adopted to analyze these compounds with a high accuracy and sensitivity. However, these methods are high-cost and time-consuming, and involve complicated preconcentration. Therefore, establishing a simple and fast method for the analysis of these compounds is vital. Surface-enhanced Raman spectroscopy (SERS) as a potential effective approach for the rapid analysis of CV and MG has recently been widely reported [9,10].
SERS is an efficient and sensitive tool that provides unique fingerprint vibration information for specific molecules, such as dye molecules, pesticide molecules, and sulfhydryl molecules [11,12]. It is a non-destructive analytical technique that can achieve single-molecule trace detection [13,14]. Additionally, Raman detection can be carried out within a few seconds, and the apparatus is hand-held; thus, it can be used for point-of-care testing (POCT). As a result, SERS-based Raman sensing has been widely used in various fields, such as environmental monitoring, food safety, and life sciences [15,16,17,18,19]. The theories of SERS enhancement mainly include long-range electromagnetic enhancement (EM) and short-range chemical enhancement (CM) [20]. Electromagnetic field enhancement plays a leading role, in which localized surface-plasmon resonance (LSPR) on the surface of noble metal nanostructures causes a strong electromagnetic field enhancement near the nanoparticle structures [21,22]. The SERS active materials of the substrates are mainly composed of noble metal (Au, Ag, Cu) [23,24,25] nanostructures, which have a high cost; and most substrates are disposable, resulting in a waste of resources and limiting the application of SERS technology. Hence, it is still necessary to develop novel SERS active substrates with good sensitivity as well as excellent reusability.
After continuous research and exploration, the researchers herein combined gold and silver nanoparticles with other materials to prepare reusable SERS substrates [26,27,28]. Generally, the substrates are cleaned by thermal degradation, solvent cleaning, and photodegradation to recycle substrates. Lin [26] reported reusable SERS substrates based on boron nitride (BN) nanosheets loaded with silver nanoparticles. Because of the thermal oxidation resistance of BN, organic contaminants on the substrates can be removed by high-temperature treatment for achieving the regeneration and recycling of the substrates. Ye [27] prepared renewable SERS substrates by reducing silver nanoparticles in situ on the surface of urchin-like Fe3O4@C core–shell nanoparticles. After the detection of organic pollutants, the sea-urchin-like Fe3O4@C@Ag particles can be separated from the reaction solution with the aid of a magnet, followed by cleaning with water and ethanol to achieve the recycling of the substrates. Gold-nanoparticle-coated ZnO nanorod substrates were proposed by Sinha [28], and the methyl orange on the substrate was degraded by ultraviolet light irradiation to achieve recycling of the substrates.
Titanium dioxide (TiO2) is one of the most extensively studied semiconductors. It is widely used for the photocatalytic degradation of organic compounds due to its high photocatalytic activity, non-toxicity, and stability [29]. It has been reported that TiO2 can also produce SERS activity [30]. Therefore, the reusable SERS active substrates can be based on the composite material structure of the noble metal nanoparticle and TiO2. For example, Deng [31] deposited Ag nanoparticles (Ag NP) on the surface of TiO2 nanowires as recyclable SERS active substrates; however, Ag NP is susceptible to oxidation. Li [32] prepared SERS substrates based on ordered arrays of Au@TiO2 half-shells by nanosphere monolayer assembly, atomic layer deposition, and metal evaporation techniques. This ordered two-dimensional nanostructure has high reproducibility and stability, and the substrate is regenerated and reused by ultraviolet light irradiation. These SERS active substrates have high reusability; however, the preparation of these SERS active substrates requires expensive equipment or complicated processes, which has limited its widespread application in practice.
Herein, we synthesized a three-dimensional Au NRs@TiO2 nanocomposite using a simple method, and the whole preparation process was carried out under mild and green conditions (Scheme 1). Compared with the substrate prepared with Au NRs only, the analytes on the Au NRs@TiO2 nanocomposite substrate have a stronger SERS signal. The results show that the lowest detectable concentrations are 0.022 μg/L, 0.75 μg/L, and 0.50 μg/L for rhodamine 6G (R6G), malachite green (MG), and crystal violet (CV), respectively. More importantly, the organic molecules (e.g., R6G, MG, and CV) adsorbed on the substrate can be degraded to achieve the recycling of the substrate because TiO2 has the ability to catalyze the degradation of organic pollutants under ultraviolet radiation. The proposed recyclable sensing strategy has potential applications in the on-site detection of environmental pollutants in a complex sample matrix.
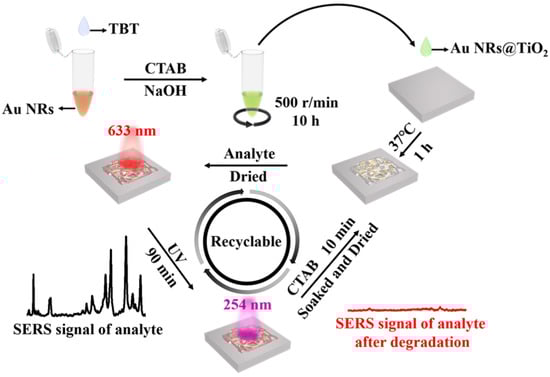
Scheme 1.
The fabrication and application of Au NRs@TiO2 recyclable SERS substrate.
2. Materials and Methods
2.1. Materials
Gold (III) chloride trihydrate (99.9%) (HAuCl4·4H2O), hexadecyl trimethyl ammonium bromide (CTAB), sodium borohydride (NaBH4), silver nitrate (AgNO3), ascorbic acid, sodium hydroxide (NaOH), malachite green (MG), and crystal violet (CV) were purchased from Sinopharm Chem. Re. Co., Ltd. Rhodamine 6G (R6G) was obtained from the Aladdin Company in Shanghai, China. Tetrabutyl titanate (C16H36O4Ti) was purchased from Shanghai Macklin Biochemical Technology Co., Ltd. All the chemicals were used without further purification, and Milli-Q water (18.2 MΩ·cm) was used in all the experiments.
2.2. Apparatus
The ultraviolet−visible (UV−Vis) absorption spectra of Au NRs and Au NRs@TiO2 were recorded with a Multiskan spectrum microplate spectrophotometer (Thermo Fisher, Shanghai, China). The size and morphology of Au NRs and Au NRs@TiO2 were inspected using transmission electron microscopy (TEM) TecnaiG2 F20 (FEI, OR, USA). The scanning electron microscopy (SEM) images of the Au NRs@TiO2 SERS substrate were recorded by JMS-6700F (JEOL, Beijing, China). The SERS analysis was measured with an inVia micro-Raman spectrometer (Renishaw, UK). A laser power of 10 mW (output of the laser) under 633 nm was collected through a 50x objective, and the exposure time was 10 s.
2.3. Synthesis of Au NRs
Au NRs were synthesized using a binary surfactant-assisted seed-mediated method [33,34]. The gold seeds were prepared, where a freshly prepared, ice-cold NaBH4 solution (0.60 mL, 10 mM) was injected into a mixed aqueous solution containing HAuCl4·4H2O (0.50 mM, 5.0 mL) and CTAB (0.20 M, 5.0 mL) under vigorous stirring for 2 min. When the color changed from yellow to brownish yellow, the magnetic stirrer was taken out. The solution was left undisturbed in a water bath at 30 °C for 30 min. To prepare the growth solution, 3.425 g of CTAB and 0.594 g of NaOL were dissolved in 100 mL of water under stirring in a water bath at 50 °C. Then, the solution was allowed to cool to 30 °C. AgNO3 solution (4.649 mL, 4.0 mM) was added and left undisturbed at 30 °C for 15 min. Subsequently, HAuCl4 solution (88 mL, 1.1 mM) was added and stirred (700 rpm) for 90 min until the solution became colorless. Then, HCl (37 wt.% aqueous solution, 12.1 M) was injected to adjust the pH to 1.39. After another 15 min of slow stirring (400 rpm), ascorbic acid (1.965 mL, 15.76 mM) was added to the mixture solution under vigorous stirring for 30 s, followed by the addition of the seed solution (150 μL) under vigorous stirring for 30 s, after which the magnetic stirrer was taken out and the solution was left undisturbed in a water bath at 30 °C for 24 h.
2.4. Preparation of Au NRs@TiO2 SERS Substrate
Six milliliters of prepared Au NR colloid was centrifuged at 9000 rpm for 10 min. After being centrifuged twice, the precipitate was redispersed in 6 mL of water; and 240.0 μL of 0.1 M CTAB, 200.0 μL Tetrabutyl titanate (1.35 wt%) in ethanol, and 60.0 μL of 0.1 M NaOH solution were added into the above redispersed Au NR colloid in sequence. After gently stirring at room temperature for 10 h, the mixture was centrifuged at 6000 rpm for 10 min and the Au NRs@TiO2 composite was redispersed in 1.0 mL of water.
2.5. SERS Detection of Analytes
The prepared Au NRs@TiO2 samples were diluted 4 times, 12 times, 16 times, and 32 times, respectively. Five microliters of different dilutions of Au NRs@TiO2 were dropped onto clean silicon wafers and kept at 37 °C for 1 h. Five microliters of different concentrations of the analytes were dropped onto the silicon wafers. After the analytes were dried in five different batches of Au NRs@TiO2 substrates, the Raman detection was performed and the Raman spectra were collected using an inVia micro-Raman spectrometer.
2.6. Regeneration of the SERS Active Substrate
The Au NRs@TiO2 SERS substrate used was irradiated by ultraviolet (UV) light (254 nm). After 90 min, it was soaked in CTAB aqueous solution for 10 min and dried in the air. The treated Au NRs@TiO2 SERS substrate can again be used for SERS detection of the target.
3. Results and Discussion
3.1. Characterization of the Au NRs@TiO2 SERS Substrate
Au NRs have two absorption peaks: the longitudinal absorption peak and the transverse absorption peak. The position of the absorption peak depends on the shape, nanostructure, size, and surrounding medium because the electron charge density of the particle surface is affected by these factors [35]. The topographical features of the nanoparticles can be analyzed in the ultraviolet−visible absorption (UV−Vis) spectrum. As shown in Figure 1A, the UV−Vis spectra of Au NRs and Au NRs@TiO2 nanostructures showed that the lateral and longitudinal plasmon absorption peaks of Au NRs were 520 nm and 910 nm, respectively. After deposition of TiO2 on the surface of Au NRs, the longitudinal absorption peak shifted by 28 nm and moved to 882 nm. The transmission electron microscope (TEM) in Figure 1B shows that the sizes of the Au NRs are uniform. Tetrabutyl titanate (C16H36O4Ti) in ethanol solution used as the precursor of TiO2 was added into the Au NR colloid, depositing TiO2 on Au NRs through C16H36O4Ti hydrolysis (Figure 1C) and the self-assembling of Au NRs into a three-dimensional structure (Figure 1D), which facilitated the formation of more “hot spots” [36,37,38]. Three-dimensional nanostructures can provide the z-axis local electromagnetic field, resulting in stronger SERS signals overall.
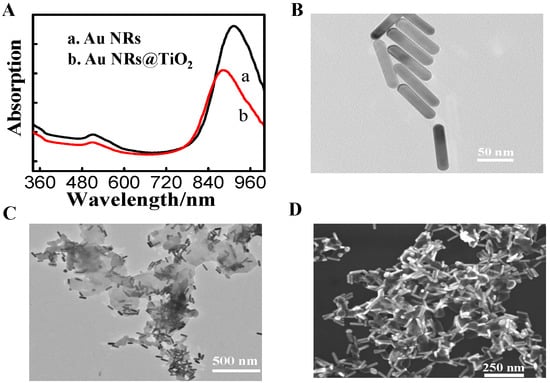
Figure 1.
(A) UV−Vis spectra of Au NRs and Au NRs@TiO2 nanostructures; (B,C) were TEM images of Au NRs and Au NRs@TiO2, respectively. (D) Scanning electronic microscopy (SEM) image of Au NRs@TiO2.
3.2. Optimization of the Procedures for Raman Detection
Firstly, we investigated the effect of different laser light sources on the SERS performance. R6G (rhodamine 6G) was selected as an SERS signal indicator to show the SERS performance of different laser light sources. As displayed in Figure 2A, the intensity of the R6G characteristic Raman peak on the Au NRs@TiO2 substrate was collected at different excitation wavelengths (633 nm and 785 nm). Compared to the 785 nm source, the SERS intensity for the R6G was higher when the 633 nm laser light source was used. Therefore, the laser light source with a wavelength at 633 nm was used for the rest of the experiments in this study. Next, we investigated the effect of the concentrations of Au NRs@TiO2 on the SERS activity. As displayed in Figure 2B, when the concentration varied from a dilution of 32 times to 12 times, the intensity of the Raman characteristic peak of R6G increased with the decrease in dilution factor because the higher concentration of Au NRs can result in the formation of the “hot spot”, enhancing the SERS intensity.
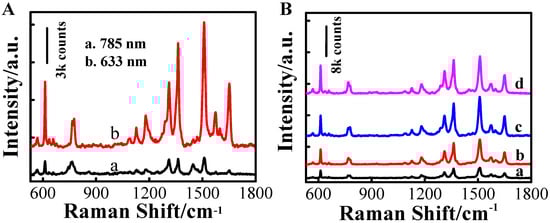
Figure 2.
(A) The comparison of Raman signals collected under different laser light sources with wavelengths of 785 nm and 633 nm, respectively; (B) SERS spectra of 0.10 μM R6G on Au NRs@TiO2 SERS substrates with different amounts of Au NRs@TiO2. The dilution factors of Au NRs@TiO2 in a–d were 32 (a), 16 (b), 12 (c), 4 (d) times, respectively, as compared with the synthesized Au NRs@TiO2 solution.
However, the Raman intensity of R6G was observed to decrease when the Au NRs@TiO2 concentration was too high or too low. We inferred that too high a concentration of Au NRs may lead to the aggregation of Au NRs in solution, while too low a concentration of Au NRs may lead to a low local electromagnetic field. Thus, the optimum Au NRs@TiO2 had a dilution of 12 times.
3.3. SERS Performance of the Au NRs@TiO2 SERS Substrates
Sensitivity and reproducibility are critical in the construction of SERS substrates. To evaluate the SERS performance of the prepared Au NRs@TiO2 substrates, these were compared with Au NRs substrates, and R6G was selected as the Raman probe molecule. Here, 5.0 μL R6G (0.10 μM) was dropped onto the Au NRs@TiO2 substrate and the Au NRs substrate. After R6G was dried, Raman detection was performed and the Raman spectra were collected by using an inVia micro-Raman spectrometer. As shown in Figure 3A, the Raman characteristic peak (1510 cm−1) intensity of 0.10 μM R6G on the Au NRs@TiO2 substrate is stronger than that on the Au NRs substrate. This may be due to more “hot spots” being produced by the three-dimensional structure of Au NRs@TiO2. Another reason is that TiO2 itself has chemical enhancement, producing SERS activity [39]. The synergistic effect of TiO2 and Au NRs leads to SERS signals on the Au NRs@TiO2 substrate being stronger than those of the Au NRs substrate. To further investigate the sensitivity of the Au NRs@TiO2 substrate, R6G with different concentrations on the Au NRs@TiO2 substrate was detected. The characteristic peaks of R6G were located at 612 cm−1 (C–C–C ring in-plane), 769 cm−1 (C–H out of plane bend mode), and 1181 cm−1 (C–C stretching vibrations of the R6G molecules); and the main characteristic peaks of R6G were located at 1362 cm−1 (C–C stretching vibrations), 1510 cm−1 (C–C stretching vibrations), and 1649 cm−1 (C–C stretching vibrations) [40]. In this work, the characteristic peak of R6G at 1510 cm−1 was used as a quantitative peak to evaluate the SERS sensitivity of the proposed Au NRs@TiO2 substrate. As shown in Figure 3B, the characteristic peak of the SERS spectrum at 1510 cm−1 can still be clearly identified even when the concentration of R6G was 0.05 nM, indicating that the proposed Au NRs@TiO2 substrate has a high sensitivity.
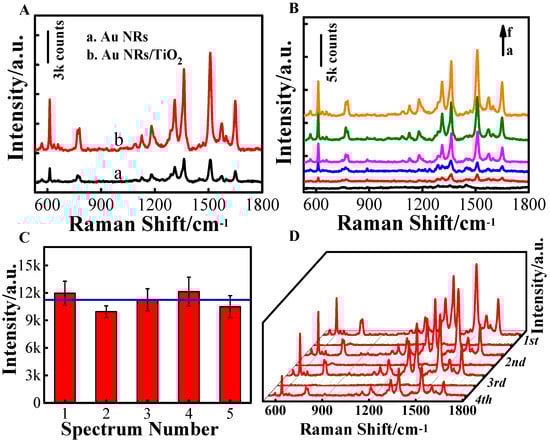
Figure 3.
(A) The SERS signals of 0.1 μM R6G on the Au NRs@TiO2 substrates were compared with those on the Au NRs substrates; (B) SERS spectra of R6G with different concentrations on Au NRs@TiO2 substrates (from a–f: 0 nM, 0.050 nM, 0.10 nM, 1.0 nM, 10.0 nM, 0.10 μM); (C) five parallel-prepared Au NRs@TiO2 substrates evaluated for the detection of 0.10 μM R6G; (D) SERS spectra of R6G adsorbed on the Au NRs@TiO2 substrates, and the repeating cleaning and recovery processes for three cycles.
To test the reproducibility of substrate to substrate, the SERS signals of R6G at 1510 cm−1 from five parallel-prepared Au NRs@TiO2 substrates were collected and analyzed, for which the relative standard deviation (RSD) of Raman intensity was calculated to be 9.1% (Figure 3C). The Au NRs@TiO2 substrates can be recycled through ultraviolet (UV) irradiation, followed by immersing the substrates into CTAB aqueous solution to remove residue.
In order to investigate the recyclability of the Au NRs@TiO2 substrate, a Au NRs@TiO2 substrate with 0.10 μM R6G was detected, irradiated by UV light for 90 min, soaked in CTAB aqueous solution for 10 min, dried in the air, absorbed with 0.10 μM R6G again, and dried before another SERS test was performed. Figure 3D shows the spectra of R6G in the Au NRs@TiO2 substrate before and after cleaning with UV irradiation for 90 min. It can be seen that the SERS signal of R6G disappeared after 90 min of UV irradiation and appeared again when the substrate adsorbed R6G. As shown in Figure 3D, within three cycles, the Au NRs@TiO2 substrates still maintained the high SERS enhancement effect, like when they were first used for SERS detection. After three cycles, the SERS enhancement effect was weakened because some Au NRs@TiO2 nanoparticles had fallen from the surface of the Au NRs@TiO2 substrate. In summary, these results indicated that the Au NRs@TiO2 substrates can clean the adsorbed analytes under UV irradiation to achieve good recyclability, and they can be used as a substrate for recycling, with a recommended maximum of three cycles for guaranteeing a high SERS enhancement effect.
3.4. Detection of Organic Dyes
We have demonstrated that the Au NRs@TiO2 substrate showed excellent SERS activity and can be recycled by UV irradiation. The proposed SERS platform was employed for detecting MG and CV in a liquid sample. The characteristic peak of MG at 1618 cm−1 (the stretching vibrations of ring C–C) [41] was used as the quantitative peak. The result is shown in Figure 4A,B, where the proposed Au NRs@TiO2 substrate can be used to detect the MG quantitatively from 0.75 to 100.0 μg/L, and the lowest detectable concentration of MG in water was 0.75 μg/L. In addition, the corresponding regression equation was y = 741.61x + 242.94 (R = 0.992). In addition, the CV can also be detected by using the proposed SERS substrate. As observed in Figure 4C, the characteristic peak of CV of 1618 cm−1 (the stretching vibration of the ring C–C) [42] can be clearly recognized even when the concentration of CV was only 0.50 μg/L. The plot in Figure 4D depicts a linear relationship between peak intensities and CV concentrations, which ranges from 0.50 to 100.0 μg/L (y = 1047.78x + 508.41, R = 0.994).
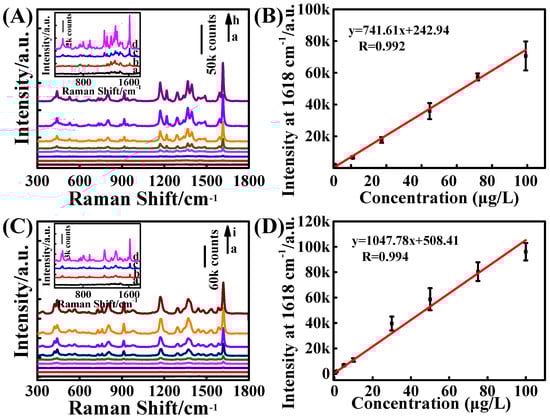
Figure 4.
SERS detections of MG and CV on Au NRs@TiO2 substrates, respectively. (A) The Raman spectrum of MG at different concentrations, from 0 to 100.0 μg/L (a–h), and the insert was from 0 to 10.0 μg/L (a–d). (B) Calibration plots for quantitative detection of MG were from 0.75 to 100.0 μg/L. (C) The Raman spectrum of CV at different concentrations, from 0 to 100.0 μg/L (a–i), and the insert was from 0 to 5.0 μg/L (a–d). (D) Calibrations plot for quantitative detection of CV were from 0.50 to 100.0 μg/L.
Next, 10.0 μg/L MG and 5.0 μg/L CV adsorbed on Au NRs@TiO2 substrates were investigated under UV irradiation. As can be seen in Figure 5A,B, the SERS signals of MG and CV disappeared after UV irradiation for 90 min. When the substrates adsorbed MG and CV again, the SERS signals of MG and CV appeared again, and the substrate still maintained a high SERS enhancement effect. It has been experimentally confirmed that the SERS substrates can be used to detect MG and CV, and can be recycled three times.
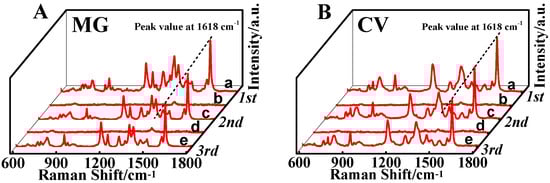
Figure 5.
SERS spectra of (A) MG and (B) CV adsorbed on the Au NRs@TiO2 substrates (a, c, e), and the repeating cleaning and recovery (b, d) processes for three cycles.
3.5. Feasibility of the Method for the Detection of MG and CV in Spiked Fishpond Water
To evaluate the feasibility of this method for real sample analysis, the present study prepared the Au NRs@TiO2 substrates for quantitative SERS detection of MG and CV in spiked fishpond water. The detection results are illustrated in Table 1 and Table 2. The recoveries of MG and CV in different spiked fishpond water samples ranged from 86.67% to 91.20% and 83.70% to 89.00%, respectively, indicating that this method can be used in the detection of MG and CV in real water samples.

Table 1.
The recovery of MG in spiked fishpond water.
Table 2.
The recovery of CV in spiked fishpond water.
4. Conclusions
In conclusion, three-dimensional Au NRs@TiO2 nanocomposites prepared by a green method were developed. Based on the photocatalytic activity of TiO2 and the SERS activity of Au NRs, the prepared Au NRs@TiO2 composites can be used as high-SERS active substrates with an additional advantage of reusability. The results show that the proposed SERS substrate exhibits high SERS activity and reproducibility, and can be recycled at least three times without losing sensitivity. The recoveries of MG and CV in the real water samples were tested to demonstrate the feasibility of the sensor for the detection of environmental pollutants in a complex sample matrix. The recoveries of MG ranged from 86.67% to 91.20%, and the recoveries of CV ranged from 83.70% to 89.00%, both of which indicate that the method can be used to detect environmental pollutants in a complex sample matrix. This green-synthesized SERS substrate has potential applications in food safety analysis, environmental pollutant monitoring, and clinical diagnosis for which rapid and in situ testing is required.
Author Contributions
Conceptualization, H.F. and L.G.; methodology, H.F.; software, N.D.; validation, D.M., Q.X. and B.L.; formal analysis, N.D.; investigation, Z.L.; resources, L.G.; data curation, L.G.; writing—original draft preparation, H.F. and B.L.; writing—review and editing, H.F. and B.L.; visualization, Z.L.; supervision, B.Q.; project administration, B.L.; funding acquisition, L.G. All authors have read and agreed to the published version of the manuscript.
Funding
This research was funded by the National Natural Science Foundation of China, grant number 22074054; and the key Research and Development Program of Zhejiang Province (2020C02022), the Special Support Plan for High-level Talents in Zhejiang Province (2021R52044).
Institutional Review Board Statement
Not applicable.
Informed Consent Statement
Not applicable.
Data Availability Statement
Data available on request from the authors.
Conflicts of Interest
The authors declare no conflict of interest.
References
- Pipoyan, D.; Stepanyan, S.; Beglaryan, M.; Stepanyan, S.; Mantovani, A. Health risk assessment of toxicologically relevant residues in emerging countries: A pilot study on Malachite Green residues in farmed freshwater fish of Armenia. Food Chem. Toxicol. 2020, 143, 111526. [Google Scholar] [CrossRef] [PubMed]
- Srivastava, S.; Sinha, R.; Roy, D. Toxicological effects of malachite green. Aquat. Toxicol. 2004, 66, 319–329. [Google Scholar] [CrossRef] [PubMed]
- Chen, X.; Nguyen, T.H.D.; Gu, L.; Lin, M.S. Use of standing gold nanorods for detection of malachite green and crystal violet in fish by SERS. J. Food Sci. 2017, 82, 1640–1646. [Google Scholar] [CrossRef] [PubMed]
- Gavrilenko, N.A.; Volgina, T.N.; Pugachev, E.V.; Gavrilenko, M.A. Visual determination of malachite green in sea fish samples. Food Chem. 2019, 274, 242–245. [Google Scholar] [CrossRef] [PubMed]
- Hashemi, S.H.; Kaykhaii, M.; Keikha, A.J.; Parkaz, A. Application of Box–Behnken design in the optimization of a simple graphene oxide/zinc oxide nanocomposite-based pipette tip micro-solid phase extraction for the determination of Rhodamine B and Malachite green in seawater samples by spectrophotometry. Anal. Methods 2018, 10, 5707–5714. [Google Scholar] [CrossRef]
- Zhang, L.; Zhang, Y.; Tang, Y.; Li, X.; Zhang, X.; Li, C.; Xu, S. Magnetic solid-phase extraction based on Fe3O4/graphene oxide nanoparticles for the determination of malachite green and crystal violet in environmental water samples by HPLC. Int. J. Environ. Anal. Chem. 2018, 98, 215–228. [Google Scholar] [CrossRef]
- Li, N.; Li, R.; Song, Y.; Ma, L.; Gao, C.; Li, L.; Cheng, S.-B.; Zhang, X.; Chen, J.; Zhan, J. Caramelized carbonaceous shell-coated γ-Fe2O3 as a magnetic solid-phase extraction sorbent for LC-MS/MS analysis of triphenylmethane dyes. Microchim. Acta 2020, 187, 371. [Google Scholar] [CrossRef]
- Rashtbari, S.; Dehghan, G. Biodegradation of malachite green by a novel laccase-mimicking multicopper BSA-Cu complex: Performance optimization, intermediates identification and artificial neural network modeling. J Hazard Mater. 2021, 406, 124340. [Google Scholar] [CrossRef]
- Hu, B.; Sun, D.-W.; Pu, H.; Wei, Q. A dynamically optical and highly stable pNIPAM@ Au NRs nanohybrid substrate for sensitive SERS detection of malachite green in fish fillet. Talanta 2020, 218, 121188. [Google Scholar] [CrossRef]
- Luo, J.; Wang, Z.; Li, Y.; Wang, C.; Sun, J.; Ye, W.; Wang, X.; Shao, B. Durable and flexible Ag-nanowire-embedded PDMS films for the recyclable swabbing detection of malachite green residue in fruits and fingerprints. Sens. Actuators B 2021, 347, 130602. [Google Scholar] [CrossRef]
- Zong, C.; Xu, M.; Xu, L.-J.; Wei, T.; Ma, X.; Zheng, X.-S.; Hu, R.; Ren, B. Surface-enhanced Raman spectroscopy for bioanalysis: Reliability and challenges. Chem. Rev. 2018, 118, 4946–4980. [Google Scholar] [CrossRef] [PubMed]
- Sun, H.; Cong, S.; Zheng, Z.; Wang, Z.; Chen, Z.; Zhao, Z. Metal–organic frameworks as surface enhanced Raman scattering substrates with high tailorability. J. Am. Chem. Soc. 2018, 141, 870–878. [Google Scholar] [CrossRef] [PubMed]
- Kneipp, K.; Wang, Y.; Kneipp, H.; Perelman, L.T.; Itzkan, I.; Dasari, R.R.; Feld, M.S. Single molecule detection using surface-enhanced Raman scattering (SERS). Phys. Rev. Lett. 1997, 78, 1667. [Google Scholar] [CrossRef]
- Nie, S.; Emory, S.R. Probing single molecules and single nanoparticles by surface-enhanced Raman scattering. Science 1997, 275, 1102–1106. [Google Scholar] [CrossRef] [PubMed]
- Chen, J.; Guo, L.; Chen, L.; Qiu, B.; Hong, G.; Lin, Z. Sensing of Hydrogen Sulfide Gas in the Raman-Silent Region Based on Gold Nano-Bipyramids (Au NBPs) Encapsulated by Zeolitic Imidazolate Framework-8. ACS Sens. 2020, 5, 3964–3970. [Google Scholar] [CrossRef] [PubMed]
- Huang, D.; Chen, J.; Ding, L.; Guo, L.; Kannan, P.; Luo, F.; Qiu, B.; Lin, Z. Core-satellite assemblies and exonuclease assisted double amplification strategy for ultrasensitive SERS detection of biotoxin. Anal. Chim. Acta 2020, 1110, 56–63. [Google Scholar] [CrossRef]
- Lin, B.; Chen, J.; Zeng, Y.; Li, L.; Qiu, B.; Lin, Z.; Guo, L. A Facile Approach for On-Site Evaluation of Nicotine in Tobacco and Environmental Tobacco Smoke. ACS Sens. 2019, 4, 1844–1850. [Google Scholar] [CrossRef] [PubMed]
- Li, S.; Zhao, B.; Aguirre, A.; Wang, Y.; Li, R.; Yang, S.; Aravind, I.; Cai, Z.; Chen, R.; Jensen, L. Monitoring Reaction Intermediates in Plasma-Driven SO2, NO, and NO2 Remediation Chemistry Using In Situ SERS Spectroscopy. Anal. Chem. 2021, 93, 6421–6427. [Google Scholar] [CrossRef]
- Lin, B.; Wang, Y.; Yao, Y.; Chen, L.; Zeng, Y.; Li, L.; Lin, Z.; Guo, L. Oil-Free Gold Nanobipyramid@ Ag Microgels as a Functional SERS Substrate for Direct Detection of Small Molecules in a Complex Sample Matrix. Anal. Chem. 2021, 93, 16727–16733. [Google Scholar] [CrossRef]
- Jensen, L.; Aikens, C.M.; Schatz, G.C. Electronic structure methods for studying surface-enhanced Raman scattering. Chem. Soc. Rev. 2008, 37, 1061–1073. [Google Scholar] [CrossRef]
- Chen, C.; Hutchison, J.A.; Clemente, F.; Kox, R.; Uji, I.H.; Hofkens, J.; Lagae, L.; Maes, G.; Borghs, G.; Van Dorpe, P. Direct evidence of high spatial localization of hot spots in surface-enhanced Raman scattering. Angew. Chem. 2009, 48, 9932–9935. [Google Scholar] [CrossRef]
- Ding, S.-Y.; Yi, J.; Li, J.-F.; Ren, B.; Wu, D.-Y.; Panneerselvam, R.; Tian, Z.-Q. Nanostructure-based plasmon-enhanced Raman spectroscopy for surface analysis of materials. Nat. Rev. Mater. 2016, 1, 16021. [Google Scholar] [CrossRef]
- Qi, G.; Wang, D.; Li, C.; Ma, K.; Zhang, Y.; Jin, Y. Plasmonic SERS au nanosunflowers for sensitive and Label-Free diagnosis of DNA base damage in Stimulus-Induced cell apoptosis. Anal. Chem. 2020, 92, 11755–11762. [Google Scholar] [CrossRef] [PubMed]
- Lee, T.; Kwon, S.; Jung, S.; Lim, H.; Lee, J.-J. Macroscopic Ag nanostructure array patterns with high-density hotspots for reliable and ultra-sensitive SERS substrates. Nano Res. 2019, 12, 2554–2558. [Google Scholar] [CrossRef]
- Zhao, X.; Deng, M.; Rao, G.; Yan, Y.; Wu, C.; Jiao, Y.; Deng, A.; Yan, C.; Huang, J.; Wu, S. High-Performance SERS Substrate Based on Hierarchical 3D Cu Nanocrystals with Efficient Morphology Control. Small 2018, 14, 1802477. [Google Scholar] [CrossRef]
- Lin, Y.; Bunker, C.E.; Fernando, K.A.; Connell, J.W. Aqueously dispersed silver nanoparticle-decorated boron nitride nanosheets for reusable, thermal oxidation-resistant surface enhanced Raman spectroscopy (SERS) devices. ACS Appl. Mater. Interfaces 2012, 4, 1110–1117. [Google Scholar] [CrossRef]
- Ye, Y.; Chen, J.; Ding, Q.; Lin, D.; Dong, R.; Yang, L.; Liu, J. Sea-urchin-like Fe3O4@C@Ag particles: An efficient SERS substrate for detection of organic pollutants. Nanoscale 2013, 5, 5887–5895. [Google Scholar] [CrossRef]
- Sinha, G.; Depero, L.E.; Alessandri, I. Recyclable SERS substrates based on Au-coated ZnO nanorods. ACS Appl. Mater. Interfaces 2011, 3, 2557–2563. [Google Scholar] [CrossRef]
- Huang, J.; Dou, L.; Li, J.; Zhong, J.; Li, M.; Wang, T. Excellent visible light responsive photocatalytic behavior of N-doped TiO2 toward decontamination of organic pollutants. J. Hazard. Mater. 2021, 403, 123857. [Google Scholar] [CrossRef]
- Wang, X.; Shi, W.; Wang, S.; Zhao, H.; Lin, J.; Yang, Z.; Chen, M.; Guo, L. Two-dimensional amorphous TiO2 nanosheets enabling high-efficiency photoinduced charge transfer for excellent SERS activity. J. Am. Chem. Soc. 2019, 141, 5856–5862. [Google Scholar] [CrossRef]
- Deng, C.-Y.; Zhang, G.-L.; Zou, B.; Shi, H.-L.; Liang, Y.-J.; Li, Y.-C.; Fu, J.-X.; Wang, W.-Z. TiO2/Ag composite nanowires for a recyclable surface enhanced Raman scattering substrate. Chin. Phys. B 2013, 22, 106102. [Google Scholar] [CrossRef]
- Li, X.; Hu, H.; Li, D.; Shen, Z.; Xiong, Q.; Li, S.; Fan, H.J. Ordered array of gold semishells on TiO2 spheres: An ultrasensitive and recyclable SERS substrate. ACS Appl. Mater. Interfaces 2012, 4, 2180–2185. [Google Scholar] [CrossRef] [PubMed]
- Ye, X.; Zheng, C.; Chen, J.; Gao, Y.; Murray, C.B. Using binary surfactant mixtures to simultaneously improve the dimensional tunability and monodispersity in the seeded growth of gold nanorods. Nano Lett. 2013, 13, 765–771. [Google Scholar] [CrossRef] [PubMed]
- Fu, H.; Chen, J.; Chen, L.; Zhu, X.; Chen, Z.; Qiu, B.; Lin, Z.; Guo, L.; Chen, G. A calcium alginate sponge with embedded gold nanoparticles as a flexible SERS substrate for direct analysis of pollutant dyes. Mikrochim. Acta 2019, 186, 64. [Google Scholar] [CrossRef]
- Huang, X.; Neretina, S.; El-Sayed, M.A. Gold nanorods: From synthesis and properties to biological and biomedical applications. Adv. Mater. 2009, 21, 4880–4910. [Google Scholar] [CrossRef] [PubMed]
- Maher, R.C. SERS Hot Spots. In Raman Spectroscopy for Nanomaterials Characterization; Springer: Berlin/Heidelberg, Germany, 2012; pp. 215–260. [Google Scholar]
- Camden, J.P.; Dieringer, J.A.; Wang, Y.M.; Masiello, D.J.; Marks, L.D.; Schatz, G.C.; Van Duyne, R.P. Probing the structure of single-molecule surface-enhanced Raman scattering hot spots. J. Am. Chem. Soc. 2008, 130, 12616–12617. [Google Scholar] [CrossRef]
- Liu, S.Y.; Tian, X.D.; Zhang, Y.; Li, J.F. Quantitative surface-enhanced Raman spectroscopy through the interface-assisted self-assembly of three-dimensional silver nanorod substrates. Anal. Chem. 2018, 90, 7275–7282. [Google Scholar] [CrossRef]
- Han, X.X.; Ji, W.; Zhao, B.; Ozaki, Y. Semiconductor-enhanced Raman scattering: Active nanomaterials and applications. Nanoscale 2017, 9, 4847–4861. [Google Scholar] [CrossRef]
- Hildebrandt, P.; Stockburger, M. Surface-Enhanced Resonance Raman Spectroscopy of Rhodamine 6G adsorbed on colloidal silver. J. Phys. Chem. 1984, 88, 5935–5944. [Google Scholar] [CrossRef]
- Kumar, P.; Khosla, R.; Soni, M.; Deva, D.; Sharma, S.K. A highly sensitive, flexible SERS sensor for malachite green detection based on Ag decorated microstructured PDMS substrate fabricated from Taro leaf as template. Sens. Actuators B 2017, 246, 477–486. [Google Scholar] [CrossRef]
- Meng, W.; Hu, F.; Zhang, L.-Y.; Jiang, X.-H.; Lu, L.-D.; Wang, X. SERS and DFT study of crystal violet. J. Mol. Struct. 2013, 1035, 326–331. [Google Scholar] [CrossRef]


Disclaimer/Publisher’s Note: The statements, opinions and data contained in all publications are solely those of the individual author(s) and contributor(s) and not of MDPI and/or the editor(s). MDPI and/or the editor(s) disclaim responsibility for any injury to people or property resulting from any ideas, methods, instructions or products referred to in the content. |
© 2022 by the authors. Licensee MDPI, Basel, Switzerland. This article is an open access article distributed under the terms and conditions of the Creative Commons Attribution (CC BY) license (https://creativecommons.org/licenses/by/4.0/).