Dual-Mode Tumor Imaging Using Probes That Are Responsive to Hypoxia-Induced Pathological Conditions

 , ,
, ,  and
and 
Abstract

1. Introduction
2. Hypoxia-Mediated Pathophysiological Changes in the Tumor Microenvironment
2.1. Acidic pH (Acidosis)
2.2. Aberrant Levels of Reactive Chemical Species
2.3. Elevated Levels of Cellular Redox Buffers
2.4. Accumulation of Inorganic Ions
3. Types of Imaging Modalities
3.1. Optical Imaging
3.2. Ultrasound Imaging
3.3. Photoacoustic (Optoacoustic) Imaging
3.4. Single-Photon Emission Computed Tomography (SPECT)
3.5. X-ray Computed Tomography (X-ray CT)
3.6. Positron Emission Tomography (PET)
3.7. Cerenkov Radiation Energy Transfer (CRET) Imaging
3.8. Magnetic Resonance Imaging (MRI) Including Chemical Exchange Saturation Transfer (CEST) and Paramagnetic Shift (PARASHIFT) Imaging
3.9. Electron Paramagnetic Resonance Imaging (EPRI)
3.10. Magnetic Particle Imaging (MPI)
3.11. Raman Spectroscopy and Surface-Enhanced Raman Spectroscopy (SERS)
3.12. Mass Spectrometric Imaging
4. Imaging Hypoxia with Multiple Probes and Multiple Modalities
4.1. MRI and Mass Spectrometric Imaging
4.2. Photoacoustic and Ultrasound Imaging
4.3. MRI and SPECT Imaging
4.4. MRI and X-ray CT Imaging
4.5. MRI and PET Imaging
4.6. PET and X-ray CT Imaging
4.7. SERS and Photoacoustic Imaging
4.8. MRI, EPRI, and PET Imaging
4.9. X-ray CT, MRI, and Photoacoustic Imaging
4.10. Fluorescence, Photoacoustic Imaging, and MRI
5. Dual-Mode Hypoxia-Responsive Probes
5.1. Optical Imaging and MRI
5.2. Fluorescence and Colorimetric Imaging
5.3. SERS and Fluorescence Imaging
5.4. SERS and Colorimetric Imaging
5.5. Fluorescence and Photoacoustic Imaging
5.6. Photoacoustic Imaging and MRI
5.7. Complementary MRI Methods
5.7.1. T1- and T2-Weighted MRI
5.7.2. 1H- and 19F-MRI
5.7.3. T1-Weighted MRI and CEST
6. Conclusions
- (1)
- Dual-mode radiometric probes to overcome limitations of individual imaging modalities, for example, concentration dependency of contrast agents in MRI. Dual-mode imaging enables the integration of complementary advantages while minimizing the limitations of each method; however, these advantages and limitations are unique to instrumentation or the physics of methodology (for example, energy, resolution, sensitivity, and background signal). The use of ratiometric probes is important to uniquely address some of the critical challenges associated with each imaging modality (concentration dependency and potential interferences associated with heterogeneous physiological environments) and ratiometric probes enable obtaining precise information about environments and minimizes the chances of observing false negative and false positive results.
- (2)
- Dual-mode probes to detect relevant differences in physiological environments. Almost all reported probes are unable to detect the early stages of hypoxia. For example, pH-sensitive probes undergo stimuli-responsive changes in the probe when the pH is usually about 6.0–6.5. If a probe could detect a pH value slightly less than 7.4, such tissues could be flagged as potential cancer early, although with a secondary confirmation to avoid false positives. In PET imaging, most tracers detect tumors when the oxygen concentration is less than the clinically relevant hypoxic level (<10 mmHg). Detection of early stages of hypoxia can help maximize the survival rate of cancer patients; therefore, the development of dual-mode probes that are responsive to small changes in physiological conditions is highly desirable in future biomedical applications.
- (3)
- Increased biocompatibility of dual-mode probes for clinical imaging. Functionalizing dual-mode probes to increase biocompatibility, target solubility (water or lipid), and target specificity while minimizing toxicity is needed to use dual-mode probes in clinical imaging. Furthermore, imaging agents should be developed to remain active long enough that the instrument can detect the probe within an imaging-relevant time frame but short enough to clear within a reasonable amount of time.
- (4)
- Development of multiple stimuli-responsive probes. Reported dual-mode probes to date are responsive to specific changes associated with tumor microenvironments. However, the development of probes that are capable of simultaneously detecting more than one stimulus is likely to provide a more precise and accurate characterization of hypoxic tumors.
- (5)
- Integration of dual-mode diagnostic agents with therapeutic agents to detect and treat cancer simultaneously. New physical and chemical theories have been used in synthesizing activity-based sensing probes for tumor imaging and therapy [399,400]. This strategy has the potential to minimize patient exposure to chemicals and harmful radiation and increase the efficiency of clinical diagnosis and therapy of cancer, under the right circumstances. Furthermore, theragnostic dual-mode probes could minimize potential side effects that arise due to the use of multiple probes.
- (6)
- The use of multiple imaging modalities to obtain accurate information about tumor microenvironments. Several multi-modal imaging probes have been reported to measure hypoxia. The inclusion of extra modalities, when selected for a specific purpose, can further overcome the limitations of using only two modalities; however, care must be shown to reasonably determine the utility of these extra modalities.
Funding
Institutional Review Board Statement
Informed Consent Statement
Data Availability Statement
Conflicts of Interest
References
- Shao, C.; Yang, F.; Miao, S.; Liu, W.; Wang, C.; Shu, Y.; Shen, H. Role of hypoxia-induced exosomes in tumor biology. Mol. Cancer 2018, 17, 120. [Google Scholar] [CrossRef] [PubMed]
- Jing, X.; Yang, F.; Shao, C.; Wei, K.; Xie, M.; Shen, H.; Shu, Y. Role of hypoxia in cancer therapy by regulating the tumor microenvironment. Mol. Cancer 2019, 18, 157. [Google Scholar] [CrossRef]
- Ivankovic, I.; Deán-Ben, X.L.; Lin, H.C.A.; Zhang, Z.; Trautz, B.; Petry, A.; Görlach, A.; Razansky, D. Volumetric optoacoustic tomography enables non-invasive in vivo characterization of impaired heart function in hypoxic conditions. Sci. Rep. 2019, 9, 8369. [Google Scholar] [CrossRef] [PubMed]
- Hassan, H.; Chen, R. Hypoxia in Alzheimer’s disease: Effects of hypoxia inducible factors. Neural Regen. Res. 2021, 16, 310. [Google Scholar]
- Ogunshola, O.O.; Antoniou, X. Contribution of hypoxia to Alzheimer’s disease: Is HIF-1α a mediator of neurodegeneration? Cell. Mol. Life Sci. 2009, 66, 3555–3563. [Google Scholar] [CrossRef] [PubMed]
- Vaupel, P.; Mayer, A. Hypoxia in cancer: Significance and impact on clinical outcome. Cancer Metastasis Rev. 2007, 26, 225–239. [Google Scholar] [CrossRef]
- Kumar, A.; Deep, G. Hypoxia in tumor microenvironment regulates exosome biogenesis: Molecular mechanisms and translational opportunities. Cancer Lett. 2020, 479, 23–30. [Google Scholar] [CrossRef]
- Liu, J.N.; Bu, W.; Shi, J. Chemical design and synthesis of functionalized probes for imaging and treating tumor hypoxia. Chem. Rev. 2017, 117, 6160–6224. [Google Scholar] [CrossRef]
- Brown, J.M.; Wilson, W.R. Exploiting tumour hypoxia in cancer treatment. Nat. Rev. Cancer 2004, 4, 437–447. [Google Scholar] [CrossRef]
- Nourazarian, A.R.; Kangari, P.; Salmaninejad, A. Roles of oxidative stress in the development and progression of breast cancer. Asian Pac. J. Cancer Prev. 2014, 15, 4745–4751. [Google Scholar] [CrossRef]
- Al Tameemi, W.; Dale, T.P.; Kh Al-Jumaily, R.M.; Forsyth, N.R. Hypoxia-modified cancer cell metabolism. Front. Cell Dev. Biol. 2019, 7, 4. [Google Scholar] [CrossRef] [PubMed]
- Muz, B.; de la Puente, P.; Azab, F.; Azab, A.K. The role of hypoxia in cancer progression, angiogenesis, metastasis, and resistance to therapy. Hypoxia 2015, 3, 83. [Google Scholar] [CrossRef] [PubMed]
- Keith, B.; Johnson, R.S.; Simon, M.C. HIF1α and HIF2α: Sibling rivalry in hypoxic tumour growth and progression. Nat. Rev. Cancer 2012, 12, 9–22. [Google Scholar] [CrossRef] [PubMed]
- Dengler, V.L.; Galbraith, M.D.; Espinosa, J.M. Transcriptional regulation by hypoxia inducible factors. Crit. Rev. Biochem. Mol. Biol. 2014, 49, 1–15. [Google Scholar] [CrossRef]
- Cerychova, R.; Pavlinkova, G. HIF-1, metabolism, and diabetes in the embryonic and adult heart. Front. Endocrinol. 2018, 9, 460. [Google Scholar] [CrossRef]
- Justus, C.R.; Dong, L.; Yang, L.V. Acidic tumor microenvironment and pH-sensing G protein-coupled receptors. Front. Physiol. 2013, 4, 354. [Google Scholar] [CrossRef]
- Lin, B.; Chen, H.; Liang, D.; Lin, W.; Qi, X.; Liu, H.; Deng, X. Acidic pH and high-H2O2 dual tumor microenvironment-responsive nanocatalytic graphene oxide for cancer selective therapy and recognition. ACS Appl. Mater. Interfaces 2019, 11, 11157–11166. [Google Scholar] [CrossRef]
- Liou, G.-Y.; Storz, P. Reactive oxygen species in cancer. Free Radic. Res. 2010, 44, 479–496. [Google Scholar] [CrossRef]
- Aggarwal, V.; Tuli, H.S.; Varol, A.; Thakral, F.; Yerer, M.B.; Sak, K.; Varol, M.; Jain, A.; Khan, M.A.; Sethi, G. Role of reactive oxygen species in cancer progression: Molecular mechanisms and recent advancements. Biomolecules 2019, 9, 735. [Google Scholar] [CrossRef]
- Wink, D.A.; Vodovotz, Y.; Laval, J.; Laval, F.; Dewhirst, M.W.; Mitchell, J.B. The multifaceted roles of nitric oxide in cancer. Carcinogenesis 1998, 19, 711–721. [Google Scholar] [CrossRef]
- Zhang, J.; Zhen, X.; Zeng, J.; Pu, K. A dual-modal molecular probe for near-infrared fluorescence and photoacoustic imaging of peroxynitrite. Anal. Chem. 2018, 90, 9301–9307. [Google Scholar] [CrossRef] [PubMed]
- Giles, G.I.; Tasker, K.M.; Jacob, C. Hypothesis: The role of reactive sulfur species in oxidative stress. Free Radic. Biol. Med. 2001, 31, 1279–1283. [Google Scholar] [CrossRef]
- Lin, V.S.; Chen, W.; Xian, M.; Chang, C.J. Chemical probes for molecular imaging and detection of hydrogen sulfide and reactive sulfur species in biological systems. Chem. Soc. Rev. 2015, 44, 4596–4618. [Google Scholar] [CrossRef] [PubMed]
- Jorgenson, T.C.; Zhong, W.; Oberley, T.D. Redox imbalance and biochemical changes in cancer. Cancer Res. 2013, 73, 6118–6123. [Google Scholar] [CrossRef]
- Debevec, T.; Millet, G.P.; Pialoux, V. Hypoxia-induced oxidative stress modulation with physical activity. Front. Physiol. 2017, 8, 84. [Google Scholar] [CrossRef]
- Saghiri, M.A.; Asatourian, A.; Orangi, J.; Sorenson, C.M.; Sheibani, N. Functional role of inorganic trace elements in angiogenesis—Part II: Cr, Si, Zn, Cu, and S. Crit. Rev. Oncol. Hematol. 2015, 96, 143–155. [Google Scholar] [CrossRef]
- Wigerup, C.; Påhlman, S.; Bexell, D. Therapeutic targeting of hypoxia and hypoxia-inducible factors in cancer. Pharmacol. Ther. 2016, 164, 152–169. [Google Scholar] [CrossRef]
- Semenza, G.L. Hypoxia-inducible factors: Mediators of cancer progression and targets for cancer therapy. Trends Pharmacol. Sci. 2012, 33, 207–214. [Google Scholar] [CrossRef]
- Nordsmark, M.; Loncaster, J.; Aquino-Parsons, C.; Chou, S.-C.; Ladekarl, M.; Havsteen, H.; Lindegaard, J.C.; Davidson, S.E.; Varia, M.; West, C.; et al. Measurements of hypoxia using pimonidazole and polarographic oxygen-sensitive electrodes in human cervix carcinomas. Radiother. Oncol. 2003, 67, 35–44. [Google Scholar] [CrossRef]
- Knox, H.J.; Kim, T.W.; Zhu, Z.; Chan, J. Photophysical tuning of N-oxide-based probes enables ratiometric photoacoustic imaging of tumor hypoxia. ACS Chem. Biol. 2018, 13, 1838–1843. [Google Scholar] [CrossRef]
- Sun, L.; Li, G.; Chen, X.; Chen, Y.; Jin, C.; Ji, L.; Chao, H. Azo-based iridium (III) complexes as multicolor phosphorescent probes to detect hypoxia in 3D multicellular tumor spheroids. Sci. Rep. 2015, 5, 14837. [Google Scholar] [CrossRef] [PubMed]
- Okuda, K.; Okabe, Y.; Kadonosono, T.; Ueno, T.; Youssif, B.G.M.; Kizaka-Kondoh, S.; Nagasawa, H. 2-Nitroimidazole-tricarbocyanine conjugate as a near-infrared fluorescent probe for in vivo imaging of tumor hypoxia. Bioconjugate Chem. 2012, 23, 324–329. [Google Scholar] [CrossRef] [PubMed]
- Dang, X.; Bardhan, N.M.; Qi, J.; Gu, L.; Eze, N.A.; Lin, C.W.; Kataria, S.; Hammond, P.T.; Belcher, A.M. Deep-tissue optical imaging of near cellular-sized features. Sci. Rep. 2019, 9, 3873. [Google Scholar] [CrossRef] [PubMed]
- Thambi, T.; Park, J.H.; Lee, D.S. Hypoxia-responsive nanocarriers for cancer imaging and therapy: Recent approaches and future perspectives. Chem. Commun. 2016, 52, 8492–8500. [Google Scholar] [CrossRef]
- Knox, H.J.; Hedhli, J.; Kim, T.W.; Khalili, K.; Dobrucki, L.W.; Chan, J. A bioreducible N-oxide-based probe for photoacoustic imaging of hypoxia. Nat. Commun. 2017, 8, 1794. [Google Scholar] [CrossRef]
- Cai, Q.; Yu, T.; Zhu, W.; Xu, Y.; Qian, X. A turn-on fluorescent probe for tumor hypoxia imaging in living cells. Chem. Commun. 2015, 51, 14739–14741. [Google Scholar] [CrossRef]
- Zhao, J.; Chen, J.; Ma, S.; Liu, Q.; Huang, L.; Chen, X.; Lou, K.; Wang, W. Recent developments in multimodality fluorescence imaging probes. Acta Pharm. Sin. B 2018, 8, 320–338. [Google Scholar] [CrossRef]
- Brix, G.; Nekolla, E.A.; Borowski, M.; Noßke, D. Radiation risk and protection of patients in clinical SPECT/CT. Eur. J. Nucl. Med. Mol. Imaging 2014, 41, 125–136. [Google Scholar] [CrossRef]
- Abuelhia, E.; Alghamdi, A. Evaluation of arising exposure of ionizing radiation from computed tomography and the associated health concerns. J. Radiat. Res. Appl. Sci. 2020, 13, 295–300. [Google Scholar] [CrossRef]
- Ekanger, L.A.; Allen, M.J. Overcoming the concentration-dependence of responsive probes for magnetic resonance imaging. Metallomics 2015, 7, 405–421. [Google Scholar] [CrossRef]
- Fleming, I.N.; Manavaki, R.; Blower, P.J.; West, C.; Williams, K.J.; Harris, A.L.; Domarkas, J.; Lord, S.; Baldry, C.; Gilbert, F.J. Imaging tumour hypoxia with positron emission tomography. Br. J. Cancer 2015, 112, 238–250. [Google Scholar] [CrossRef] [PubMed]
- Xue, T.; Shen, J.; Shao, K.; Wang, W.; Wu, B.; He, Y. Strategies for Tumor Hypoxia Imaging Based on Aggregation-Induced Emission Fluorogens. Chem. Eur. J. 2020, 26, 2521–2528. [Google Scholar] [CrossRef] [PubMed]
- Tamaki, N.; Hirata, K. Tumor hypoxia: A new PET imaging biomarker in clinical oncology. Int. J. Clin. Oncol. 2016, 21, 619–625. [Google Scholar] [CrossRef] [PubMed]
- Rajendran, J.G.; Krohn, K.A. F-18 fluoromisonidazole for imaging tumor hypoxia: Imaging the microenvironment for personalized cancer therapy. Semin. Nucl. Med. 2015, 45, 151–162. [Google Scholar] [CrossRef] [PubMed]
- Huang, Y.; Fan, J.; Li, Y.; Fu, S.; Chen, Y.; Wu, J. Imaging of Tumor Hypoxia with Radionuclide-Labeled Tracers for PET. Front. Oncol. 2021, 11, 3547. [Google Scholar] [CrossRef]
- Kumari, R.; Sunil, D.; Ningthoujam, R.S.; Kumar, N.V.A. Azodyes as markers for tumor hypoxia imaging and therapy: An up-to-date review. Chem. Biol. Interact. 2019, 307, 91–104. [Google Scholar] [CrossRef]
- Pacheco-Torres, J.; López-Larrubia, P.; Ballesteros, P.; Cerdán, S. Imaging tumor hypoxia by magnetic resonance methods. NMR Biomed. 2011, 24, 1–16. [Google Scholar] [CrossRef]
- McKeown, S.R. Defining normoxia, physoxia and hypoxia in tumours—Implications for treatment response. Br. J. Radiol. Suppl. 2014, 87, 20130676. [Google Scholar] [CrossRef]
- Baumann, M.U.; Zamudio, S.; Illsley, N.P. Hypoxic upregulation of glucose transporters in BeWo choriocarcinoma cells is mediated by hypoxia-inducible factor-1. Am. J. Physiol. Cell Physiol. 2007, 293, 477–485. [Google Scholar] [CrossRef]
- Semenza, G.L. Regulation of cancer cell metabolism by hypoxia-inducible factor 1. Semin. Cancer Biol. 2009, 19, 12–16. [Google Scholar] [CrossRef]
- Kim, J.-W.; Dang, C.V. Cancer’s molecular sweet tooth and the Warburg effect. Cancer Res. 2006, 66, 8927–8930. [Google Scholar] [CrossRef] [PubMed]
- Kim, J.-W.; Tchernyshyov, I.; Semenza, G.L.; Dang, C.V. HIF-1-mediated expression of pyruvate dehydrogenase kinase: A metabolic switch required for cellular adaptation to hypoxia. Cell Metab. 2006, 3, 177–185. [Google Scholar] [CrossRef] [PubMed]
- Adeva-Andany, M.M.; Pérez-Felpete, N.; Fernández-Fernández, C.; Donapetry-García, C.; Pazos-García, C. Liver glucose metabolism in humans. Biosci. Rep. 2016, 36, e00416. [Google Scholar] [CrossRef] [PubMed]
- Akram, M. Citric acid cycle and role of its intermediates in metabolism. Cell Biochem. Biophys. 2014, 68, 475–478. [Google Scholar] [CrossRef] [PubMed]
- Papandreou, I.; Cairns, R.A.; Fontana, L.; Lim, A.L.; Denko, N.C. HIF-1 mediates adaptation to hypoxia by actively downregulating mitochondrial oxygen consumption. Cell Metab. 2006, 3, 187–197. [Google Scholar] [CrossRef]
- Semenza, G.L. Oxygen-dependent regulation of mitochondrial respiration by hypoxia-inducible factor 1. Biochem. J. 2007, 405, 1–9. [Google Scholar] [CrossRef]
- Zhao, T.; Zhu, Y.; Morinibu, A.; Kobayashi, M.; Shinomiya, K.; Itasaka, S.; Yoshimura, M.; Guo, G.; Hiraoka, M.; Harada, H. HIF-1-mediated metabolic reprogramming reduces ROS levels and facilitates the metastatic colonization of cancers in lungs. Sci. Rep. 2014, 4, 3793. [Google Scholar] [CrossRef]
- Firth, J.D.; Ebert, B.L.; Ratcliffe, P.J. Hypoxic regulation of lactate dehydrogenase A. Int. J. Biol. Chem. 1995, 270, 21021–21027. [Google Scholar] [CrossRef]
- De Milito, A.; Fais, S. Tumor acidity, chemoresistance and proton pump inhibitors. Future Med. 2005, 1, 779–786. [Google Scholar] [CrossRef]
- Hayashi, Y.; Edwards, N.A.; Proescholdt, M.A.; Oldfield, E.H.; Merrill, M.J. Regulation and function of aquaporin-1 in glioma cells. Neoplasia 2007, 9, 777–787. [Google Scholar] [CrossRef]
- McIntyre, A.; Hulikova, A.; Ledaki, I.; Snell, C.; Singleton, D.; Steers, G.; Seden, P.; Jones, D.; Bridges, E.; Wigfield, S.; et al. Disrupting hypoxia-induced bicarbonate transport acidifies tumor cells and suppresses tumor growth. Cancer Res. 2016, 76, 3744–3755. [Google Scholar] [CrossRef] [PubMed]
- Neri, D.; Supuran, C.T. Interfering with pH regulation in tumours as a therapeutic strategy. Nat. Rev. Drug Discov. 2011, 10, 767–777. [Google Scholar] [CrossRef] [PubMed]
- Ullah, M.S.; Davies, A.J.; Halestrap, A.P. The plasma membrane lactate transporter MCT4, but not MCT1, is up-regulated by hypoxia through a HIF-1α-dependent mechanism. Int. J. Biol. Chem. 2006, 281, 9030–9037. [Google Scholar] [CrossRef]
- Rios, E.J.; Fallon, M.; Wang, J.; Shimoda, L.A. Chronic hypoxia elevates intracellular pH and activates Na+/H+ exchange in pulmonary arterial smooth muscle cells. Am. J. Physiol. Lung Cell Mol. Physiol. 2005, 289, 867–874. [Google Scholar] [CrossRef] [PubMed]
- Parks, S.K.; Pouyssegur, J. The Na+/HCO3− Co-Transporter SLC4A4 Plays a Role in Growth and Migration of Colon and Breast Cancer Cells. J. Cell. Physiol. 2015, 230, 1954–1963. [Google Scholar] [CrossRef] [PubMed]
- Matoba, S.; Kang, J.-G.; Patino, W.D.; Wragg, A.; Boehm, M.; Gavrilova, O.; Hurley, P.J.; Bunz, F.; Hwang, P.M. p53 regulates mitochondrial respiration. Science 2006, 312, 1650–1653. [Google Scholar] [CrossRef]
- Böhme, I.; Bosserhoff, A.K. Acidic tumor microenvironment in human melanoma. Pigment. Cell Melanoma Res. 2016, 29, 508–523. [Google Scholar] [CrossRef]
- Chiche, J.; Brahimi-Horn, M.C.; Pouysségur, J. Tumour hypoxia induces a metabolic shift causing acidosis: A common feature in cancer. J. Cell. Mol. Med. 2010, 14, 771–794. [Google Scholar] [CrossRef]
- Švastová, E.; Hulíková, A.; Rafajová, M.; Zat’ovičová, M.; Gibadulinová, A.; Casini, A.; Cecchi, A.; Scozzafava, A.; Supuran, C.T.; Pastorek, J.; et al. Hypoxia activates the capacity of tumor-associated carbonic anhydrase IX to acidify extracellular pH. FEBS Lett. 2004, 577, 439–445. [Google Scholar] [CrossRef]
- Schieber, M.; Chandel, N.S. ROS function in redox signaling and oxidative stress. Curr. Biol. 2014, 24, 453–462. [Google Scholar] [CrossRef]
- Starkov, A.A. The role of mitochondria in reactive oxygen species metabolism and signaling. Ann. N. Y. Acad. Sci. 2008, 1147, 37–52. [Google Scholar] [CrossRef]
- Dunn, J.D.; Alvarez, L.A.; Zhang, X.; Soldati, T. Reactive oxygen species and mitochondria: A nexus of cellular homeostasis. Redox Biol. 2015, 6, 472–485. [Google Scholar] [CrossRef] [PubMed]
- Saikolappan, S.; Kumar, B.; Shishodia, G.; Koul, S.; Koul, H.K. Reactive oxygen species and cancer: A complex interaction. Cancer Lett. 2019, 452, 132–143. [Google Scholar] [CrossRef] [PubMed]
- Ribas, V.; García-Ruiz, C.; Fernández-Checa, J.C. Glutathione and mitochondria. Front. Pharmacol. 2014, 5, 151. [Google Scholar] [CrossRef] [PubMed]
- Rouschop, K.M.A.; Ramaekers, C.H.M.A.; Schaaf, M.B.E.; Keulers, T.G.H.; Savelkouls, K.G.M.; Lambin, P.; Koritzinsky, M.; Wouters, B.G. Autophagy is required during cycling hypoxia to lower production of reactive oxygen species. Radiother. Oncol. 2009, 92, 411–416. [Google Scholar] [CrossRef]
- Jayalakshmi, K.; Sairam, M.; Singh, S.B.; Sharma, S.K.; Ilavazhagan, G.; Banerjee, P.K. Neuroprotective effect of N-acetyl cysteine on hypoxia-induced oxidative stress in primary hippocampal culture. Brain Res. 2005, 1046, 97–104. [Google Scholar] [CrossRef]
- Fukuda, R.; Zhang, H.; Kim, J.-W.; Shimoda, L.; Dang, C.V.; Semenza, G.L. HIF-1 regulates cytochrome oxidase subunits to optimize efficiency of respiration in hypoxic cells. Cell 2007, 129, 111–122. [Google Scholar] [CrossRef]
- Yuan, G.; Khan, S.A.; Luo, W.; Nanduri, J.; Semenza, G.L.; Prabhakar, N.R. Hypoxia-inducible factor 1 mediates increased expression of NADPH oxidase-2 in response to intermittent hypoxia. J. Cell. Physiol. 2011, 226, 2925–2933. [Google Scholar] [CrossRef]
- De Sanctis, F.; Sandri, S.; Ferrarini, G.; Pagliarello, I.; Sartoris, S.; Ugel, S.; Marigo, I.; Molon, B.; Bronte, V. The emerging immunological role of post-translational modifications by reactive nitrogen species in cancer microenvironment. Front. Immunol. 2014, 5, 69. [Google Scholar] [CrossRef]
- Fionda, C.; Abruzzese, M.P.; Santoni, A.; Cippitelli, M. Immunoregulatory and effector activities of nitric oxide and reactive nitrogen species in cancer. Curr. Med. Chem. 2016, 23, 2618–2636. [Google Scholar] [CrossRef]
- Thompson, L.; Dong, Y.; Evans, L. Chronic hypoxia increases inducible NOS-derived nitric oxide in fetal guinea pig hearts. Pediatr. Res. 2009, 65, 188–192. [Google Scholar] [CrossRef] [PubMed]
- Jung, F.; Palmer, L.A.; Zhou, N.; Johns, R.A. Hypoxic regulation of inducible nitric oxide synthase via hypoxia inducible factor-1 in cardiac myocytes. Circ. Res. 2000, 86, 319–325. [Google Scholar] [CrossRef] [PubMed]
- Guo, Y.; Ward, M.E.; Beasjours, S.; Mori, M.; Hussain, S.N.A. Regulation of cerebellar nitric oxide production in response to prolonged in vivo hypoxia. J. Neurosci. Res. 1997, 49, 89–97. [Google Scholar] [CrossRef]
- Radi, R. Oxygen radicals, nitric oxide, and peroxynitrite: Redox pathways in molecular medicine. Proc. Natl. Acad. Sci. USA 2018, 115, 5839–5848. [Google Scholar] [CrossRef]
- Radi, R.; Cassina, A.; Hodara, R.; Quijano, C.; Castro, L. Peroxynitrite reactions and formation in mitochondria. Free Radic. Biol. Med. 2002, 33, 1451–1464. [Google Scholar] [CrossRef]
- Ríos, N.; Prolo, C.; Álvarez, M.N.; Piacenza, L.; Radi, R. Peroxynitrite Formation and Detection in Living Cells. In Nitric Oxide, 3rd ed.; Ignarro, L.J., Freeman, B.A., Eds.; Elsevier: Amsterdam, The Netherlands; Academic Press: Cambridge, MA, USA, 2017; pp. 271–288. [Google Scholar]
- Cobbs, C.S.; Samanta, M.; Harkins, L.E.; Gillespie, G.Y.; Merrick, B.A.; MacMillan-Crow, L.A. Evidence for peroxynitrite-mediated modifications to p53 in human gliomas: Possible functional consequences. Arch. Biochem. Biophys. 2001, 394, 167–172. [Google Scholar] [CrossRef]
- Cobbs, C.S.; Whisenhunt, T.R.; Wesemann, D.R.; Harkins, L.E.; Van Meir, E.G.; Samanta, M. Inactivation of wild-type p53 protein function by reactive oxygen and nitrogen species in malignant glioma cells. Cancer Res. 2003, 63, 8670–8673. [Google Scholar]
- Ida, T.; Sawa, T.; Ihara, H.; Tsuchiya, Y.; Watanabe, Y.; Kumagai, Y.; Suematsu, M.; Motohashi, H.; Fujii, S.; Matsunaga, T.; et al. Reactive cysteine persulfides and S-polythiolation regulate oxidative stress and redox signaling. Proc. Natl. Acad. Sci. USA 2014, 111, 7606–7611. [Google Scholar] [CrossRef]
- Shinkai, Y.; Abiko, Y.; Ida, T.; Miura, T.; Kakehashi, H.; Ishii, I.; Nishida, M.; Sawa, T.; Akaike, T.; Kumagai, Y. Reactive sulfur species-mediated activation of the Keap1–Nrf2 pathway by 1,2-naphthoquinone through sulfenic acids formation under oxidative stress. Chem. Res. Toxicol. 2015, 28, 838–847. [Google Scholar] [CrossRef]
- Shefa, U.; Kim, M.-S.; Jeong, N.Y.; Jung, J. Antioxidant and cell-signaling functions of hydrogen sulfide in the central nervous system. Oxid. Med. Cell. Longev. 2018, 2018, 1–17. [Google Scholar] [CrossRef]
- Cai, S.; Liu, C.; He, S.; Zhao, L.; Zeng, X. Mitochondria-targeted fluorescent probe for imaging endogenous hydrogen sulfide in cellular antioxidant stress. Anal. Methods 2020, 12, 5061–5067. [Google Scholar] [CrossRef] [PubMed]
- Jastrząb, A.; Skrzydlewska, E. Thioredoxin-dependent system. Application of inhibitors. J. Enzym. Inhib. Med. Chem. 2021, 36, 362–371. [Google Scholar] [CrossRef] [PubMed]
- Vučetić, M.; Cormerais, Y.; Parks, S.K.; Pouysségur, J. The central role of amino acids in cancer redox homeostasis: Vulnerability points of the cancer redox code. Front. Oncol. 2017, 7, 319. [Google Scholar] [CrossRef] [PubMed]
- Aoyama, K.; Nakaki, T. Glutathione in cellular redox homeostasis: Association with the excitatory amino acid carrier 1 (EAAC1). Molecules 2015, 20, 8742–8758. [Google Scholar] [CrossRef]
- Samanta, D.; Semenza, G.L. Maintenance of redox homeostasis by hypoxia-inducible factors. Redox Biol. 2017, 13, 331–335. [Google Scholar] [CrossRef]
- Fernández-Checa, J.C.; Kaplowitz, N.; García-Ruiz, C.; Colell, A.; Miranda, M.; Marí, M.; Ardite, E.; Morales, A. GSH transport in mitochondria: Defense against TNF-induced oxidative stress and alcohol-induced defect. Am. J. Physiol. Gastrointest. Liver Physiol. 1997, 273, 7–17. [Google Scholar] [CrossRef]
- Lushchak, V.I. Glutathione homeostasis and functions: Potential targets for medical interventions. J. Amino Acids 2012, 2012, 736837. [Google Scholar] [CrossRef]
- Kimura, H. Hydrogen sulfide: Its production and functions. Exp. Physiol. 2011, 96, 833–835. [Google Scholar] [CrossRef]
- Kimura, Y.; Kimura, H. Hydrogen sulfide protects neurons from oxidative stress. FASEB J. 2004, 18, 1165–1167. [Google Scholar] [CrossRef]
- Wu, J.; Jin, Z.; Zheng, H.; Yan, L.-J. Sources and implications of NADH/NAD+ redox imbalance in diabetes and its complications. Diabetes Metab. Syndr. Obes. 2016, 9, 145. [Google Scholar]
- Schafer, F.Q.; Buettner, G.R. Redox environment of the cell as viewed through the redox state of the glutathione disulfide/glutathione couple. Free Radic. Biol. Med. 2001, 30, 1191–1212. [Google Scholar] [CrossRef]
- Pinto, S.M.; Tomé, V.; Calvete, M.J.F.; Castro, M.M.C.A.; Tóth, É.; Geraldes, C.F.G.C. Metal-based redox-responsive MRI contrast agents. Coord. Chem. Rev. 2019, 390, 1–31. [Google Scholar] [CrossRef]
- Berna, N.; Arnould, T.; Remacle, J.; Michiels, C. Hypoxia-induced increase in intracellular calcium concentration in endothelial cells: Role of the Na+-glucose cotransporter. J. Cell. Biochem. 2002, 84, 115–131. [Google Scholar] [CrossRef]
- Solaini, G.; Baracca, A.; Lenaz, G.; Sgarbi, G. Hypoxia and mitochondrial oxidative metabolism. Biochim. Biophys. Acta Bioenerg. 2010, 1797, 1171–1177. [Google Scholar] [CrossRef] [PubMed]
- Rouslin, W.; Broge, C.W. Mechanisms of ATP conservation during ischemia in slow and fast heart rate hearts. Am. J. Physiol. Cell Physiol. 1993, 264, 209–216. [Google Scholar] [CrossRef]
- Cheng, M.H.Y.; Mo, Y.; Zheng, G. Nano versus molecular: Optical imaging approaches to detect and monitor tumor hypoxia. Adv. Healthc. Mater. 2021, 10, 2001549. [Google Scholar] [CrossRef]
- Min, K.H.; Min, H.S.; Lee, H.J.; Park, D.J.; Yhee, J.Y.; Kim, K.; Kwon, I.C.; Jeong, S.Y.; Silvestre, O.F.; Chen, X.; et al. H-controlled gas-generating mineralized nanoparticles: A theranostic agent for ultrasound imaging and therapy of cancers. ACS Nano 2015, 9, 134–145. [Google Scholar] [CrossRef]
- Jo, J.; Lee, C.H.; Kopelman, R.; Wang, X. In vivo quantitative imaging of tumor pH by nanosonophore assisted multispectral photoacoustic imaging. Nat. Commun. 2017, 8, 471. [Google Scholar] [CrossRef]
- Urtasun, R.C.; Parliament, M.B.; McEwan, A.J.; Mercer, J.R.; Mannan, R.H.; Wiebe, L.I.; Morin, C.; Chapman, J.D. Measurement of hypoxia in human tumours by non-invasive spect imaging of iodoazomycin arabinoside. Br. J. Cancer. 1996, 27, 209. [Google Scholar]
- Shi, H.; Wang, Z.; Huang, C.; Gu, X.; Jia, T.; Zhang, A.; Wu, Z.; Zhu, L.; Luo, X.; Zhao, X.; et al. A functional CT contrast agent for in vivo imaging of tumor hypoxia. Small 2016, 12, 3995–4006. [Google Scholar] [CrossRef]
- Peeters, S.G.J.A.; Zegers, C.M.L.; Yaromina, A.; Van Elmpt, W.; Dubois, L.; Lambin, P. Current preclinical and clinical applications of hypoxia PET imaging using 2-nitroimidazoles. Q. J. Nucl. Med. Mol. Imaging 2015, 59, 39–57. [Google Scholar] [PubMed]
- Krishna, M.C.; Matsumoto, S.; Yasui, H.; Saito, K.; Devasahayam, N.; Subramanian, S.; Mitchell, J.B. Electron paramagnetic resonance imaging of tumor pO2. Radiat. Res. 2012, 177, 376–386. [Google Scholar] [CrossRef]
- Gillies, R.J.; Raghunand, N.; Karczmar, G.S.; Bhujwalla, Z.M. MRI of the tumor microenvironment. J. Magn. Reason. Imaging 2002, 16, 430–450. [Google Scholar] [CrossRef] [PubMed]
- Jung, K.O.; Jo, H.; Yu, J.H.; Gambhir, S.S.; Pratx, G. Development and MPI tracking of novel hypoxia-targeted theranostic exosomes. Biomaterials 2018, 177, 139–148. [Google Scholar] [CrossRef] [PubMed]
- Desvaux, E.; Courteau, A.; Bellaye, P.-S.; Guillemin, M.; Drouet, C.; Walker, P.; Collin, B.; Decréau, R.A. Cherenkov luminescence imaging is a fast and relevant preclinical tool to assess tumour hypoxia in vivo. EJNMMI Res. 2018, 8, 111. [Google Scholar] [CrossRef] [PubMed]
- Huang, Y.; He, S.; Cao, W.; Cai, K.; Liang, X.-J. Biomedical nanomaterials for imaging-guided cancer therapy. Nanoscale 2012, 4, 6135–6149. [Google Scholar] [CrossRef] [PubMed]
- Chen, Q.; Wen, J.; Li, H.; Xu, Y.; Liu, F.; Sun, S. Recent advances in different modal imaging-guided photothermal therapy. Biomaterials 2016, 106, 144–166. [Google Scholar] [CrossRef]
- Grundfest, W.S.; Val-Mejias, J.; Monnet, E.; Knight, B.P.; Nazarian, S.; Berger, R.D.; Ferguson, T.B., Jr.; Roden, M.M.; Amundson, D.; Hanlin, J.; et al. Real-time percutaneous optical imaging of anatomical structures in the heart through blood using a catheter-based infrared imaging system. Semin. Thorac. Cardiovasc. Surg. 2007, 19, 336–341. [Google Scholar] [CrossRef]
- Schäferling, M. The art of fluorescence imaging with chemical sensors. Angew. Chem. Int. Ed. 2012, 51, 3532–3554. [Google Scholar] [CrossRef]
- Barsanti, C.; Lenzarini, F.; Kusmic, C. Diagnostic and prognostic utility of non-invasive imaging in diabetes management. World J. Diabetes 2015, 6, 792. [Google Scholar] [CrossRef]
- Massoud, T.F.; Gambhir, S.S. Molecular imaging in living subjects: Seeing fundamental biological processes in a new light. Genes Dev. 2003, 17, 545–580. [Google Scholar] [CrossRef] [PubMed]
- James, M.L.; Gambhir, S.S. A molecular imaging primer: Modalities, imaging agents, and applications. Physiol. Rev. 2012, 92, 897–965. [Google Scholar] [CrossRef] [PubMed]
- Ramsay, D.T.; Kent, J.C.; Hartmann, R.A.; Hartmann, P.E. Anatomy of the lactating human breast redefined with ultrasound imaging. J. Anat. 2005, 206, 525–534. [Google Scholar] [CrossRef]
- Pimlott, S.L.; Sutherland, A. Molecular tracers for the PET and SPECT imaging of disease. Chem. Soc. Rev. 2011, 40, 149–162. [Google Scholar] [CrossRef] [PubMed]
- Ukil, S.; Reinhardt, J.M. Anatomy-guided lung lobe segmentation in X-ray CT images. IEEE Trans. Med. Imaging 2008, 28, 202–214. [Google Scholar] [CrossRef]
- Sim, N.; Parker, D. Critical design issues in the targeted molecular imaging of cell surface receptors. Chem. Soc. Rev. 2015, 44, 2122–2134. [Google Scholar] [CrossRef]
- Villeirs, G.M.; Verstraete, K.L.; De Neve, W.J.; De Meerleer, G.O. Magnetic resonance imaging anatomy of the prostate and periprostatic area: A guide for radiotherapists. Radiother. Oncol. 2005, 76, 99–106. [Google Scholar] [CrossRef]
- Ashur, I.; Allouche-Arnon, H.; Bar-Shir, A. Calcium fluoride nanocrystals: Tracers for in vivo 19F magnetic resonance imaging. Angew. Chem. Int. Ed. 2018, 57, 7478–7482. [Google Scholar] [CrossRef]
- Yogo, K.; Matsushita, A.; Tatsuno, Y.; Shimo, T.; Hirota, S.; Nozawa, M.; Ozawa, S.; Ishiyama, H.; Yasuda, H.; Nagata, Y.; et al. Imaging Cherenkov emission for quality assurance of high-dose-rate brachytherapy. Sci. Rep. 2020, 10, 3572. [Google Scholar] [CrossRef]
- Tay, Z.W.; Hensley, D.W.; Vreeland, E.C.; Zheng, B.; Conolly, S.M. The relaxation wall: Experimental limits to improving MPI spatial resolution by increasing nanoparticle core size. Biomed. Phy. Eng. Express 2017, 3, 035003. [Google Scholar] [CrossRef]
- Yu, E.Y.; Chandrasekharan, P.; Berzon, R.; Tay, Z.W.; Zhou, X.Y.; Khandhar, A.P.; Ferguson, R.M.; Kemp, S.J.; Zheng, B.; Goodwill, P.W.; et al. Magnetic particle imaging for highly sensitive, quantitative, and safe in vivo gut bleed detection in a murine model. ACS Nano 2017, 11, 12067–12076. [Google Scholar] [CrossRef] [PubMed]
- Simpson, D.A.; Ryan, R.G.; Hall, L.T.; Panchenko, E.; Drew, S.C.; Petrou, S.; Donnelly, P.S.; Mulvaney, P.; Hollenberg, L.C. Electron paramagnetic resonance microscopy using spins in diamond under ambient conditions. Nat. Commun. 2017, 8, 458. [Google Scholar] [CrossRef] [PubMed]
- Buchberger, A.R.; DeLaney, K.; Johnson, J.; Li, L. Mass spectrometry imaging: A review of emerging advancements and future insights. Anal. Chem. 2018, 90, 240. [Google Scholar] [CrossRef] [PubMed]
- Rizzuto, R.; Brini, M.; Pizzo, P.; Murgia, M.; Pozzan, T. Chimeric green fluorescent protein as a tool for visualizing subcellular organelles in living cells. Curr. Biol. 1995, 5, 635–642. [Google Scholar] [CrossRef]
- Gahlaut, N.; Miller, L.W. Time-resolved microscopy for imaging lanthanide luminescence in living cells. Cytom. A 2010, 77, 1113–1125. [Google Scholar] [CrossRef]
- Zhang, L.; Zheng, X.; Deng, W.; Lu, Y.; Lechevallier, S.; Ye, Z.; Goldys, E.M.; Dawes, J.M.; Piper, J.A.; Yuan, J.; et al. Practical implementation, characterization and applications of a multi-colour time-gated luminescence microscope. Sci. Rep. 2014, 4, 6597. [Google Scholar] [CrossRef]
- Katz, J.E.; Clavijo, R.I.; Rizk, P.; Ramasamy, R. The basic physics of waves, soundwaves, and shockwaves for erectile dysfunction. Sex. Med. Rev. 2020, 8, 100–105. [Google Scholar] [CrossRef]
- Carovac, A.; Smajlovic, F.; Junuzovic, D. Application of ultrasound in medicine. Acta Inform. Med. 2011, 19, 168–171. [Google Scholar] [CrossRef]
- Tasnim, T.; Shuvo, M.M.H.; Hasan, S. Study of speckle noise reduction from ultrasound b-mode images using different filtering techniques. In Proceedings of the 4th International Conference on Advances in Electrical Engineering (ICAEE), Dhaka, Bangladesh, 28–30 September 2017; pp. 229–234. [Google Scholar]
- Wang, Q.; Chan, K.F.; Schweizer, K.; Du, X.; Jin, D.; Yu, S.C.H.; Nelson, B.J.; Zhang, L. Ultrasound Doppler-guided real-time navigation of a magnetic microswarm for active endovascular delivery. Sci. Adv. 2021, 7, 5914. [Google Scholar] [CrossRef]
- Hynynen, K.; Jones, R.M. Image-guided ultrasound phased arrays are a disruptive technology for non-invasive therapy. Phys. Med. Biol. 2016, 61, 206. [Google Scholar] [CrossRef]
- Wells, P.N.T.; Liang, H.-D. Medical ultrasound: Imaging of soft tissue strain and elasticity. J. R. Soc. Interface 2011, 8, 1521–1549. [Google Scholar] [CrossRef] [PubMed]
- Culjat, M.O.; Goldenberg, D.; Tewari, P.; Singh, R.S. A review of tissue substitutes for ultrasound imaging. Ultrasound Med. Biol. 2010, 36, 861–873. [Google Scholar] [CrossRef] [PubMed]
- Gielen, J.; Ceulemans, R.; Holsbeeck, M.V. Ultrasound of soft tissue tumors. In Imaging of Soft Tumors, 3rd ed.; De Schepper, A.M., Vanhoenacker, F., Gielen, J., Parizel, P.M., Eds.; Springer: Berlin/Heidelberg, Germany, 2006; Volume 28, pp. 3–18. [Google Scholar]
- Merčep, E.; Deán-Ben, X.L.; Razansky, D. Imaging of blood flow and oxygen state with a multi-segment optoacoustic ultrasound array. Photoacoustics 2018, 10, 48–53. [Google Scholar] [CrossRef]
- Ammirati, E.; Moroni, F.; Pedrotti, P.; Scotti, I.; Magnoni, M.; Bozzolo, E.P.; Rimoldi, O.E.; Camici, P.G. Non-invasive imaging of vascular inflammation. Front. Immunol. 2014, 5, 399. [Google Scholar] [CrossRef]
- Tam, A.C. Applications of photoacoustic sensing techniques. Rev. Mod. Phys. 1986, 58, 381. [Google Scholar] [CrossRef]
- Zhang, Y.; Hong, H.; Cai, W. Photoacoustic imaging. Cold Spring Harb. Protoc. 2011, 2011, 065508. [Google Scholar] [CrossRef] [PubMed]
- Karmacharya, M.B.; Sultan, L.R.; Kirkham, B.M.; Brice, A.K.; Wood, A.K.W.; Sehgal, C.M. Photoacoustic imaging for assessing tissue oxygenation changes in rat hepatic fibrosis. Diagnostics 2020, 10, 705. [Google Scholar] [CrossRef]
- Karmacharya, M.B.; Sultan, L.R.; Sehgal, C.M. Photoacoustic monitoring of oxygenation changes induced by therapeutic ultrasound in murine hepatocellular carcinoma. Sci. Rep. 2021, 11, 4100. [Google Scholar] [CrossRef]
- Okumura, K.; Matsumoto, J.; Iwata, Y.; Yoshida, K.; Yoneda, N.; Ogi, T.; Kitao, A.; Kozaka, K.; Koda, W.; Kobayashi, S.; et al. Evaluation of renal oxygen saturation using photoacoustic imaging for the early prediction of chronic renal function in a model of ischemia-induced acute kidney injury. PLoS ONE 2018, 13, 0206461. [Google Scholar] [CrossRef]
- Li, M.; Tang, Y.; Yao, J. Photoacoustic tomography of blood oxygenation: A mini review. Photoacoustics 2018, 10, 65–73. [Google Scholar] [CrossRef]
- Knešaurek, K.; Machac, J. Comparison of 18F SPECT with PET in myocardial imaging: A realistic thorax-cardiac phantom study. BMC Nucl. Med. 2006, 6, 5. [Google Scholar] [CrossRef] [PubMed]
- Khalil, M.M.; Tremoleda, J.L.; Bayomy, T.B.; Gsell, W. Molecular SPECT imaging: An overview. Int. J. Mol. Imaging 2011, 2011, 796025. [Google Scholar] [CrossRef] [PubMed]
- Ferrando, R.; Damian, A. Brain SPECT as a biomarker of neurodegeneration in dementia in the era of molecular imaging: Still a valid option? Front. Neurol. 2021, 12, 640. [Google Scholar] [CrossRef] [PubMed]
- Waragai, M.; Yamada, T.; Matsuda, H. Evaluation of brain perfusion SPECT using an easy Z-score imaging system (eZIS) as an adjunct to early-diagnosis of neurodegenerative diseases. J. Neurol. Sci. 2007, 260, 57–64. [Google Scholar] [CrossRef]
- Romero-Farina, G.; Aguadé-Bruix, S.; Candell-Riera, J.; Pizzi, M.N.; García-Dorado, D. Cut-off values of myocardial perfusion gated-SPECT phase analysis parameters of normal subjects, and conduction and mechanical cardiac diseases. J. Nucl. Cardiol. 2015, 22, 1247–1258. [Google Scholar] [CrossRef]
- Flotats, A.; Carrió, I. Cardiac neurotransmission SPECT imaging. J. Nucl. Cardiol. 2004, 11, 587–602. [Google Scholar] [CrossRef]
- Simon, B.A. Non-invasive imaging of regional lung function using X-ray computed tomography. J. Clin. Monit. Comput. 2000, 16, 433–442. [Google Scholar] [CrossRef]
- Jorgensen, S.M.; Demirkaya, O.; Ritman, E.L. Three-dimensional imaging of vasculature and parenchyma in intact rodent organs with X-ray micro-CT. Am. J. Physiol. Heart Circ. Physiol. 1998, 275, 1103–1114. [Google Scholar] [CrossRef]
- Kim, D.; Park, S.; Lee, J.H.; Jeong, Y.Y.; Jon, S. Antibiofouling polymer-coated gold nanoparticles as a contrast agent for in vivo X-ray computed tomography imaging. J. Am. Chem. Soc. 2007, 129, 7661–7665. [Google Scholar] [CrossRef]
- Ricci, M.; Boldini, M.; Bonfante, E.; Sambugaro, E.; Vecchini, E.; Schenal, G.; Magnan, B.; Montemezzi, S. Cone-beam computed tomography compared to X-ray in diagnosis of extremities bone fractures: A study of 198 cases. Eur. J. Radiol. Open 2019, 6, 119–121. [Google Scholar] [CrossRef]
- De Clerck, N.M.; Meurrens, K.; Weiler, H.; Van Dyck, D.; Vanhoutte, G.; Terpstra, P.; Postnov, A.A. High-resolution X-ray microtomography for the detection of lung tumors in living mice. Neoplasia 2004, 6, 374–379. [Google Scholar] [CrossRef] [PubMed]
- Zhou, Z.; Zhang, C.; Qian, Q.; Ma, J.; Huang, P.; Pan, L.; Gao, G.; Fu, H.; Fu, S.; Song, H.; et al. Folic acid-conjugated silica capped gold nanoclusters for targeted fluorescence/X-ray computed tomography imaging. J. Nanobiotechnol. 2013, 11, 17. [Google Scholar] [CrossRef]
- Zhang, C.; Zhou, Z.; Qian, Q.; Gao, G.; Li, C.; Feng, L.; Wang, Q.; Cui, D. Glutathione-capped fluorescent gold nanoclusters for dual-modal fluorescence/X-ray computed tomography imaging. J. Mater. Chem. B 2013, 1, 5045–5053. [Google Scholar] [CrossRef] [PubMed]
- Popovtzer, R.; Agrawal, A.; Kotov, N.A.; Popovtzer, A.; Balter, J.; Carey, T.E.; Kopelman, R. Targeted gold nanoparticles enable molecular CT imaging of cancer. Nano Lett. 2008, 8, 4593–4596. [Google Scholar] [CrossRef] [PubMed]
- Liu, Y.; Welch, M.J. Nanoparticles labeled with positron emitting nuclides: Advantages, methods, and applications. Bioconjugate Chem. 2012, 23, 671–682. [Google Scholar] [CrossRef]
- Shukla, A.K.; Kumar, U. Positron emission tomography: An overview. J. Med. Phys. 2006, 31, 13–21. [Google Scholar] [CrossRef]
- Avril, N.; Menzel, M.; Dose, J.; Schelling, M.; Weber, W.; Jänicke, F.; Nathrath, W.; Schwaiger, M. Glucose metabolism of breast cancer assessed by 18F-FDG PET: Histologic and immunohistochemical tissue analysis. J. Nucl. Med. 2001, 42, 9–16. [Google Scholar]
- Lortie, M.; Beanlands, R.S.; Yoshinaga, K.; Klein, R.; DaSilva, J.N.; deKemp, R.A. Quantification of myocardial blood flow with 82Rb dynamic PET imaging. Eur. J. Nucl. Med. Mol. Imaging 2007, 34, 1765–1774. [Google Scholar] [CrossRef]
- Buxton, D.B.; Nienaber, C.A.; Luxen, A.; Ratib, O.; Hansen, H.; Phelps, M.E.; Schelbert, H.R. Noninvasive quantitation of regional myocardial oxygen consumption in vivo with [1-11C] acetate and dynamic positron emission tomography. Circulation 1989, 79, 134–142. [Google Scholar] [CrossRef]
- van Loon, J.; Janssen, M.H.; Öllers, M.; Aerts, H.J.; Dubois, L.; Hochstenbag, M.; Dingemans, A.M.C.; Lalisang, R.; Brans, B.; Windhorst, B.; et al. PET imaging of hypoxia using [18F] HX4: A phase I trial. Eur. J. Nucl. Med. Mol. Imaging 2010, 37, 1663–1668. [Google Scholar] [CrossRef]
- Lapi, S.E.; Voller, T.F.; Welch, M.J. PET imaging of hypoxia. PET Clin. 2009, 4, 39–47. [Google Scholar] [CrossRef] [PubMed]
- Lewis, J.S.; Welch, M.J. PET imaging of hypoxia. Q. J. Nucl. Med. Mol. Imaging 2001, 45, 183–187. [Google Scholar]
- Shaffer, T.M.; Pratt, E.C.; Grimm, J. Utilizing the power of Cerenkov light with nanotechnology. Nat. Nanotechnol. 2017, 12, 106–117. [Google Scholar] [CrossRef] [PubMed]
- Dothager, R.S.; Goiffon, R.J.; Jackson, E.; Harpstrite, S.; Piwnica-Worms, D. Cerenkov radiation energy transfer (CRET) imaging: A novel method for optical imaging of PET isotopes in biological systems. PLoS ONE 2010, 5, 13300. [Google Scholar] [CrossRef] [PubMed]
- Guo, H.; He, X.; Liu, M.; Zhang, Z.; Hu, Z.; Tian, J. Weight multispectral reconstruction strategy for enhanced reconstruction accuracy and stability with Cerenkov luminescence tomography. IEEE Trans. Med. Imaging 2017, 36, 1337–1346. [Google Scholar] [CrossRef]
- Zhang, X.; Lam, S.K.; Palmer, G.; Das, S.; Oldham, M.; Dewhirst, M. Noninvasive measurement of tissue blood oxygenation with Cerenkov imaging during therapeutic radiation delivery. Opt. Lett. 2017, 42, 3101–3104. [Google Scholar] [CrossRef]
- Cao, X.; Gunn, J.R.; Allu, S.R.; Bruza, P.; Jiang, S.; Vinogradov, S.A.; Pogue, B.W. Implantable sensor for local Cherenkov-excited luminescence imaging of tumor pO2 during radiotherapy. J. Biomed. Opt. 2020, 25, 112704. [Google Scholar] [CrossRef]
- Richardson, J.C.; Bowtell, R.W.; Mäder, K.; Melia, C.D. Pharmaceutical applications of magnetic resonance imaging (MRI). Adv. Drug Deliv. Rev. 2005, 57, 1191–1209. [Google Scholar] [CrossRef]
- Katti, G.; Ara, S.A.; Shireen, A. Magnetic resonance imaging (MRI)–A review. Int. J. Dent. Clin. 2011, 3, 65–70. [Google Scholar]
- Lee, S.W.; Hilal, S.K.; Cho, Z.H. A multinuclear magnetic resonance imaging technique-simultaneous proton and sodium imaging. Magn. Reson. Imaging 1986, 4, 343–350. [Google Scholar] [CrossRef]
- Bachert, P.; Schad, L.R.; Bock, M.; Knopp, M.V.; Ebert, M.; Großmann, T.; Heil, W.; Hofmann, D.; Surkau, R.; Otten, E.W. Nuclear magnetic resonance imaging of airways in humans with use of hyperpolarized 3He. Magn. Reason. Med. 1996, 36, 192–196. [Google Scholar] [CrossRef] [PubMed]
- Albert, M.S.; Cates, G.D.; Driehuys, B.; Happer, W.; Saam, B.; Springer, C.S., Jr.; Wishnia, A. Biological magnetic resonance imaging using laser-polarized 129Xe. Nature 1994, 370, 199–201. [Google Scholar] [CrossRef] [PubMed]
- Seifert, A.C.; Wehrli, F.W. Solid-state quantitative 1H and 31P MRI of cortical bone in humans. Curr. Osteoporos. Rep. 2016, 14, 77–86. [Google Scholar] [CrossRef] [PubMed]
- Svyatova, A.; Skovpin, I.V.; Chukanov, N.V.; Kovtunov, K.V.; Chekmenev, E.Y.; Pravdivtsev, A.N.; Hövener, J.-B.; Koptyug, I.V. 15N MRI of SLIC-SABRE Hyperpolarized 15N-Labelled Pyridine and Nicotinamide. Chem. Eur. J. 2019, 25, 8465–8470. [Google Scholar] [CrossRef] [PubMed]
- Fiat, D.; Hankiewicz, J.; Liu, S.; Trbovic, S.; Brint, S. 17O magnetic resonance imaging of the human brain. Neurol. Res. 2004, 26, 803–808. [Google Scholar] [CrossRef] [PubMed]
- Cho, M.H.; Shin, S.H.; Park, S.H.; Kadayakkara, D.K.; Kim, D.; Choi, Y. Targeted, stimuli-responsive, and theranostic 19F magnetic resonance imaging probes. Bioconjugate Chem. 2019, 30, 2502–2518. [Google Scholar] [CrossRef] [PubMed]
- Ruiz-Cabello, J.; Barnett, B.P.; Bottomley, P.A.; Bulte, J.W.M. Fluorine (19F) MRS and MRI in biomedicine. NMR Biomed. 2011, 24, 114–129. [Google Scholar] [CrossRef]
- Ferrauto, G.; Aime, S.; McMahon, M.T.; Morrow, J.R.; Snyder, E.M.; Li, A.; Bartha, R. Chemical exchange saturation transfer (CEST) contrast agents. In Contrast Agents for MRI: Experimental Methods, 1st ed.; Pierre, V.C., Allen, M.J., Eds.; Royal Society of Chemistry: Cambridge, UK, 2017; Volume 13, pp. 243–317. [Google Scholar]
- Consolino, L.; Anemone, A.; Capozza, M.; Carella, A.; Irrera, P.; Corrado, A.; Dhakan, C.; Bracesco, M.; Longo, D.L. Non-invasive investigation of tumor metabolism and acidosis by MRI-CEST imaging. Front. Oncol. 2020, 10, 161. [Google Scholar] [CrossRef]
- Jones, K.M.; Pollard, A.C.; Pagel, M.D. Clinical applications of chemical exchange saturation transfer (CEST) MRI. J. Magn. Reson. Imaging 2018, 47, 11–27. [Google Scholar] [CrossRef]
- Romdhane, F.; Villano, D.; Irrera, P.; Consolino, L.; Longo, D.L. Evaluation of a similarity anisotropic diffusion denoising approach for improving in vivo CEST-MRI tumor pH imaging. Magn. Reson. Med. 2021, 85, 3479–3496. [Google Scholar] [CrossRef]
- Rivlin, M.; Horev, J.; Tsarfaty, I.; Navon, G. Molecular imaging of tumors and metastases using chemical exchange saturation transfer (CEST) MRI. Sci. Rep. 2013, 3, 3045. [Google Scholar] [CrossRef] [PubMed]
- Rivlin, M.; Navon, G. Glucosamine and N-acetyl glucosamine as new CEST MRI agents for molecular imaging of tumors. Sci. Rep. 2016, 6, 32648. [Google Scholar] [CrossRef] [PubMed]
- Harvey, P.; Blamire, A.M.; Wilson, J.I.; Finney, K.-L.N.; Funk, A.M.; Senanayake, P.K.; Parker, D. Moving the goal posts: Enhancing the sensitivity of PARASHIFT proton magnetic resonance imaging and spectroscopy. Chem. Sci. 2013, 4, 4251–4258. [Google Scholar] [CrossRef]
- Yu, M.; Bouley, B.S.; Xie, D.; Enriquez, J.S.; Que, E.L. 19F PARASHIFT probes for magnetic resonance detection of H2O2 and peroxidase activity. J. Am. Chem. Soc. 2018, 140, 10546–10552. [Google Scholar] [CrossRef] [PubMed]
- Ahmad, R.; Kuppusamy, P. Theory, instrumentation, and applications of electron paramagnetic resonance oximetry. Chem. Rev. 2010, 110, 3212–3236. [Google Scholar] [CrossRef]
- Epel, B.; Haney, C.R.; Hleihel, D.; Wardrip, C.; Barth, E.D.; Halpern, H.J. Electron paramagnetic resonance oxygen imaging of a rabbit tumor using localized spin probe delivery. Med. Phys. 2010, 37, 2553–2559. [Google Scholar] [CrossRef]
- Komarov, D.A.; Ichikawa, Y.; Yamamoto, K.; Stewart, N.J.; Matsumoto, S.; Yasui, H.; Kirilyuk, I.A.; Khramtsov, V.V.; Inanami, O.; Hirata, H. In vivo extracellular pH mapping of tumors using electron paramagnetic resonance. Anal. Chem. 2018, 90, 13938–13945. [Google Scholar] [CrossRef]
- Swartz, H.M.; Williams, B.B.; Zaki, B.I.; Hartford, A.C.; Jarvis, L.A.; Chen, E.; Comi, R.J.; Ernstoff, M.S.; Hou, H.; Khan, N.; et al. Clinical EPR: Unique opportunities and some challenges. Acad. Radiol. 2014, 21, 197–206. [Google Scholar] [CrossRef]
- Wu, L.C.; Zhang, Y.; Steinberg, G.; Qu, H.; Huang, S.; Cheng, M.; Bliss, T.; Du, F.; Rao, J.; Song, G.; et al. A review of magnetic particle imaging and perspectives on neuroimaging. Am. J. Neuroradiol. 2019, 40, 206–212. [Google Scholar] [CrossRef]
- Graeser, M.; Knopp, T.; Szwargulski, P.; Friedrich, T.; Gladiss, A.V.; Kaul, M.; Krishnan, K.M.; Ittrich, H.; Adam, G.; Buzug, T.M. Towards picogram detection of superparamagnetic iron-oxide particles using a gradiometric receive coil. Sci. Rep. 2017, 7, 6872. [Google Scholar] [CrossRef]
- Ferguson, R.M.; Khandhar, A.P.; Kemp, S.J.; Arami, H.; Saritas, E.U.; Croft, L.R.; Konkle, J.; Goodwill, P.W.; Halkola, A.; Rahmer, J.; et al. Magnetic particle imaging with tailored iron oxide nanoparticle tracers. IEEE Trans. Med. Imaging 2014, 34, 1077–1084. [Google Scholar] [CrossRef] [PubMed]
- Lyon, L.A.; Keating, C.D.; Fox, A.P.; Baker, B.E.; He, L.; Nicewarner, S.R.; Mulvaney, S.P.; Natan, M.J. Raman spectroscopy. Anal. Chem. 1998, 70, 341–362. [Google Scholar] [CrossRef] [PubMed]
- Mulvaney, S.P.; Keating, C.D. Raman spectroscopy. Anal. Chem. 2000, 72, 145–158. [Google Scholar] [CrossRef] [PubMed]
- Kumamoto, Y.; Harada, Y.; Takamatsu, T.; Tanaka, H. Label-free molecular imaging and analysis by Raman spectroscopy. Acta Histochem. Cytochem. 2018, 51, 101–110. [Google Scholar] [CrossRef]
- Hagiwara, Y.; Yoshida, K.; Yoneda, A.; Torimoto, J.; Yamamoto, J. Experimental variable effects on laser heating of inclusions during Raman spectroscopic analysis. Chem. Geol. 2021, 559, 119928. [Google Scholar] [CrossRef]
- Kneipp, K.; Haka, A.S.; Kneipp, H.; Badizadegan, K.; Yoshizawa, N.; Boone, C.; Shafer-Peltier, K.E.; Motz, J.T.; Dasari, R.R.; Feld, M.S. Surface-enhanced Raman spectroscopy in single living cells using gold nanoparticles. Appl. Spectrosc. 2002, 56, 150–154. [Google Scholar] [CrossRef]
- Qian, X.-M.; Nie, S.M. Single-molecule and single-nanoparticle SERS: From fundamental mechanisms to biomedical applications. Chem. Soc. Rev. 2008, 37, 912–920. [Google Scholar] [CrossRef]
- Fikiet, M.A.; Khandasammy, S.R.; Mistek, E.; Ahmed, Y.; Halámková, L.; Bueno, J.; Lednev, I.K. Surface enhanced Raman spectroscopy: A review of recent applications in forensic science. Spectrochim. Acta A Mol. Biomol. Spectrosc. 2018, 197, 255–260. [Google Scholar] [CrossRef]
- De Jesus, M.A.; Giesfeldt, K.S.; Sepaniak, M.J. Use of a sample translation technique to minimize adverse effects of laser irradiation in surface-enhanced Raman spectrometry. Appl. Spectrosc. 2003, 57, 428–438. [Google Scholar] [CrossRef]
- Cong, S.; Wang, Z.; Gong, W.; Chen, Z.; Lu, W.; Lombardi, J.R.; Zhao, Z. Electrochromic semiconductors as colorimetric SERS substrates with high reproducibility and renewability. Nat. Commun. 2019, 10, 678. [Google Scholar] [CrossRef]
- Sjövall, P.; Lausmaa, J.; Johansson, B. Mass spectrometric imaging of lipids in brain tissue. Anal. Chem. 2004, 76, 4271–4278. [Google Scholar] [CrossRef] [PubMed]
- Svatoš, A. Mass spectrometric imaging of small molecules. Trends Biotechnol. 2010, 28, 425–434. [Google Scholar] [CrossRef] [PubMed]
- de Hoffmann, E. Tandem mass spectrometry: A primer. J. Mass Spectrum. 1996, 31, 129–137. [Google Scholar] [CrossRef]
- Sullards, M.C.; Liu, Y.; Chen, Y.; Merrill, A.H., Jr. Analysis of mammalian sphingolipids by liquid chromatography tandem mass spectrometry (LC-MS/MS) and tissue imaging mass spectrometry (TIMS). Biochim. Biophys. Acta Mol. Cell Biol. Lipids 2011, 1811, 838–853. [Google Scholar] [CrossRef] [PubMed]
- Konz, I.; Fernández, B.; Fernández, M.L.; Pereiro, R.; Sanz-Medel, A. Laser ablation ICP-MS for quantitative biomedical applications. Anal. Bioanal. Chem 2012, 403, 2113–2125. [Google Scholar] [CrossRef] [PubMed]
- Van Malderen, S.J.M.; Laforce, B.; Van Acker, T.; Vincze, L.; Vanhaecke, F. Imaging the 3D trace metal and metalloid distribution in mature wheat and rye grains via laser ablation-ICP-mass spectrometry and micro-X-ray fluorescence spectrometry. J. Anal. At. Spectrom. 2017, 32, 289–298. [Google Scholar] [CrossRef]
- Becker, J.S. Imaging of metals in biological tissue by laser ablation inductively coupled plasma mass spectrometry (LA–ICP–MS): State of the art and future developments. J. Mass. Spectrom. 2013, 48, 255–268. [Google Scholar] [CrossRef] [PubMed]
- Oetjen, J.; Aichler, M.; Trede, D.; Strehlow, J.; Berger, J.; Heldmann, S.; Becker, M.; Gottschalk, M.; Kobarg, J.H.; Wirtz, S.; et al. MRI-compatible pipeline for three-dimensional MALDI imaging mass spectrometry using PAXgene fixation. J. Proteom. 2013, 90, 52–60. [Google Scholar] [CrossRef]
- Thiele, H.; Heldmann, S.; Trede, D.; Strehlow, J.; Wirtz, S.; Dreher, W.; Berger, J.; Oetjen, J.; Kobarg, J.H.; Fischer, B.; et al. 2D and 3D MALDI-imaging: Conceptual strategies for visualization and data mining. Biochim. Biophys. Acta Proteins Proteom. 2014, 1844, 117–137. [Google Scholar] [CrossRef]
- Siegel, T.P.; Hamm, G.; Bunch, J.; Cappell, J.; Fletcher, J.S.; Schwamborn, K. Mass spectrometry imaging and integration with other imaging modalities for greater molecular understanding of biological tissues. Mol. Imaging Biol. 2018, 20, 888–901. [Google Scholar] [CrossRef]
- Tata, A.; Zheng, J.; Ginsberg, H.J.; Jaffray, D.A.; Ifa, D.R.; Zarrine-Afsar, A. Contrast agent mass spectrometry imaging reveals tumor heterogeneity. Anal. Chem. 2015, 87, 7683–7689. [Google Scholar] [CrossRef] [PubMed]
- Santagata, S.; Eberlin, L.S.; Norton, I.; Calligaris, D.; Feldman, D.R.; Ide, J.L.; Liu, X.; Wiley, J.S.; Vestal, M.L.; Ramkissoon, S.H.; et al. Intraoperative mass spectrometry mapping of an onco-metabolite to guide brain tumor surgery. Proc. Natl. Acad. Sci. USA 2014, 111, 11121–11126. [Google Scholar] [CrossRef] [PubMed]
- Calligaris, D.; Norton, I.; Feldman, D.R.; Ide, J.L.; Dunn, I.F.; Eberlin, L.S.; Cooks, R.G.; Jolesz, F.A.; Golby, A.J.; Santagata, S.; et al. Mass spectrometry imaging as a tool for surgical decision-making. J. Mass Spectrom. 2013, 48, 1178–1187. [Google Scholar] [CrossRef] [PubMed]
- Eberlin, L.S.; Norton, I.; Orringer, D.; Dunn, I.F.; Liu, X.; Ide, J.L.; Jarmusch, A.K.; Ligon, K.L.; Jolesz, F.A.; Golby, A.J.; et al. Ambient mass spectrometry for the intraoperative molecular diagnosis of human brain tumors. Proc. Natl. Acad. Sci. USA 2013, 110, 1611–1616. [Google Scholar] [CrossRef] [PubMed]
- Aichler, M.; Huber, K.; Schilling, F.; Lohöfer, F.; Kosanke, K.; Meier, R.; Rummeny, E.J.; Walch, A.; Wildgruber, M. Spatially Resolved Quantification of Gadolinium (III)-Based Magnetic Resonance Agents in Tissue by MALDI Imaging Mass Spectrometry after In Vivo MRI. Angew. Chem. 2015, 127, 4353–4357. [Google Scholar] [CrossRef]
- Attia, A.S.; Schroeder, K.A.; Seeley, E.H.; Wilson, K.J.; Hammer, N.D.; Colvin, D.C.; Manier, M.L.; Nicklay, J.J.; Rose, K.L.; Gore, J.C.; et al. Monitoring the inflammatory response to infection through the integration of MALDI IMS and MRI. Cell Host Microbe 2012, 11, 664–673. [Google Scholar] [CrossRef]
- Sinha, T.K.; Khatib-Shahidi, S.; Yankeelov, T.E.; Mapara, K.; Ehtesham, M.; Cornett, D.S.; Dawant, B.M.; Caprioli, R.M.; Gore, J.C. Integrating spatially resolved three-dimensional MALDI IMS with in vivo magnetic resonance imaging. Nat. Methods 2008, 5, 57–59. [Google Scholar] [CrossRef]
- Becker, J.S.; Zoriy, M.; Matusch, A.; Wu, B.; Salber, D.; Palm, C.; Becker, J.S. Bioimaging of metals by laser ablation inductively coupled plasma mass spectrometry (LA-ICP-MS). Mass Spectrom. Rev. 2010, 29, 156–175. [Google Scholar] [CrossRef]
- Becker, J.S.; Zoriy, M.; Dressler, V.L.; Wu, B.; Becker, J.S. Imaging of metals and metal-containing species in biological tissues and on gels by laser ablation inductively coupled plasma mass spectrometry (LA-ICP-MS): A new analytical strategy for applications in life sciences. Pure Appl. Chem. 2008, 80, 2643–2655. [Google Scholar] [CrossRef]
- Becker, J.S.; Matusch, A.; Palm, C.; Salber, D.; Morton, K.A.; Becker, J.S. Bioimaging of metals in brain tissue by laser ablation inductively coupled plasma mass spectrometry (LA-ICP-MS) and metallomics. Metallomics 2010, 2, 104–111. [Google Scholar] [CrossRef]
- Cruz-Alonso, M.; Lores-Padín, A.; Valencia, E.; González-Iglesias, H.; Fernández, B.; Pereiro, R. Quantitative mapping of specific proteins in biological tissues by laser ablation–ICP-MS using exogenous labels: Aspects to be considered. Anal. Bioanal. Chem. 2019, 411, 549–558. [Google Scholar] [CrossRef] [PubMed]
- O’Neill, E.S.; Kaur, A.; Bishop, D.P.; Shishmarev, D.; Kuchel, P.W.; Grieve, S.M.; Figtree, G.A.; Renfrew, A.K.; Bonnitcha, P.D.; New, E.J. Hypoxia-responsive cobalt complexes in tumor spheroids: Laser ablation inductively coupled plasma mass spectrometry and magnetic resonance imaging studies. Inorg. Chem. 2017, 56, 9860–9868. [Google Scholar] [CrossRef] [PubMed]
- Hester, S.C.; Kuriakose, M.; Nguyen, C.D.; Mallidi, S. Role of ultrasound and photoacoustic imaging in photodynamic therapy for cancer. Photochem. Photobiol. 2020, 96, 260–279. [Google Scholar] [CrossRef]
- Meng, Z.; Zhou, X.; She, J.; Zhang, Y.; Feng, L.; Liu, Z. Ultrasound-responsive conversion of microbubbles to nanoparticles to enable background-free in vivo photoacoustic imaging. Nano Lett. 2019, 19, 8109–8117. [Google Scholar] [CrossRef] [PubMed]
- Sun, Y.Y.; Li, Y.; Wali, B.; Li, Y.; Lee, J.; Heinmiller, A.; Abe, K.; Stein, D.G.; Mao, H.; Sayeed, I.; et al. Prophylactic edaravone prevents transient hypoxic-ischemic brain injury: Implications for perioperative neuroprotection. Stroke 2015, 46, 1947–1955. [Google Scholar] [CrossRef] [PubMed]
- Wang, S.; Zhao, Y.; Xu, Y. Recent advances in applications of multimodal ultrasound-guided photoacoustic imaging technology. Vis. Comput. Ind. Biomed. Art 2020, 3, 1–12. [Google Scholar] [CrossRef] [PubMed]
- Zafar, H.; Breathnach, A.; Subhash, H.M.; Leahy, M.J. Linear-array-based photoacoustic imaging of human microcirculation with a range of high frequency transducer probes. J. Biomed. Opt. 2014, 20, 051021. [Google Scholar] [CrossRef]
- Needles, A.; Heinmiller, A.; Sun, J.; Theodoropoulos, C.; Bates, D.; Hirson, D.; Yin, M.; Foster, F.S. Development and initial application of a fully integrated photoacoustic micro-ultrasound system. IEEE Trans. Ultrason. Ferroelectr. Freq. Control 2013, 60, 888–897. [Google Scholar] [CrossRef]
- Gerling, M.; Zhao, Y.; Nania, S.; Norberg, K.J.; Verbeke, C.S.; Englert, B.; Kuiper, R.V.; Bergström, A.; Hassan, M.; Neesse, A.; et al. Real-time assessment of tissue hypoxia in vivo with combined photoacoustics and high-frequency ultrasound. Theranostics 2014, 4, 604–613. [Google Scholar] [CrossRef]
- Packer, D.L.; Stevens, C.L.; Curley, M.G.; Bruce, C.J.; Miller, F.A.; Khandheria, B.K.; Oh, J.K.; Sinak, L.J.; Seward, J.B. Intracardiac phased-array imaging. J. Am. Coll. Cardiol. 2002, 39, 509–516. [Google Scholar] [CrossRef]
- Chiou, R.K.; Anderson, J.C.; Tran, T.; Patterson, R.H.; Wobig, R.; Taylor, R.J. Evaluation of urethral strictures and associated abnormalities using high-resolution and color Doppler ultrasound. Urology 1996, 47, 102–107. [Google Scholar] [CrossRef]
- Bercoff, J.; Montaldo, G.; Loupas, T.; Savery, D.; Mézière, F.; Fink, M.; Tanter, M. Ultrafast compound Doppler imaging: Providing full blood flow characterization. IEEE Trans. Ultrason. Ferroelectr. Freq. Control 2011, 58, 134–147. [Google Scholar] [CrossRef] [PubMed]
- Silverman, R.H.; Kruse, D.E.; Coleman, D.J.; Ferrara, K.W. High-resolution ultrasonic imaging of blood flow in the anterior segment of the eye. Investig. Ophthalmol. Vis. Sci. 1999, 40, 1373–1381. [Google Scholar]
- Keša, P.; Pokorná, E.; Grajciarová, M.; Tonar, Z.; Vočková, P.; Trochet, P.; Kopeček, M.; Jakša, R.; Šefc, L.; Klener, P. Quantitative in vivo monitoring of hypoxia and vascularization of patient-derived murine xenografts of mantle cell lymphoma using photoacoustic and ultrasound imaging. Ultrasound Med. Biol. 2021, 47, 1099–1107. [Google Scholar] [CrossRef] [PubMed]
- Shah, A.; Bush, N.; Box, G.; Eccles, S.; Bamber, J. Value of combining dynamic contrast enhanced ultrasound and optoacoustic tomography for hypoxia imaging. Photoacoustics 2017, 8, 15–27. [Google Scholar] [CrossRef] [PubMed]
- Mallidi, S.; Watanabe, K.; Timerman, D.; Schoenfeld, D.; Hasan, T. Prediction of tumor recurrence and therapy monitoring using ultrasound-guided photoacoustic imaging. Theranostics 2015, 5, 289–301. [Google Scholar] [CrossRef]
- Murer, A.M.; Hirschmann, M.T.; Amsler, F.; Rasch, H.; Huegli, R.W. Bone SPECT/CT has excellent sensitivity and specificity for diagnosis of loosening and patellofemoral problems after total knee arthroplasty. Knee Surg. Sports Traumatol. Arthrosc. 2020, 28, 1029–1035. [Google Scholar] [CrossRef]
- Bouziotis, P.; Fiorini, C. SPECT/MRI: Dreams or reality? Clin. Transl. Imaging 2014, 2, 571–573. [Google Scholar] [CrossRef][Green Version]
- Devreux, M.; Henoumont, C.; Dioury, F.; Boutry, S.; Vacher, O.; Elst, L.V.; Port, M.; Muller, R.N.; Sandre, O.; Laurent, S. Mn2+ Complexes with Pyclen-Based Derivatives as Contrast Agents for Magnetic Resonance Imaging: Synthesis and Relaxometry Characterization. Inorg. Chem. 2021, 60, 3604–3619. [Google Scholar] [CrossRef]
- Gale, E.M.; Atanasova, I.P.; Blasi, F.; Ay, I.; Caravan, P. A manganese alternative to gadolinium for MRI contrast. J. Am. Chem. Soc. 2015, 137, 15548–15557. [Google Scholar] [CrossRef]
- Wang, J.; Wang, H.; Ramsay, I.A.; Erstad, D.J.; Fuchs, B.C.; Tanabe, K.K.; Caravan, P.; Gale, E.M. Manganese-based contrast agents for magnetic resonance imaging of liver tumors: Structure–activity relationships and lead candidate evaluation. J. Med. Chem. 2018, 61, 8811–8824. [Google Scholar] [CrossRef] [PubMed]
- Gao, H.; Liu, X.; Tang, W.; Niu, D.; Zhou, B.; Zhang, H.; Liu, W.; Gu, B.; Zhou, X.; Zheng, Y.; et al. 99mTc-conjugated manganese-based mesoporous silica nanoparticles for SPECT, pH-responsive MRI and anti-cancer drug delivery. Nanoscale 2016, 8, 19573–19580. [Google Scholar] [CrossRef] [PubMed]
- Gianolio, E.; Maciocco, L.; Imperio, D.; Giovenzana, G.B.; Simonelli, F.; Abbas, K.; Bisi, G.; Aime, S. Dual MRI-SPECT agent for pH-mapping. Chem. Commun. 2011, 47, 1539–1541. [Google Scholar] [CrossRef] [PubMed]
- van Beek, E.J.; Hoffman, E.A. Functional imaging: CT and MRI. Clin. Chest Med. 2008, 29, 195–216. [Google Scholar] [CrossRef] [PubMed]
- Kovács, A.; Palásti, P.; Veréb, D.; Bozsik, B.; Palkó, A.; Kincses, Z.T. The sensitivity and specificity of chest CT in the diagnosis of COVID-19. Eur. Radiol. 2021, 31, 2819–2824. [Google Scholar] [CrossRef]
- Stucht, D.; Danishad, K.A.; Schulze, P.; Godenschweger, F.; Zaitsev, M.; Speck, O. Highest resolution in vivo human brain MRI using prospective motion correction. PLoS ONE 2015, 10, 0133921. [Google Scholar] [CrossRef]
- Hill, D.L.; Hawkes, D.J.; Crossman, J.E.; Gleeson, M.J.; Cox, T.C.S.; Bracey, E.E.C.M.L.; Strong, A.J.; Graves, P. Registration of MR and CT images for skull base surgery using point-like anatomical features. Br. J. Radiol. Suppl. 1991, 64, 1030–1035. [Google Scholar] [CrossRef]
- Lee, Y.S.; Seon, J.K.; Shin, V.I.; Kim, G.-H.; Jeon, M. Anatomical evaluation of CT-MRI combined femoral model. Biomed. Eng. Online 2008, 7, 6. [Google Scholar] [CrossRef]
- Czeibert, K.; Baksa, G.; Grimm, A.; Nagy, S.A.; Kubinyi, E.; Petneházy, Ö. MRI, CT and high resolution macro-anatomical images with cryosectioning of a Beagle brain: Creating the base of a multimodal imaging atlas. PLoS ONE 2019, 14, 0213458. [Google Scholar] [CrossRef]
- Fan, Y.; Tu, W.; Shen, M.; Chen, X.; Ning, Y.; Li, J.; Chen, T.; Wang, H.; Yin, F.; Liu, Y.; et al. Targeted tumor hypoxia dual-mode CT/MR imaging and enhanced radiation therapy using dendrimer-based nanosensitizers. Adv. Funct. Mater. 2020, 30, 1909285. [Google Scholar] [CrossRef]
- Lee, N.; Cho, H.R.; Oh, M.H.; Lee, S.H.; Kim, K.; Kim, B.H.; Shin, K.; Ahn, T.Y.; Choi, J.W.; Kim, Y.W.; et al. Multifunctional Fe3O4/TaOx Core/Shell nanoparticles for simultaneous magnetic resonance imaging and X-ray computed tomography. J. Am. Chem. Soc. 2012, 134, 10309–10312. [Google Scholar] [CrossRef] [PubMed]
- Frullano, L.; Catana, C.; Benner, T.; Sherry, A.D.; Caravan, P. Bimodal MR–PET agent for quantitative pH imaging. Angew. Chem. Int. Ed. 2010, 49, 2382–2384. [Google Scholar] [CrossRef] [PubMed]
- Longo, D.L.; Bartoli, A.; Consolino, L.; Bardini, P.; Arena, F.; Schwaiger, M.; Aime, S. In vivo imaging of tumor metabolism and acidosis by combining PET and MRI-CEST pH imaging. Cancer Res. 2016, 76, 6463–6470. [Google Scholar] [CrossRef] [PubMed]
- Murano, T.; Tateishi, U.; Iinuma, T.; Shimada, N.; Daisaki, H.; Terauchi, T.; Moriyama, N.; Inoue, T. Evaluation of the risk of radiation exposure from new 18FDG PET/CT plans versus conventional X-ray plans in patients with pediatric cancers. Ann. Nucl. Med. 2010, 24, 261–267. [Google Scholar] [CrossRef] [PubMed]
- Bernsdorf, M.; Berthelsen, A.K.; Wielenga, V.T.; Kroman, N.; Teilum, D.; Binderup, T.; Tange, U.B.; Andersson, M.; Kjær, A.; Loft, A.; et al. Preoperative PET/CT in early-stage breast cancer. Ann. Oncol. 2012, 23, 2277–2282. [Google Scholar] [CrossRef]
- Paydary, K.; Seraj, S.M.; Zadeh, M.Z.; Emamzadehfard, S.; Shamchi, S.P.; Gholami, S.; Werner, T.J.; Alavi, A. The evolving role of FDG-PET/CT in the diagnosis, staging, and treatment of breast cancer. Mol. Imaging Biol. 2019, 21, 1–10. [Google Scholar] [CrossRef]
- Denko, N.C. Hypoxia, HIF1 and glucose metabolism in the solid tumour. Nat. Rev. Cancer 2008, 8, 705–713. [Google Scholar] [CrossRef]
- Zeng, W.; Liu, P.; Pan, W.; Singh, S.R.; Wei, Y. Hypoxia and hypoxia inducible factors in tumor metabolism. Cancer Lett. 2015, 356, 263–267. [Google Scholar] [CrossRef]
- Zegers, C.M.; Van Elmpt, W.; Reymen, B.; Even, A.J.; Troost, E.G.; Öllers, M.C.; Hoebers, F.J.; Houben, R.M.; Eriksson, J.; Windhorst, A.D.; et al. In vivo quantification of hypoxic and metabolic status of NSCLC tumors using [18F] HX4 and [18F] FDG-PET/CT imaging. Clin. Cancer Res. 2014, 20, 6389–6397. [Google Scholar] [CrossRef]
- Chen, L.; Zhang, Z.; Kolb, H.C.; Walsh, J.C.; Zhang, J.; Guan, Y. 18F-HX4 hypoxia imaging with PET/CT in head and neck cancer: A comparison with 18F-FMISO. Nucl. Med. Commun. 2012, 33, 1096–1102. [Google Scholar] [CrossRef]
- Mortensen, L.S.; Johansen, J.; Kallehauge, J.; Primdahl, H.; Busk, M.; Lassen, P.; Alsner, J.; Sørensen, B.S.; Toustrup, K.; Jakobsen, S.; et al. FAZA PET/CT hypoxia imaging in patients with squamous cell carcinoma of the head and neck treated with radiotherapy: Results from the DAHANCA 24 trial. Radiother. Oncol. 2012, 105, 14–20. [Google Scholar] [CrossRef] [PubMed]
- Attia, A.B.E.; Balasundaram, G.; Moothanchery, M.; Dinish, U.S.; Bi, R.; Ntziachristos, V.; Olivo, M. A review of clinical photoacoustic imaging: Current and future trends. Photoacoustics 2019, 16, 100144. [Google Scholar] [CrossRef] [PubMed]
- Attia, A.B.E.; Chuah, S.Y.; Razansky, D.; Ho, C.J.H.; Malempati, P.; Dinish, U.S.; Bi, R.; Fu, C.Y.; Ford, S.J.; Lee, J.S.-S.; et al. Noninvasive real-time characterization of non-melanoma skin cancers with handheld optoacoustic probes. Photoacoustics 2017, 7, 20–26. [Google Scholar] [CrossRef]
- Kim, J.; Park, S.; Jung, Y.; Chang, S.; Park, J.; Zhang, Y.; Lovell, J.F.; Kim, C. Programmable real-time clinical photoacoustic and ultrasound imaging system. Sci. Rep. 2016, 6, 35137. [Google Scholar] [CrossRef]
- Zavaleta, C.L.; Smith, B.R.; Walton, I.; Doering, W.; Davis, G.; Shojaei, B.; Natan, M.J.; Gambhir, S.S. Multiplexed imaging of surface enhanced Raman scattering nanotags in living mice using noninvasive Raman spectroscopy. Proc. Natl. Acad. Sci. USA 2009, 106, 13511–13516. [Google Scholar] [CrossRef] [PubMed]
- Wu, X.; Xia, Y.; Huang, Y.; Li, J.; Ruan, H.; Chen, T.; Luo, L.; Shen, Z.; Wu, A. Improved SERS-active nanoparticles with various shapes for CTC detection without enrichment process with supersensitivity and high specificity. ACS Appl. Mater. Interfaces 2016, 8, 19928–19938. [Google Scholar] [CrossRef] [PubMed]
- Ramya, A.N.; Joseph, M.M.; Nair, J.B.; Karunakaran, V.; Narayanan, N.; Maiti, K.K. New insight of tetraphenylethylene-based Raman signatures for targeted SERS nanoprobe construction toward prostate cancer cell detection. ACS Appl. Mater. Interfaces 2016, 8, 10220–10225. [Google Scholar] [CrossRef] [PubMed]
- Dinish, U.S.; Song, Z.; Ho, C.J.H.; Balasundaram, G.; Attia, A.B.E.; Lu, X.; Tang, B.Z.; Liu, B.; Olivo, M. Single molecule with dual function on nanogold: Biofunctionalized construct for in vivo photoacoustic imaging and SERS biosensing. Adv. Funct. Mater. 2015, 25, 2316–2325. [Google Scholar] [CrossRef]
- Shi, W.; Paproski, R.J.; Shao, P.; Forbrich, A.; Lewis, J.D.; Zemp, R.J. Multimodality Raman and photoacoustic imaging of surface-enhanced-Raman-scattering-targeted tumor cells. J. Biomed. Opt. 2016, 21, 020503. [Google Scholar] [CrossRef]
- López-Lázaro, M. Dual role of hydrogen peroxide in cancer: Possible relevance to cancer chemoprevention and therapy. Cancer Lett. 2007, 252, 1–8. [Google Scholar] [CrossRef]
- Li, Q.; Ge, X.; Ye, J.; Li, Z.; Su, L.; Wu, Y.; Yang, H.; Song, J. Dual Ratiometric SERS and Photoacoustic Core–Satellite Nanoprobe for Quantitatively Visualizing Hydrogen Peroxide in Inflammation and Cancer. Angew. Chem. Int. Ed. 2021, 60, 7323–7332. [Google Scholar] [CrossRef] [PubMed]
- Gertsenshteyn, I.; Epel, B.; Barth, E.; Leoni, L.; Markiewicz, E.; Tsai, H.M.; Fan, X.; Giurcanu, M.; Bodero, D.; Zamora, M.; et al. Improving Tumor Hypoxia Location in 18F-Misonidazole PET with Dynamic Contrast-enhanced MRI Using Quantitative Electron Paramagnetic Resonance Partial Oxygen Pressure Images. Radiol. Imaging Cancer 2021, 3, 200104. [Google Scholar] [CrossRef] [PubMed]
- Tseytlin, M.; Stolin, A.V.; Guggilapu, P.; Bobko, A.A.; Khramtsov, V.V.; Tseytlin, O.; Raylman, R.R. A combined positron emission tomography (PET)-electron paramagnetic resonance imaging (EPRI) system: Initial evaluation of a prototype scanner. Phys. Med. Biol. 2018, 63, 105010. [Google Scholar] [CrossRef] [PubMed]
- Kim, H.; Epel, B.; Sundramoorthy, S.; Tsai, H.-M.; Barth, E.; Gertsenshteyn, I.; Halpern, H.; Hua, Y.; Xie, Q.; Chen, C.-T.; et al. Development of a PET/EPRI combined imaging system for assessing tumor hypoxia. J. Instrum. 2021, 16, P03031. [Google Scholar] [CrossRef] [PubMed]
- Liu, Y.; Lv, X.; Liu, H.; Zhou, Z.; Huang, J.; Lei, S.; Cai, S.; Chen, Z.; Guo, Y.; Chen, Z.; et al. Porous gold nanocluster-decorated manganese monoxide nanocomposites for microenvironment-activatable MR/photoacoustic/CT tumor imaging. Nanoscale 2018, 10, 3631–3638. [Google Scholar] [CrossRef]
- Wang, Y.; Song, S.; Lu, T.; Cheng, Y.; Song, Y.; Wang, S.; Tan, F.; Li, J.; Li, N. Oxygen-supplementing mesoporous polydopamine nanosponges with WS2 QDs-embedded for CT/MSOT/MR imaging and thermoradiotherapy of hypoxic cancer. Biomaterials 2019, 220, 119405. [Google Scholar] [CrossRef]
- Wang, S.; You, Q.; Wang, J.; Song, Y.; Cheng, Y.; Wang, Y.; Yang, S.; Yang, L.; Li, P.; Lu, Q.; et al. MSOT/CT/MR imaging-guided and hypoxia-maneuvered oxygen self-supply radiotherapy based on one-pot MnO2-mSiO2@ Au nanoparticles. Nanoscale 2019, 11, 6270–6284. [Google Scholar] [CrossRef]
- Hu, X.; Tang, Y.; Hu, Y.; Lu, F.; Lu, X.; Wang, Y.; Li, J.; Li, Y.; Ji, Y.; Wang, W.; et al. Gadolinium-chelated conjugated polymer-based nanotheranostics for photoacoustic/magnetic resonance/NIR-II fluorescence imaging-guided cancer photothermal therapy. Theranostics 2019, 9, 4168–4181. [Google Scholar] [CrossRef]
- Huang, Q.; Wang, K.; Wanggou, S.; Tian, J.; Li, X. A novel co-targeting strategy of EGFR/SEC61G for multi-modality fluorescence/MR/photoacoustic imaging of glioblastoma. Nanomed. Nanotechnol. Biol. Med. 2022, 40, 102509. [Google Scholar] [CrossRef]
- Wang, Y.; Pang, X.; Wang, J.; Cheng, Y.; Song, Y.; Sun, Q.; You, Q.; Tan, F.; Li, J.; Li, N. Magnetically-targeted and near infrared fluorescence/magnetic resonance/photoacoustic imaging-guided combinational anti-tumor phototherapy based on polydopamine-capped magnetic Prussian blue nanoparticles. J. Mater. Chem. B 2018, 6, 2460–2473. [Google Scholar] [CrossRef]
- Tian, R.; Zhu, L.; Qin, Z.; Wang, G.; Wang, J.; Zhang, H. Glypican-3 (GPC3) targeted Fe3O4 core/Au shell nanocomplex for fluorescence/MRI/photoacoustic imaging-guided tumor photothermal therapy. Biomater. Sci. 2019, 7, 5258–5269. [Google Scholar] [CrossRef] [PubMed]
- Xu, S.; Shi, X.; Chu, C.; Liu, G. A TME-activated in situ nanogenerator for magnetic resonance/fluorescence/photoacoustic imaging. Meth. Enzymol. 2021, 657, 145–156. [Google Scholar]
- Li, Q.; Ren, J.; Chen, Q.; Liu, W.; Xu, Z.; Cao, Y.; Kang, Y.; Xue, P. A HMCuS@MnO2 nanocomplex responsive to multiple tumor environmental clues for photoacoustic/fluorescence/magnetic resonance trimodal imaging-guided and enhanced photothermal/photodynamic therapy. Nanoscale 2020, 12, 12508–12521. [Google Scholar] [CrossRef] [PubMed]
- Tropiano, M.; Faulkner, S. A lanthanide based sensor for the time-gated detection of hydrogen sulfide. Chem. Commun. 2014, 50, 4696–4698. [Google Scholar] [CrossRef]
- Jin, D.; Piper, J.A. Time-gated luminescence microscopy allowing direct visual inspection of lanthanide-stained microorganisms in background-free condition. Anal. Chem. 2011, 83, 2294–2300. [Google Scholar] [CrossRef]
- Zhang, K.Y.; Yu, Q.; Wei, H.; Liu, S.; Zhao, Q.; Huang, W. Long-lived emissive probes for time-resolved photoluminescence bioimaging and biosensing. Chem. Rev. 2018, 118, 1770–1839. [Google Scholar] [CrossRef]
- Song, B.; Liu, Q.; Ma, H.; Tang, Z.; Liu, C.; Zou, J.; Tan, M.; Yuan, J. Tumor-targetable magnetoluminescent silica nanoparticles for bimodal time-gated luminescence/magnetic resonance imaging of cancer cells in vitro and in vivo. Talanta 2020, 220, 121378. [Google Scholar] [CrossRef]
- Song, B.; Shi, W.; Shi, W.; Qin, X.; Ma, H.; Tan, M.; Zhang, W.; Guo, L.; Yuan, J. A dual-modal nanoprobe based on Eu(III) complex–MnO2 nanosheet nanocomposites for time-gated luminescence–magnetic resonance imaging of glutathione in vitro and in vivo. Nanoscale 2019, 11, 6784–6793. [Google Scholar] [CrossRef]
- Tu, C.; Nagao, R.; Louie, A.Y. Multimodal magnetic-resonance/optical-imaging contrast agent sensitive to NADH. Angew. Chem. Int. Ed. 2009, 48, 6547–6551. [Google Scholar] [CrossRef]
- Sowers, M.A.; McCombs, J.R.; Wang, Y.; Paletta, J.T.; Morton, S.W.; Dreaden, E.C.; Boska, M.D.; Ottaviani, M.F.; Hammond, P.T.; Rajca, A.; et al. Redox-responsive branched-bottlebrush polymers for in vivo MRI and fluorescence imaging. Nat. Commun. 2014, 5, 5460. [Google Scholar] [CrossRef]
- Zhao, Z.; Fan, H.; Zhou, G.; Bai, H.; Liang, H.; Wang, R.; Zhang, X.; Tan, W. Activatable fluorescence/MRI bimodal platform for tumor cell imaging via MnO2 nanosheet–aptamer nanoprobe. J. Am. Chem. Soc. 2014, 136, 11220–11223. [Google Scholar] [CrossRef] [PubMed]
- Yuan, D.; Ding, L.; Sun, Z.; Li, X. MRI/Fluorescence bimodal amplification system for cellular GSH detection and tumor cell imaging based on manganese dioxide nanosheet. Sci. Rep. 2018, 8, 1747. [Google Scholar] [CrossRef] [PubMed]
- Zhong, H.; Yu, S.; Li, B.; He, K.; Li, D.; Wang, X.; Wu, Y.-X. Two-photon fluorescence and MR bio-imaging of endogenous H2O2 in the tumor microenvironment using a dual-mode nanoprobe. Chem. Commun. 2021, 57, 6288–6291. [Google Scholar] [CrossRef] [PubMed]
- Hsu, B.Y.W.; Ng, M.; Tan, A.; Connell, J.; Roberts, T.; Lythgoe, M.; Zhang, Y.; Wong, S.Y.; Bhakoo, K.; Seifalian, A.M.; et al. pH-Activatable MnO-Based Fluorescence and Magnetic Resonance Bimodal Nanoprobe for Cancer Imaging. Adv. Healthc. Mater. 2016, 5, 721–729. [Google Scholar] [CrossRef]
- Hu, J.; Liu, T.; Zhang, G.; Jin, F.; Liu, S. Synergistically enhance magnetic resonance/fluorescence imaging performance of responsive polymeric nanoparticles under mildly acidic biological milieu. Macromol. Rapid Commun. 2013, 34, 749–758. [Google Scholar] [CrossRef]
- Yu, K.-K.; Li, K.; Lu, C.-Y.; Xie, Y.-M.; Liu, Y.-H.; Zhou, Q.; Bao, J.-K.; Yu, X.-Q. Multifunctional gold nanoparticles as smart nanovehicles with enhanced tumour-targeting abilities for intracellular pH mapping and in vivo MR/fluorescence imaging. Nanoscale 2020, 12, 2002–2010. [Google Scholar] [CrossRef]
- Jiang, L.; Zhou, Q.; Mu, K.; Xie, H.; Zhu, Y.; Zhu, W.; Zhao, Y.; Xu, H.; Yang, X. pH/temperature sensitive magnetic nanogels conjugated with Cy5.5-labled lactoferrin for MR and fluorescence imaging of glioma in rats. Biomaterials 2013, 34, 7418–7428. [Google Scholar] [CrossRef]
- Gallagher, F.A. An introduction to functional and molecular imaging with MRI. Clin. Radiol. 2010, 65, 557–566. [Google Scholar] [CrossRef]
- Srinivas, M.; Heerschap, A.; Ahrens, E.T.; Figdor, C.G.; de Vries, I.J.M. 19F MRI for quantitative in vivo cell tracking. Trends Biotechnol. 2010, 28, 363–370. [Google Scholar] [CrossRef]
- Li, Y.; Zhang, H.; Guo, C.; Hu, G.; Wang, L. Multiresponsive nanoprobes for turn-on fluorescence/19F MRI dual-modal imaging. Anal. Chem. 2020, 92, 11739–11746. [Google Scholar] [CrossRef]
- Chen, S.; Yang, Y.; Li, H.; Zhou, X.; Liu, M. pH-Triggered Au-fluorescent mesoporous silica nanoparticles for 19F MR/fluorescent multimodal cancer cellular imaging. Chem. Commun. 2014, 50, 283–285. [Google Scholar] [CrossRef] [PubMed]
- Kadakia, R.T.; Xie, D.; Martinez, D., Jr.; Yu, M.; Que, E.L. A dual-responsive probe for detecting cellular hypoxia using 19F magnetic resonance and fluorescence. Chem. Commun. 2019, 55, 8860–8863. [Google Scholar] [CrossRef] [PubMed]
- Wu, J.; Ye, Z.; Wu, F.; Wang, H.; Zeng, L.; Bao, G.-M. A rhodamine-based fluorescent probe for colorimetric and fluorescence lighting-up determination of toxic thiophenols in environmental water and living cells. Talanta 2018, 181, 239–247. [Google Scholar] [CrossRef] [PubMed]
- Kaushik, R.; Singh, A.; Ghosh, A.; Jose, D.A. Selective colorimetric sensor for the detection of Hg2+ and H2S in aqueous medium and waste water samples. ChemistrySelect 2016, 1, 1533–1540. [Google Scholar] [CrossRef]
- Li, C.; Numata, M.; Takeuchi, M.; Shinkai, S. A sensitive colorimetric and fluorescent probe based on a polythiophene derivative for the detection of ATP. Angew. Chem. 2005, 117, 6529–6532. [Google Scholar] [CrossRef]
- Rao, H.; Ge, H.; Wang, X.; Zhang, Z.; Liu, X.; Yang, Y.; Liu, Y.; Liu, W.; Zou, P.; Wang, Y. Colorimetric and fluorometric detection of protamine by using a dual-mode probe consisting of carbon quantum dots and gold nanoparticles. Microchim. Acta 2017, 184, 3017–3025. [Google Scholar] [CrossRef]
- Chao, J.; Song, K.; Zhang, Y.; Yin, C.; Huo, F.; Wang, J.; Zhang, T. A pyrene-based colorimetric and fluorescent pH probe with large stokes shift and its application in bioimaging. Talanta 2018, 189, 150–156. [Google Scholar] [CrossRef]
- Yang, P.; Zhu, Z.; Zhang, T.; Zhang, W.; Chen, W.; Cao, Y.; Chen, M.; Zhou, X. Orange-emissive carbon quantum dots: Toward application in wound pH monitoring based on colorimetric and fluorescent changing. Small 2019, 15, 1902823. [Google Scholar] [CrossRef]
- Tsourdi, E.; Barthel, A.; Rietzsch, H.; Reichel, A.; Bornstein, S.R. Current aspects in the pathophysiology and treatment of chronic wounds in diabetes mellitus. Biomed. Res. Int. 2013, 2013, 385641. [Google Scholar] [CrossRef]
- Payen, V.L.; Brisson, L.; Dewhirst, M.W.; Sonveaux, P. Common responses of tumors and wounds to hypoxia. Cancer J. 2015, 21, 75–87. [Google Scholar] [CrossRef]
- Singh, V.K.; Yadav, P.K.; Chandra, S.; Bano, D.; Talat, M.; Hasan, S.H. Peroxidase mimetic activity of fluorescent NS-carbon quantum dots and their application in colorimetric detection of H2O2 and glutathione in human blood serum. J. Mater. Chem. B 2018, 6, 5256–5268. [Google Scholar] [CrossRef] [PubMed]
- Weiss, S. Fluorescence spectroscopy of single biomolecules. Science 1999, 283, 1676–1683. [Google Scholar] [CrossRef]
- Eggeling, C.; Widengren, J.; Rigler, R.; Seidel, C.A.M. Photobleaching of fluorescent dyes under conditions used for single-molecule detection: Evidence of two-step photolysis. Anal. Chem. 1998, 70, 2651–2659. [Google Scholar] [CrossRef] [PubMed]
- Porter, M.D.; Lipert, R.J.; Siperko, L.M.; Wang, G.; Narayanan, R. SERS as a bioassay platform: Fundamentals, design, and applications. Chem. Soc. Rev. 2008, 37, 1001–1011. [Google Scholar] [CrossRef] [PubMed]
- Wang, Y.; Seebald, J.L.; Szeto, D.P.; Irudayaraj, J. Biocompatibility and biodistribution of surface-enhanced Raman scattering nanoprobes in zebrafish embryos: In vivo and multiplex imaging. ACS Nano 2010, 4, 4039–4053. [Google Scholar] [CrossRef] [PubMed]
- Niu, X.; Chen, H.; Wang, Y.; Wang, W.; Sun, X.; Chen, L. Upconversion fluorescence-SERS dual-mode tags for cellular and in vivo imaging. ACS Appl. Mater. Interfaces 2014, 6, 5152–5160. [Google Scholar] [CrossRef]
- Lee, S.; Chon, H.; Yoon, S.-Y.; Lee, E.K.; Chang, S.-I.; Lim, D.W.; Choo, J. Fabrication of SERS-fluorescence dual modal nanoprobes and application to multiplex cancer cell imaging. Nanoscale 2012, 4, 124–129. [Google Scholar] [CrossRef]
- Bamrungsap, S.; Treetong, A.; Apiwat, C.; Wuttikhun, T.; Dharakul, T. SERS-fluorescence dual mode nanotags for cervical cancer detection using aptamers conjugated to gold-silver nanorods. Microchim. Acta 2016, 183, 249–256. [Google Scholar] [CrossRef]
- Wang, Z.; Zong, S.; Chen, H.; Wang, C.; Xu, S.; Cui, Y. SERS-Fluorescence Joint Spectral Encoded Magnetic Nanoprobes for Multiplex Cancer Cell Separation. Adv. Healthc. Mater. 2014, 3, 1889–1897. [Google Scholar] [CrossRef]
- Saranya, G.; Joseph, M.M.; Karunakaran, V.; Nair, J.B.; Saritha, V.N.; Veena, V.S.; Sujathan, K.; Ajayaghosh, A.; Maiti, K.K. Enzyme-driven switchable fluorescence-SERS diagnostic nanococktail for the multiplex detection of lung cancer biomarkers. ACS Appl. Mater. Interfaces 2018, 10, 38807–38818. [Google Scholar] [CrossRef]
- Truman, L.K.; Comby, S.; Gunnlaugsson, T. pH-Responsive Luminescent Lanthanide-Functionalized Gold Nanoparticles with “On–Off” Ytterbium Switchable Near-Infrared Emission. Angew. Chem. 2012, 124, 9762–9765. [Google Scholar] [CrossRef]
- Thomas, K.G.; Kamat, P.V. Chromophore-functionalized gold nanoparticles. Acc. Chem. Res. 2003, 36, 888–898. [Google Scholar] [CrossRef] [PubMed]
- Xu, J.; Yu, H.; Hu, Y.; Chen, M.; Shao, S. A gold nanoparticle-based fluorescence sensor for high sensitive and selective detection of thiols in living cells. Biosens. Bioelectron. 2016, 75, 1–7. [Google Scholar] [CrossRef] [PubMed]
- Engel, S.; Fritz, E.-C.; Ravoo, B.J. New trends in the functionalization of metallic gold: From organosulfur ligands to N-heterocyclic carbenes. Chem. Soc. Rev. 2017, 46, 2057–2075. [Google Scholar] [CrossRef]
- Mahato, K.; Nagpal, S.; Shah, M.A.; Srivastava, A.; Maurya, P.K.; Roy, S.; Jaiswal, A.; Singh, R.; Chandra, P. Gold nanoparticle surface engineering strategies and their applications in biomedicine and diagnostics. 3 Biotech 2019, 9, 57. [Google Scholar] [CrossRef]
- Yao, W.; Chang, L.; Yin, W.; Wang, T.; Yang, Y.; Yin, P.; Yang, M.; Ma, Y.; Qin, Y.; Ma, H. One immunoassay probe makes SERS and fluorescence two readout signals: Rapid imaging and determination of intracellular glutathione levels. Spectrochim. Acta A 2019, 223, 117303. [Google Scholar] [CrossRef]
- Yang, G.; Zhang, Q.; Liang, Y.; Liu, H.; Qu, L.-L.; Li, H. Fluorescence-SERS dual-signal probes for pH sensing in live cells. Colloids Surf. A Physicochem. Eng. Asp. 2019, 562, 289–295. [Google Scholar] [CrossRef]
- Reshetnikov, V.; Daum, S.; Janko, C.; Karawacka, W.; Tietze, R.; Alexiou, C.; Paryzhak, S.; Dumych, T.; Bilyy, R.; Tripal, P.; et al. ROS-Responsive N-Alkylaminoferrocenes for Cancer-Cell-Specific Targeting of Mitochondria. Angew. Chem. 2018, 130, 12119–12122. [Google Scholar] [CrossRef]
- Lim, S.H.; Wu, L.; Burgess, K.; Lee, H.B. New cytotoxic rosamine derivatives selectively accumulate in the mitochondria of cancer cells. Anticancer Drugs 2009, 20, 461–468. [Google Scholar] [CrossRef]
- Eling, C.J.; Price, T.W.; Marshall, A.R.L.; Viscomi, F.N.; Robinson, P.; Firth, G.; Adawi, A.M.; Bouillard, J.-S.G.; Stasiuk, G.J. A Dual-Modal SERS/Fluorescence Gold Nanoparticle Probe for Mitochondrial Imaging. ChemPlusChem 2017, 82, 674–680. [Google Scholar] [CrossRef]
- Yue, S.; Sun, X.; Wang, N.; Wang, Y.; Wang, Y.; Xu, Z.; Chen, M.; Wang, J. SERS–fluorescence dual-mode pH-sensing method based on Janus microparticles. ACS Appl. Mater. Interfaces 2017, 9, 39699–39707. [Google Scholar] [CrossRef] [PubMed]
- Ahn, Y.J.; Gil, Y.-G.; Lee, Y.J.; Jang, H.; Lee, G.-J. A dual-mode colorimetric and SERS detection of hydrogen sulfide in live prostate cancer cells using a silver nanoplate-coated paper assay. Microchem. J. 2020, 155, 104724. [Google Scholar] [CrossRef]
- Lin, D.; Zhou, J.; Yu, Y.; Chen, W.; Liao, P.-H.; Huang, H.; Kong, K.V. A dual-mode biosensor combining transition metal carbonyl-based SERS and a colorimetric readout for thiol detection. Anal. Methods 2019, 11, 5232–5236. [Google Scholar] [CrossRef]
- Li, M.; Li, H.; Wu, Q.; Niu, N.; Huang, J.; Zhang, L.; Li, Y.; Wang, D.; Tang, B.Z. Hypoxia-activated probe for NIR fluorescence and photoacoustic dual-mode tumor imaging. iScience 2021, 24, 102261. [Google Scholar] [CrossRef] [PubMed]
- Tian, Y.; Jiang, W.-L.; Wang, W.-X.; Mao, G.-J.; Li, Y.; Li, C.-Y. NAD(P)H-triggered probe for dual-modal imaging during energy metabolism and novel strategy of enhanced photothermal therapy in tumor. Biomaterials 2021, 271, 120736. [Google Scholar] [CrossRef] [PubMed]
- Tsogas, G.Z.; Kappi, F.A.; Vlessidis, A.G.; Giokas, D.L. Recent advances in nanomaterial probes for optical biothiol sensing: A review. Anal. Lett. 2018, 51, 443–468. [Google Scholar] [CrossRef]
- Anees, P.; Joseph, J.; Sreejith, S.; Menon, N.V.; Kang, Y.; Yu, S.W.-K.; Ajayaghosh, A.; Zhao, Y. Real time monitoring of aminothiol level in blood using a near-infrared dye assisted deep tissue fluorescence and photoacoustic bimodal imaging. Chem. Sci. 2016, 7, 4110–4116. [Google Scholar] [CrossRef]
- Lin, J.; Lee, I.-M.; Song, Y.; Cook, N.R.; Selhub, J.; Manson, J.E.; Buring, J.E.; Zhang, S.M. Plasma homocysteine and cysteine and risk of breast cancer in women. Cancer Res. 2010, 70, 2397–2405. [Google Scholar] [CrossRef]
- Miller, J.W.; Beresford, S.A.A.; Neuhouser, M.L.; Cheng, T.-Y.D.; Song, X.; Brown, E.C.; Zheng, Y.; Rodriguez, B.; Green, R.; Ulrich, C.M. Homocysteine, cysteine, and risk of incident colorectal cancer in the Women’s Health Initiative observational cohort. Am. J. Clin. Nutr. 2013, 97, 827–834. [Google Scholar] [CrossRef]
- Goodman, M.T.; McDuffie, K.; Hernandez, B.; Wilkens, L.R.; Selhub, J. Case-control study of plasma folate, homocysteine, vitamin B12, and cysteine as markers of cervical dysplasia. Cancer 2000, 89, 376–382. [Google Scholar] [CrossRef]
- Fang, H.; Chen, Y.; Wang, Y.; Geng, S.; Yao, S.; Song, D.; He, W.; Guo, Z. A dual-modal probe for NIR fluorogenic and ratiometric photoacoustic imaging of Cys/Hcy in vivo. Sci. China Chem. 2020, 63, 699–706. [Google Scholar] [CrossRef]
- Chen, Z.; Mu, X.; Han, Z.; Yang, S.; Zhang, C.; Guo, Z.; Bai, Y.; He, W. An optical/photoacoustic dual-modality probe: Ratiometric in/ex vivo imaging for stimulated H2S upregulation in mice. J. Am. Chem. Soc. 2019, 141, 17973–17977. [Google Scholar] [CrossRef] [PubMed]
- Nguyen, V.N.; Ha, J.; Cho, M.; Li, H.; Swamy, K.M.K.; Yoon, J. Recent developments of BODIPY-based colorimetric and fluorescent probes for the detection of reactive oxygen/nitrogen species and cancer diagnosis. Coordin. Chem. Rev. 2021, 439, 213936. [Google Scholar] [CrossRef]
- Griendling, K.K.; Touyz, R.M.; Zweier, J.L.; Dikalov, S.; Chilian, W.; Chen, Y.-R.; Harrison, D.G.; Bhatnagar, A. Measurement of reactive oxygen species, reactive nitrogen species, and redox-dependent signaling in the cardiovascular system: A scientific statement from the American Heart Association. Circ. Res. 2016, 119, e39–e75. [Google Scholar] [CrossRef]
- Weber, J.; Bollepalli, L.; Belenguer, A.M.; Di Antonio, M.; De Mitri, N.; Joseph, J.; Balasubramanian, S.; Hunter, C.A.; Bohndiek, S.E. An activatable cancer-targeted hydrogen peroxide probe for photoacoustic and fluorescence imaging. Cancer Res. 2019, 79, 5407–5417. [Google Scholar] [CrossRef]
- Chen, X.; Ren, X.; Zhang, L.; Liu, Z.; Hai, Z. Mitochondria-targeted fluorescent and photoacoustic imaging of hydrogen peroxide in inflammation. Anal. Chem. 2020, 92, 14244–14250. [Google Scholar] [CrossRef]
- Wang, S.; Li, Z.; Liu, Y.; Feng, G.; Zheng, J.; Yuan, Z.; Zhang, X. Activatable photoacoustic and fluorescent probe of nitric oxide for cellular and in vivo imaging. Sens. Actuators B Chem. 2018, 267, 403–411. [Google Scholar] [CrossRef]
- Szabo, C.; Coletta, C.; Chao, C.; Módis, K.; Szczesny, B.; Papapetropoulos, A.; Hellmich, M.R. Tumor-derived hydrogen sulfide, produced by cystathionine-β-synthase, stimulates bioenergetics, cell proliferation, and angiogenesis in colon cancer. Proc. Natl. Acad. Sci. USA 2013, 110, 12474–12479. [Google Scholar] [CrossRef]
- Cai, W.-J.; Wang, M.-J.; Ju, L.-H.; Wang, C.; Zhu, Y.-C. Hydrogen sulfide induces human colon cancer cell proliferation: Role of Akt, ERK and p21. Cell Biol. Int. 2010, 34, 565–572. [Google Scholar] [CrossRef]
- Rose, P.; Moore, P.K.; Ming, S.H.; Nam, O.C.; Armstrong, J.S.; Whiteman, M. Hydrogen sulfide protects colon cancer cells from chemopreventative agent β-phenylethyl isothiocyanate induced apoptosis. World J. Gastroenterol. 2005, 11, 3990–3997. [Google Scholar] [CrossRef]
- Zhang, J.; Wen, G.; Wang, W.; Cheng, K.; Guo, Q.; Tian, S.; Liu, C.; Hu, H.; Zhang, Y.; Zhang, H.; et al. Controllable cleavage of C–N bond-based fluorescent and photoacoustic dual-modal probes for the detection of H2S in living mice. ACS Appl. Bio Mater. 2020, 4, 2020–2025. [Google Scholar] [CrossRef] [PubMed]
- Chen, Q.; Liu, X.; Chen, J.; Zeng, J.; Cheng, Z.; Liu, Z. A self-assembled albumin-based nanoprobe for in vivo ratiometric photoacoustic pH imaging. Adv. Mater. 2015, 27, 6820–6827. [Google Scholar] [CrossRef] [PubMed]
- Meng, X.; Li, W.; Sun, Z.; Zhang, J.; Zhou, L.; Deng, G.; Gong, P.; Cai, L. Tumor-targeted small molecule for dual-modal imaging-guided phototherapy upon near-infrared excitation. J. Mater. Chem. B 2017, 5, 9405–9411. [Google Scholar] [CrossRef] [PubMed]
- Mu, H.; Miki, K.; Harada, H.; Tanaka, K.; Nogita, K.; Ohe, K. pH-activatable cyanine dyes for selective tumor imaging using near-infrared fluorescence and photoacoustic modalities. ACS Sens. 2021, 6, 123–129. [Google Scholar] [CrossRef]
- Liu, X.; Gong, X.; Yuan, J.; Fan, X.; Zhang, X.; Ren, T.; Yang, S.; Yang, R.; Yuan, L.; Zhang, X.-B. Dual-stimulus responsive near-infrared reversible ratiometric fluorescent and photoacoustic probe for in vivo tumor imaging. Anal. Chem. 2021, 93, 5420–5429. [Google Scholar] [CrossRef]
- Basal, L.A.; Yan, Y.; Shen, Y.; Haacke, E.M.; Mehrmohammadi, M.; Allen, M.J. Oxidation-responsive, EuII/III-based, multimodal contrast agent for magnetic resonance and photoacoustic imaging. ACS Omega 2017, 2, 800–805. [Google Scholar] [CrossRef]
- Chen, F.; Teng, L.; Lu, C.; Zhang, C.; Rong, Q.; Zhao, Y.; Yang, Y.; Wang, Y.; Song, G.; Zhang, X. Activatable magnetic/photoacoustic nanoplatform for redox-unlocked deep-tissue molecular imaging in vivo via Prussian blue nanoprobe. Anal. Chem. 2020, 92, 13452–13461. [Google Scholar] [CrossRef]
- Yan, C.; Liu, D.; An, L.; Wang, Y.; Tian, Q.; Lin, J.; Yang, S. Magnetic–photoacoustic dual-mode probe for the visualization of H2S in colorectal cancer. Anal. Chem. 2020, 92, 8254–8261. [Google Scholar] [CrossRef]
- Rich, L.J.; Damasco, J.A.; Bulmahn, J.C.; Kutscher, H.L.; Prasad, P.N.; Seshadri, M. Photoacoustic and magnetic resonance imaging of hybrid manganese dioxide-coated ultra-small NaGdF4 nanoparticles for spatiotemporal modulation of hypoxia in head and neck cancer. Cancers 2020, 12, 3294. [Google Scholar] [CrossRef]
- Hu, X.; Zhan, C.; Tang, Y.; Lu, F.; Li, Y.; Pei, F.; Lu, X.; Ji, Y.; Li, J.; Wang, W.; et al. Intelligent polymer–MnO2 nanoparticles for dual-activatable photoacoustic and magnetic resonance bimodal imaging in living mice. Chem. Commun. 2019, 55, 6006–6009. [Google Scholar] [CrossRef]
- Liang, G.; Han, J.; Xing, D. Precise Tumor Photothermal Therapy Guided and Monitored by Magnetic Resonance/Photoacoustic Imaging using A Safe and pH-Responsive Fe(III) Complex. Adv. Healthc. Mater. 2021, 10, 2001300. [Google Scholar] [CrossRef] [PubMed]
- Sun, X.; Du, R.; Zhang, L.; Zhang, G.; Zheng, X.; Qian, J.; Tian, X.; Zhou, J.; He, J.; Wang, Y.; et al. A pH-responsive yolk-like nanoplatform for tumor targeted dual-mode magnetic resonance imaging and chemotherapy. ACS Nano 2017, 11, 7049–7059. [Google Scholar] [CrossRef] [PubMed]
- Zhu, H.; Zhang, L.; Liu, Y.; Zhou, Y.; Wang, K.; Xie, X.; Song, L.; Wang, D.; Han, C.; Chen, Q. Aptamer-PEG-modified Fe3O4@Mn as a novel T1- and T2-dual-model MRI contrast agent targeting hypoxia-induced cancer stem cells. Sci. Rep. 2016, 6, 39245. [Google Scholar] [CrossRef]
- Zhu, W.; Liu, Y.; Yang, Z.; Zhang, L.; Xiao, L.; Liu, P.; Wang, J.; Yi, C.; Xu, Z.; Ren, J. Albumin/sulfonamide stabilized iron porphyrin metal organic framework nanocomposites: Targeting tumor hypoxia by carbonic anhydrase IX inhibition and T1–T2 dual mode MRI guided photodynamic/photothermal therapy. J. Mater. Chem. B 2018, 6, 265–276. [Google Scholar] [CrossRef] [PubMed]
- Kim, M.-H.; Son, H.-Y.; Kim, G.-Y.; Park, K.; Huh, Y.-M.; Haam, S. Redoxable heteronanocrystals functioning magnetic relaxation switch for activatable T1 and T2 dual-mode magnetic resonance imaging. Biomaterials 2016, 101, 121–130. [Google Scholar] [CrossRef]
- Sun, X.; Zhang, G.; Du, R.; Xu, R.; Zhu, D.; Qian, J.; Bai, G.; Yang, C.; Zhang, Z.; Zhang, X.; et al. A biodegradable MnSiO3@ Fe3O4 nanoplatform for dual-mode magnetic resonance imaging guided combinatorial cancer therapy. Biomaterials 2019, 194, 151–160. [Google Scholar] [CrossRef] [PubMed]
- Jin, L.; Liu, J.; Tang, Y.; Cao, L.; Zhang, T.; Yuan, Q.; Wang, Y.; Zhang, H. MnO2-Functionalized Co–P nanocomposite: A new theranostic agent for pH-triggered T1/T2 dual-modality magnetic resonance imaging-guided chemo-photothermal synergistic therapy. ACS Appl. Mater. Interfaces 2017, 9, 41648–41658. [Google Scholar] [CrossRef]
- Ekanger, L.A.; Polin, L.A.; Shen, Y.; Haacke, E.M.; Allen, M.J. Evaluation of EuII-based positive contrast enhancement after intravenous, intraperitoneal, and subcutaneous injections. Contrast Media Mol. Imaging 2016, 11, 299–303. [Google Scholar] [CrossRef]
- Corbin, B.A.; Basal, L.A.; White, S.A.; Shen, Y.; Haacke, E.M.; Fishbein, K.W.; Allen, M.J. Screening of ligands for redox-active europium using magnetic resonance imaging. Bioorg. Med. Chem. 2018, 26, 5274–5279. [Google Scholar] [CrossRef]
- Prosser, K.E.; Xie, D.; Chu, A.; MacNeil, G.A.; Varju, B.R.; Kadakia, R.T.; Que, E.L.; Walsby, C.J. Copper(II) Pyridyl Aminophenolates: Hypoxia-Selective, Nucleus-Targeting Cytotoxins, and Magnetic Resonance Probes. Chem. Eur. J. 2021, 27, 9839–9849. [Google Scholar] [CrossRef]
- Shearer, J.; Soh, P. The copper(II) adduct of the unstructured region of the amyloidogenic fragment derived from the human prion protein is redox-active at physiological pH. Inorg. Chem. 2007, 46, 710–719. [Google Scholar] [CrossRef] [PubMed]
- Wang, H.; Jordan, V.C.; Ramsay, I.A.; Sojoodi, M.; Fuchs, B.C.; Tanabe, K.K.; Caravan, P.; Gale, E.M. Molecular magnetic resonance imaging using a redox-active iron complex. J. Am. Chem. Soc. 2019, 141, 5916–5925. [Google Scholar] [CrossRef] [PubMed]
- O’Neill, H.A.; Gakh, O.; Park, S.; Cui, J.; Mooney, S.M.; Sampson, M.; Ferreira, G.C.; Isaya, G. Assembly of human frataxin is a mechanism for detoxifying redox-active iron. Biochemistry 2005, 44, 537–545. [Google Scholar] [CrossRef] [PubMed]
- Tsitovich, P.B.; Spernyak, J.A.; Morrow, J.R. A redox-activated MRI contrast agent that switches between paramagnetic and diamagnetic states. Angew. Chem. Int. Ed. 2013, 52, 13997–14000. [Google Scholar] [CrossRef]
- Bernhardt, P.V.; Chen, K.I.; Sharpe, P.C. Transition metal complexes as mediator-titrants in protein redox potentiometry. J. Biol. Inorg. Chem. 2006, 11, 930–936. [Google Scholar] [CrossRef]
- Loving, G.S.; Mukherjee, S.; Caravan, P. Redox-activated manganese-based MR contrast agent. J. Am. Chem. Soc. 2013, 135, 4620–4623. [Google Scholar] [CrossRef]
- Batinic-Haberle, I.; Tovmasyan, A.; Spasojevic, I. Mn porphyrin-based redox-active drugs: Differential effects as cancer therapeutics and protectors of normal tissue against oxidative injury. Antioxid. Redox Signal. 2018, 29, 1691–1724. [Google Scholar] [CrossRef]
- Tsitovich, P.B.; Burns, P.J.; McKay, A.M.; Morrow, J.R. Redox-activated MRI contrast agents based on lanthanide and transition metal ions. J. Inorg. Biochem. 2014, 133, 143–154. [Google Scholar] [CrossRef]
- Basal, L.A.; Bailey, M.D.; Romero, J.; Ali, M.M.; Kurenbekova, L.; Yustein, J.T.; Pautler, R.G.; Allen, M.J. Fluorinated EuII-based multimodal contrast agent for temperature- and redox-responsive magnetic resonance imaging. Chem. Sci. 2017, 8, 8345–8350. [Google Scholar] [CrossRef]
- Gianolio, E.; Napolitano, R.; Fedeli, F.; Arena, F.; Aime, S. Poly-β-cyclodextrin based platform for pH mapping via a ratiometric 19F/1H MRI method. Chem. Commun. 2009, 40, 6044–6046. [Google Scholar] [CrossRef]
- Tang, X.; Gong, X.; Ming, J.; Chen, D.; Lin, H.; Gao, J. Fluorinated Gadolinium Chelate-Grafted Nanoconjugates for Contrast-Enhanced T1-Weighted 1H and pH-Activatable 19F Dual-Modal MRI. Anal. Chem. 2020, 92, 16293–16300. [Google Scholar] [CrossRef] [PubMed]
- Ekanger, L.A.; Ali, M.M.; Allen, M.J. Oxidation-responsive Eu2+/3+-liposomal contrast agent for dual-mode magnetic resonance imaging. Chem. Commun. 2014, 50, 14835–14838. [Google Scholar] [CrossRef] [PubMed]
- Funk, A.M.; Jordan, V.C.; Sherry, A.D.; Ratnakar, S.J.; Kovacs, Z. Oxidative conversion of a europium(II)-based T1 agent into a europium(III)-based paraCEST agent that can be detected in vivo by magnetic resonance imaging. Angew. Chem. 2016, 128, 5108–5111. [Google Scholar] [CrossRef]
- Ekanger, L.A.; Mills, D.R.; Ali, M.M.; Polin, L.A.; Shen, Y.; Haacke, E.M.; Allen, M.J. Spectroscopic characterization of the 3+ and 2+ oxidation states of europium in a macrocyclic tetraglycinate complex. Inorg. Chem. 2016, 55, 9981–9988. [Google Scholar] [CrossRef]
- Sun, W.; Li, M.; Fan, J.; Peng, X. Activity-based sensing and theranostic probes based on photoinduced electron transfer. Acc. Chem. Res. 2019, 52, 2818–2831. [Google Scholar] [CrossRef]
- Wanderi, K.; Cui, Z. Organic fluorescent nanoprobes with NIR-IIb characteristics for deep learning. Exploration 2022, 2, 20210097. [Google Scholar] [CrossRef]


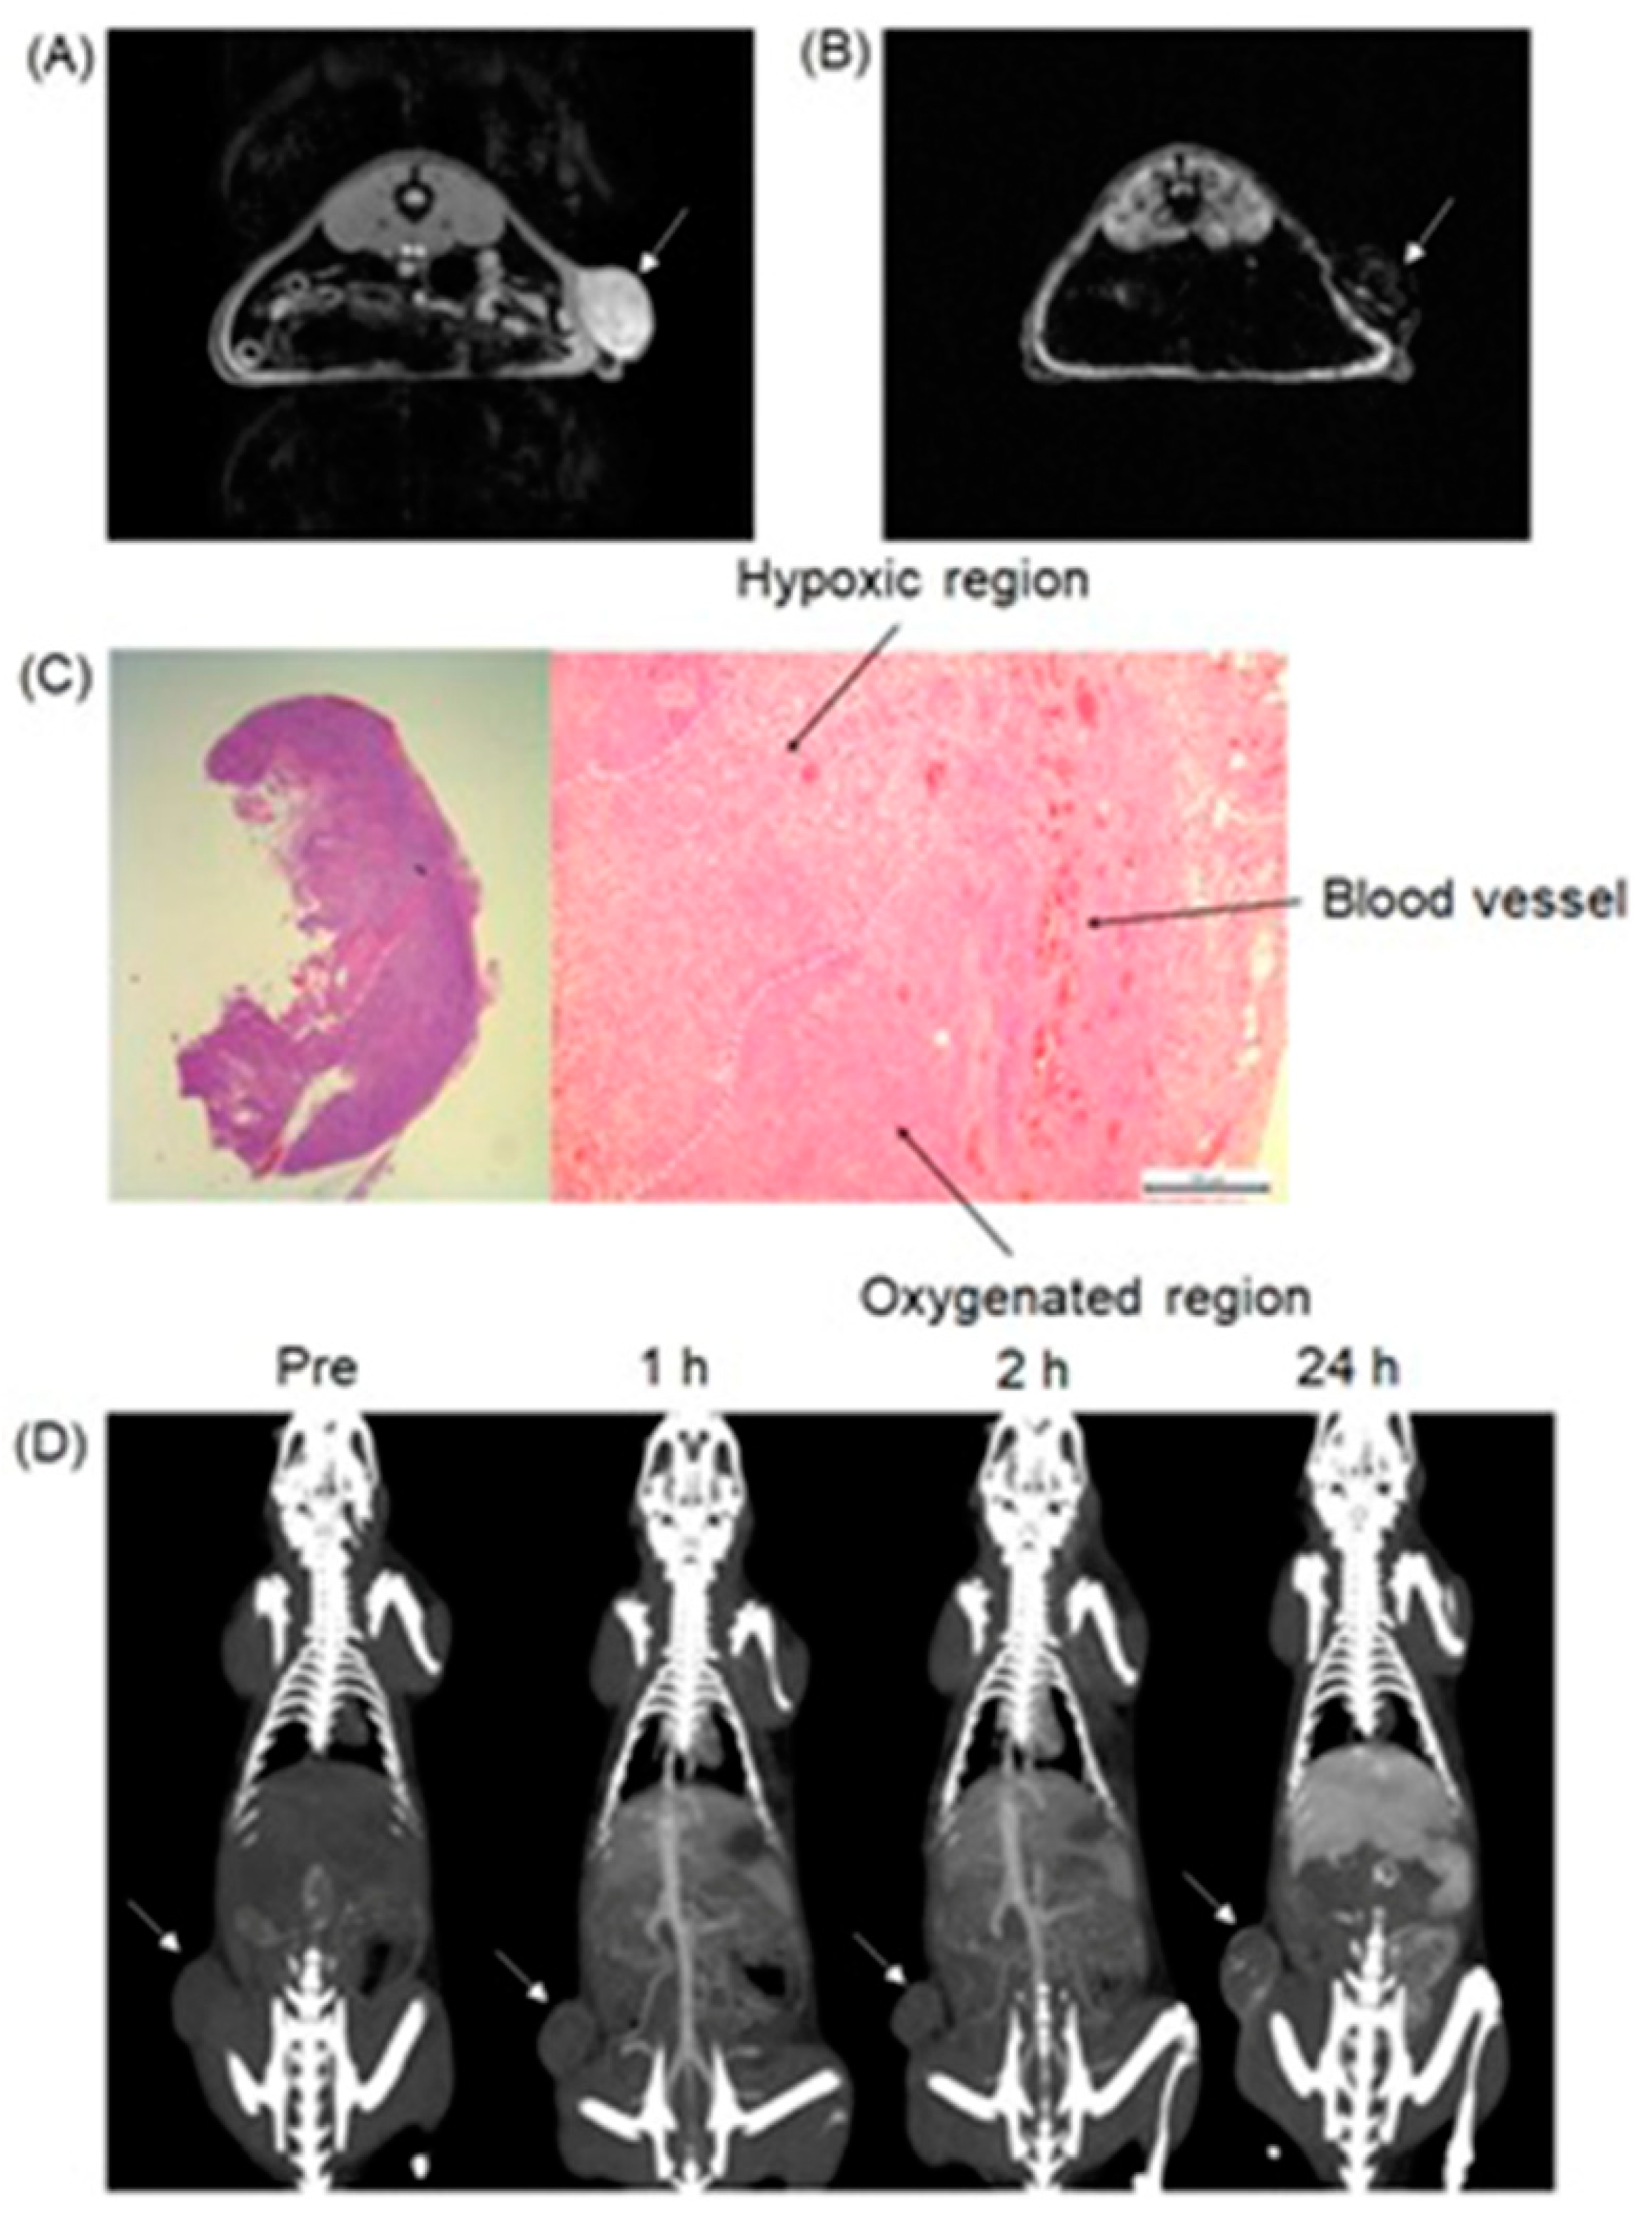
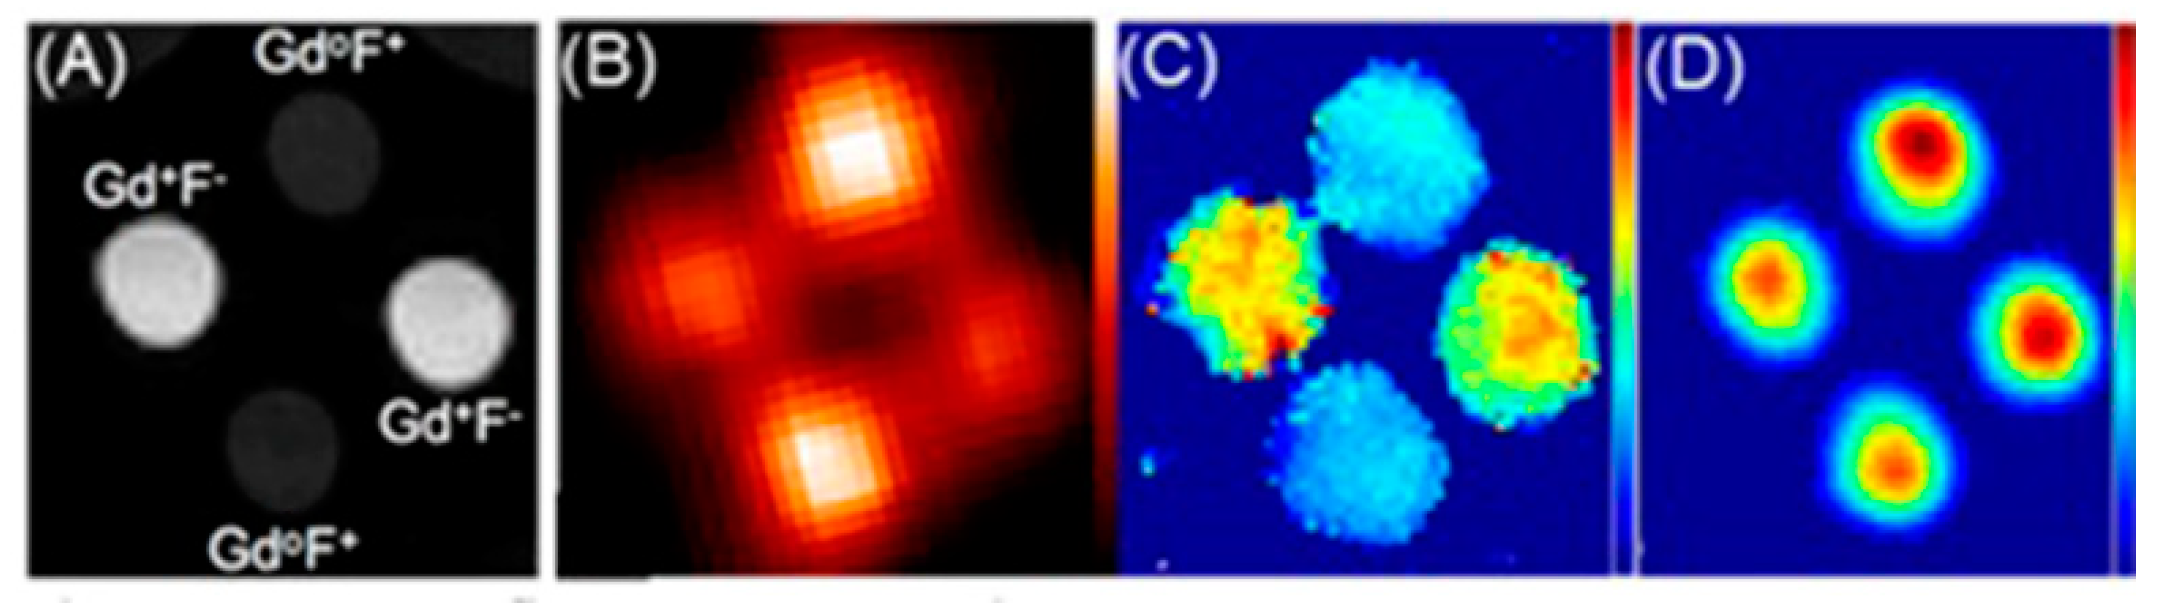
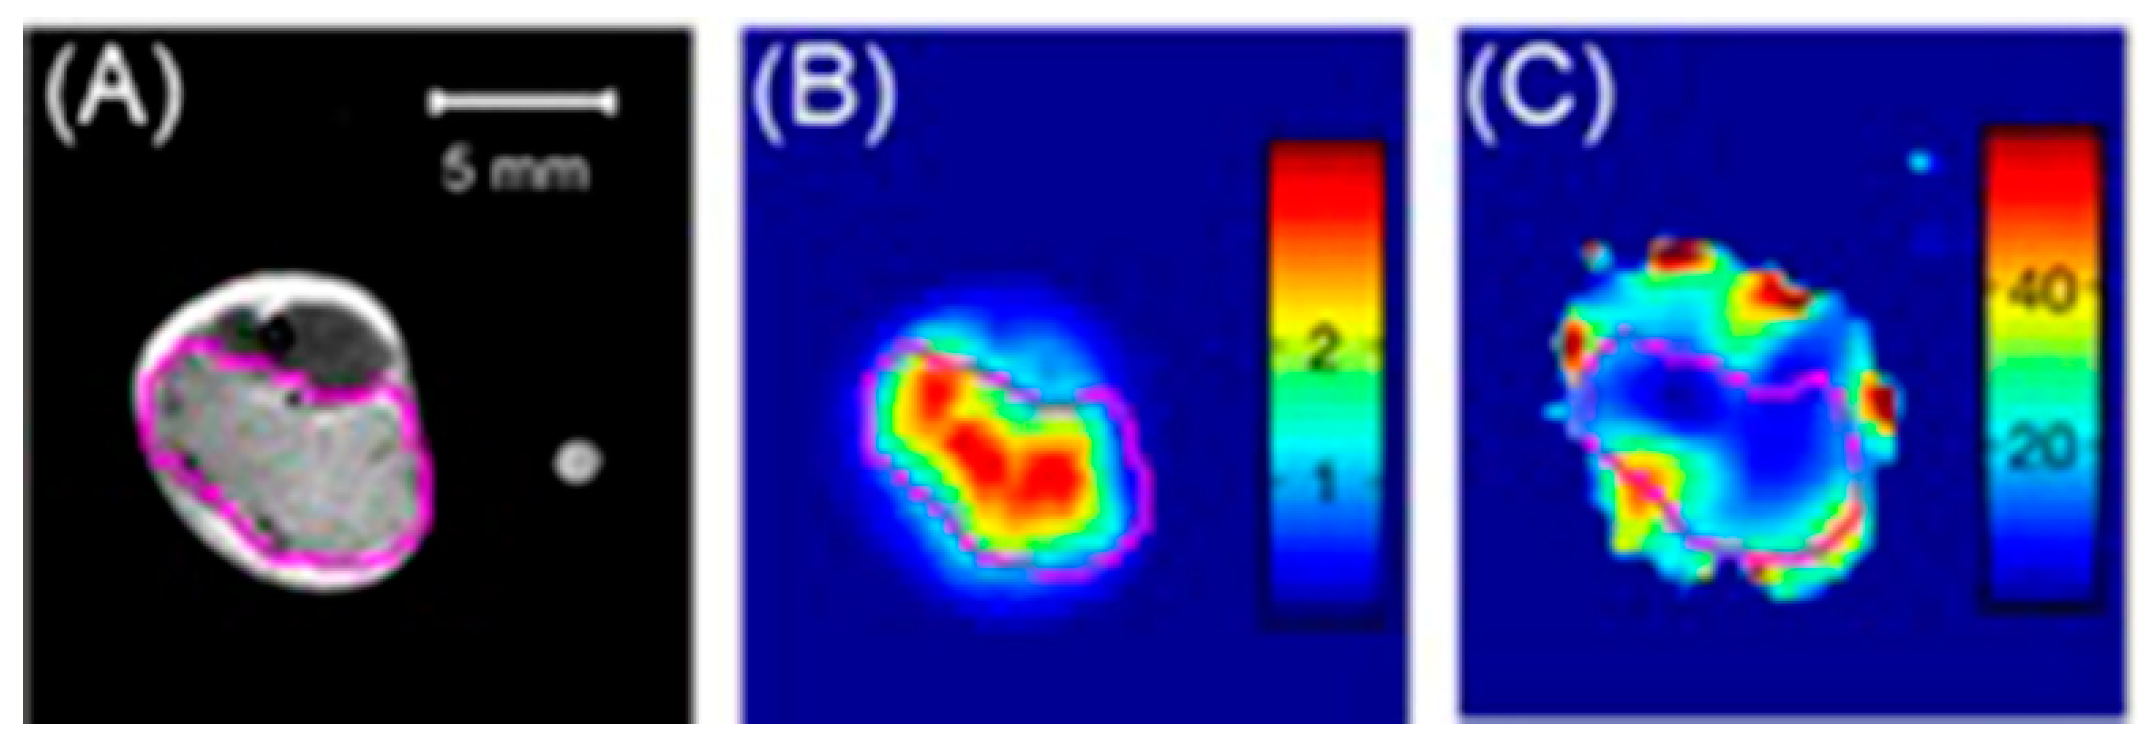
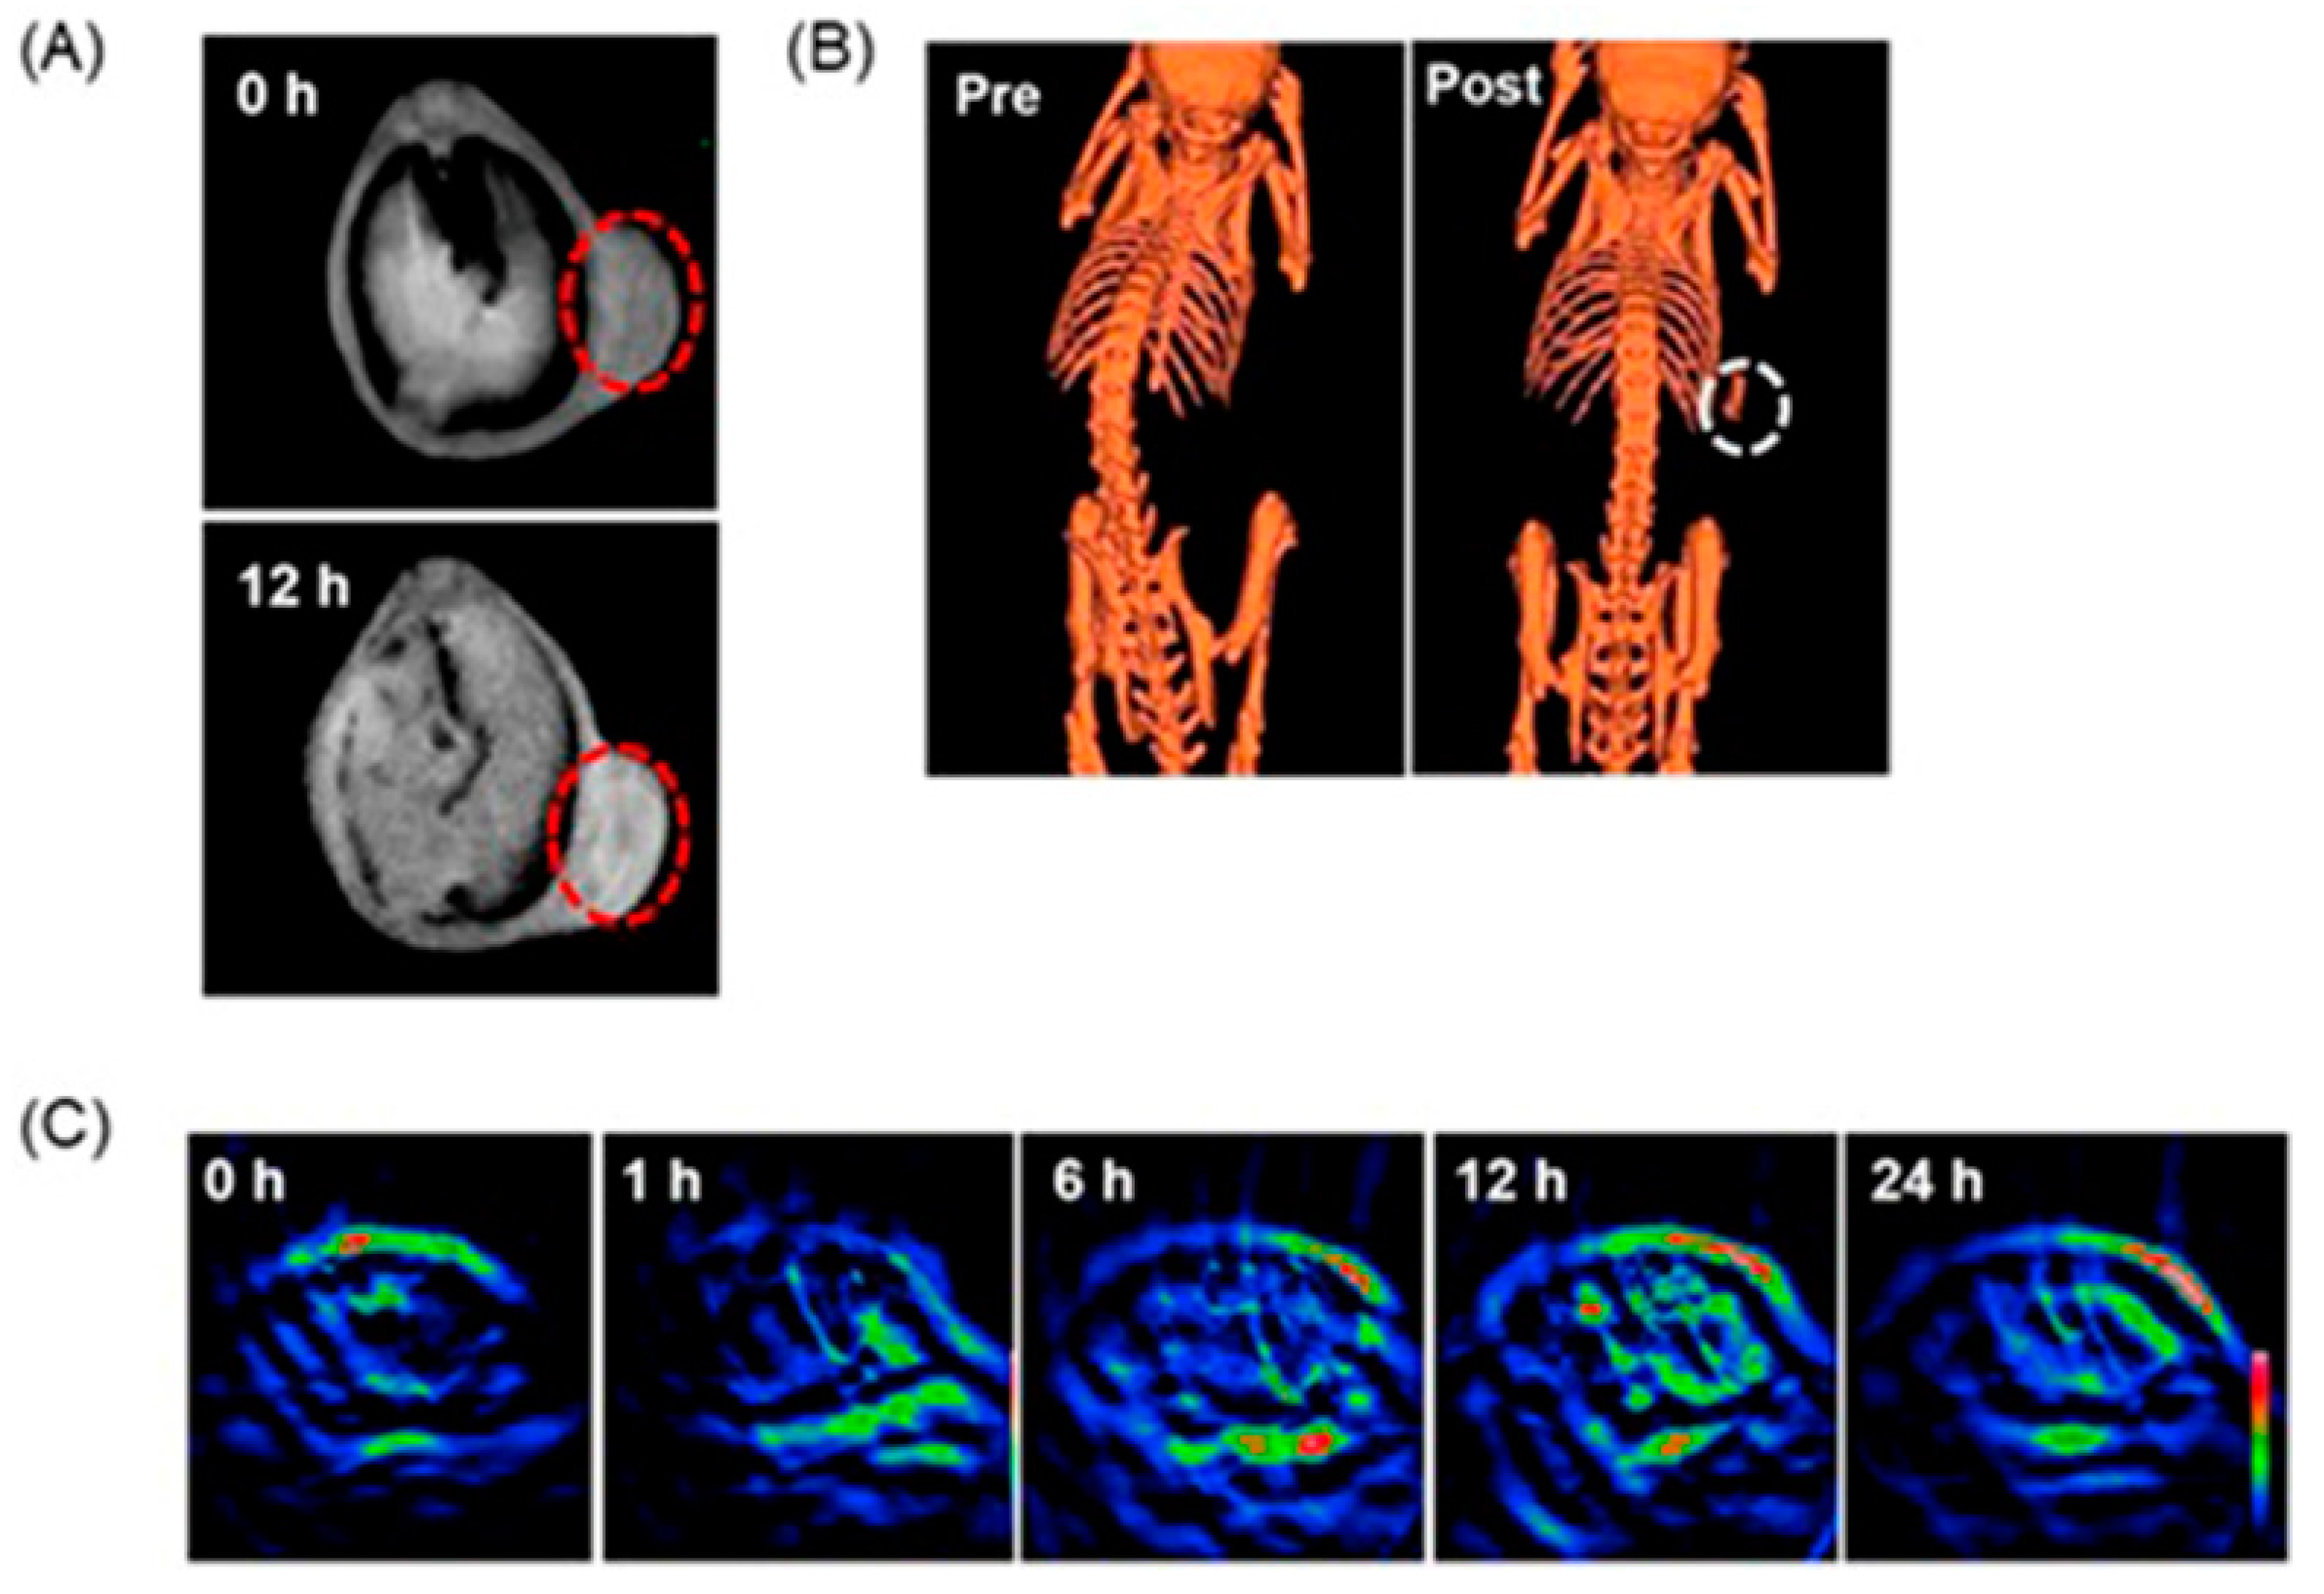
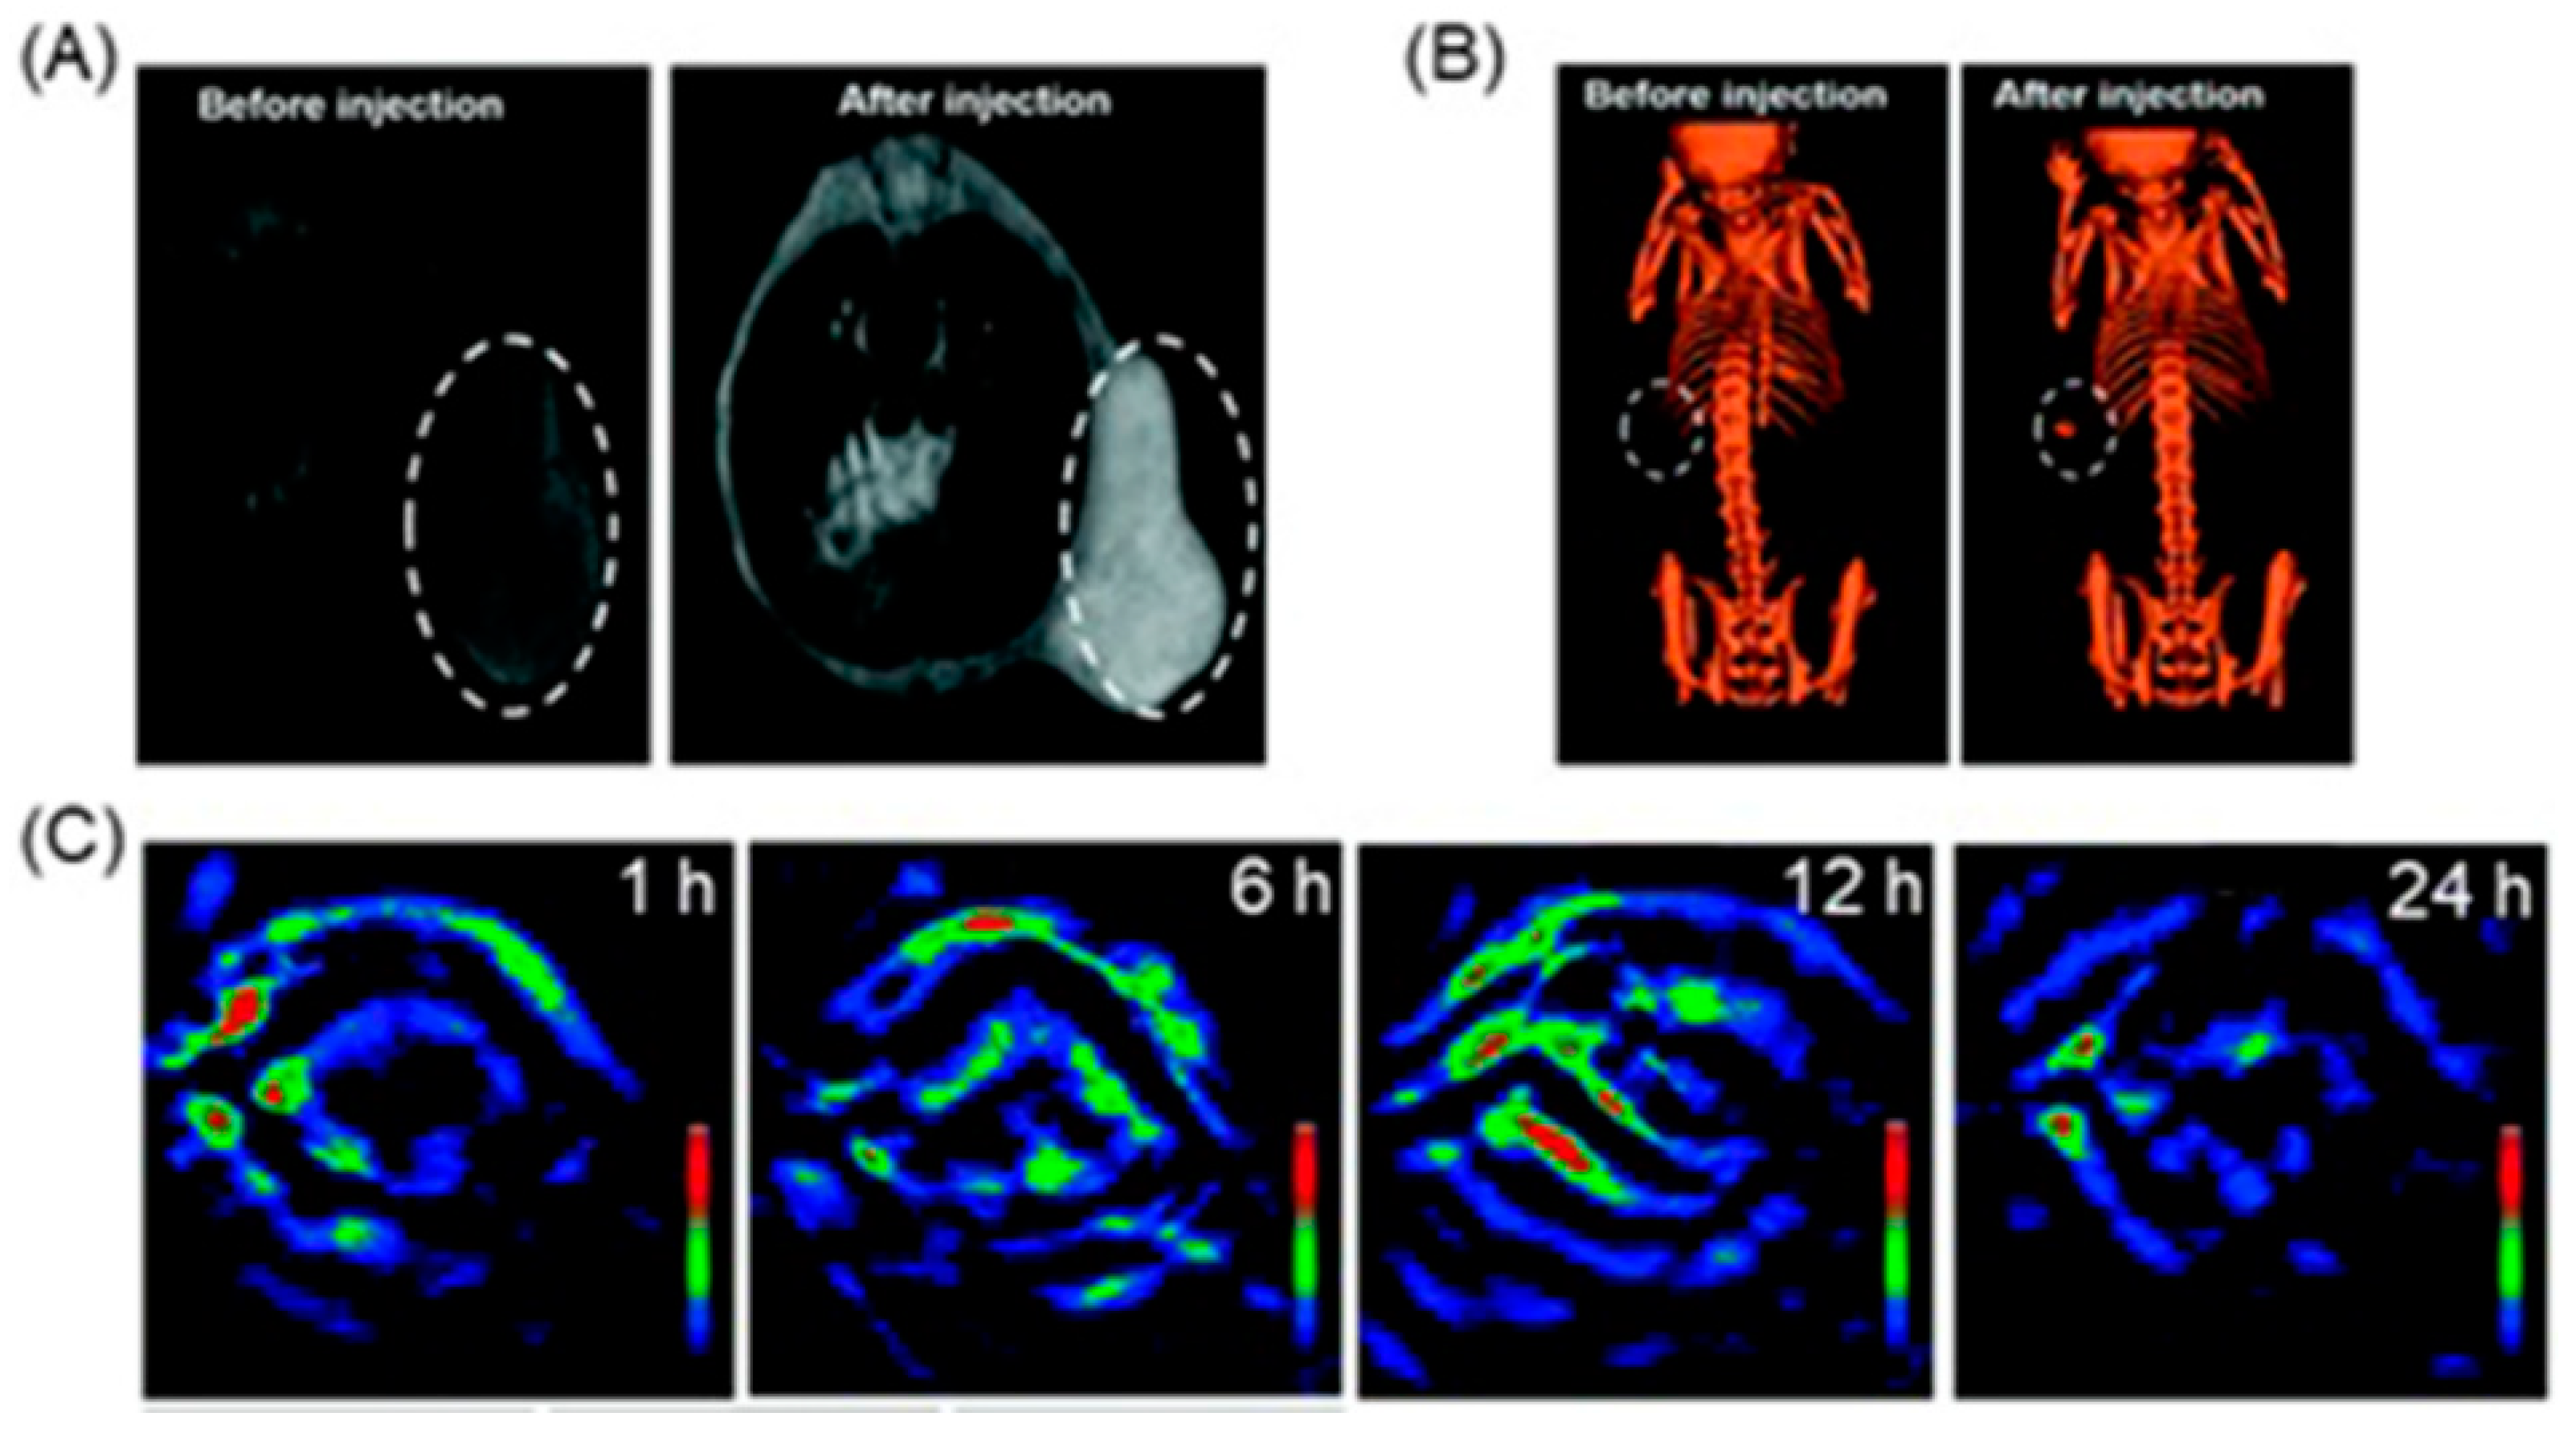
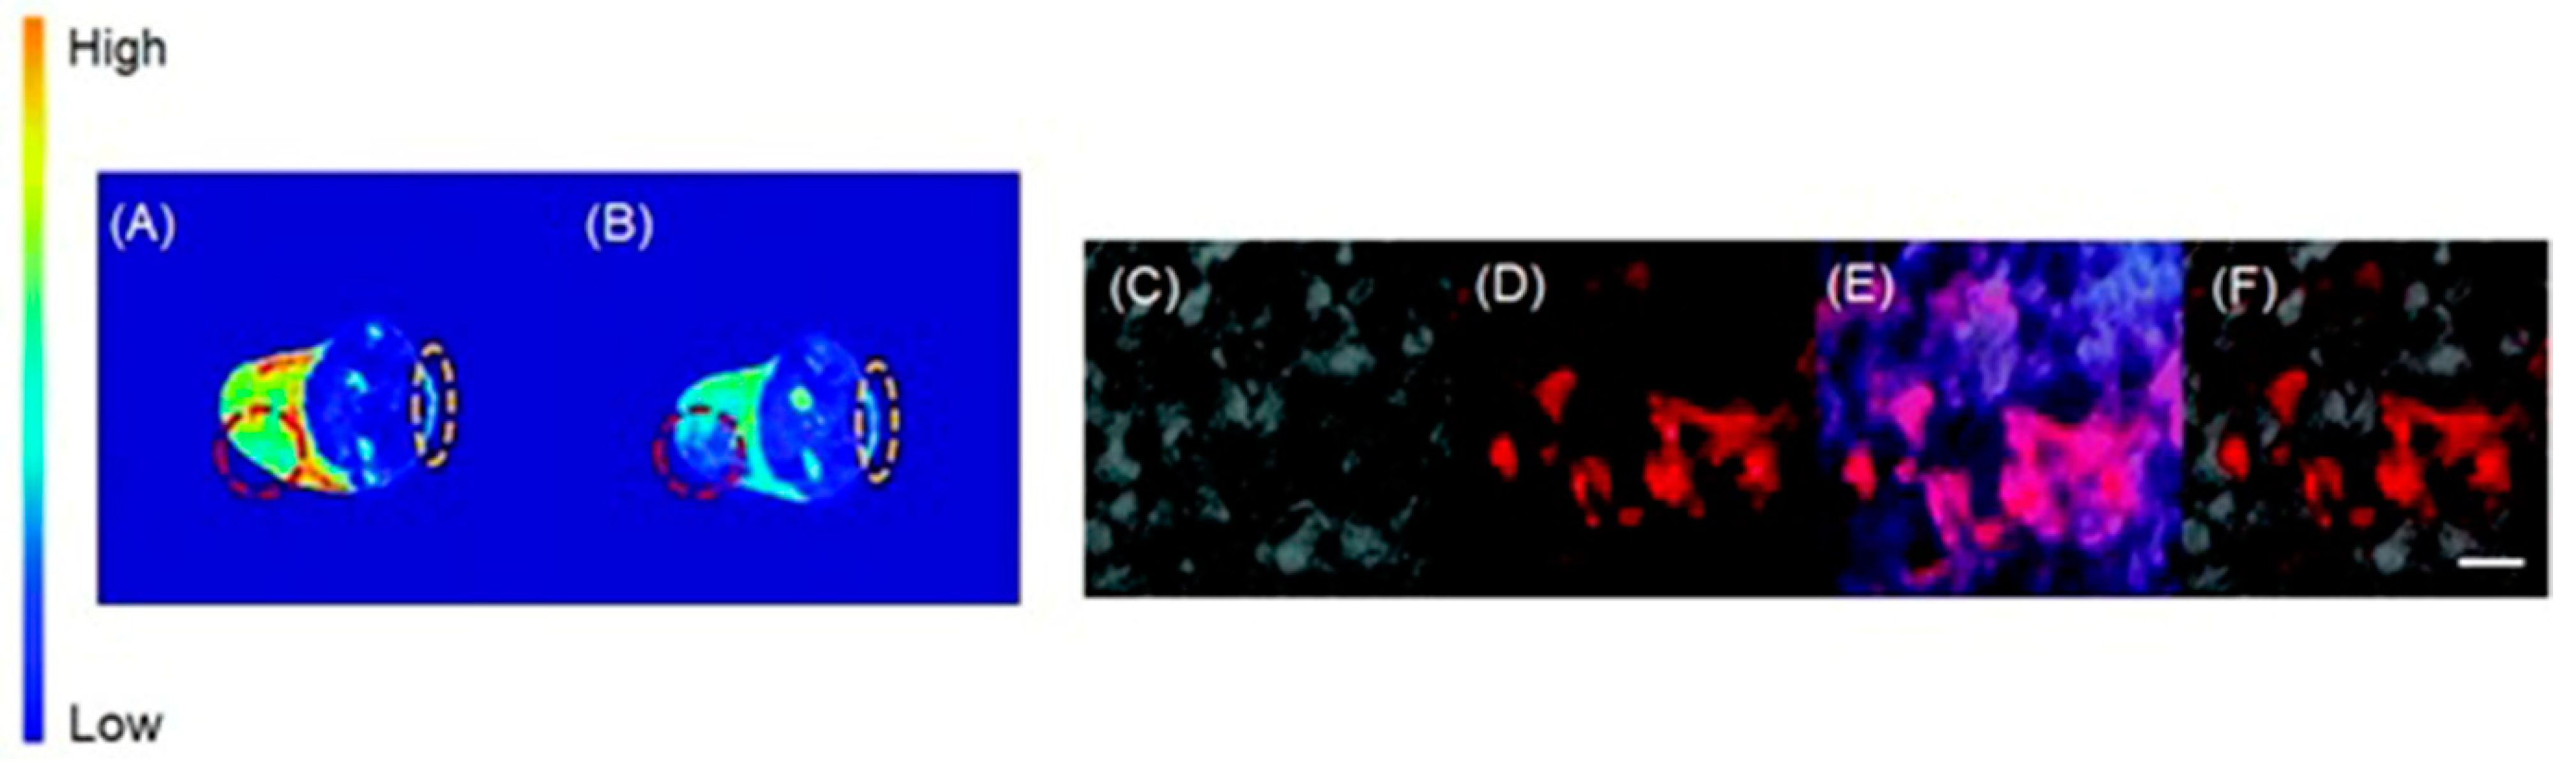
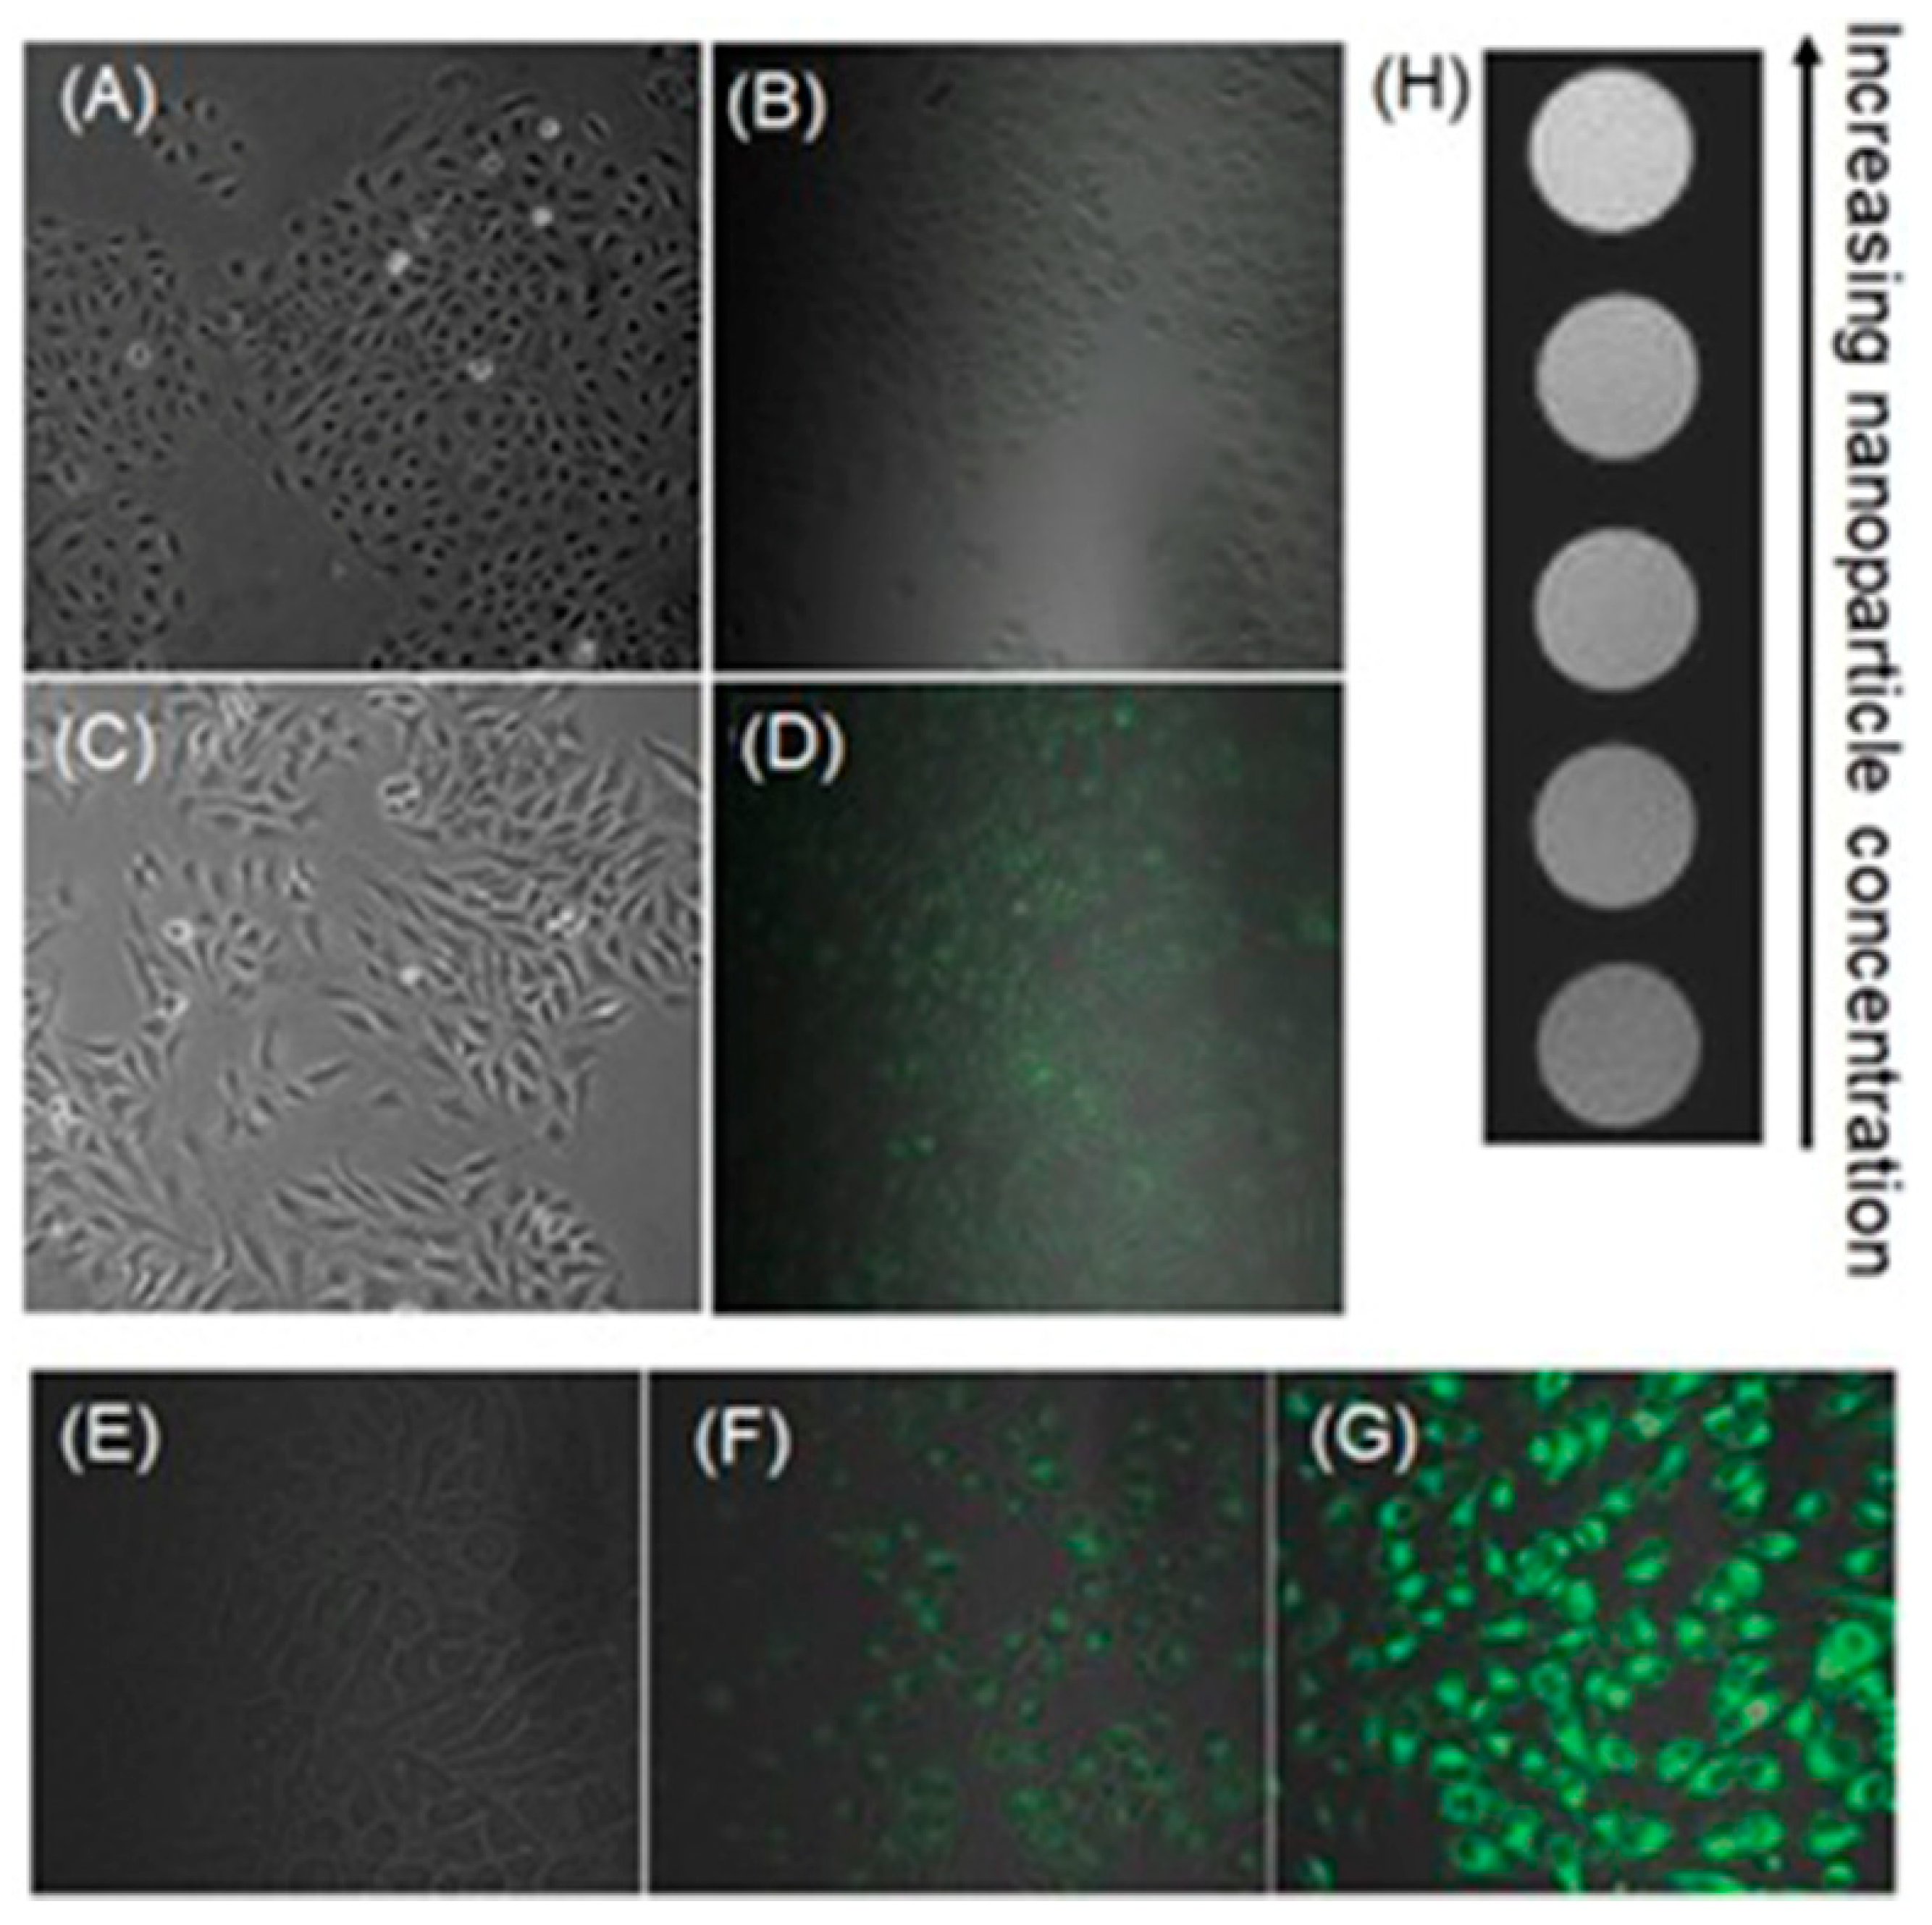
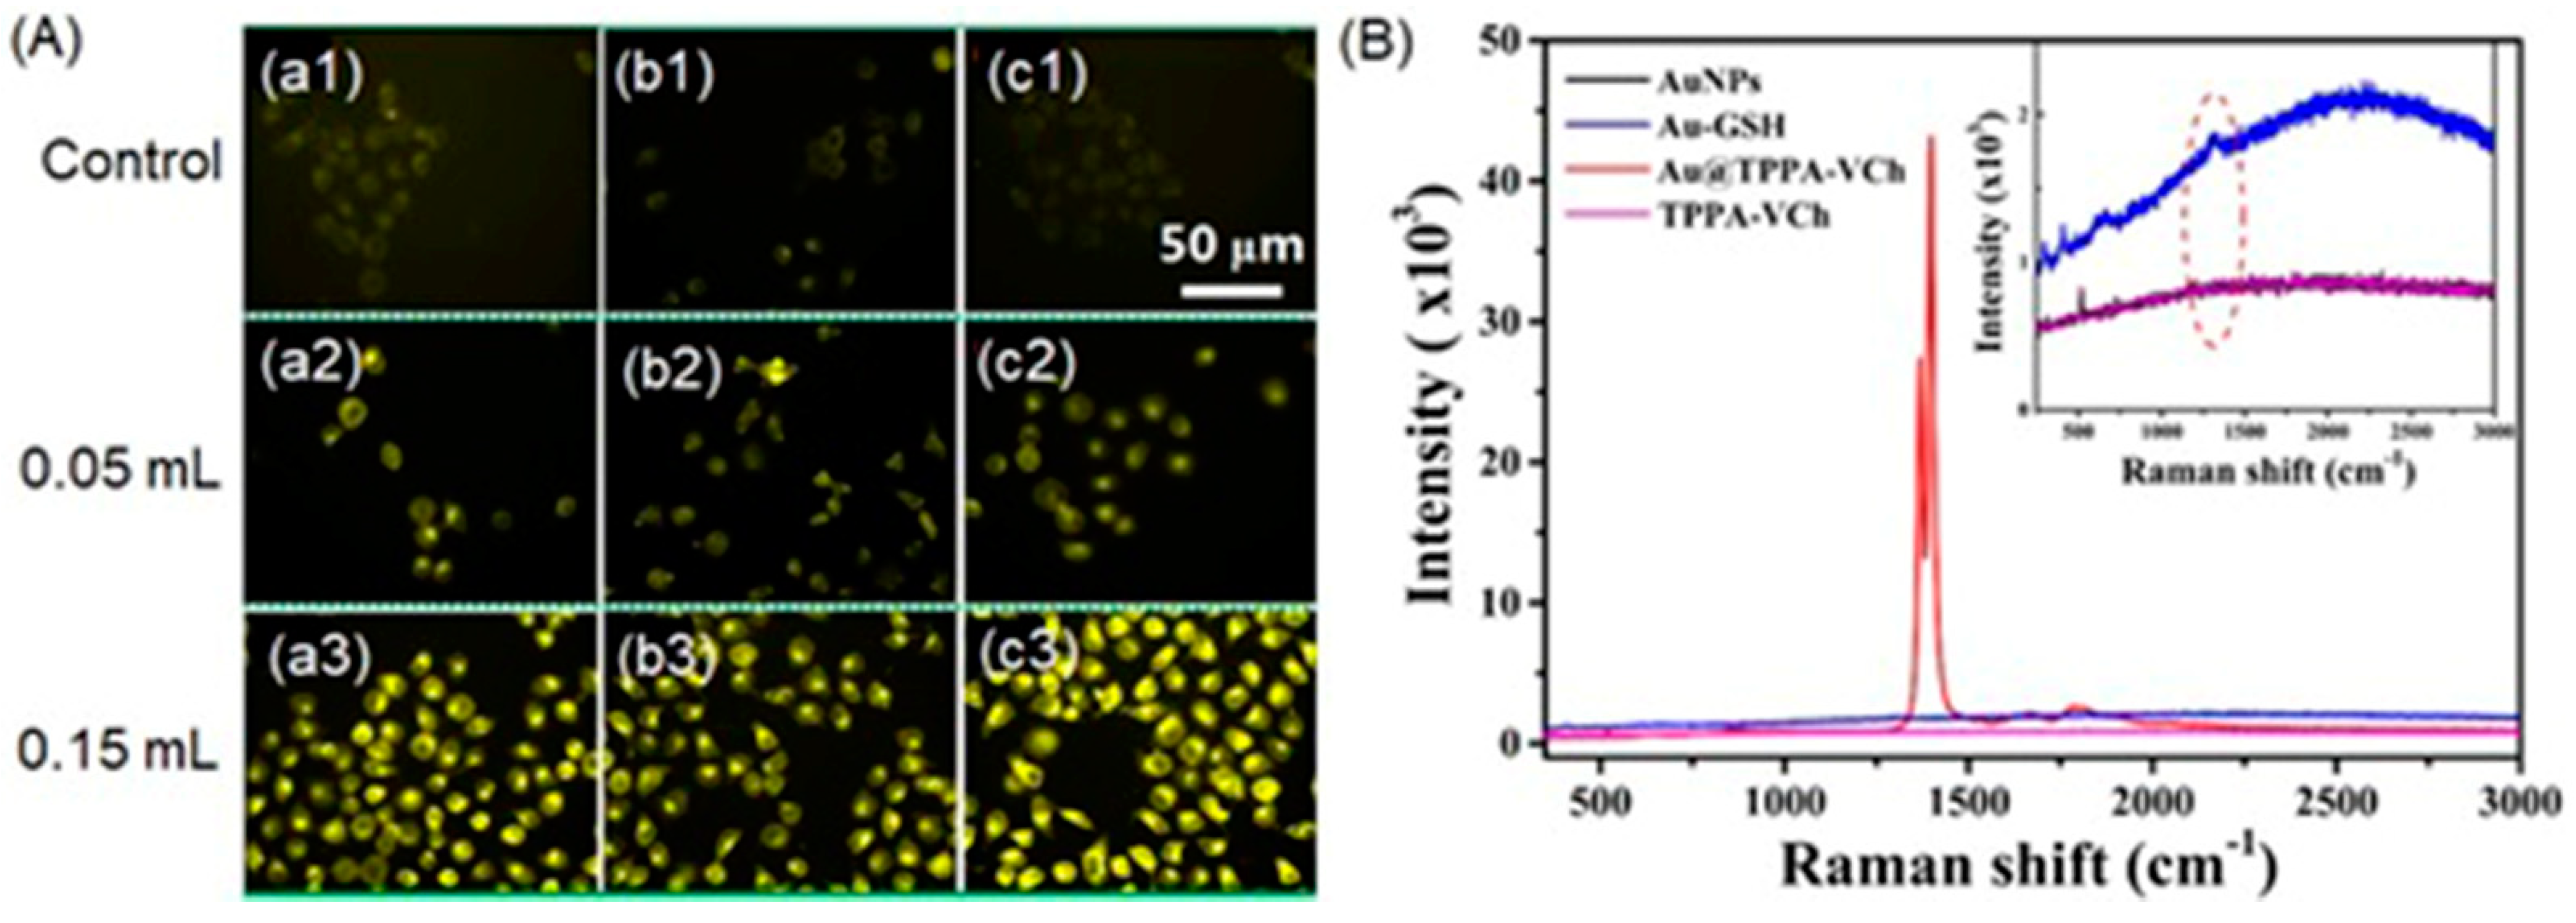
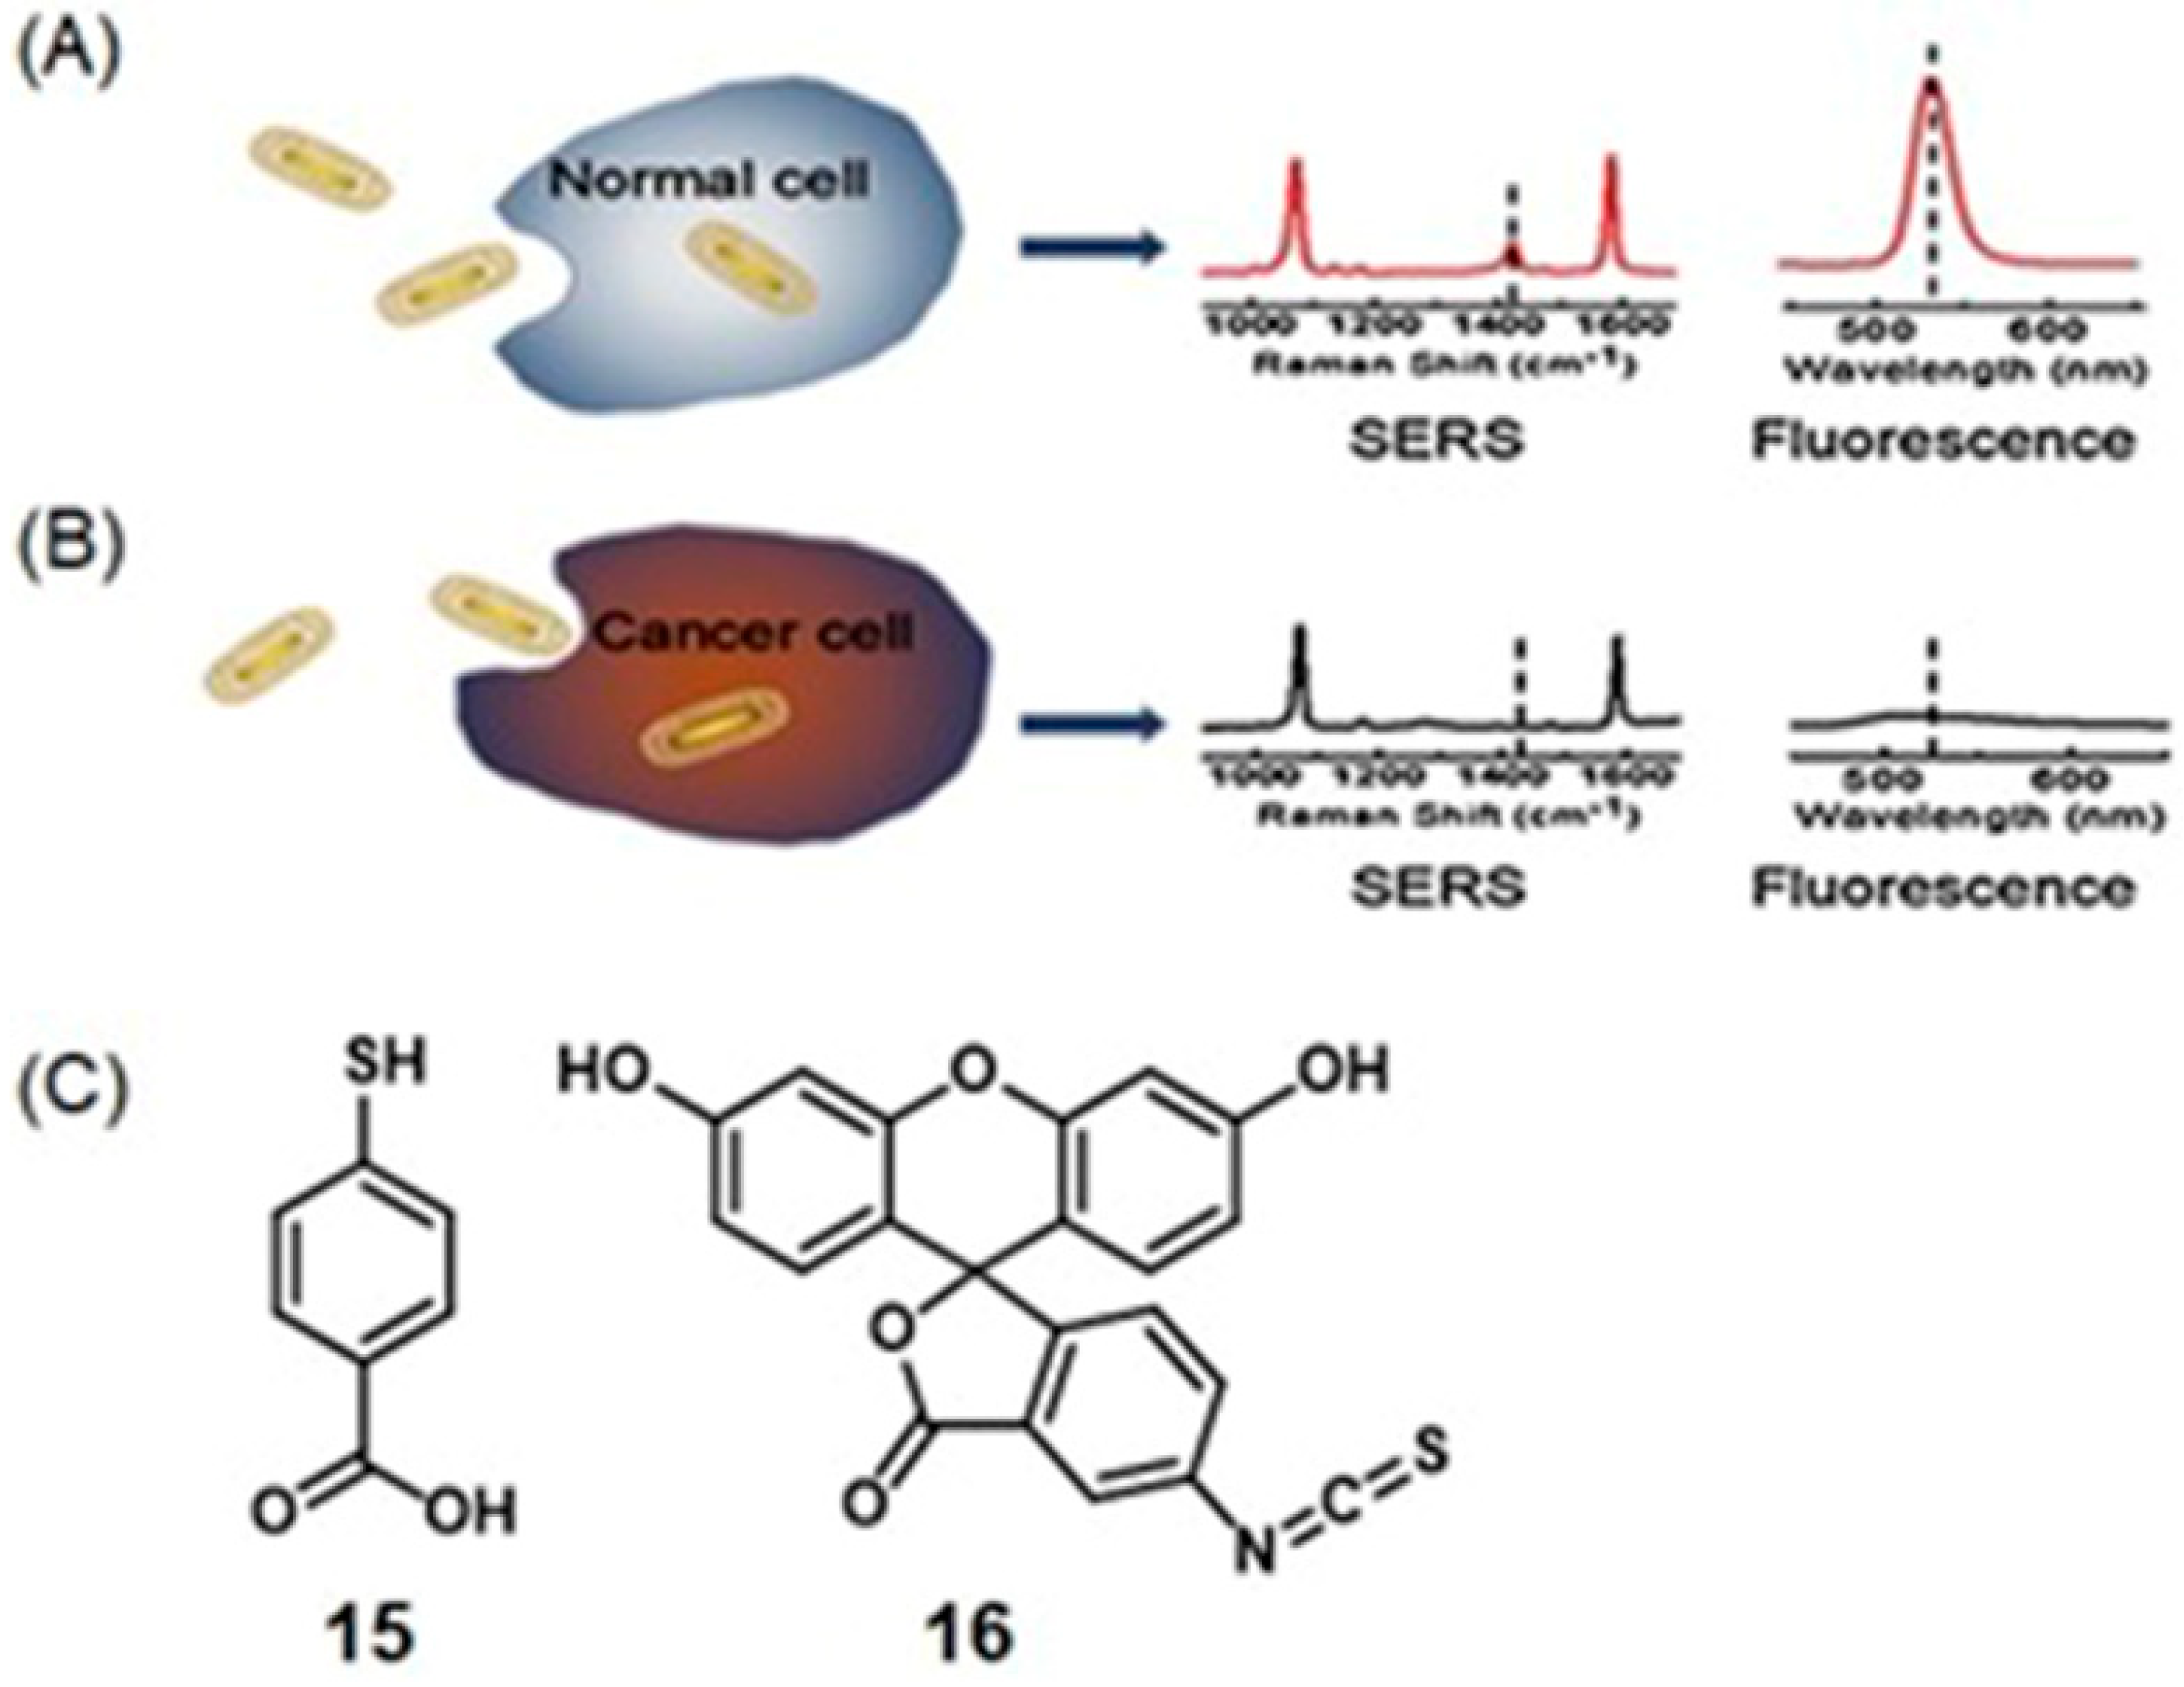
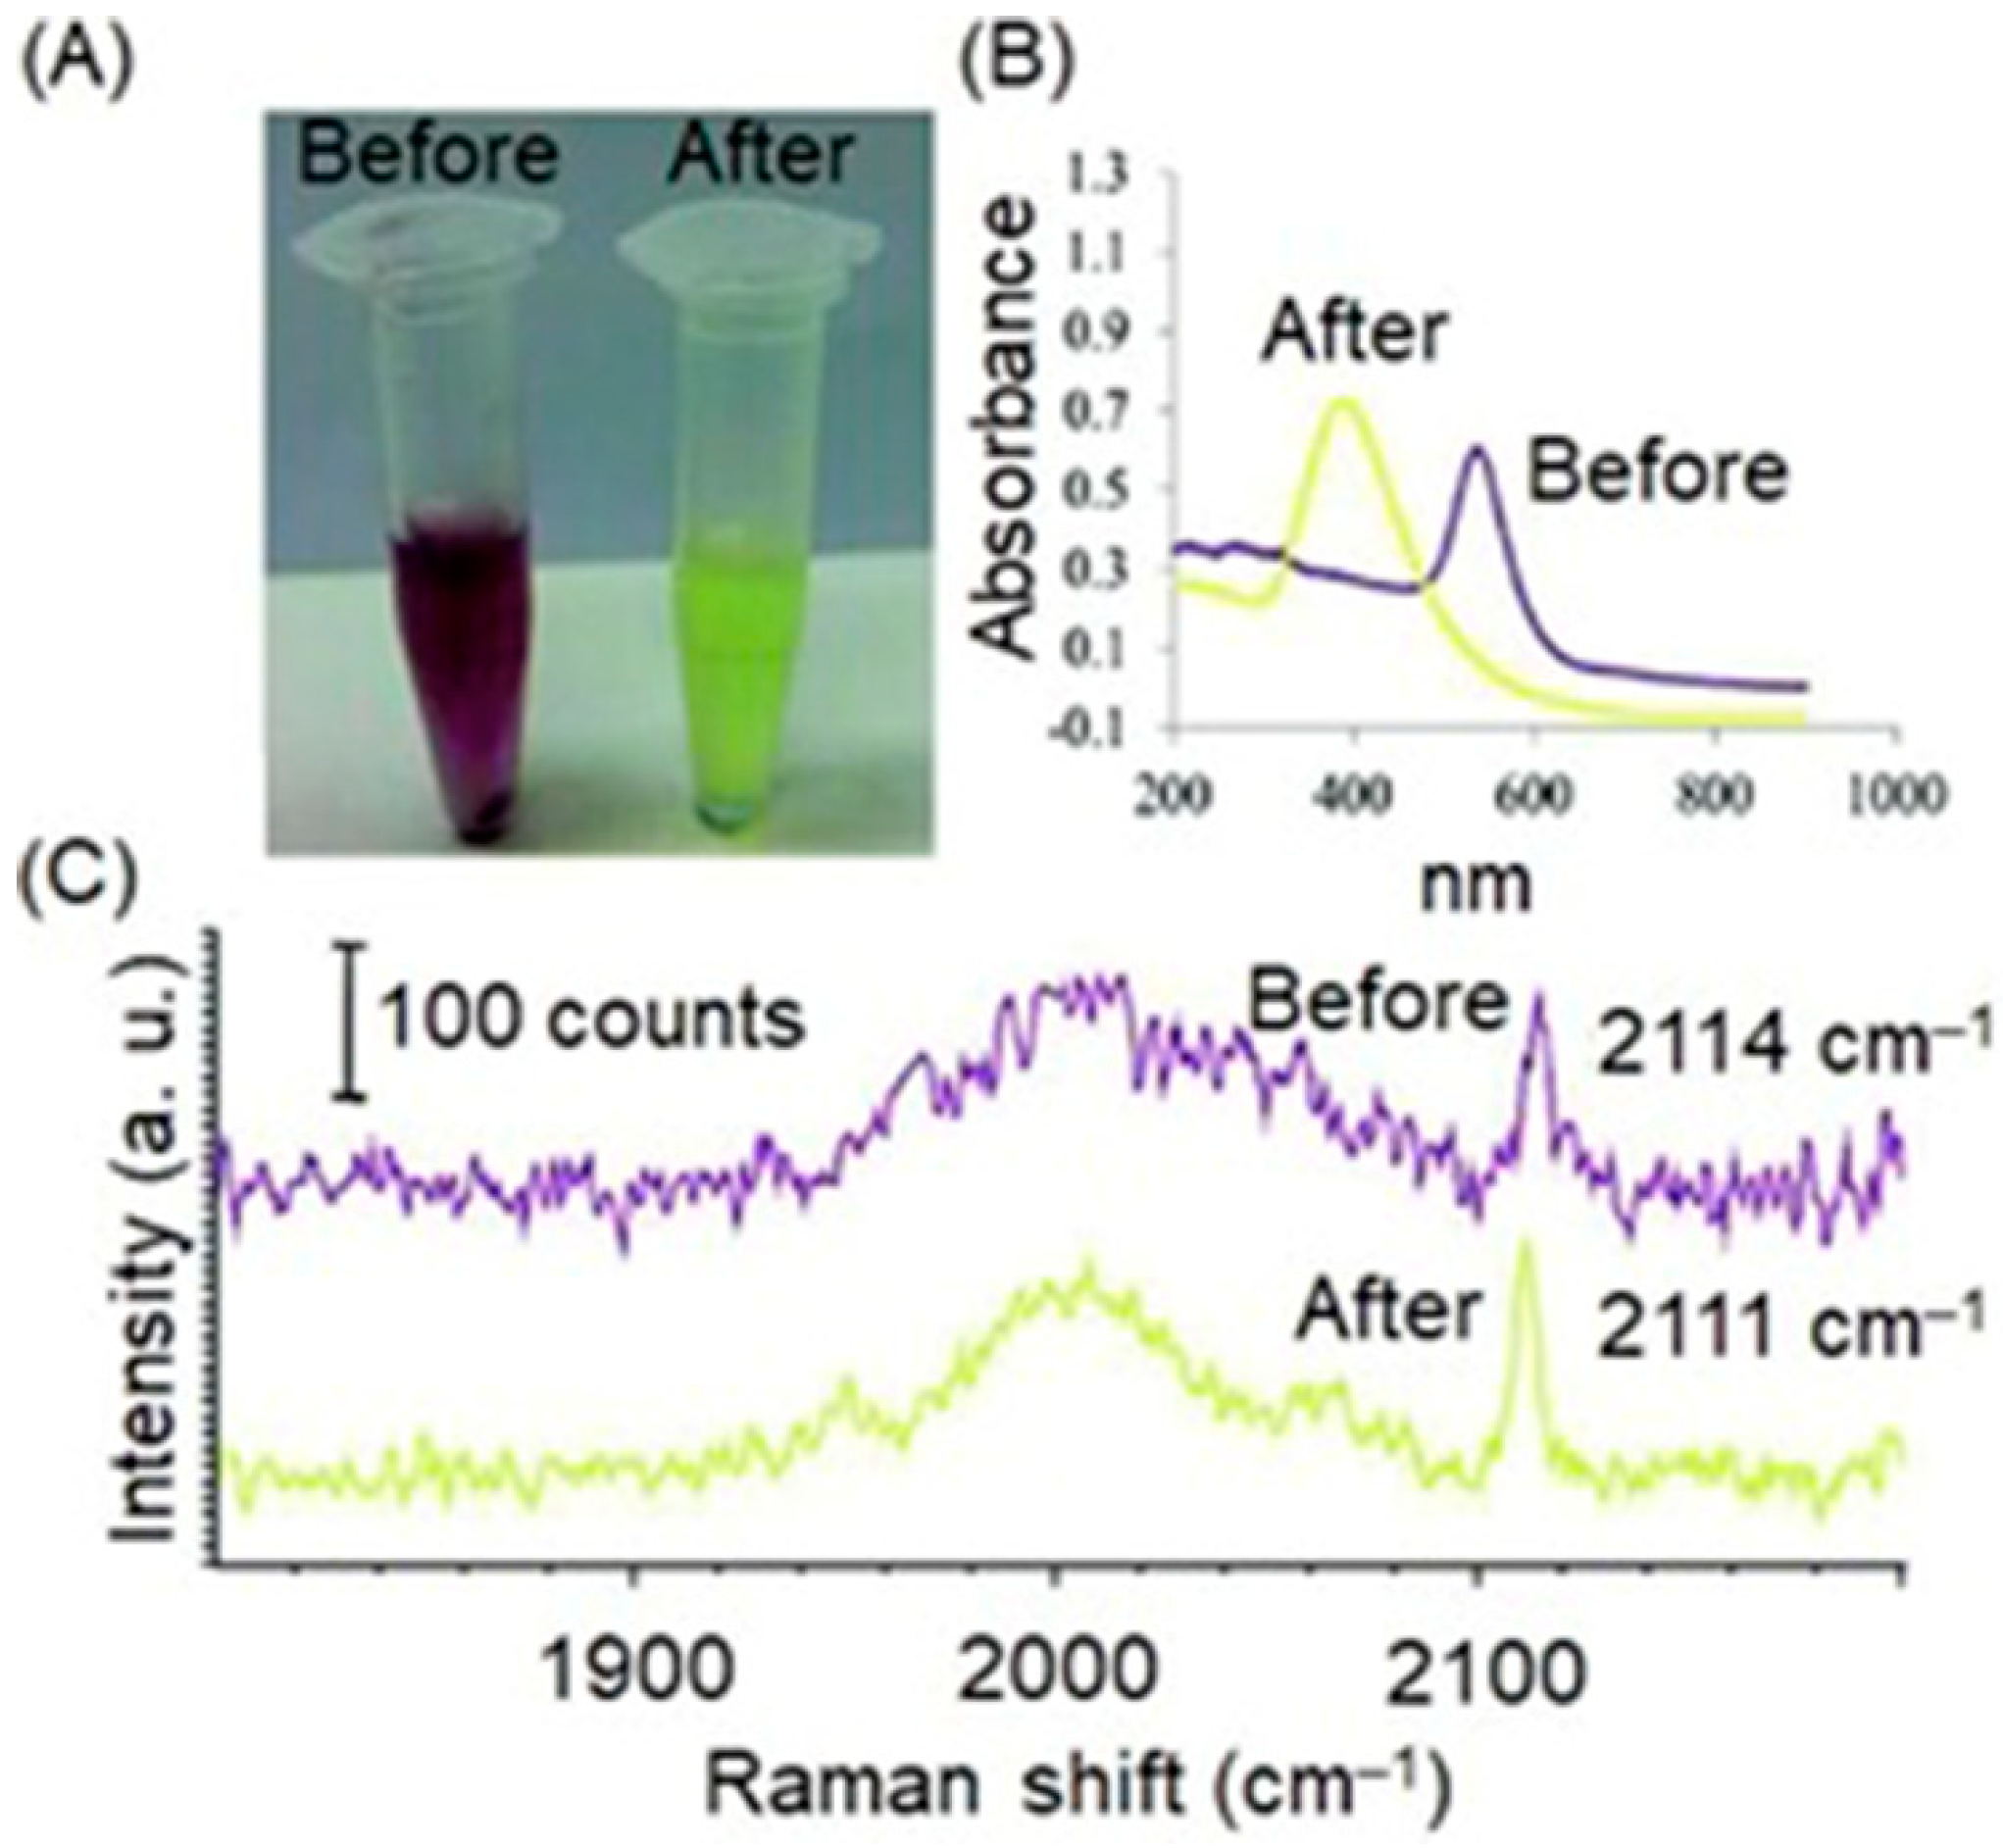
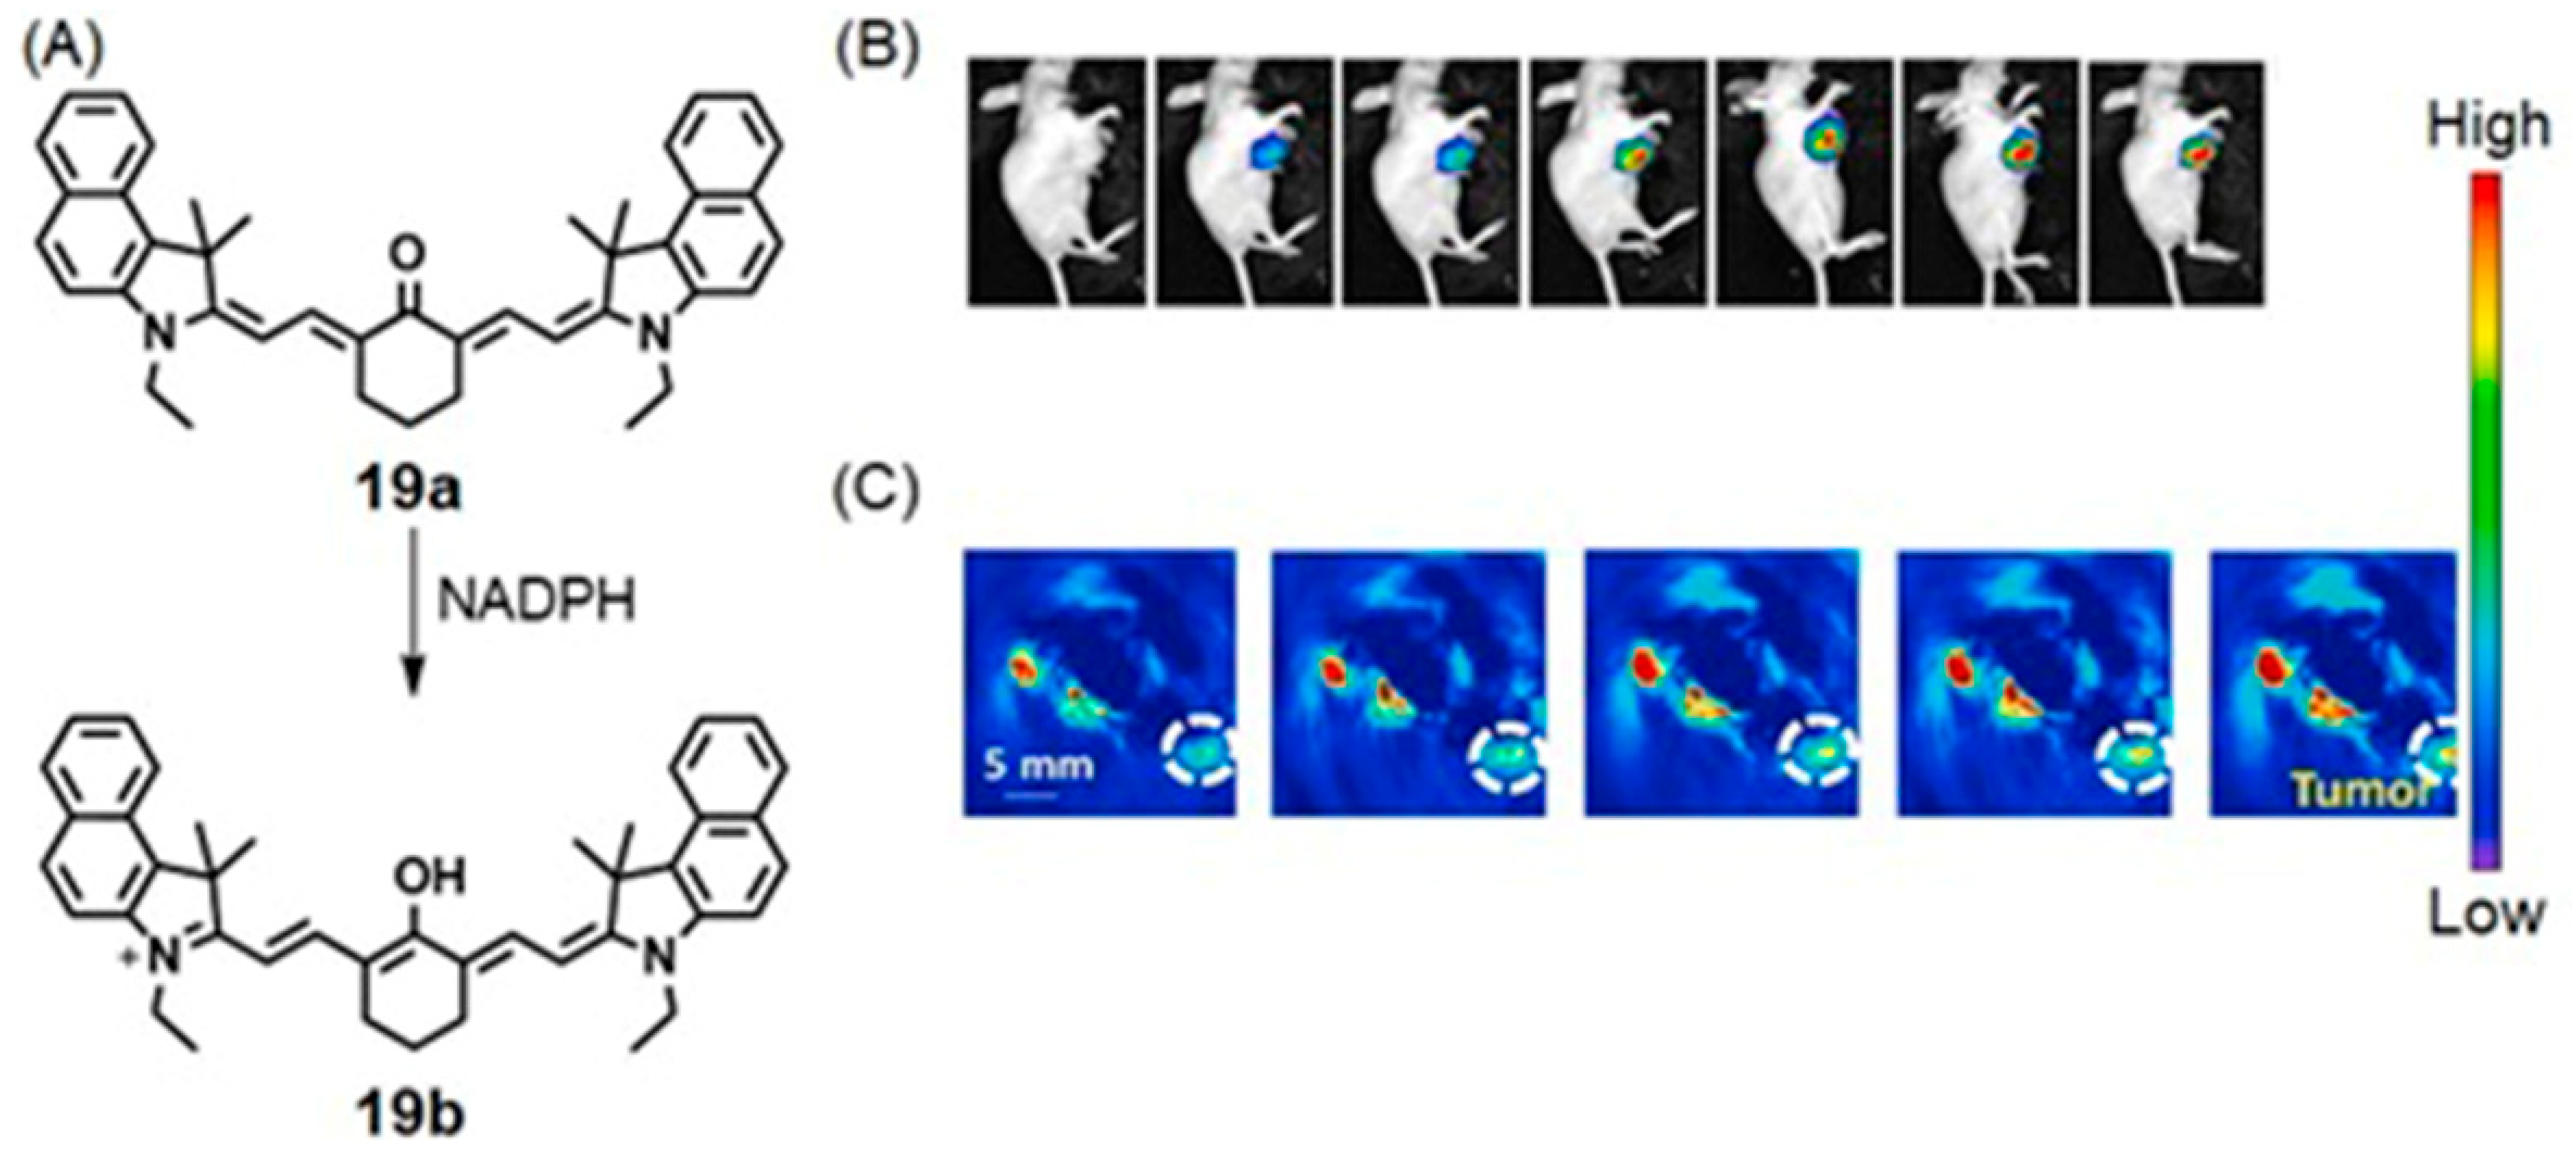
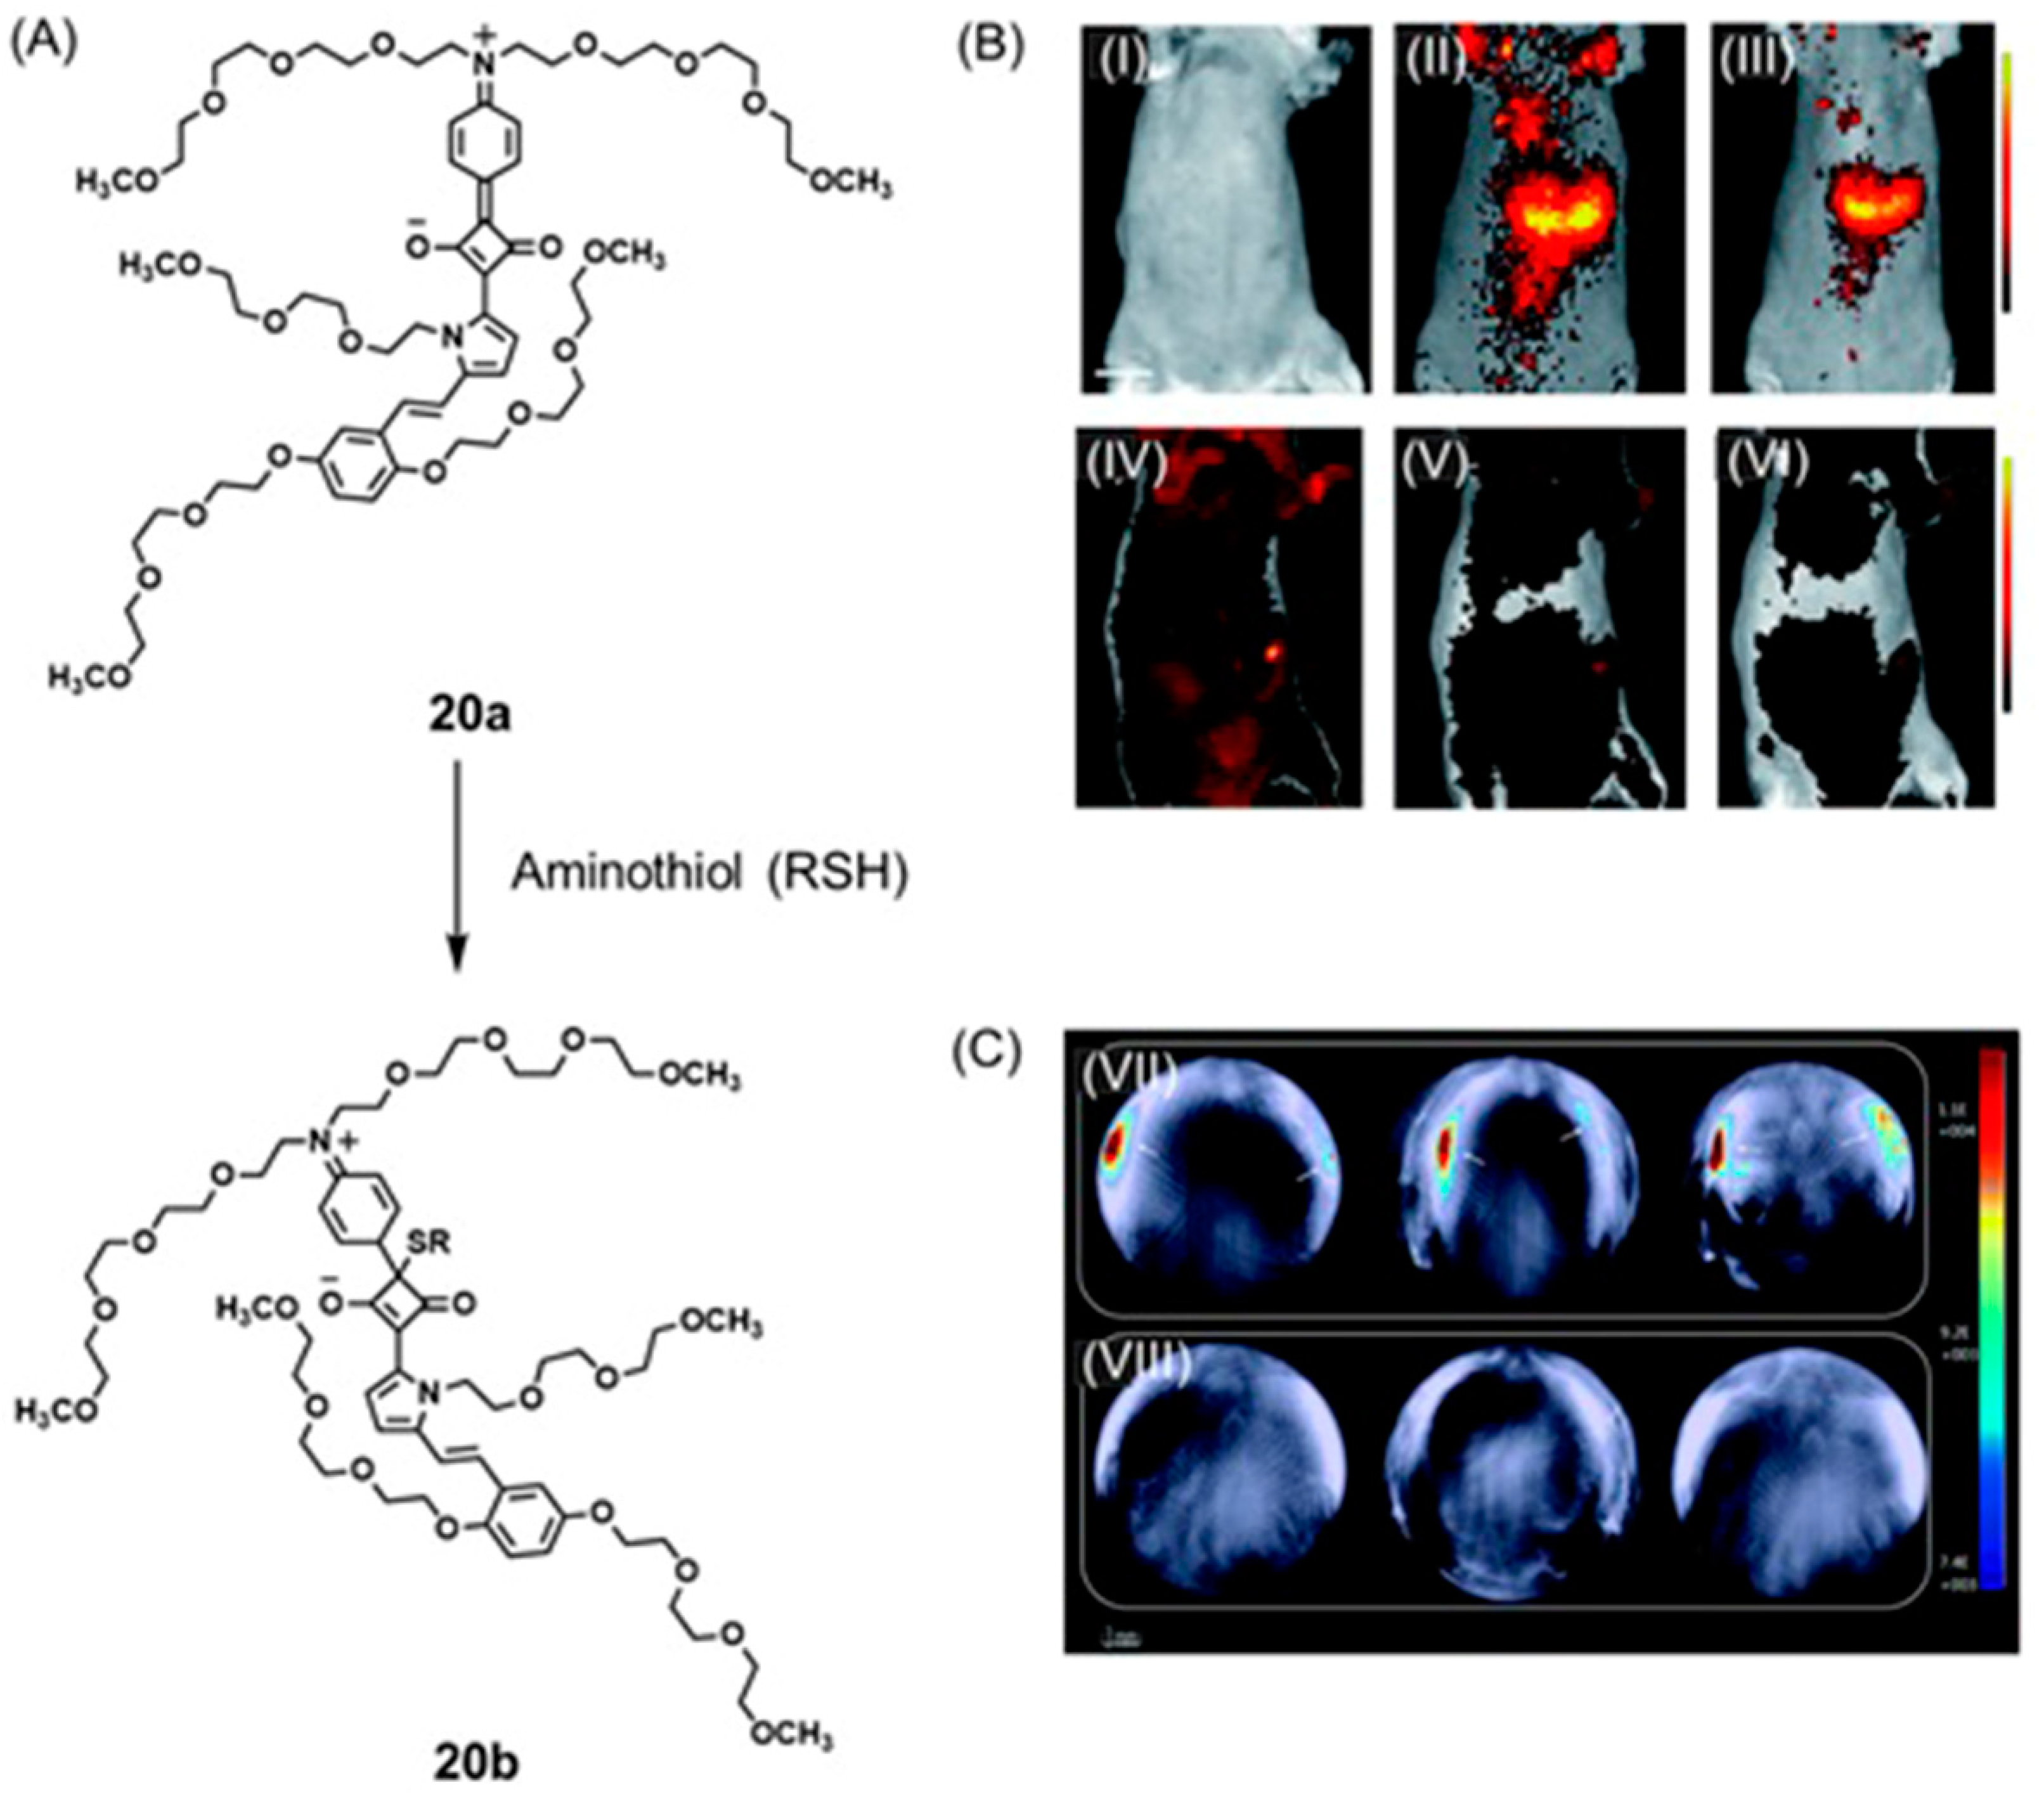
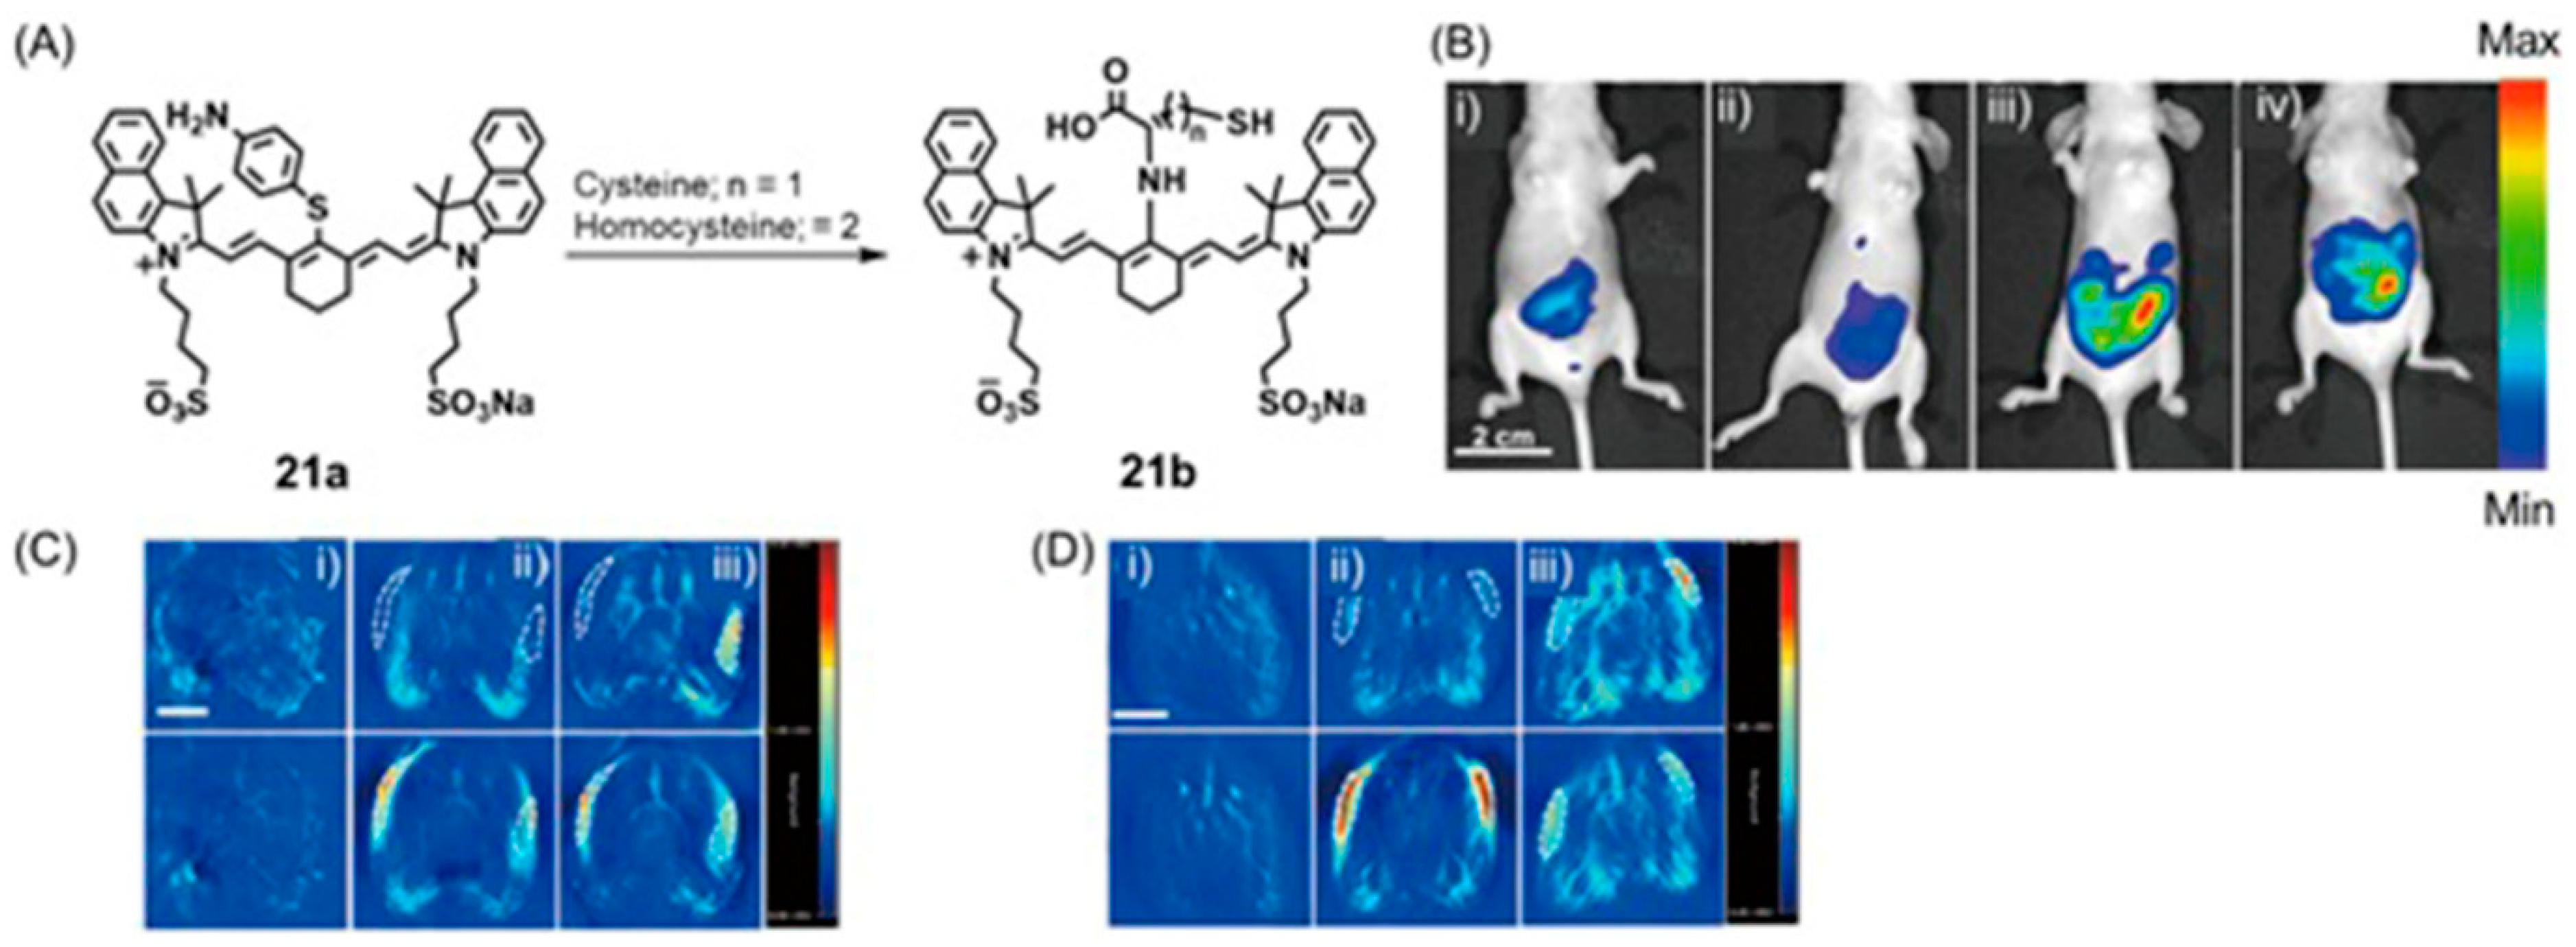
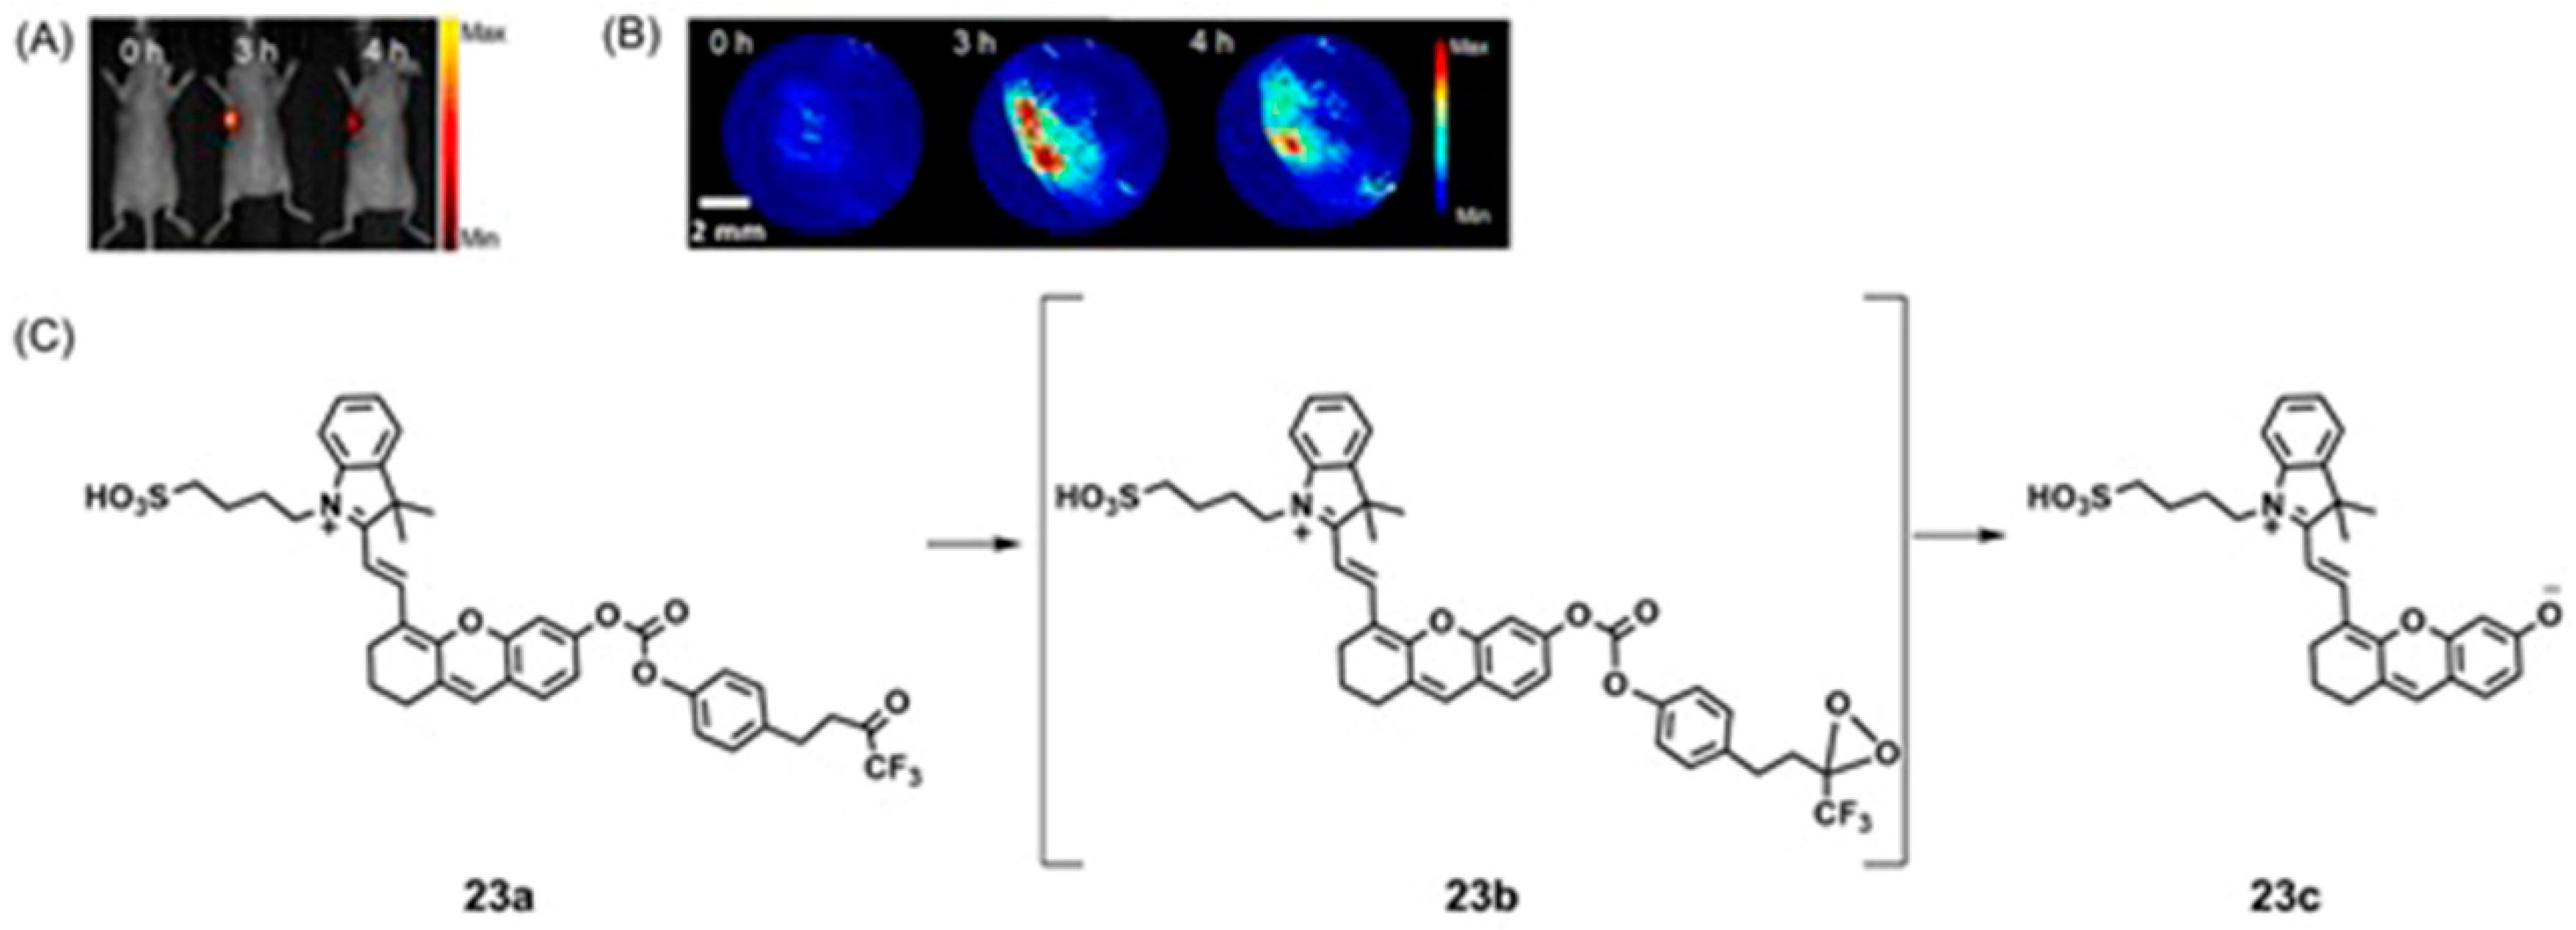
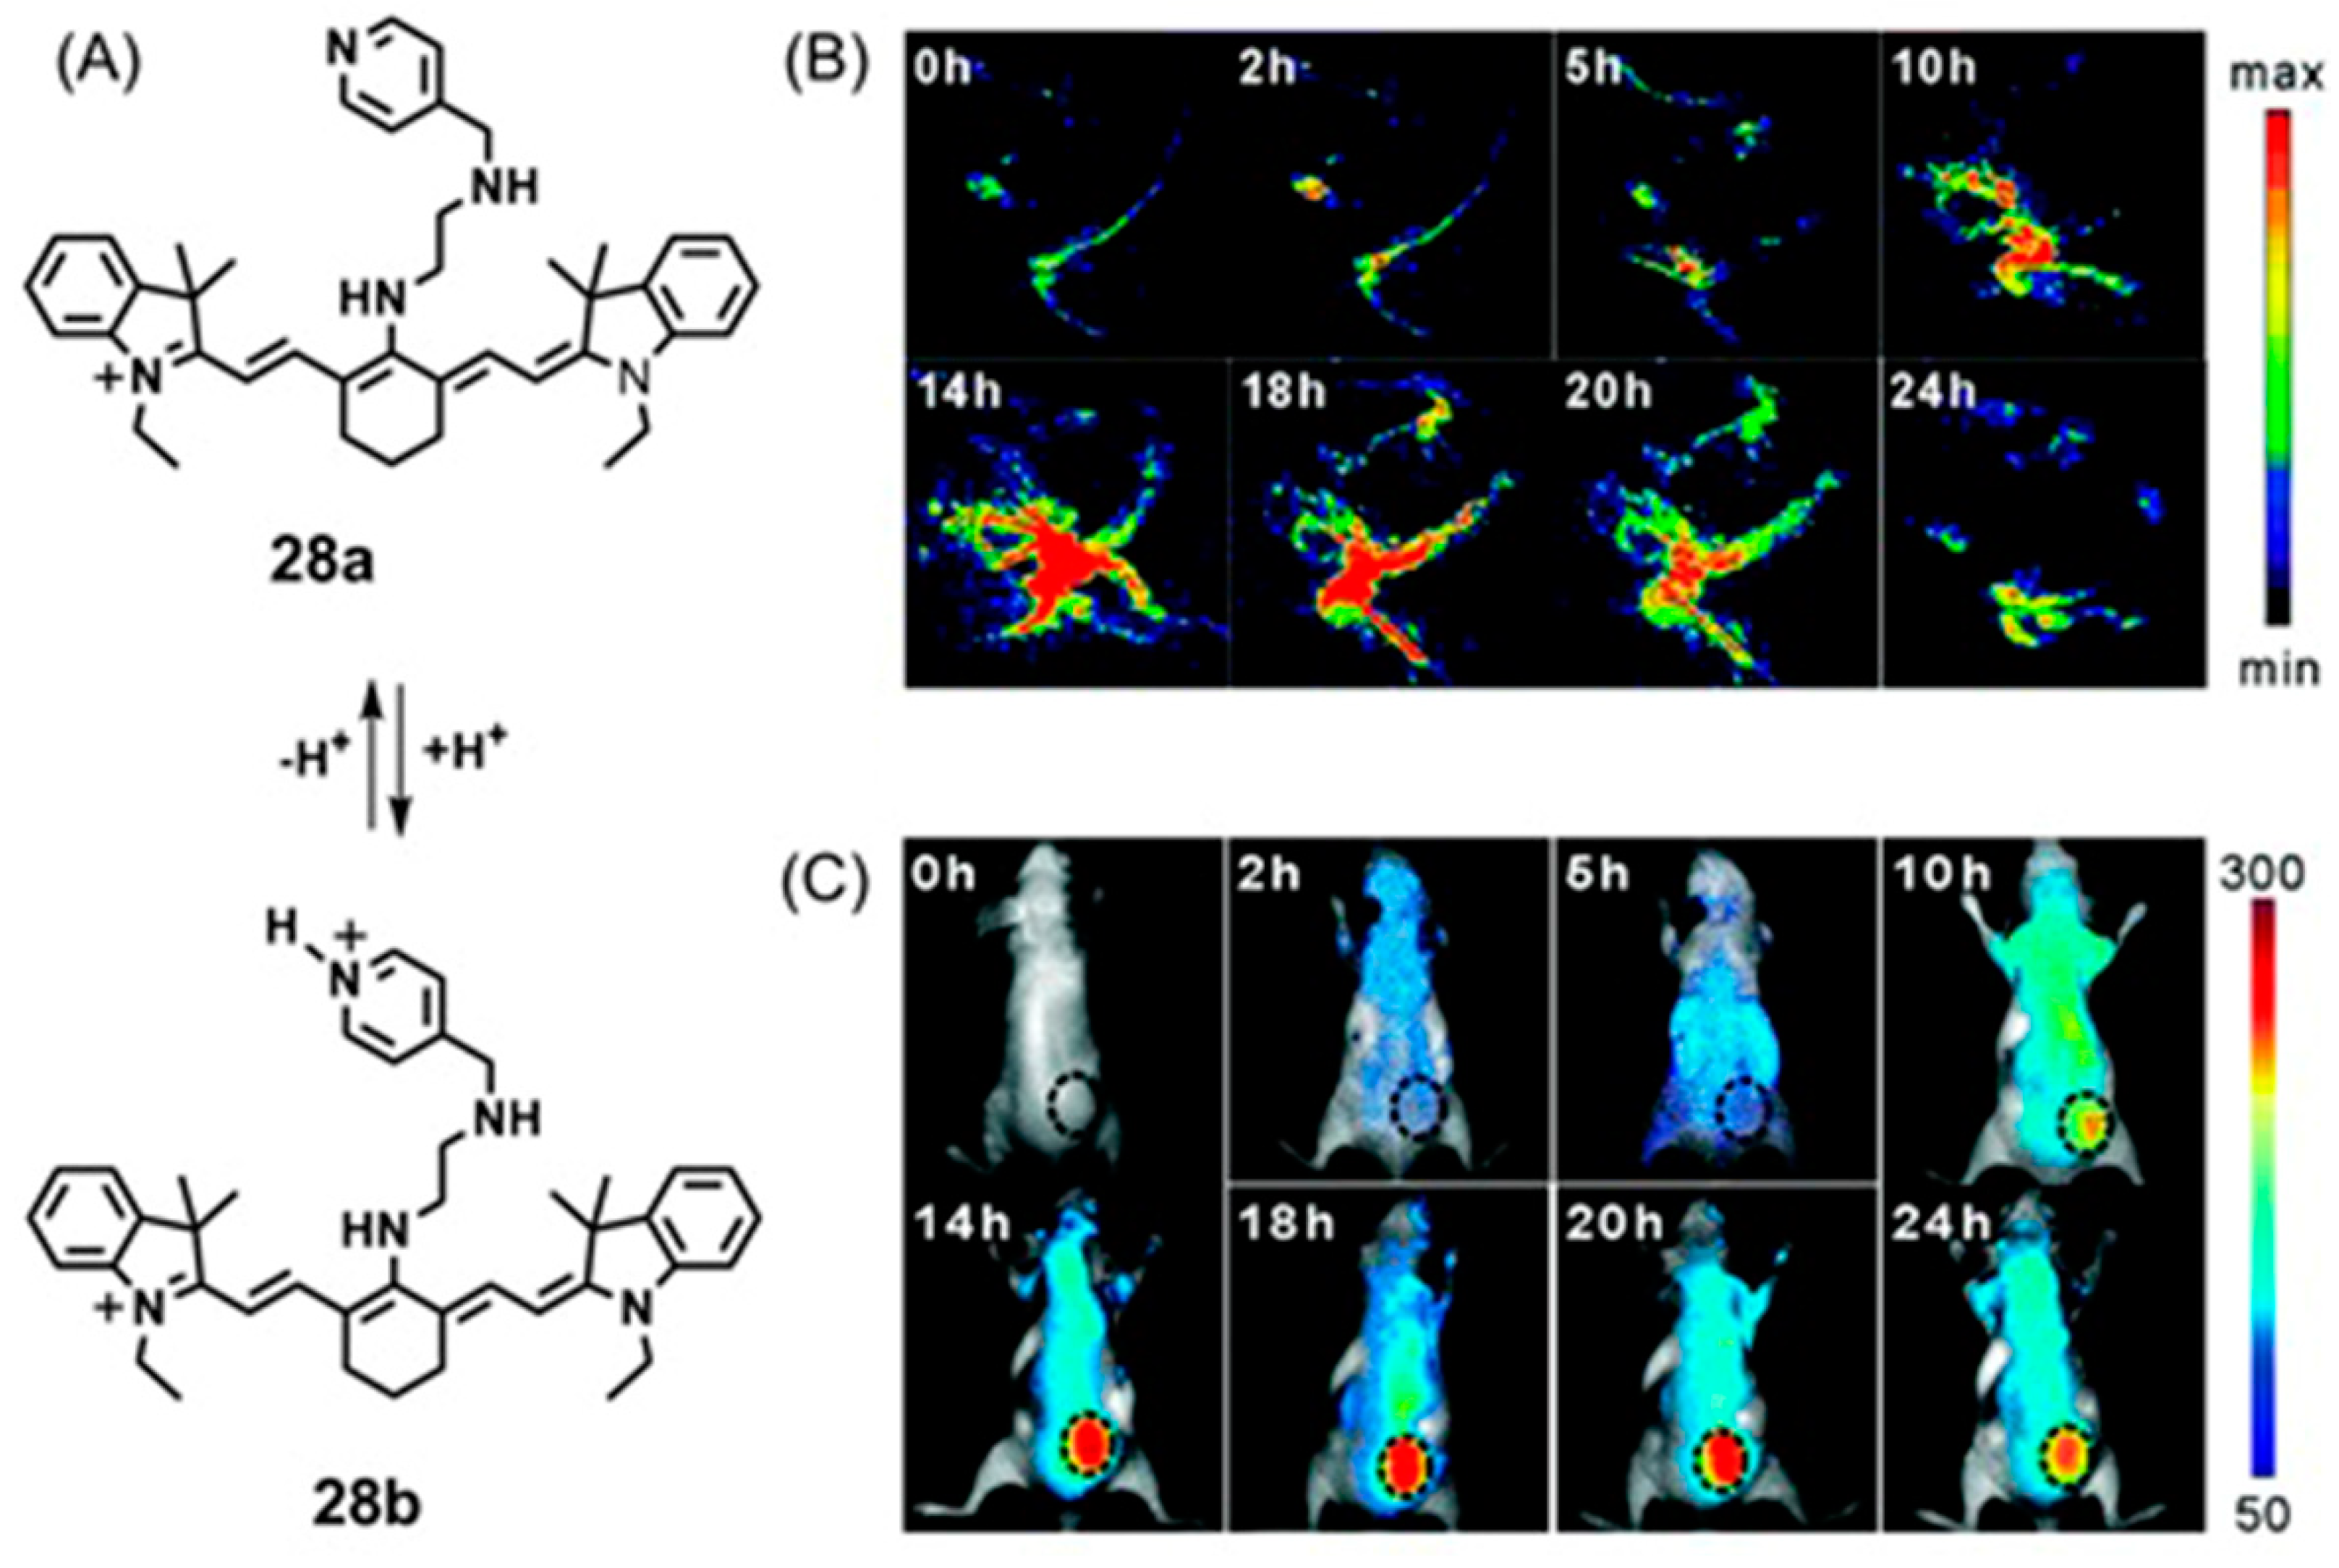
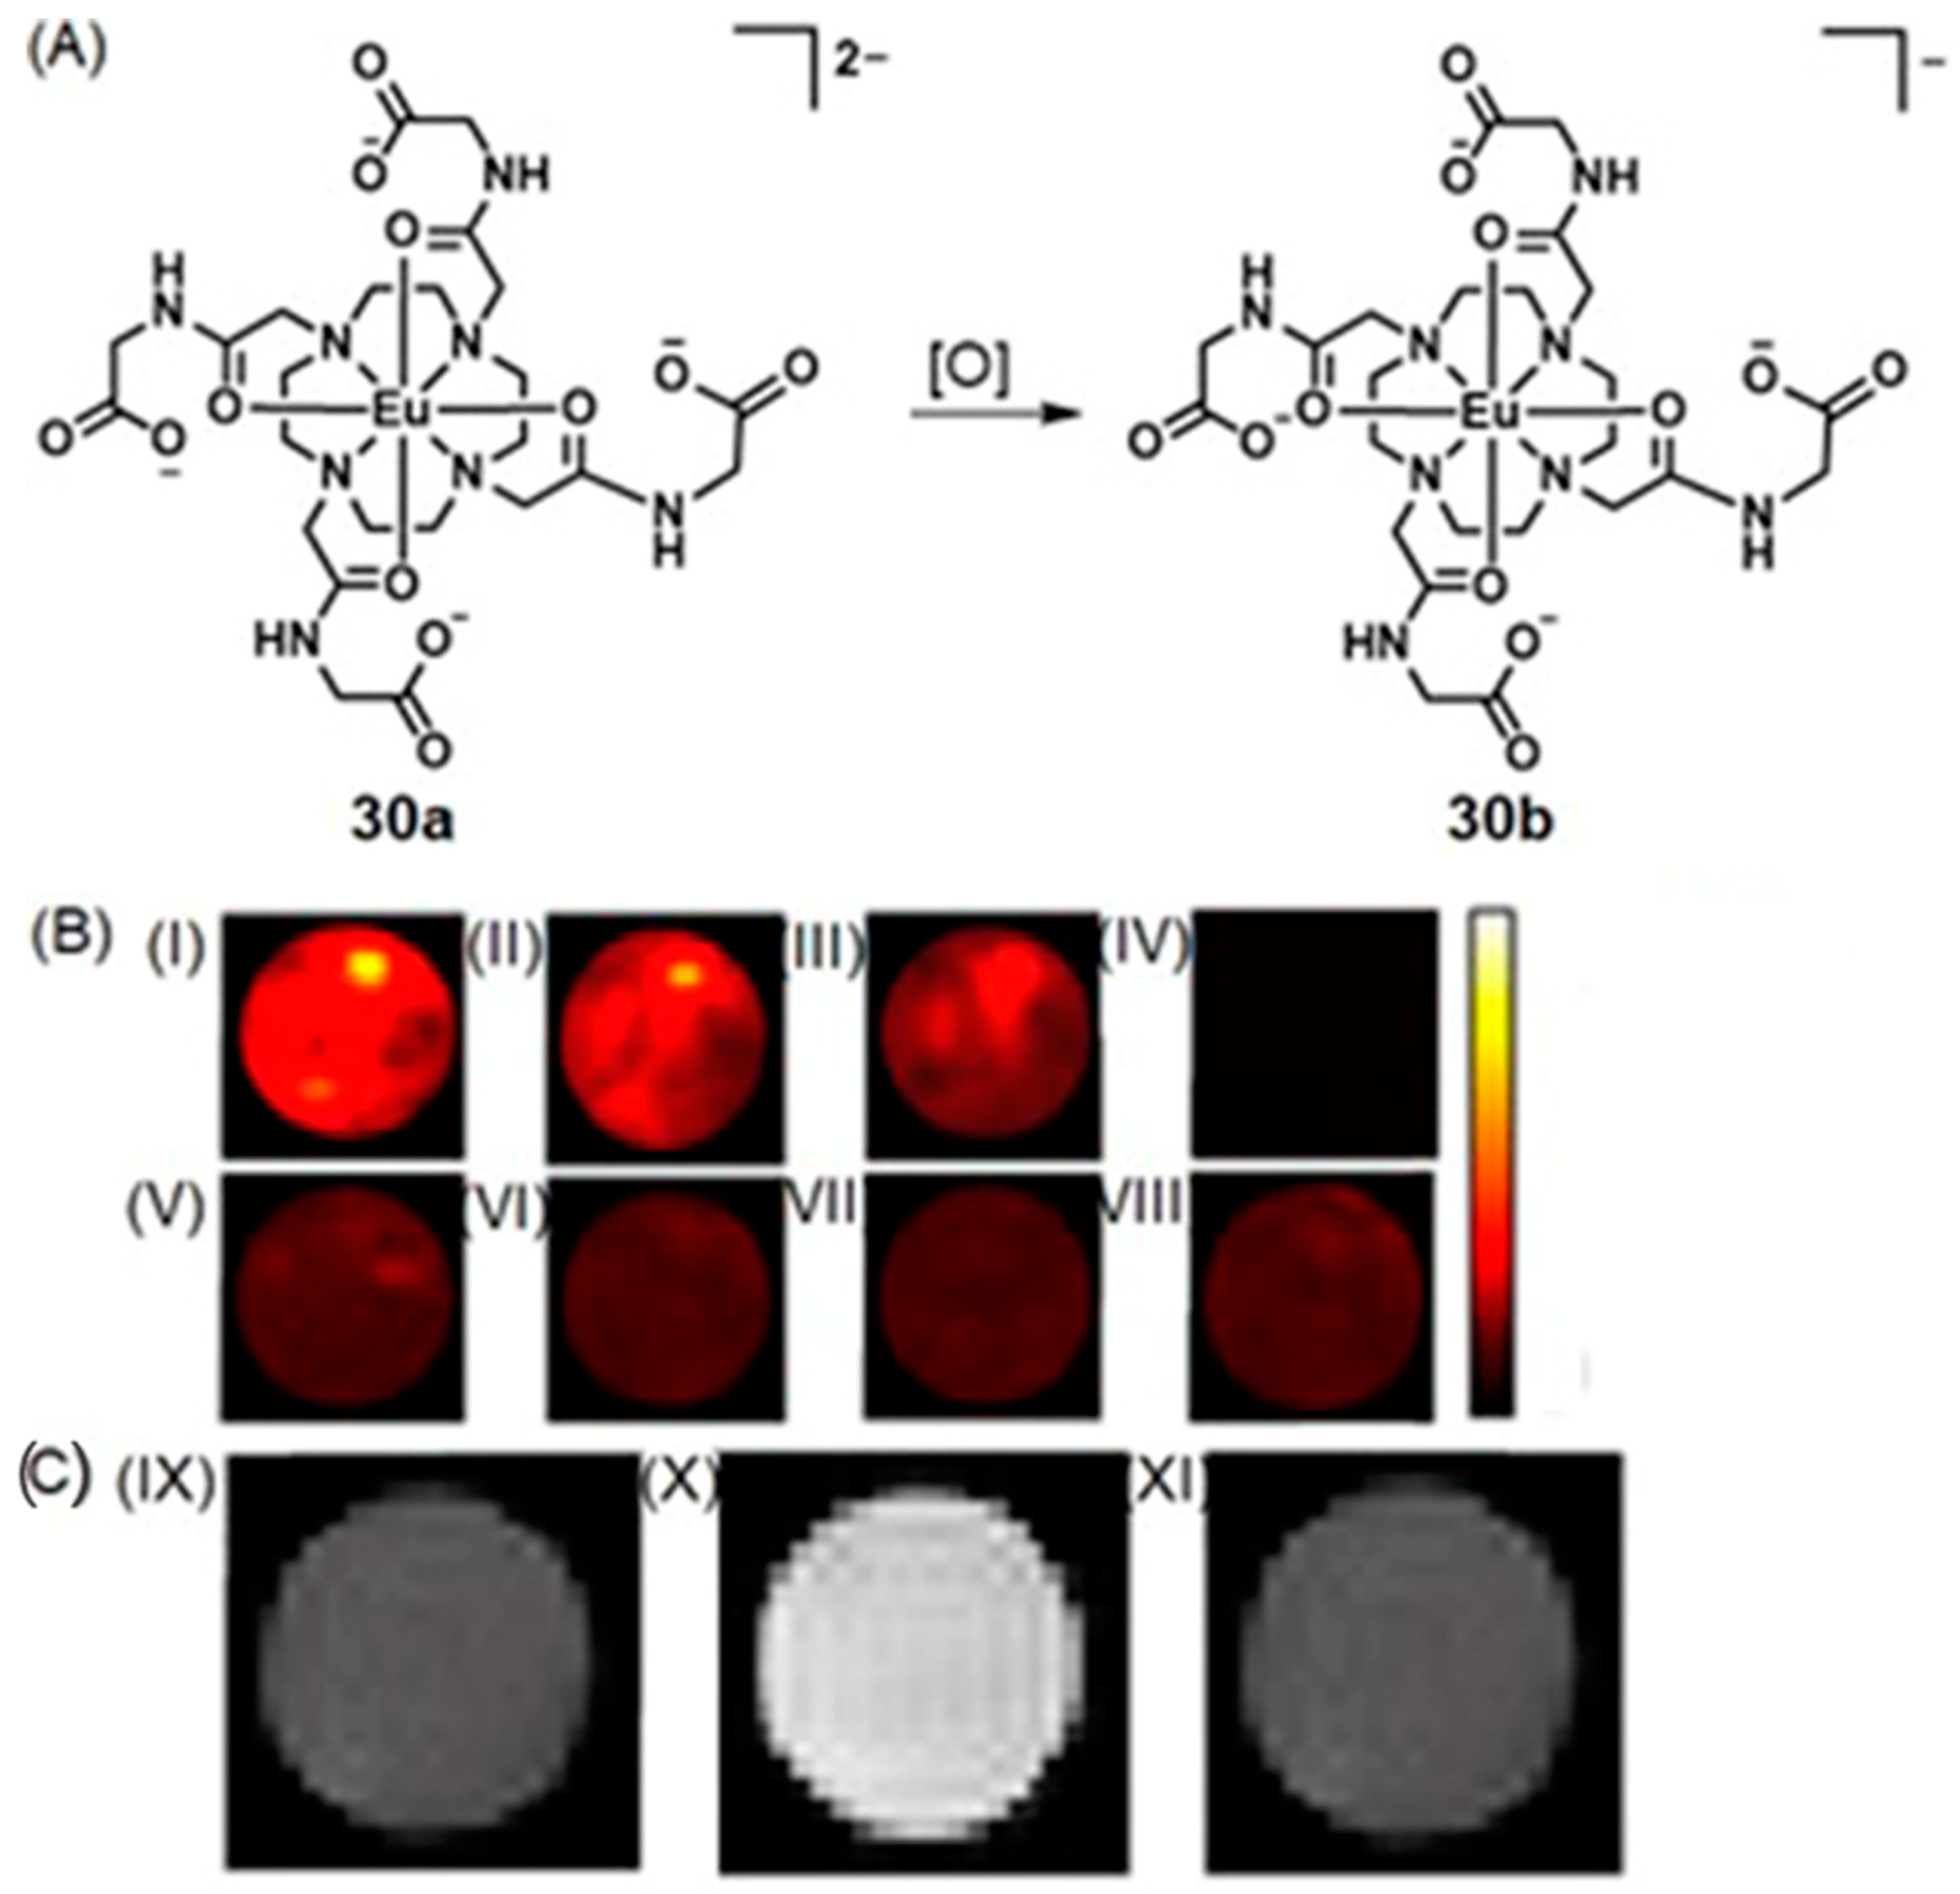
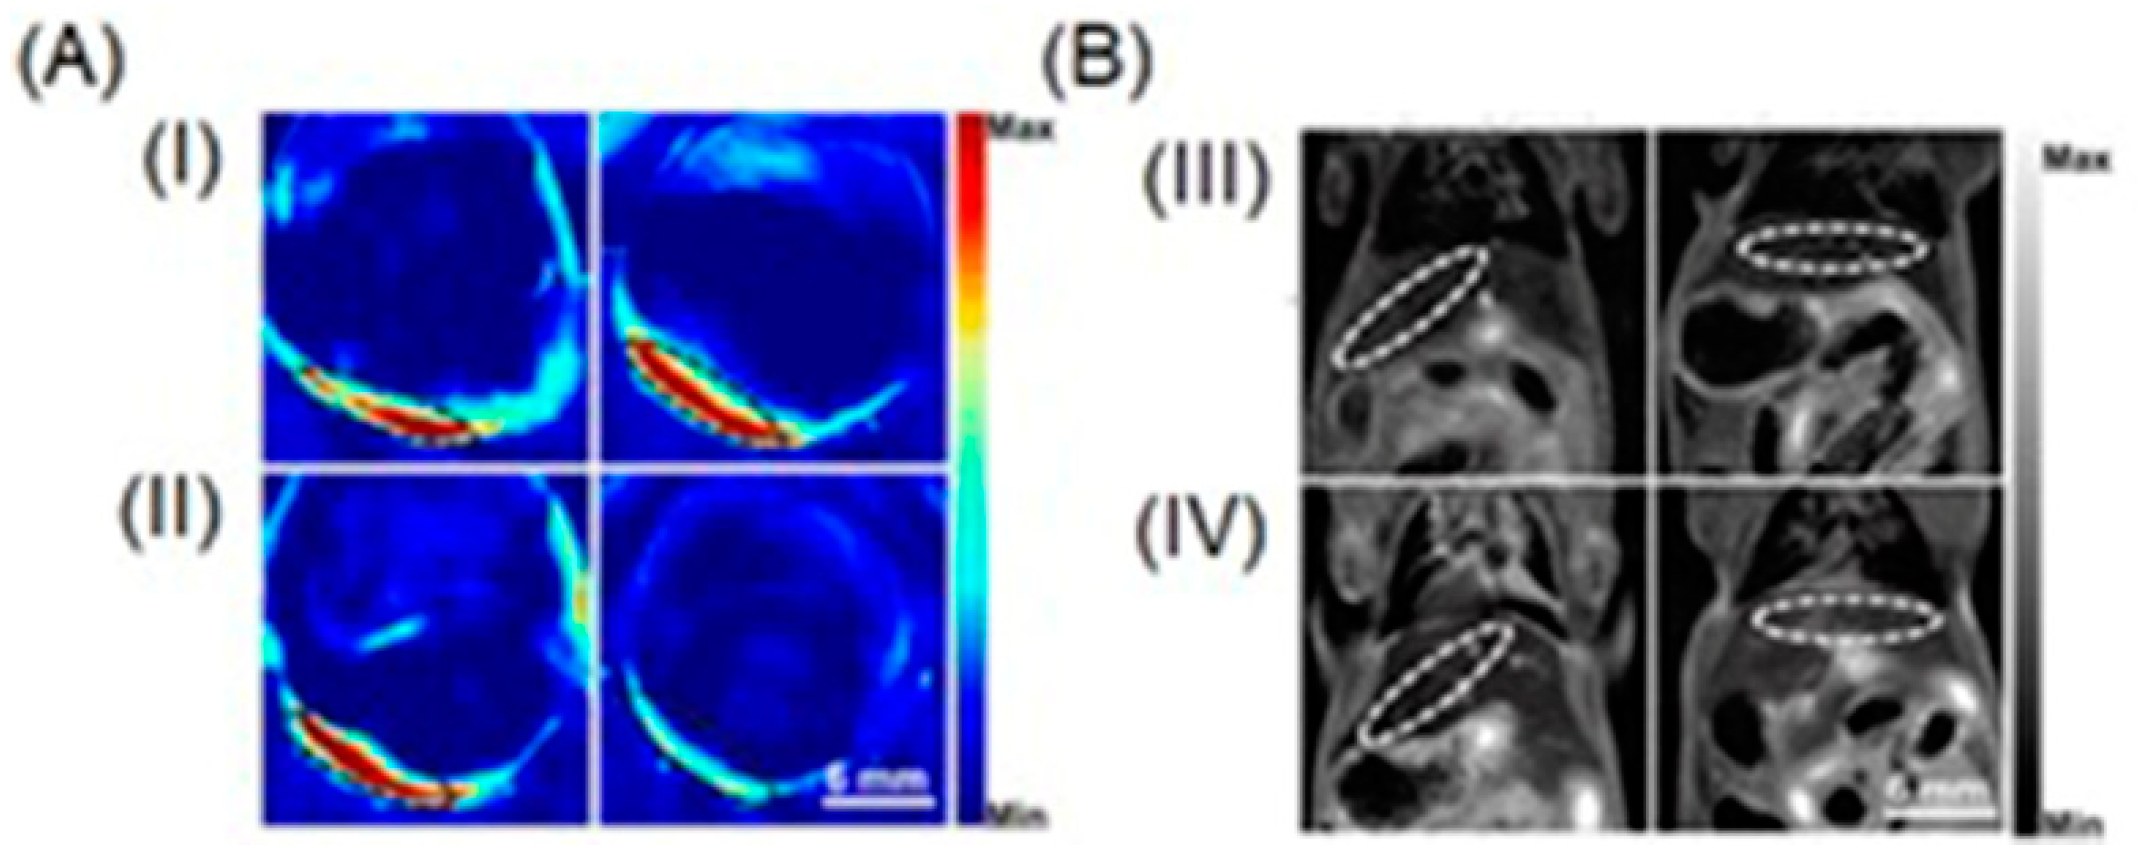
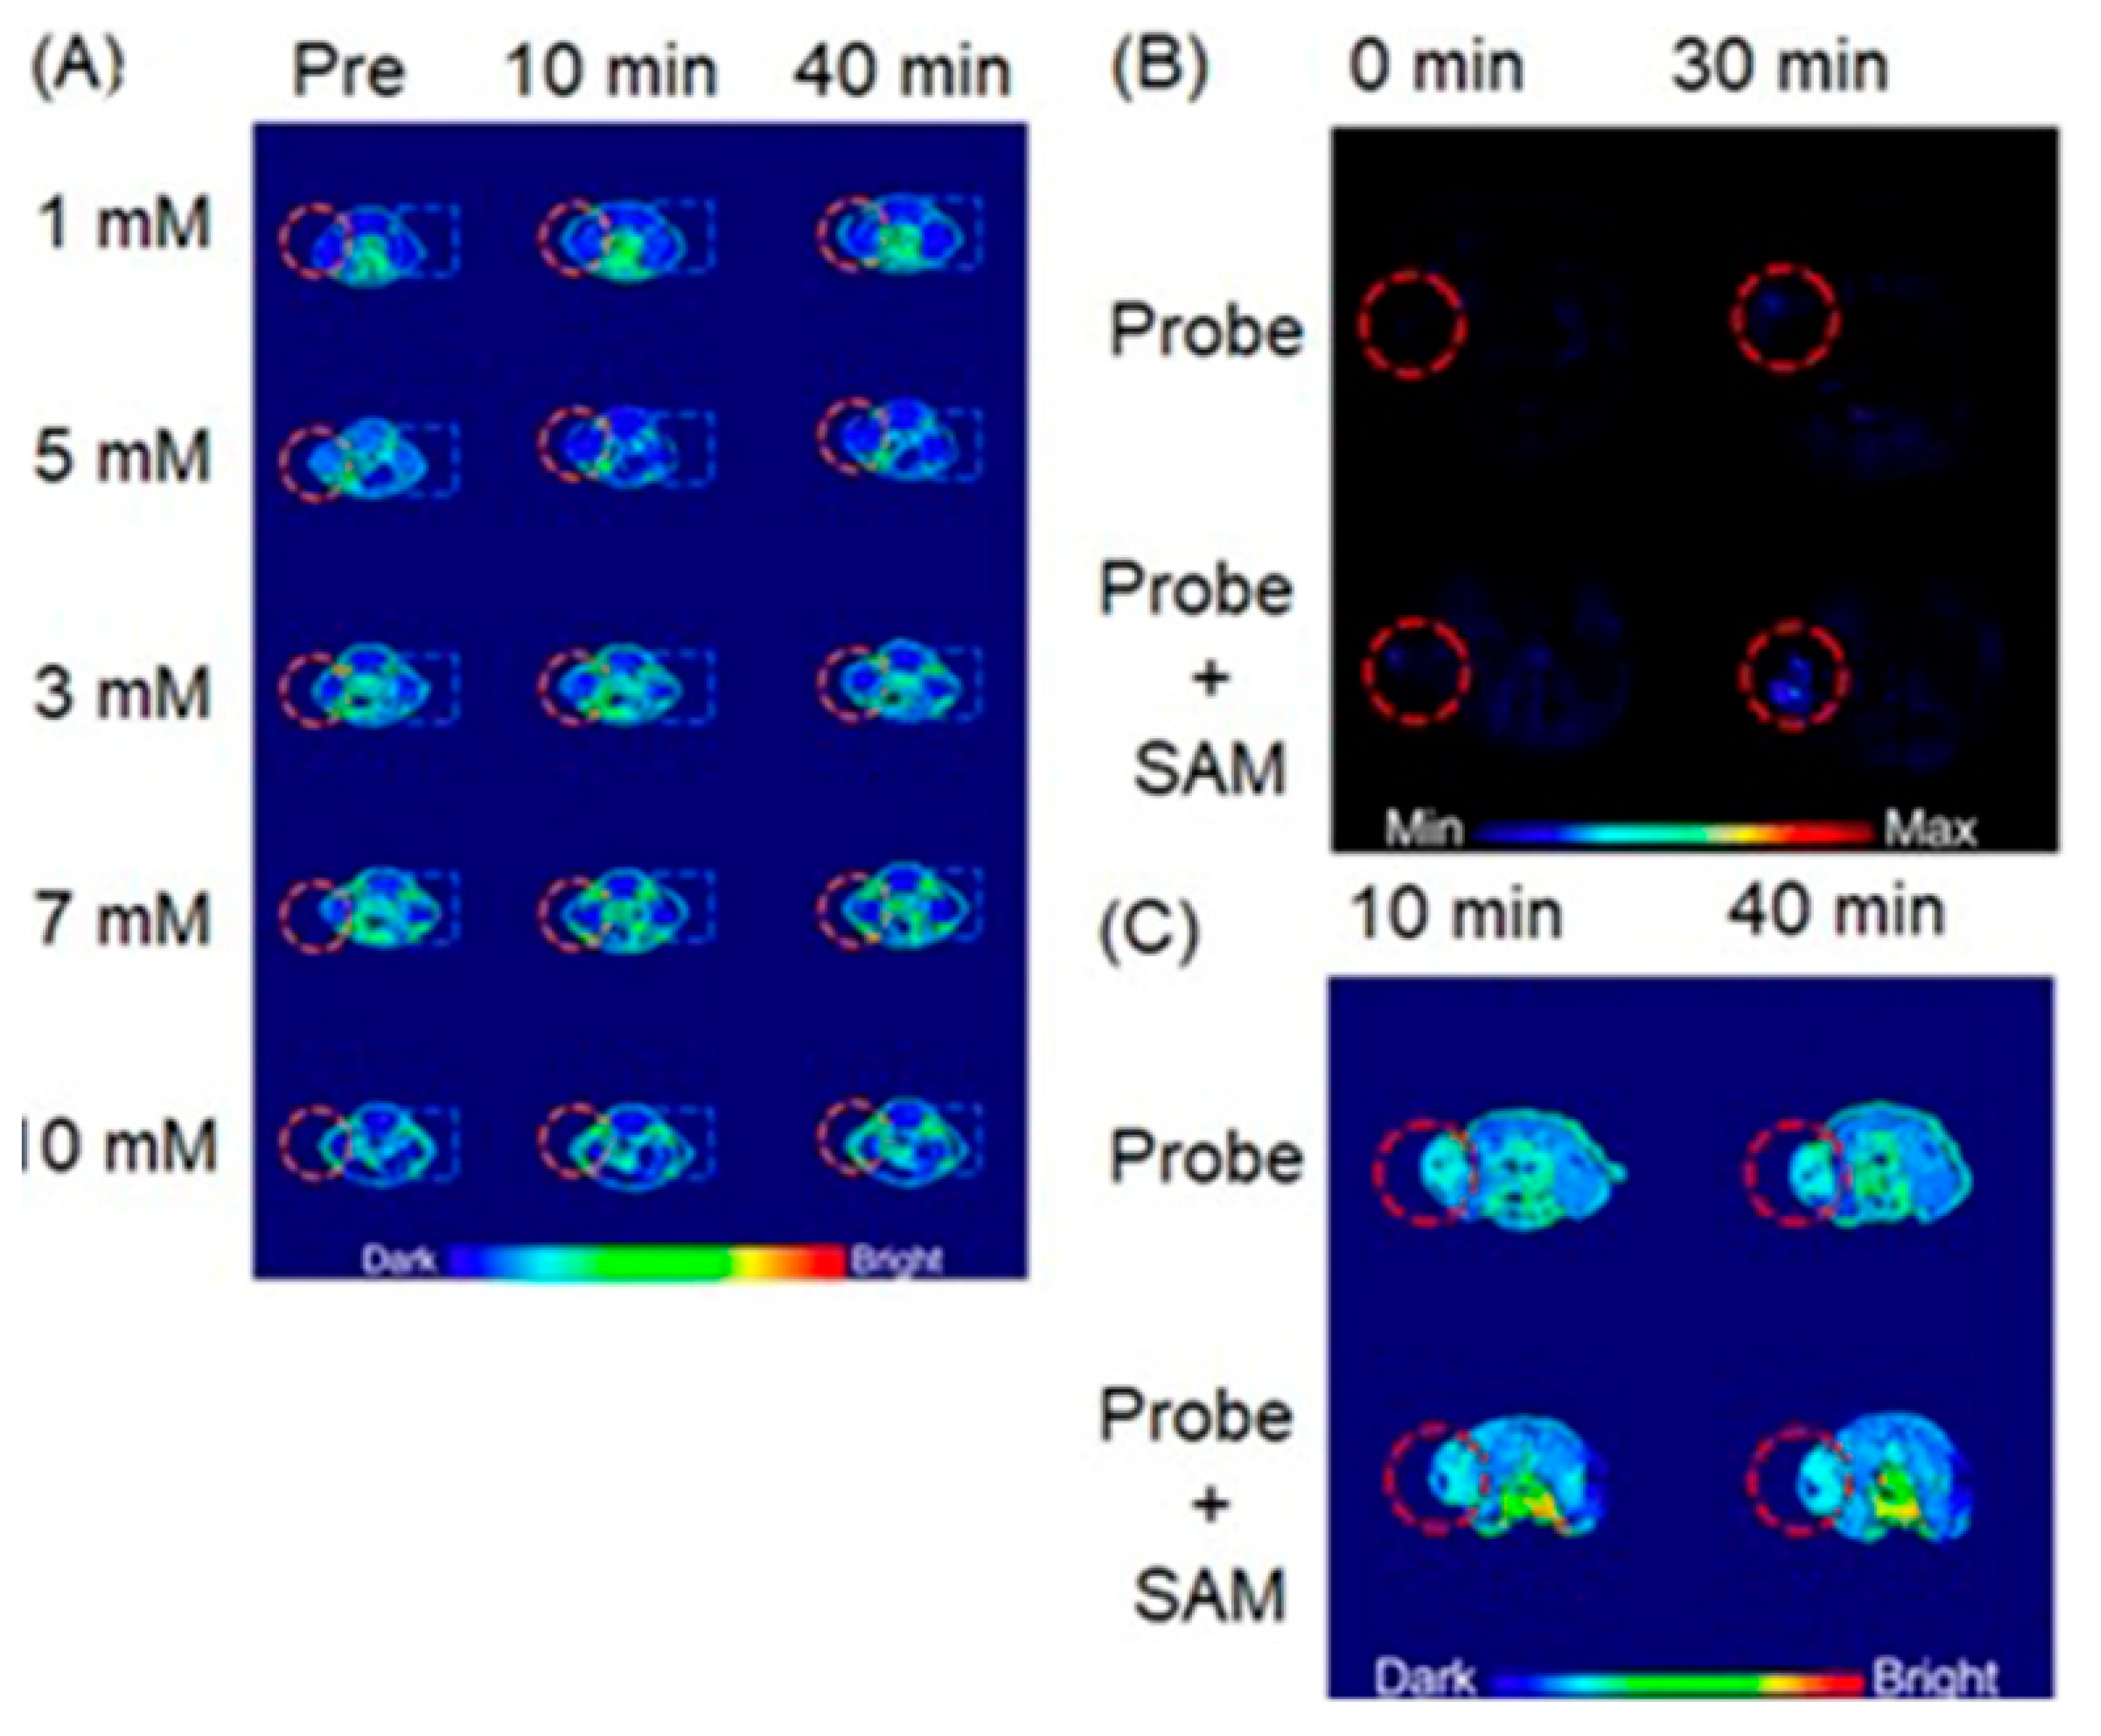
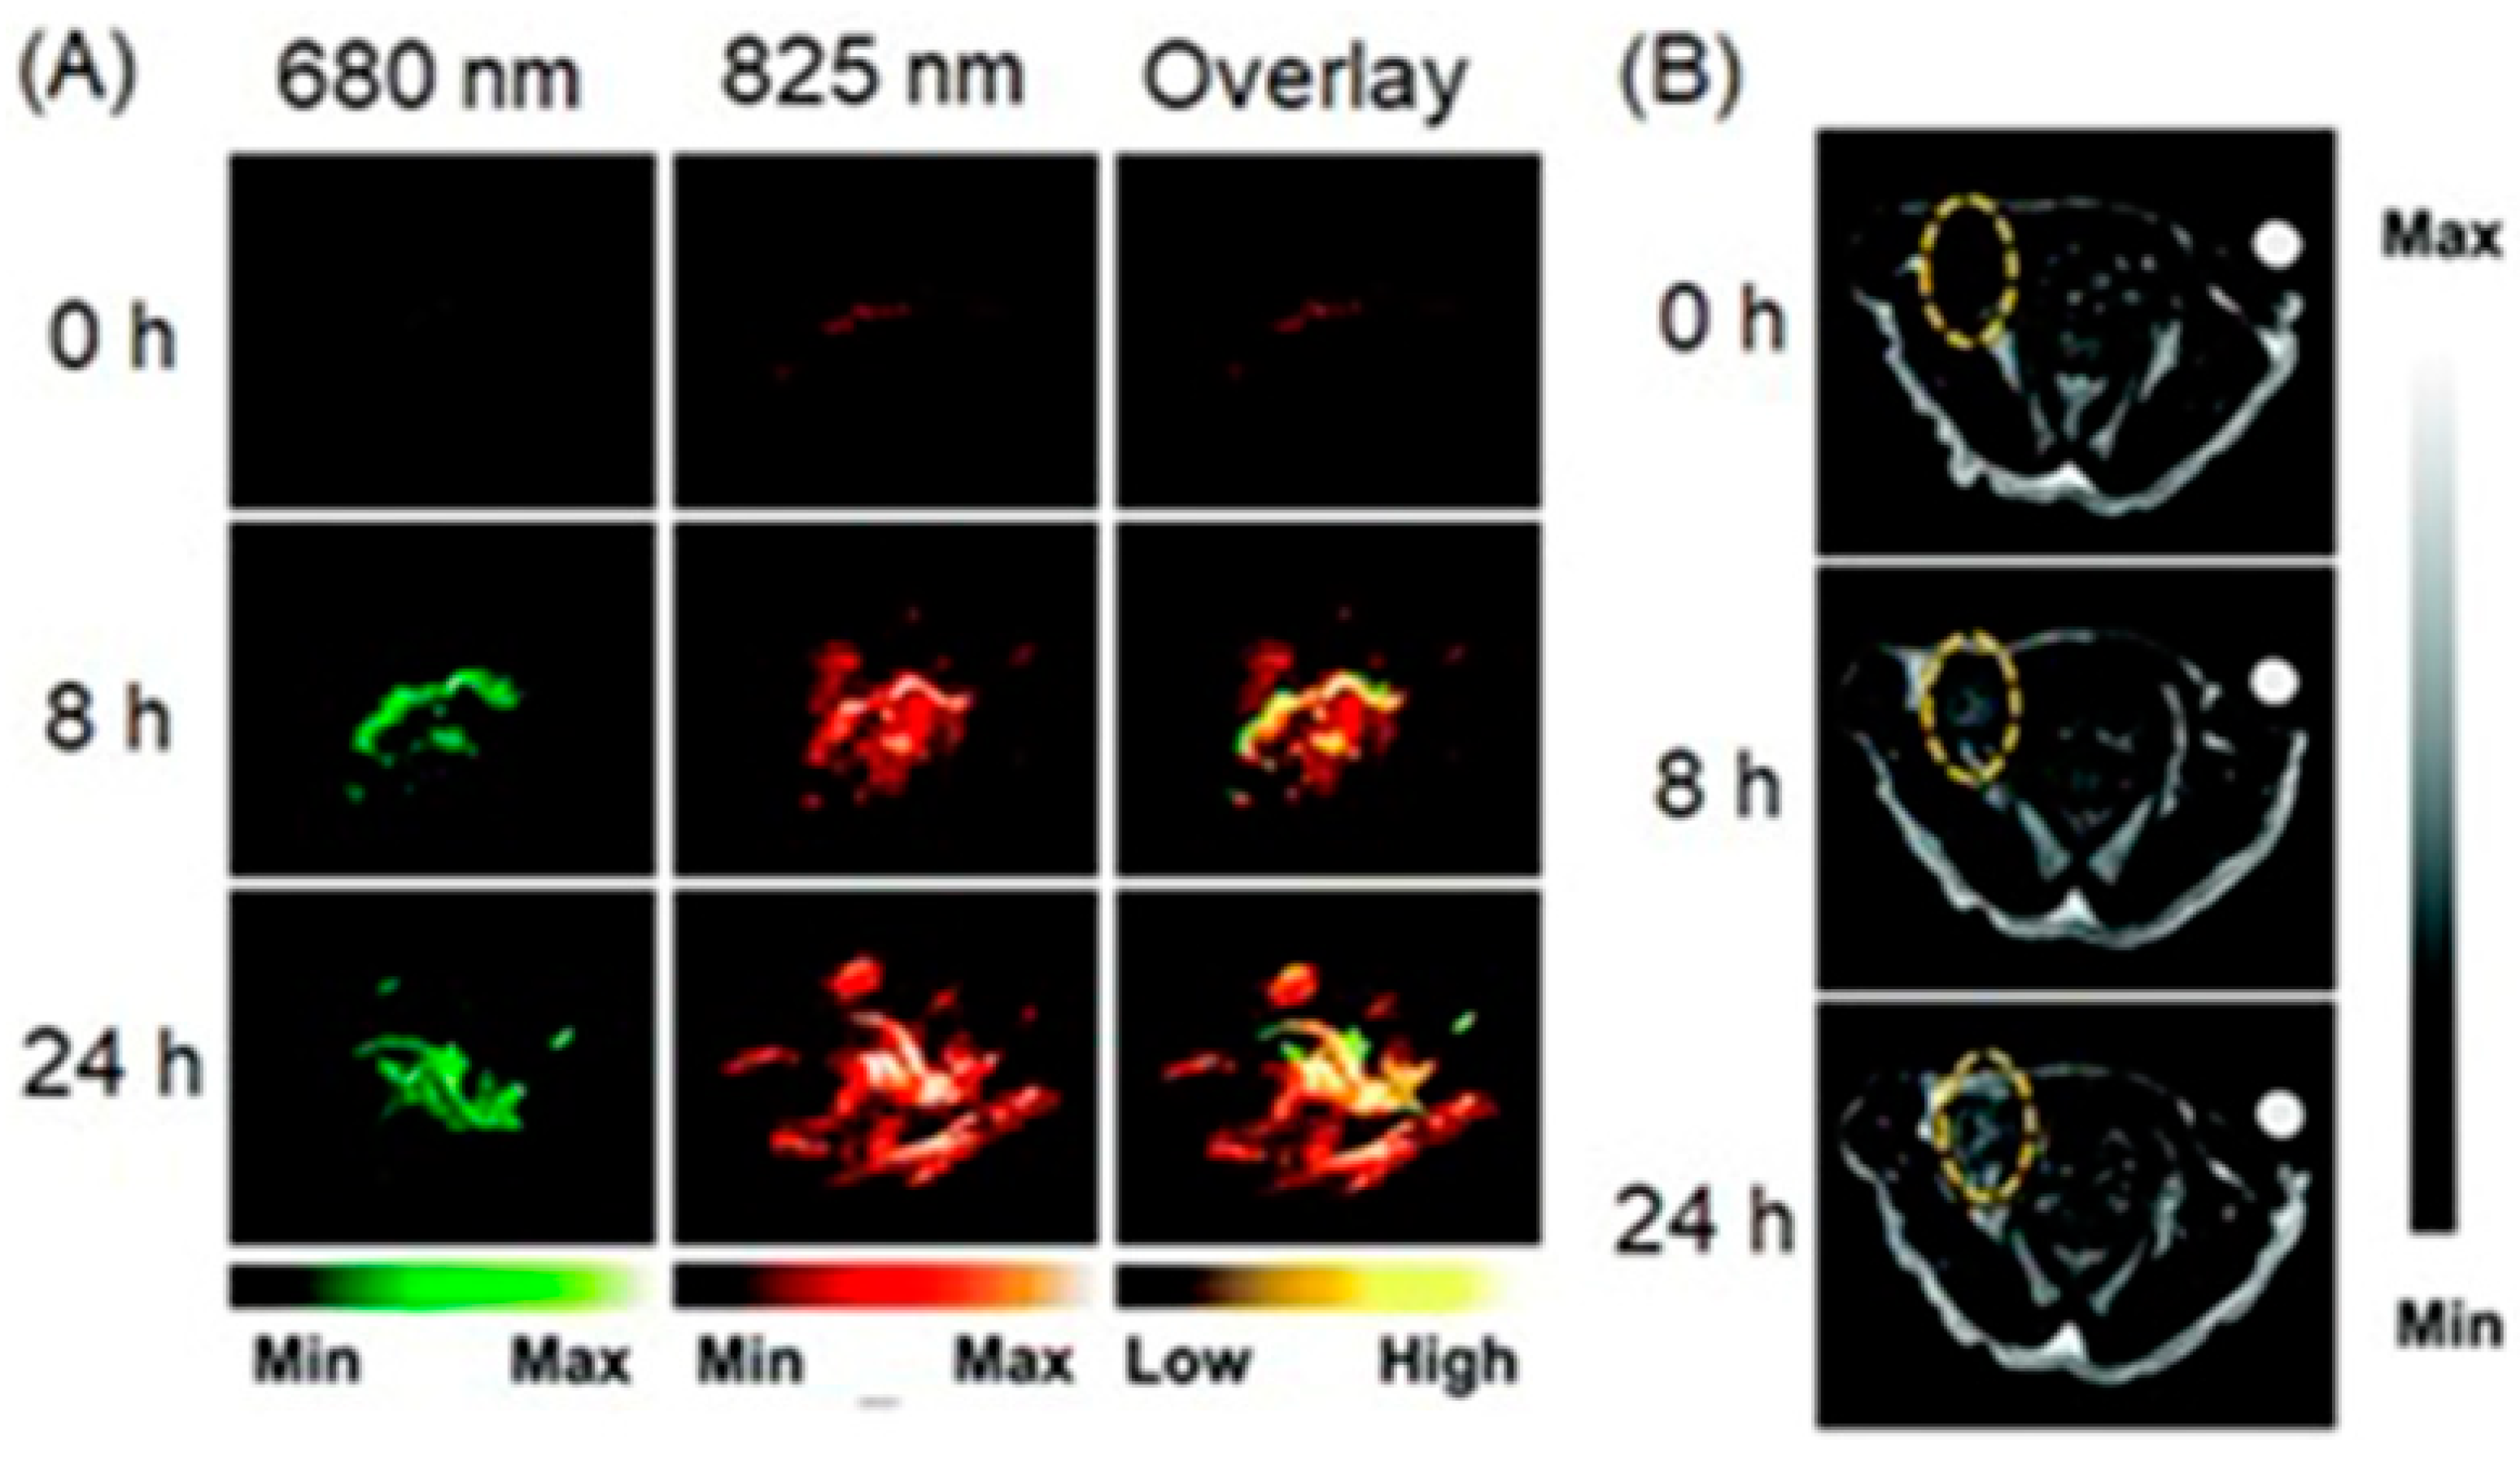
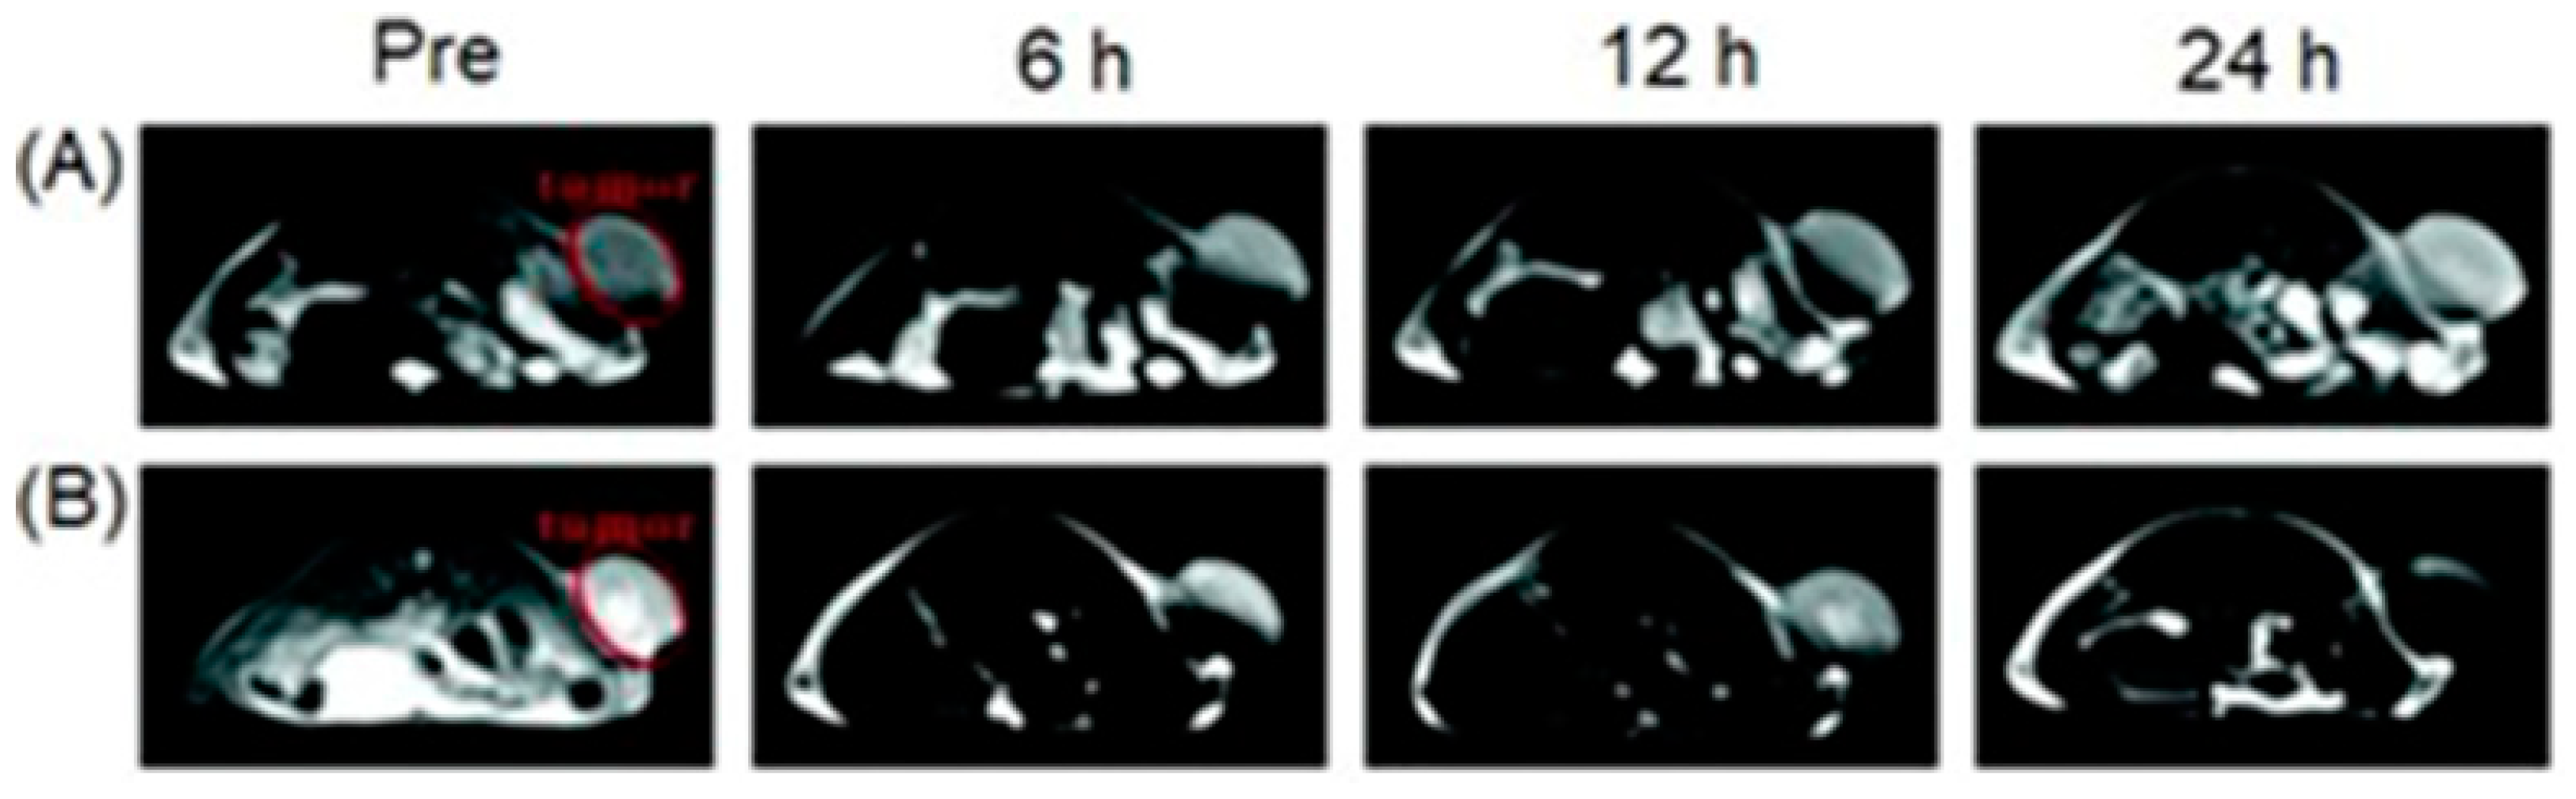
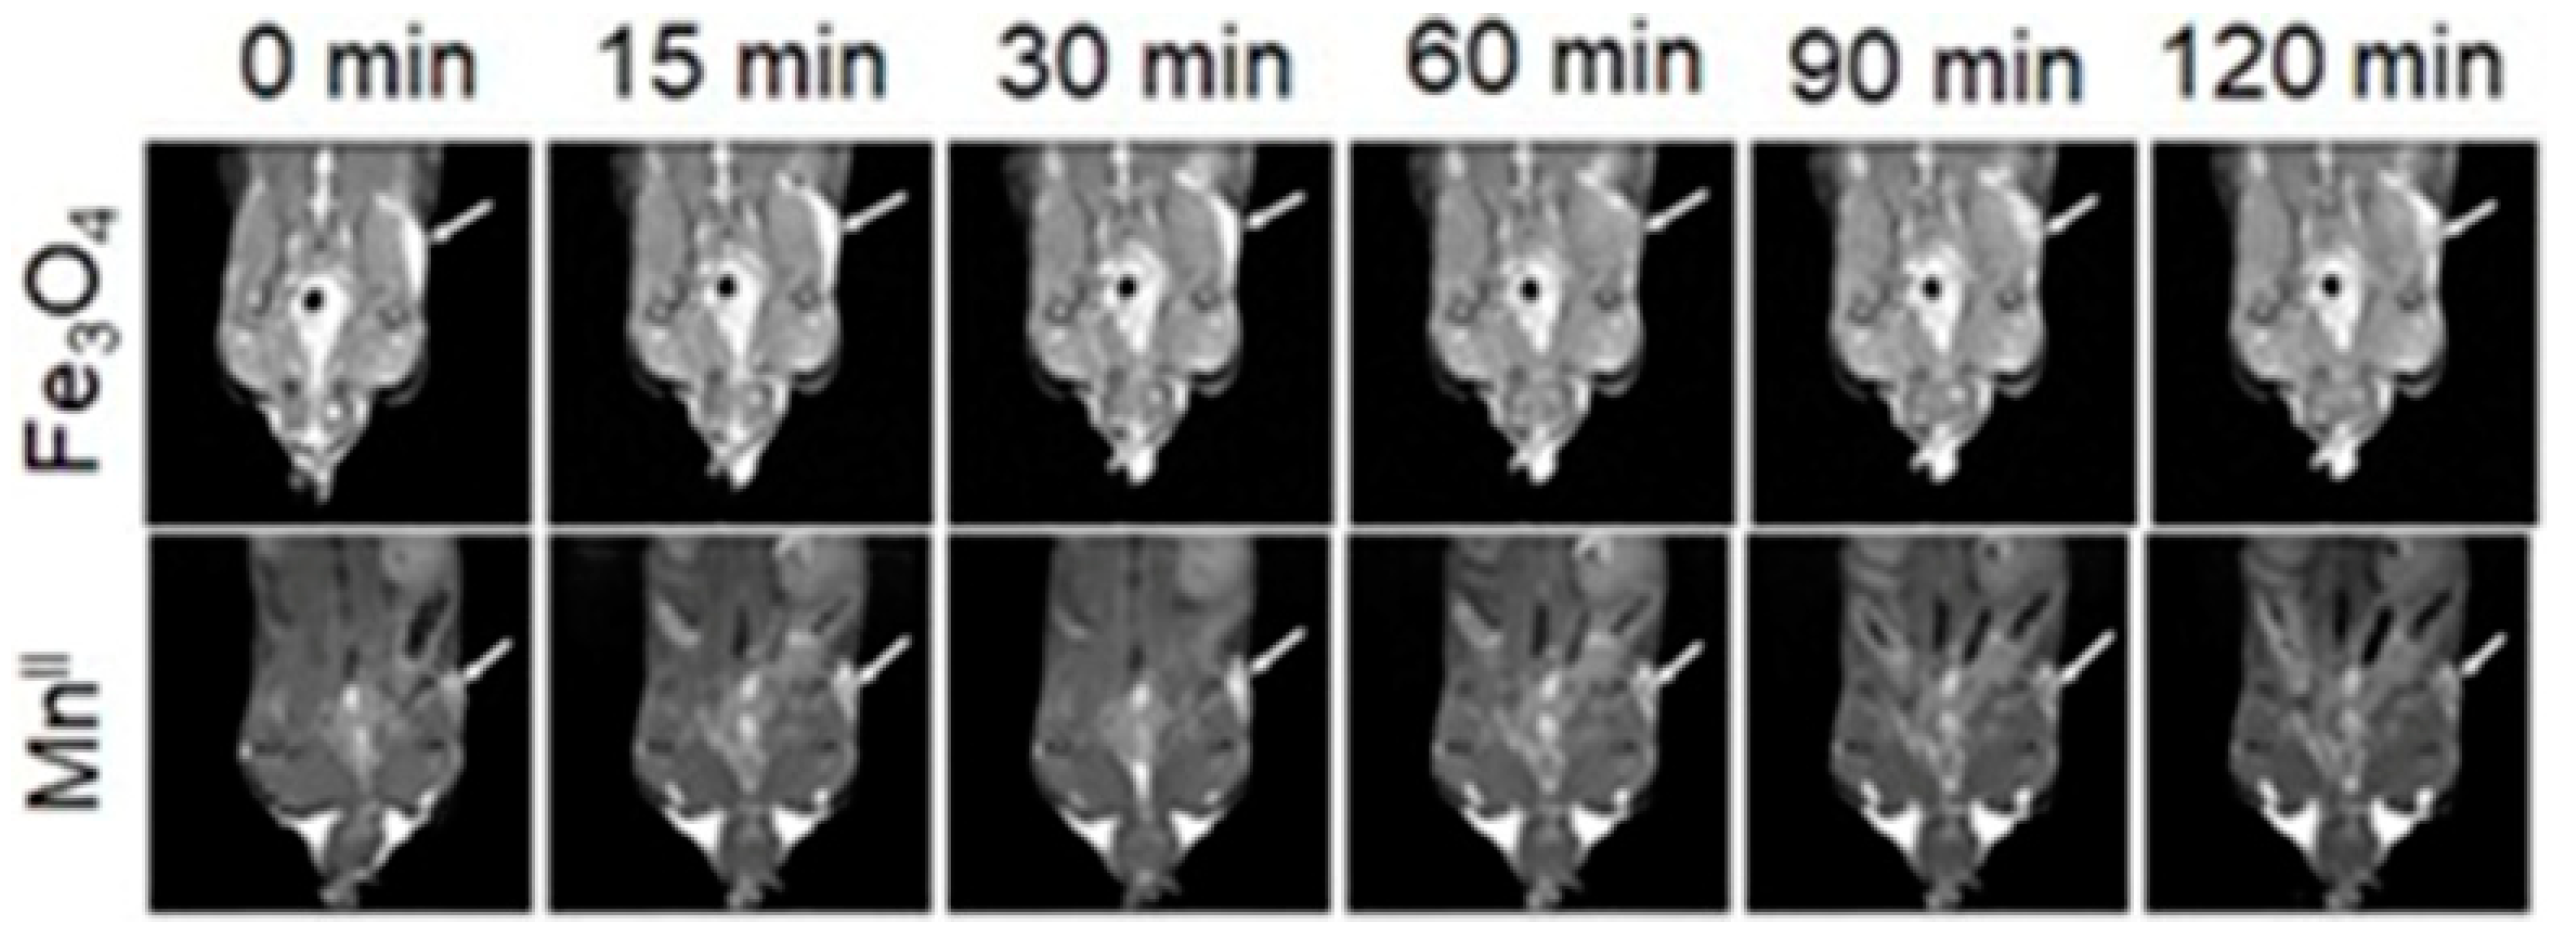
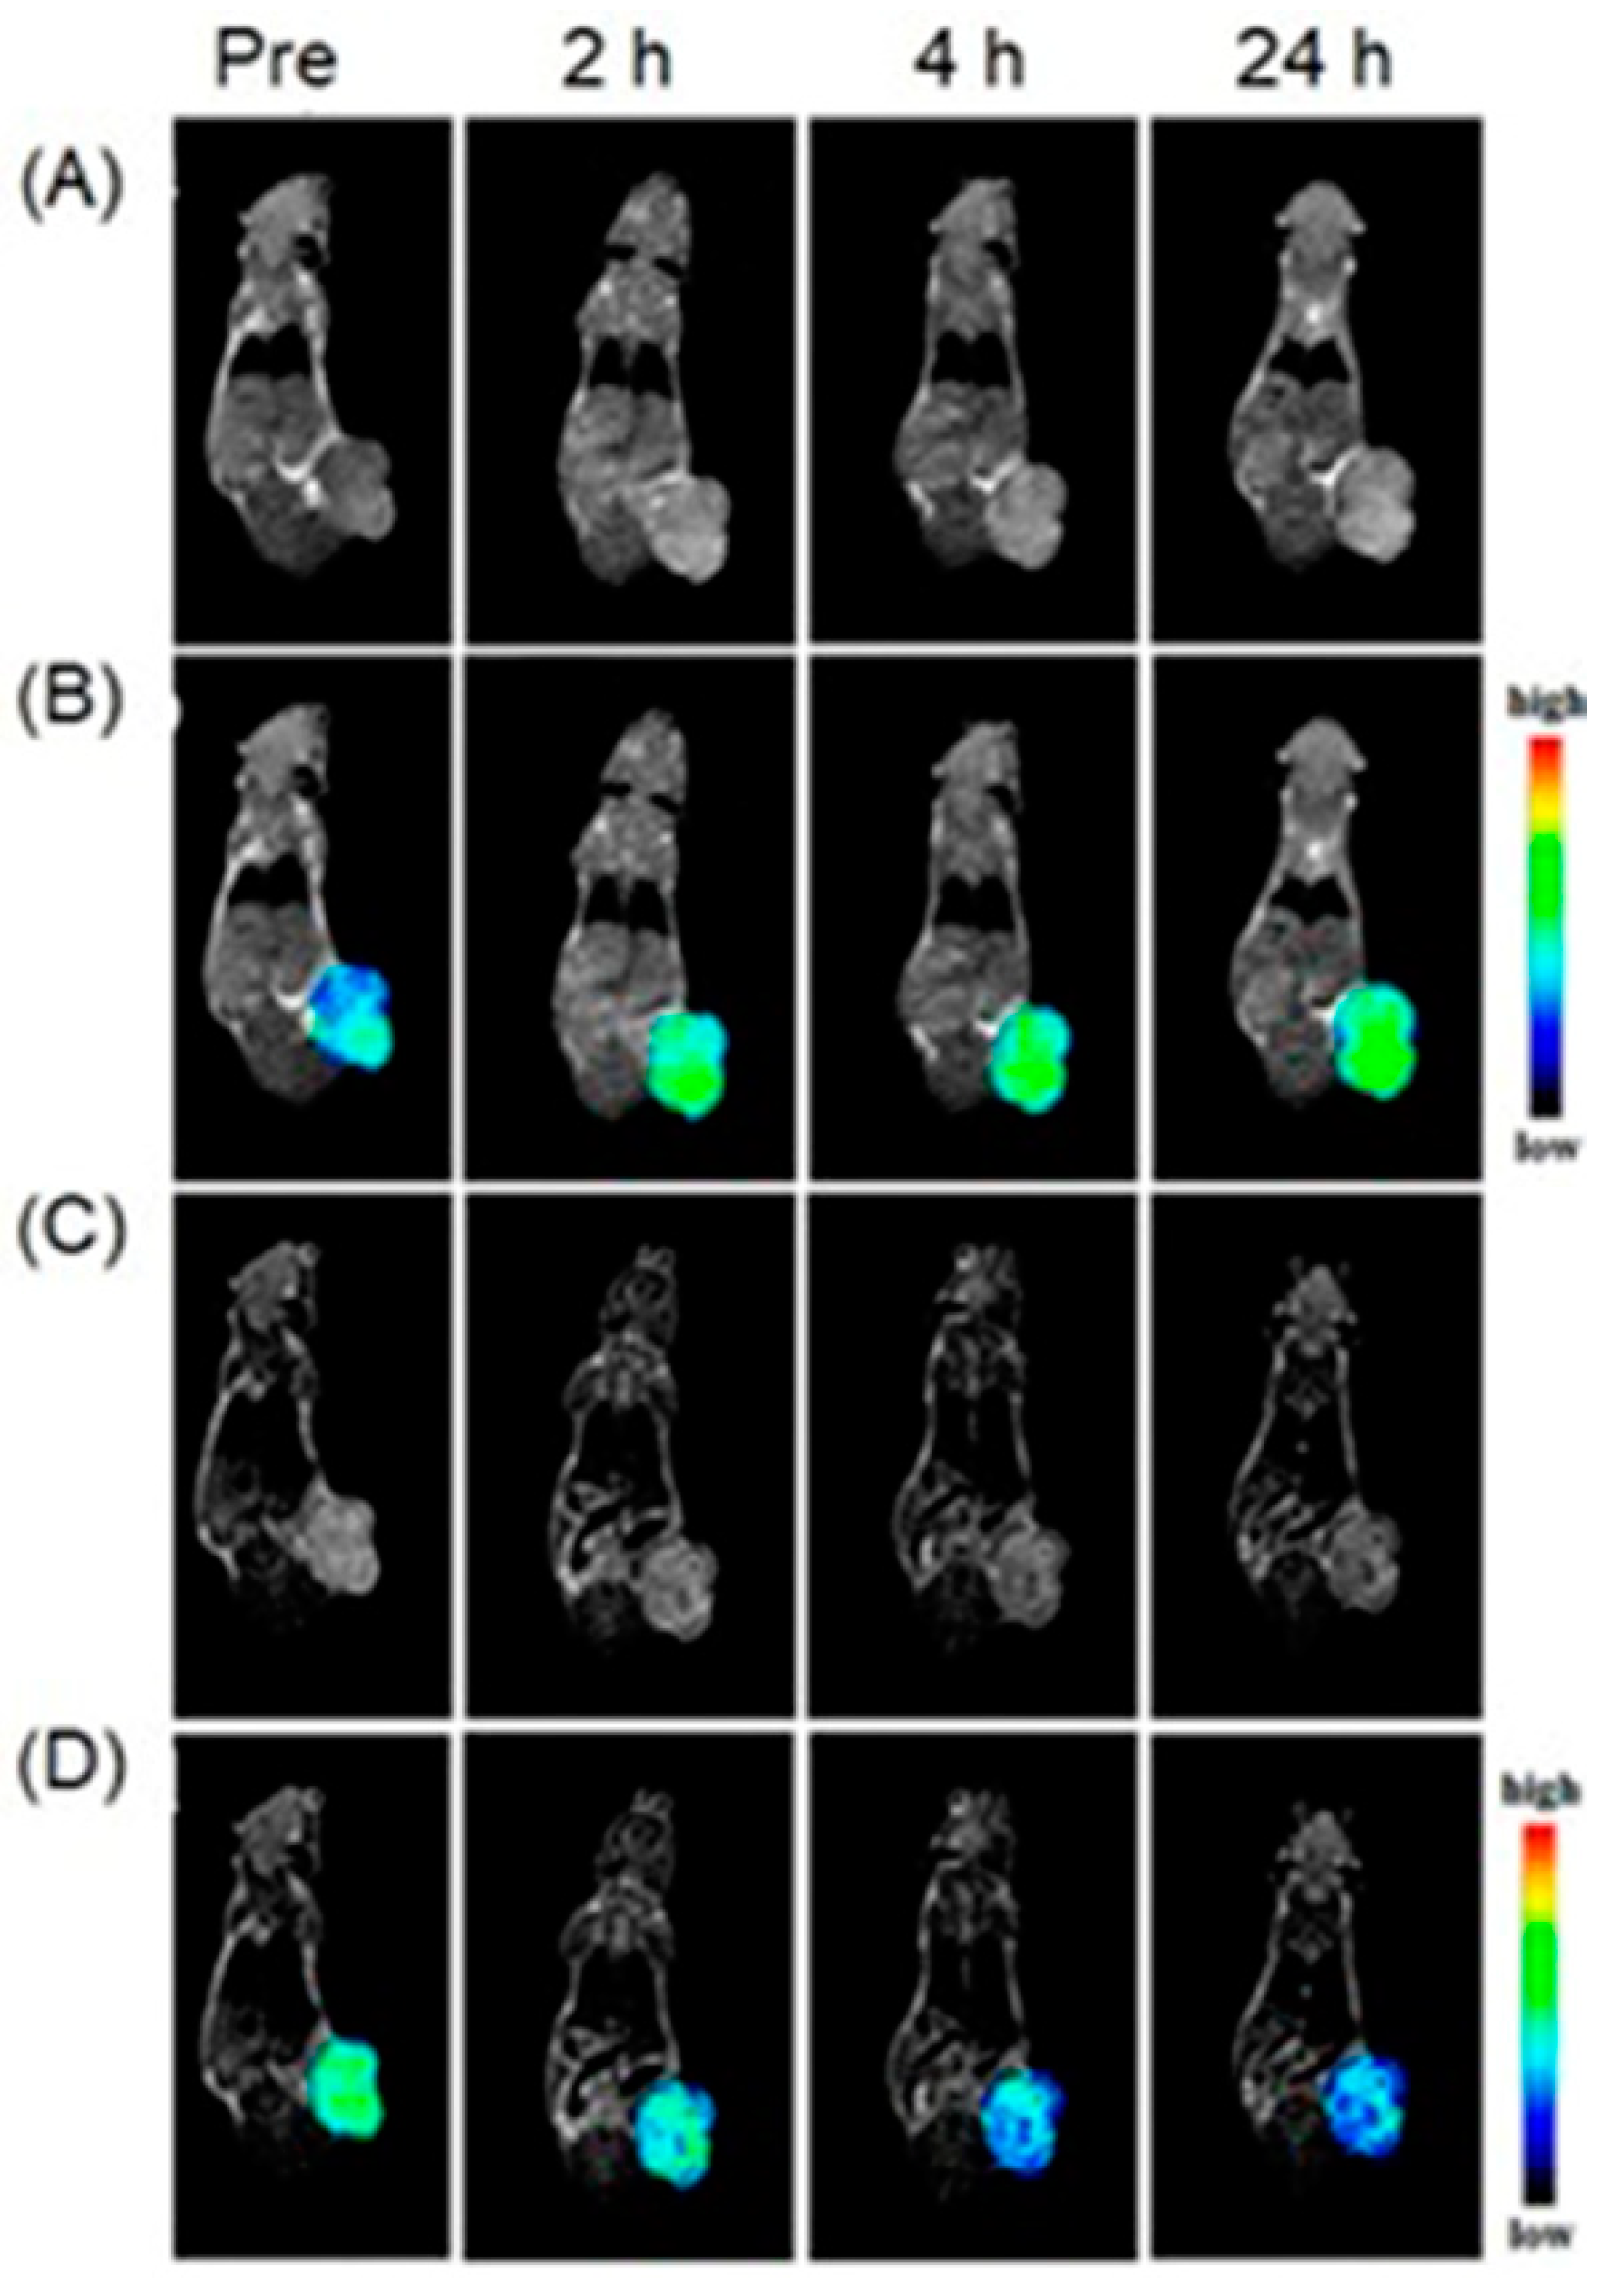
| Change | Chemicals Involved | Causes | Consequences |
|---|---|---|---|
| pH | Lactic acid, H+, CO2 | Partial degradation of glucose, imbalance in ion exchange between intra- and extra-cellular environment. | Tumor acidosis. |
| Reactive species | •OH, O2•−, H2O2, NOX, NO•, ONOO−, H2S | Partial cellular respiration. | Promote tumor growth. |
| Redox buffers | NADH, Glutathione, NADPH | Production of reactive oxygen species. | Promote tumor growth. |
| Inorganic ions | Ca2+, PO43−, ATP | Incomplete cellular respiration, production of reactive oxygen species. | Help survival of tumor cells. |
| Modality | Type of Information | Spatial Resolution (mm) | Penetration Depth | Probe/Agent Sensitivity | References |
|---|---|---|---|---|---|
| Optical | anatomical or tracer | 0.1–10 | <1 cm | 10−9–10−12 M | [119,120,121,122,123] |
| Ultrasound | anatomical or tracer | 0.01–0.1 | mm to cm | 10−12 M | [123,124] |
| SPECT 1 | tracer | 8–10 (clinical) 1–2 (preclinical) | unlimited | 10−10–10−11 M | [123,125] |
| X-ray CT 2 | anatomical or tracer | 0.5–1 (clinical) 0.05–0.2 (preclinical) | unlimited | not determined | [123,126,127] |
| PET 3 | tracer | 5–7 (clinical) 1–2 (preclinical) | unlimited | 10−11–10−12 M | [123,125] |
| MRI 4 | anatomical or tracer | ~1 (clinical) 0.025–0.1 (preclinical) | unlimited | 10−3–10−5 M | [123,128,129] |
| CRET 5 | tracer | mm | unlimited | 10−11–10−12 M | [123,125,130] |
| MPI 6 | tracer | 1 mm | unlimited | 10−9 M | [131,132] |
| EPRI 7 | tracer | µm | nm | 104 spins per voxel (~100 zmol) | [133] |
| MSI 8 | surface imaging | µm | mm to µm | ppm | [134] |
| SERS 9 | surface imaging | mm | ~5 mm | 10−12–10−15 M | [123] |
| Dual- or Multi-Modal Imaging Method | Advantages | Limitations |
|---|---|---|
| MRI and mass spectrometric imaging | Surface imaging with high spatial resolution | Invasive |
| Photoacoustic and ultrasound imaging | Sensitive soft tissue imaging, good depth penetration | photostability of chromophores |
| MRI and SPECT imaging | Deep tissue imaging, high spatial resolution | Exposure to ionizing radiation |
| MRI and X-ray CT imaging | Detailed anatomical imaging with high spatial resolution | Exposure to ionizing radiation |
| MRI and PET imaging | Anatomical and tracer imaging with high spatial resolution, deep tissue imaging | Exposure to ionizing radiation |
| PET and X-ray CT imaging | Tracer and anatomical imaging, highly sensitive | Exposure to ionizing radiation |
| SERS and photoacoustic imaging | Surface imaging, high sensitivity | Photostability |
| MRI, EPRI, and PET imaging | Detailed anatomical and tracer imaging | Exposure to ionizing radiation |
| X-ray CT, MRI, and photoacoustic imaging | Detailed anatomical and tracer imaging, sensitivity | Exposure to ionizing radiation |
| Fluorescence, photoacoustic imaging, and MRI | Detailed anatomical and tracer imaging, sensitivity | photostability of chromophores |
| Dual-Mode Imaging Method | Advantages | Limitations |
|---|---|---|
| Optical imaging and MRI | sensitivity, depth penetration, and spatial resolution | photostability of chromophores, contrast enhancement can be concentration-dependent |
| Fluorescence and colorimetric imaging | sensitivity, low cost | photostability of chromophores |
| SERS and fluorescence imaging | sensitivity, photostability | Invasive |
| SERS and colorimetric imaging | photostability, low cost | Invasive |
| Fluorescence and photoacoustic imaging | sensitivity, depth penetration, noninvasive | photostability of chromophores |
| Photoacoustic imaging and MRI | Noninvasive, sensitivity, resolution, and depth penetration | photostability of chromophores |
| T1- and T2-weighted MRI | Accuracy of information | Difficult designing probes that are both T1 and T2 active |
| 1H- and 19F-MRI | Anatomical and tracer information overcomes concentration dependency of probes | solubility of 19F-containing probes, sensitivity of 1H-MRI |
| T1-weighted MRI and CEST | Anatomical and functional information overcomes concentration dependency of probes | Time-consuming, low sensitivity of 1H-MRI |
Publisher’s Note: MDPI stays neutral with regard to jurisdictional claims in published maps and institutional affiliations. |
© 2022 by the authors. Licensee MDPI, Basel, Switzerland. This article is an open access article distributed under the terms and conditions of the Creative Commons Attribution (CC BY) license (https://creativecommons.org/licenses/by/4.0/).
Share and Cite
Subasinghe, S.A.A.S.; Pautler, R.G.; Samee, M.A.H.; Yustein, J.T.; Allen, M.J. Dual-Mode Tumor Imaging Using Probes That Are Responsive to Hypoxia-Induced Pathological Conditions. Biosensors 2022, 12, 478. https://doi.org/10.3390/bios12070478
Subasinghe SAAS, Pautler RG, Samee MAH, Yustein JT, Allen MJ. Dual-Mode Tumor Imaging Using Probes That Are Responsive to Hypoxia-Induced Pathological Conditions. Biosensors. 2022; 12(7):478. https://doi.org/10.3390/bios12070478
Chicago/Turabian StyleSubasinghe, S. A. Amali S., Robia G. Pautler, Md. Abul Hassan Samee, Jason T. Yustein, and Matthew J. Allen. 2022. "Dual-Mode Tumor Imaging Using Probes That Are Responsive to Hypoxia-Induced Pathological Conditions" Biosensors 12, no. 7: 478. https://doi.org/10.3390/bios12070478
APA StyleSubasinghe, S. A. A. S., Pautler, R. G., Samee, M. A. H., Yustein, J. T., & Allen, M. J. (2022). Dual-Mode Tumor Imaging Using Probes That Are Responsive to Hypoxia-Induced Pathological Conditions. Biosensors, 12(7), 478. https://doi.org/10.3390/bios12070478