1. Introduction
Falls and fall-related injuries adversely affect about one-third of the older population globally [
1]. To avoid a fall, it is vital to make prompt and proper postural adjustments to maintain or recover balance, i.e., keeping the center of body mass (CoM) within the base of support (BoS) [
2]. Reactive balance response, or compensatory postural adjustment (CPA), describes how human beings react to a sudden perturbation. It refers to the postural control and the activation of muscles after the central nervous system detects the balance perturbation [
3]. Throughout the pathway of motor output, an in-depth investigation of how the multiple lower-limb muscles and joints react rapidly to maintain standing balance is needed, which can facilitate our better understanding of the mechanisms underlying CPAs and the fall-prevention strategies.
CPAs can be rarely assessed in the subjective balance scales or questionnaires. Most of the clinical tests, e.g., the Berg Balance Scale (BBS), the Performance-Oriented Mobility Assessment (POMA), and the Short Physical Performance Battery (SPPB), evaluate only the anticipatory postural adjustments (APAs) by instructing clients to accomplish some predictable balance challenging tasks [
3]. An exception is the Mini Balance Evaluation Systems Test (Mini-BEST), which includes the CPA assessment items by suddenly putting the clients’ bodies in anterior, posterior, and lateral inclined postures [
4]. The CPAs have been more widely studied in a variety of laboratory equilibrium-disturbing or fall-simulation experiments, where the unexpected perturbations were exerted on different body parts (e.g., shoulder [
5], waist/pelvis [
6,
7,
8], foot [
9,
10]) to disturb the original postural stability in either static (e.g., perturbed quiet standing [
6,
8,
9,
10], suddenly tether-released inclined standing [
11]) or dynamic (e.g., induced slipping [
12] or tripping [
13,
14] during walking) states. These approaches make it possible to elicit the CPAs and evaluate the reactive balance capability in human beings.
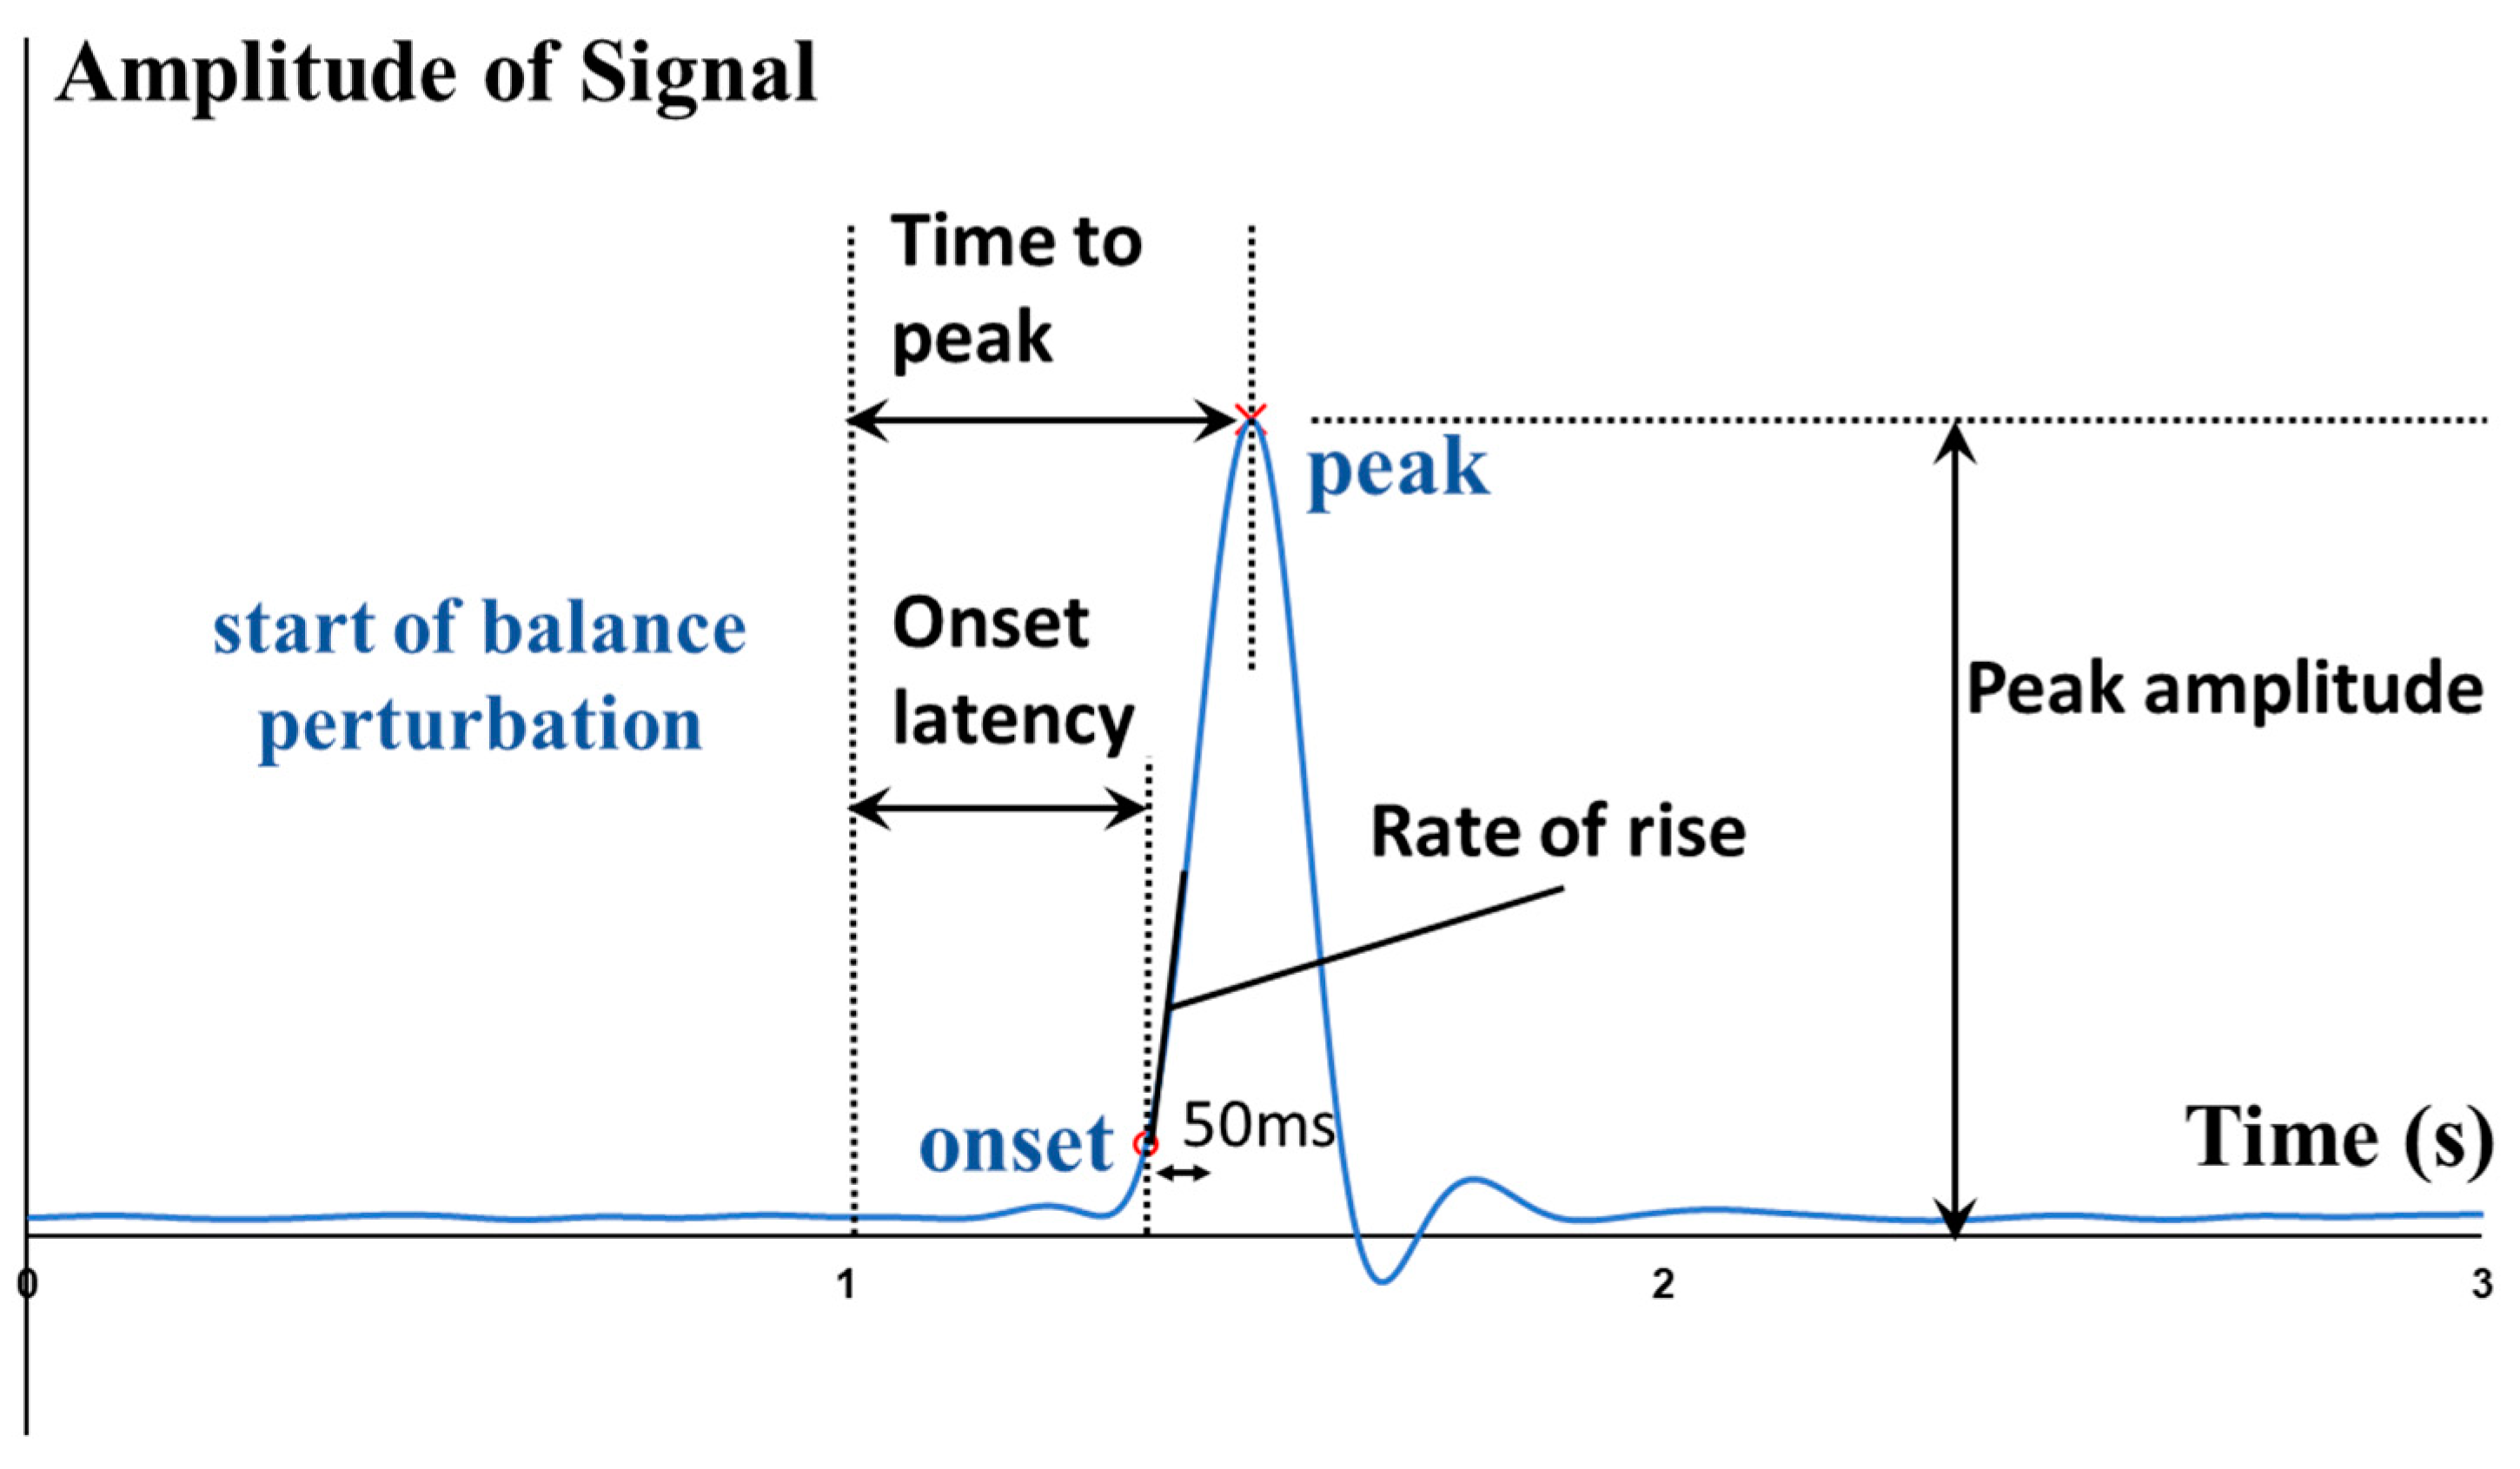
From externally to internally, the whole-body postural sways, the kinematics (e.g., angles) and kinetics (e.g., moments and power) of lower-limb joints, the contraction and activation patterns of lower-limb muscles can all affect how fast the CPAs are made. To quantitatively depict such rapid response, some parameters like the onset latency, the time to peak amplitude, and the rate of change were proposed.
Regarding the whole-body
postural sways, previous studies found that the center of pressure (CoP) had larger displacement than the CoM when responding to the unexpected balance perturbation [
5,
6,
15]. In this way, the CoM was kept within the BoS, and the standing balance could be maintained. In addition, the time to peak CoM displacement has been reported to vary following the different directions of unexpected platform movements [
10]. Regarding the lower-limb
joint angles, the onset latencies of hip, knee, and ankle joint motions were studied: (1) during standing, with perturbation induced by a forward-moving [
16] or backward-moving platform [
9] in the sagittal plane, and (2) during walking, with perturbation induced by waist-pulling [
7]. Regarding the lower-limb
joint kinetics, previous studies analyzed: (1) the joint moment responses in the sagittal plane following balance perturbations induced by a backward-moving platform [
9], (2) the hip and ankle moment responses [
6], and the hip power response [
8] in frontal plane following waist-pull perturbations. Pijnappels, et al. [
14] also reported a smaller rate of ankle plantarflexion, knee flexion, and hip extension moment development in the sagittal plane in the stance leg of participants who fell after the experimentally induced tripping. However, previous kinetic analyses have put limited focus on the temporal parameters. It remained unclear how fast the multiple lower-limb joint moments and power would react to unexpected standing perturbations. It is expected that we could have a better understanding of how the hip, knee and ankle joints coordinate to maintain standing balance following perturbations, upon studying the exact time when various lower-limb joints begin to react and reach peaks. Further studies are needed.
Regarding the lower-limb
muscle electrical activities, previous studies have investigated the muscle’s EMG onset latencies [
9,
16,
17,
18,
19] and the time to peak of EMG amplitude [
17,
18,
19], following unexpected standing balance perturbations induced by a moving platform. Pijnappels, et al. [
13] found that compared to young people, older people showed increased onset latency and decreased rate of EMG rise in the dorsal muscles of the stance leg after unexpected tripping during walking. Previous studies also reported the age-related reduction in the hip abductors/adductors’ rate of EMG rise following unexpected standing balance perturbation induced by the mediolateral waist-pulling [
8]. However, most of these studies have only investigated the ankle/knee muscles’ EMG signals; and very limited previous studies have concurrently evaluated the rapid responses of hip abductor/adductors, hip flexor/extensor, knee flexor/extensor, and ankle dorsiflexor/plantarflexor. It is expected that studying multiple lower-limb muscles’ reactions and activation patterns could help further uncover the underlying mechanism of CPAs. In addition to EMG, mechanomyography (MMG) is another technology that can measure the lateral vibration and
mechanical activities of skeletal muscles [
20]. The onset latencies of EMG, MMG and joint moment signals may enable a more detailed characterization of the motor output pathway, and provide insights on whether the slower balance response is more attributed to the delayed neuromuscular activation, the delayed onset of muscle contraction, or the slower force propagation from muscle to tendon [
21]. Thus, MMG may serve as an additional tool to characterize the rapid responses of muscle contractile properties, and merits further studies.
Humans react differently to the varying magnitudes of unexpected balance perturbations. With the increasing perturbation magnitudes, larger lower-limb joint responses and larger amplitudes of muscle activities would be evoked to maintain standing balance [
9]. The larger perturbation magnitude could even alter the EMG onset sequence of lower-limb muscles from distal-to-proximal to proximal-to-distal activation [
22], and change the pattern of postural adjustment from the “ankle strategy” to the “hip strategy”, “mixed ankle and hip strategy” or “stepping strategy” [
23,
24]. However, previous studies have mostly reported the effects of different balance perturbations on the choice of responding strategies. It is still unclear whether the faster lower-limb responses are required to resolve a larger balance perturbation, which warrants further investigation.
To fill the above-mentioned research gaps, this study aimed to comprehensively investigate and uncover the more in-depth underlying mechanisms of maintaining standing balance, by investigating how the multiple lower-limb muscles and joints react rapidly following balance perturbations. It would answer the research questions of: (1) how do the onset latencies and the time to peak of the hip, knee, and ankle joints’ kinetic and kinematic data respond to the different magnitudes of waist-pull perturbation in sagittal and frontal planes; and (2) how do the onset latencies, the time to peak and the rate of rise of eight lower-limb muscles’ EMG and MMG data respond to the different magnitudes of waist-pull perturbation in sagittal and frontal planes. It was hypothesized that both the temporal parameters and the rate of change would be different across the eight lower-limb motions (hip abduction/adduction, hip flexion/extension, knee flexion/extension, and ankle dorsiflexion/plantarflexion), across the eight lower-limb muscles (hip abductor/adductor, hip flexor/extensor, knee flexor/extensor, and ankle dorsiflexor/plantarflexor), and across the three different perturbation magnitudes (small, medium, and large).
3. Results
A total of 12 healthy young adults (age: 20.9 ± 0.7 years; gender: 6 males and 6 females; height: 169.9 ± 6.9 cm; weight: 58.3 ± 6.2 kg) participated in this study (
Table 2). No fall or other adverse events occurred during experiments, and participants all reported that the harness system did not restrict their movements. As shown in
Table 3, the ICC values demonstrated good test-retest reliability of the pulling duration, displacement, and velocity of the waist-pull system in this study. The mean and standard error values across the 12 participants are presented in the figures to illustrate the signal changes (i.e., CoM, CoP, angle, moment, power, EMG or MMG) following perturbations. The range and the standard values across the 12 participants are presented in the
Table S1 of Supplementary Materials.
Under the small perturbations, all participants were observed to be able to keep their feet in place. Under the medium perturbations, the stepping of the dominant leg occurred once following the posterior pulls (1 out of totally 36 pulls; 1/36), the elevation of the dominant leg occurred following the medial pulls (1/36), and the elevation of nondominant leg occurred following the lateral pulls (1/36). Under the large perturbations, the stepping or elevation of the dominant leg occurred in one participant following the anterior pulls (3/36), in two participants following the posterior pulls (2/36), in seven participants following the medial pulls (15/36), and in two participants following lateral pulls (3/36); the stepping or elevation of nondominant leg occurred in one participant following the posterior pulls (1/36), in three participants following the medial pulls (8/36), and in five participants following lateral pulls (10/36).
3.1. Whole-Body CoM and CoP Displacement
As shown in
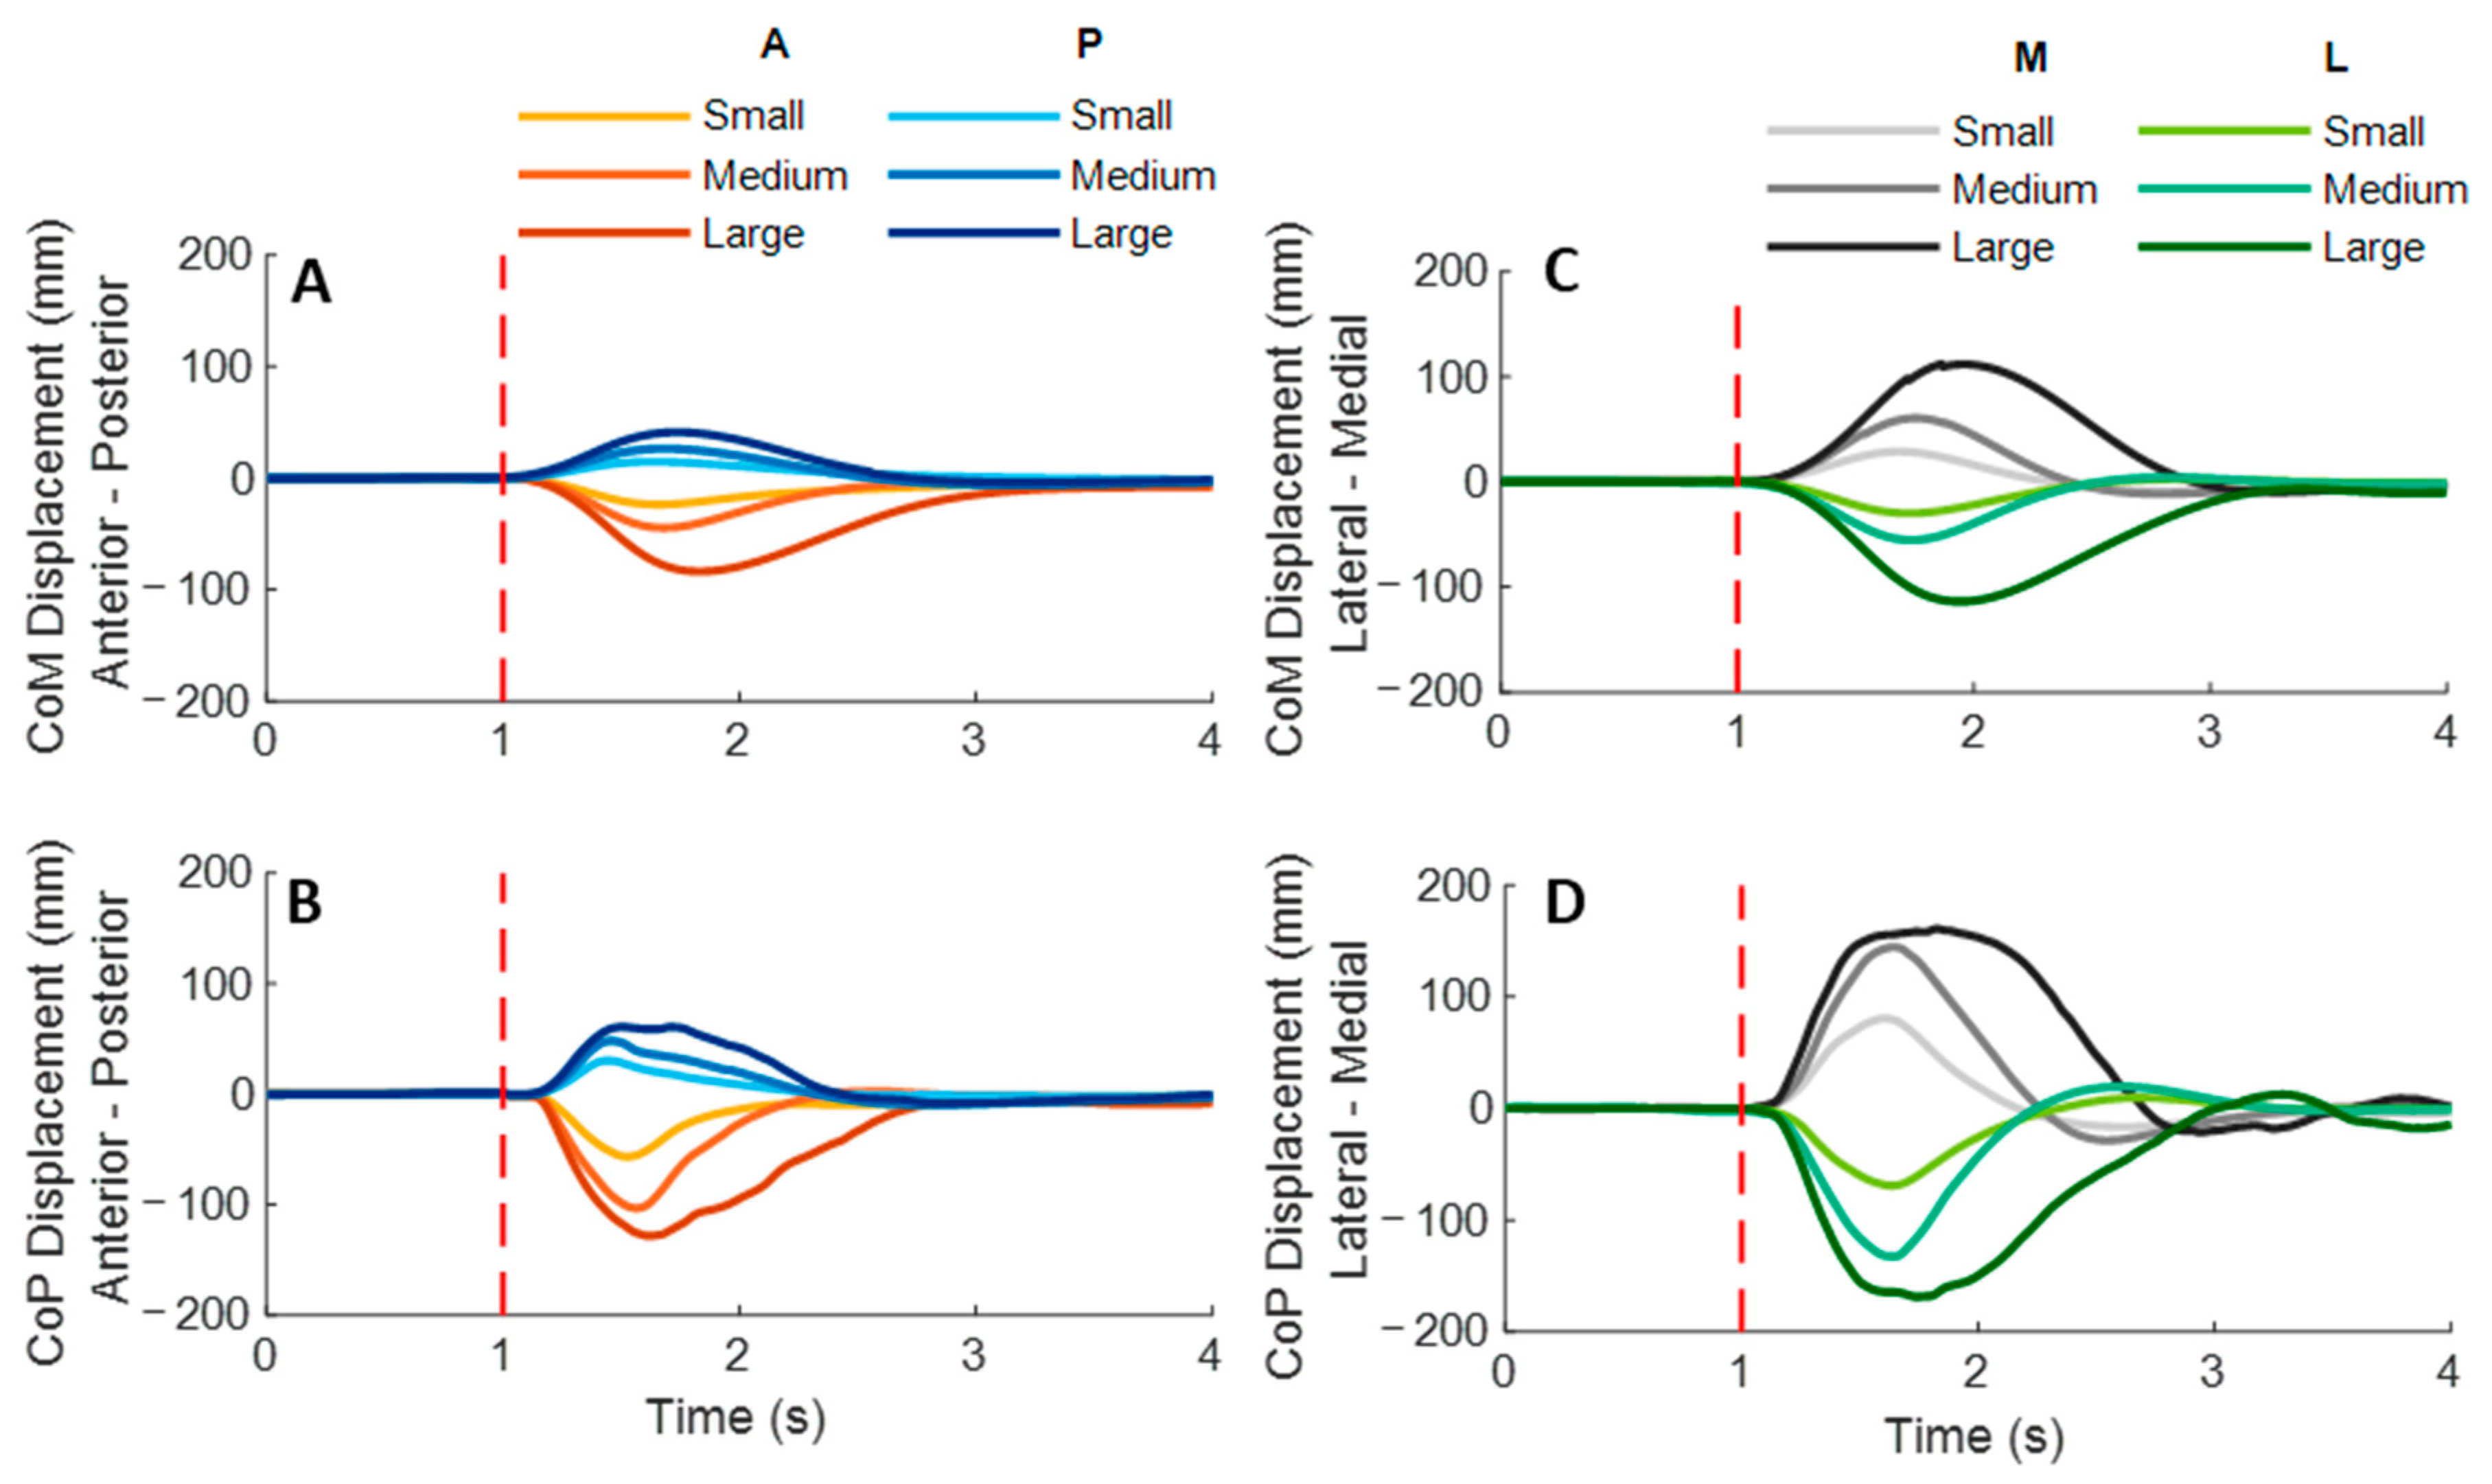
Figure 3, the whole-body CoM and CoP displacements mainly moved toward the direction of waist-pull perturbation. As shown in
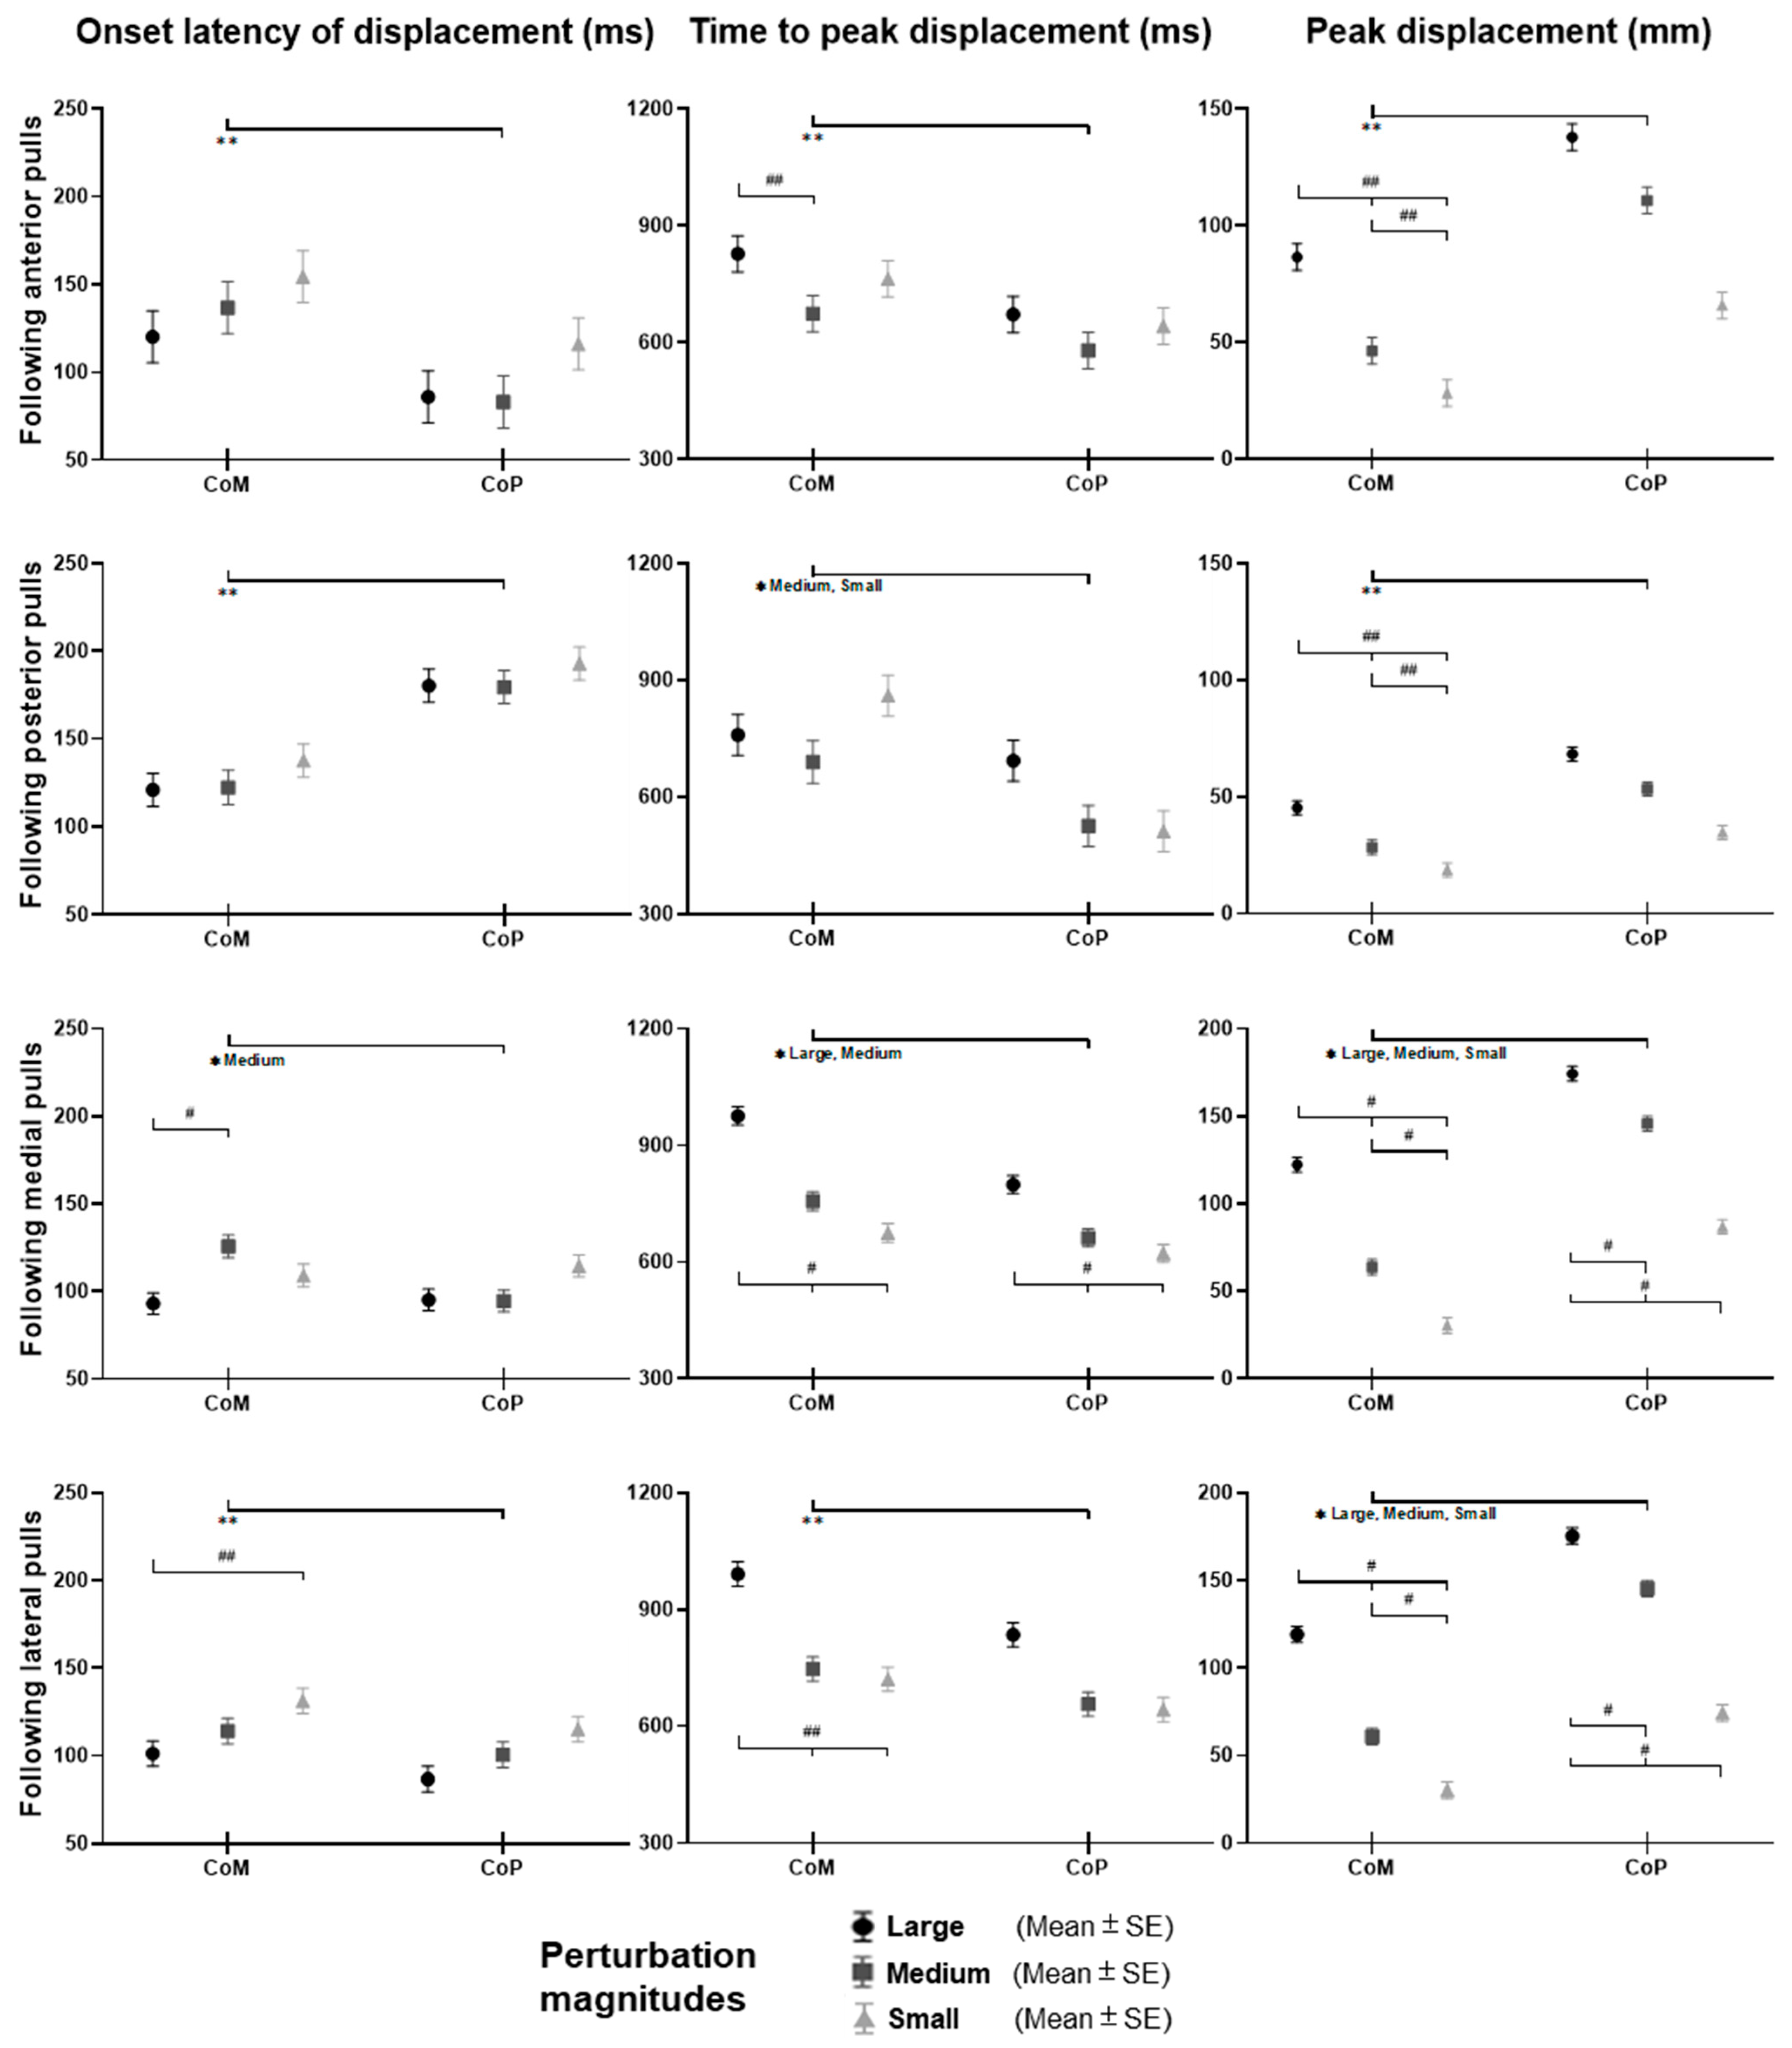
Figure 4, following the unexpected
anterior perturbations, CoP showed significantly shorter onset latency of displacement, shorter time to peak displacement, and larger peak displacement than CoM (
p < 0.05). The larger perturbation magnitudes evoked significantly longer time to peak displacement and larger peak displacements (
p < 0.05).
Following the unexpected posterior perturbations, CoP showed significantly shorter onset latency, shorter time to peak displacement under the medium and the small magnitudes, and larger peak displacement than CoM (p < 0.05). The larger perturbation magnitudes evoked significantly larger peak displacements (p < 0.05).
Following the unexpected medial perturbations, CoP showed significantly shorter onset latency of displacement under the medium magnitude, shorter time to peak displacement under the large and the medium magnitudes, and larger peak displacement than CoM (p < 0.05). The larger perturbation magnitudes evoked significantly shorter onset latency of CoM displacement, longer time to peak displacement, and larger peak displacements (p < 0.05).
Following the unexpected lateral perturbations, CoP showed significantly shorter onset latency, shorter time to peak displacement, and larger peak displacement than CoM (p < 0.05). The larger perturbation magnitudes evoked significantly shorter onset latency of displacement, longer time to peak displacement, and larger peak displacements (p < 0.05).
Figure 3.
The mean whole-body CoM and CoP displacements of twelve participants following the unexpected anterior, posterior, medial, and lateral perturbations with three magnitudes (n = 12). Mean CoM (A) and CoP (B) displacements following anterior and posterior perturbations; Mean CoM (C) and CoP (D) displacements following medial and lateral perturbations. (Note: The red dotted line indicated the start of pulling perturbation. CoM: center of mass; CoP: center of pressure. A: anterior; P: posterior; M: medial; L: lateral).
Figure 4.
The onset latency of displacement, time to peak displacement, and peak displacement of whole-body CoM and CoP following unexpected horizontal perturbations (mean ± SE,
n = 12). (Note:
CoM: center of mass;
CoP: center of pressure;
SE: standard error;
![Biosensors 12 00430 i001]()
or
![Biosensors 12 00430 i002]()
: pairwise comparison. Significant differences in post hoc pairwise comparisons (
p < 0.05) were indicated by the:
** for the main effect of postural sway factor;
* for the simple main effect of postural sway factor;
## for the main effect of magnitude factor;
# for the simple main effect of magnitude factor).
3.2. Lower-Limb Joint Angles and Joint Power
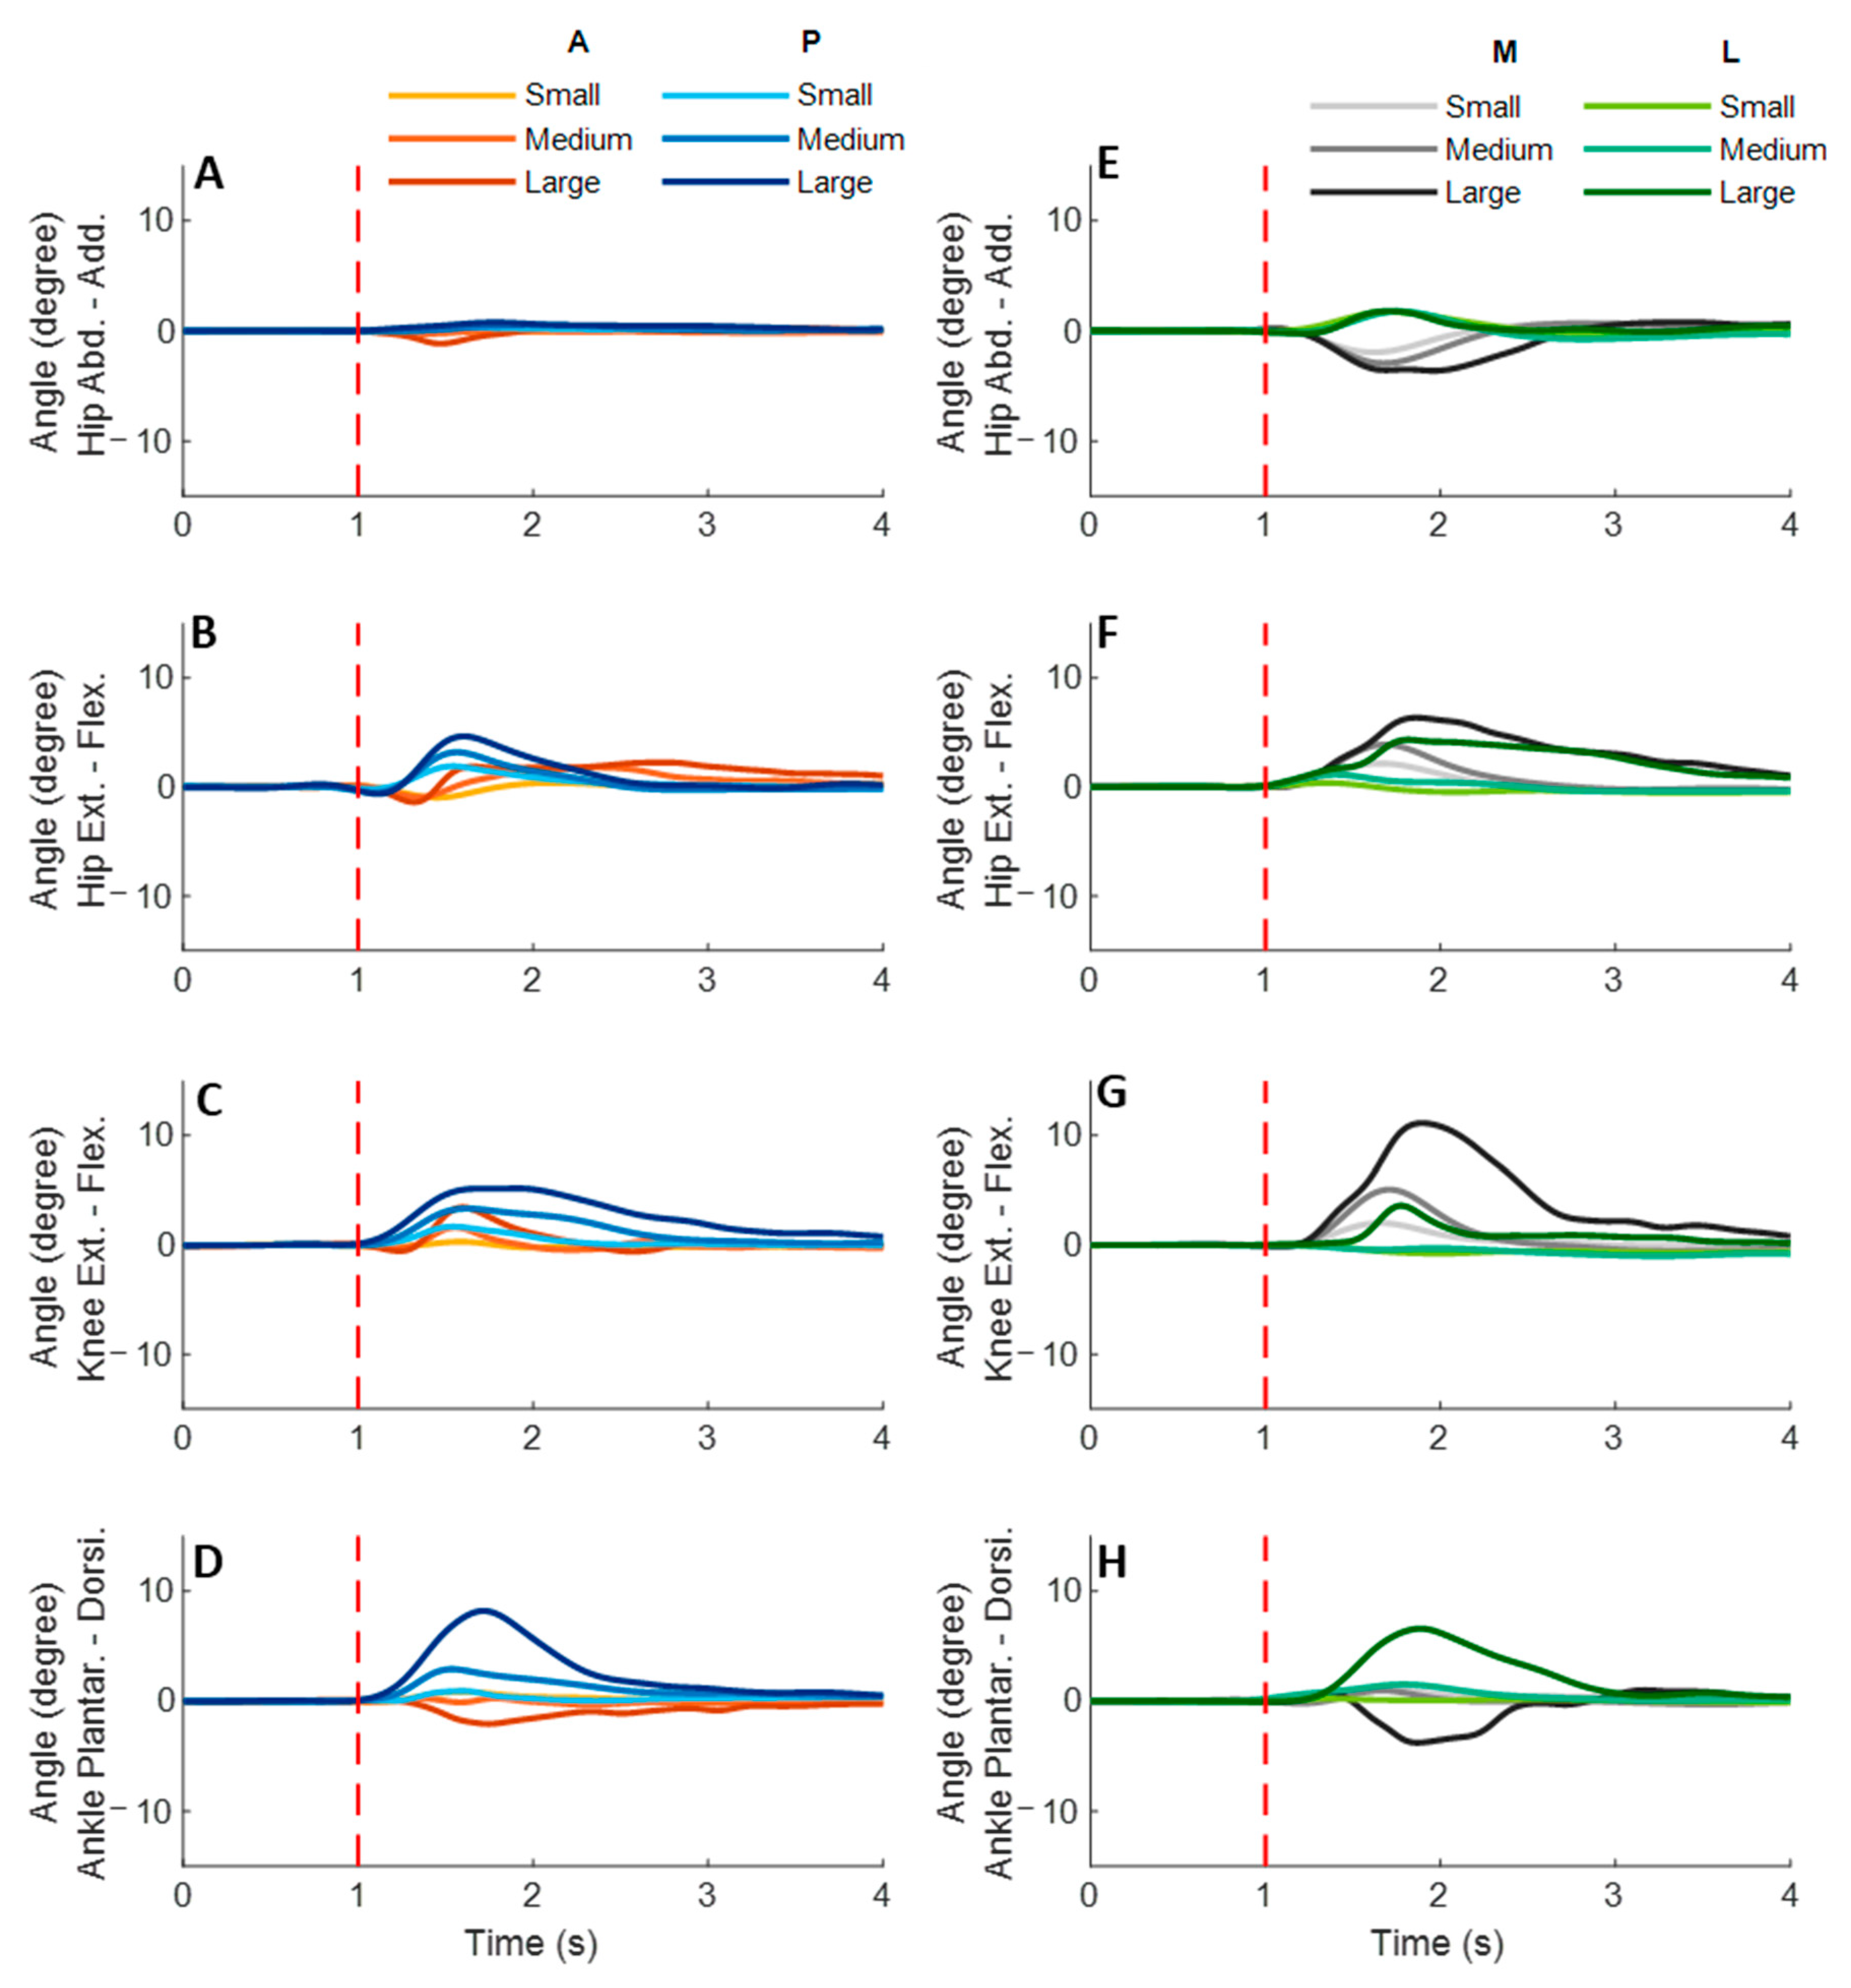
Figure 5 shows the dominant-leg joint angle changes following the unexpected waist-pull perturbations. As shown in
Figure 6, following the unexpected
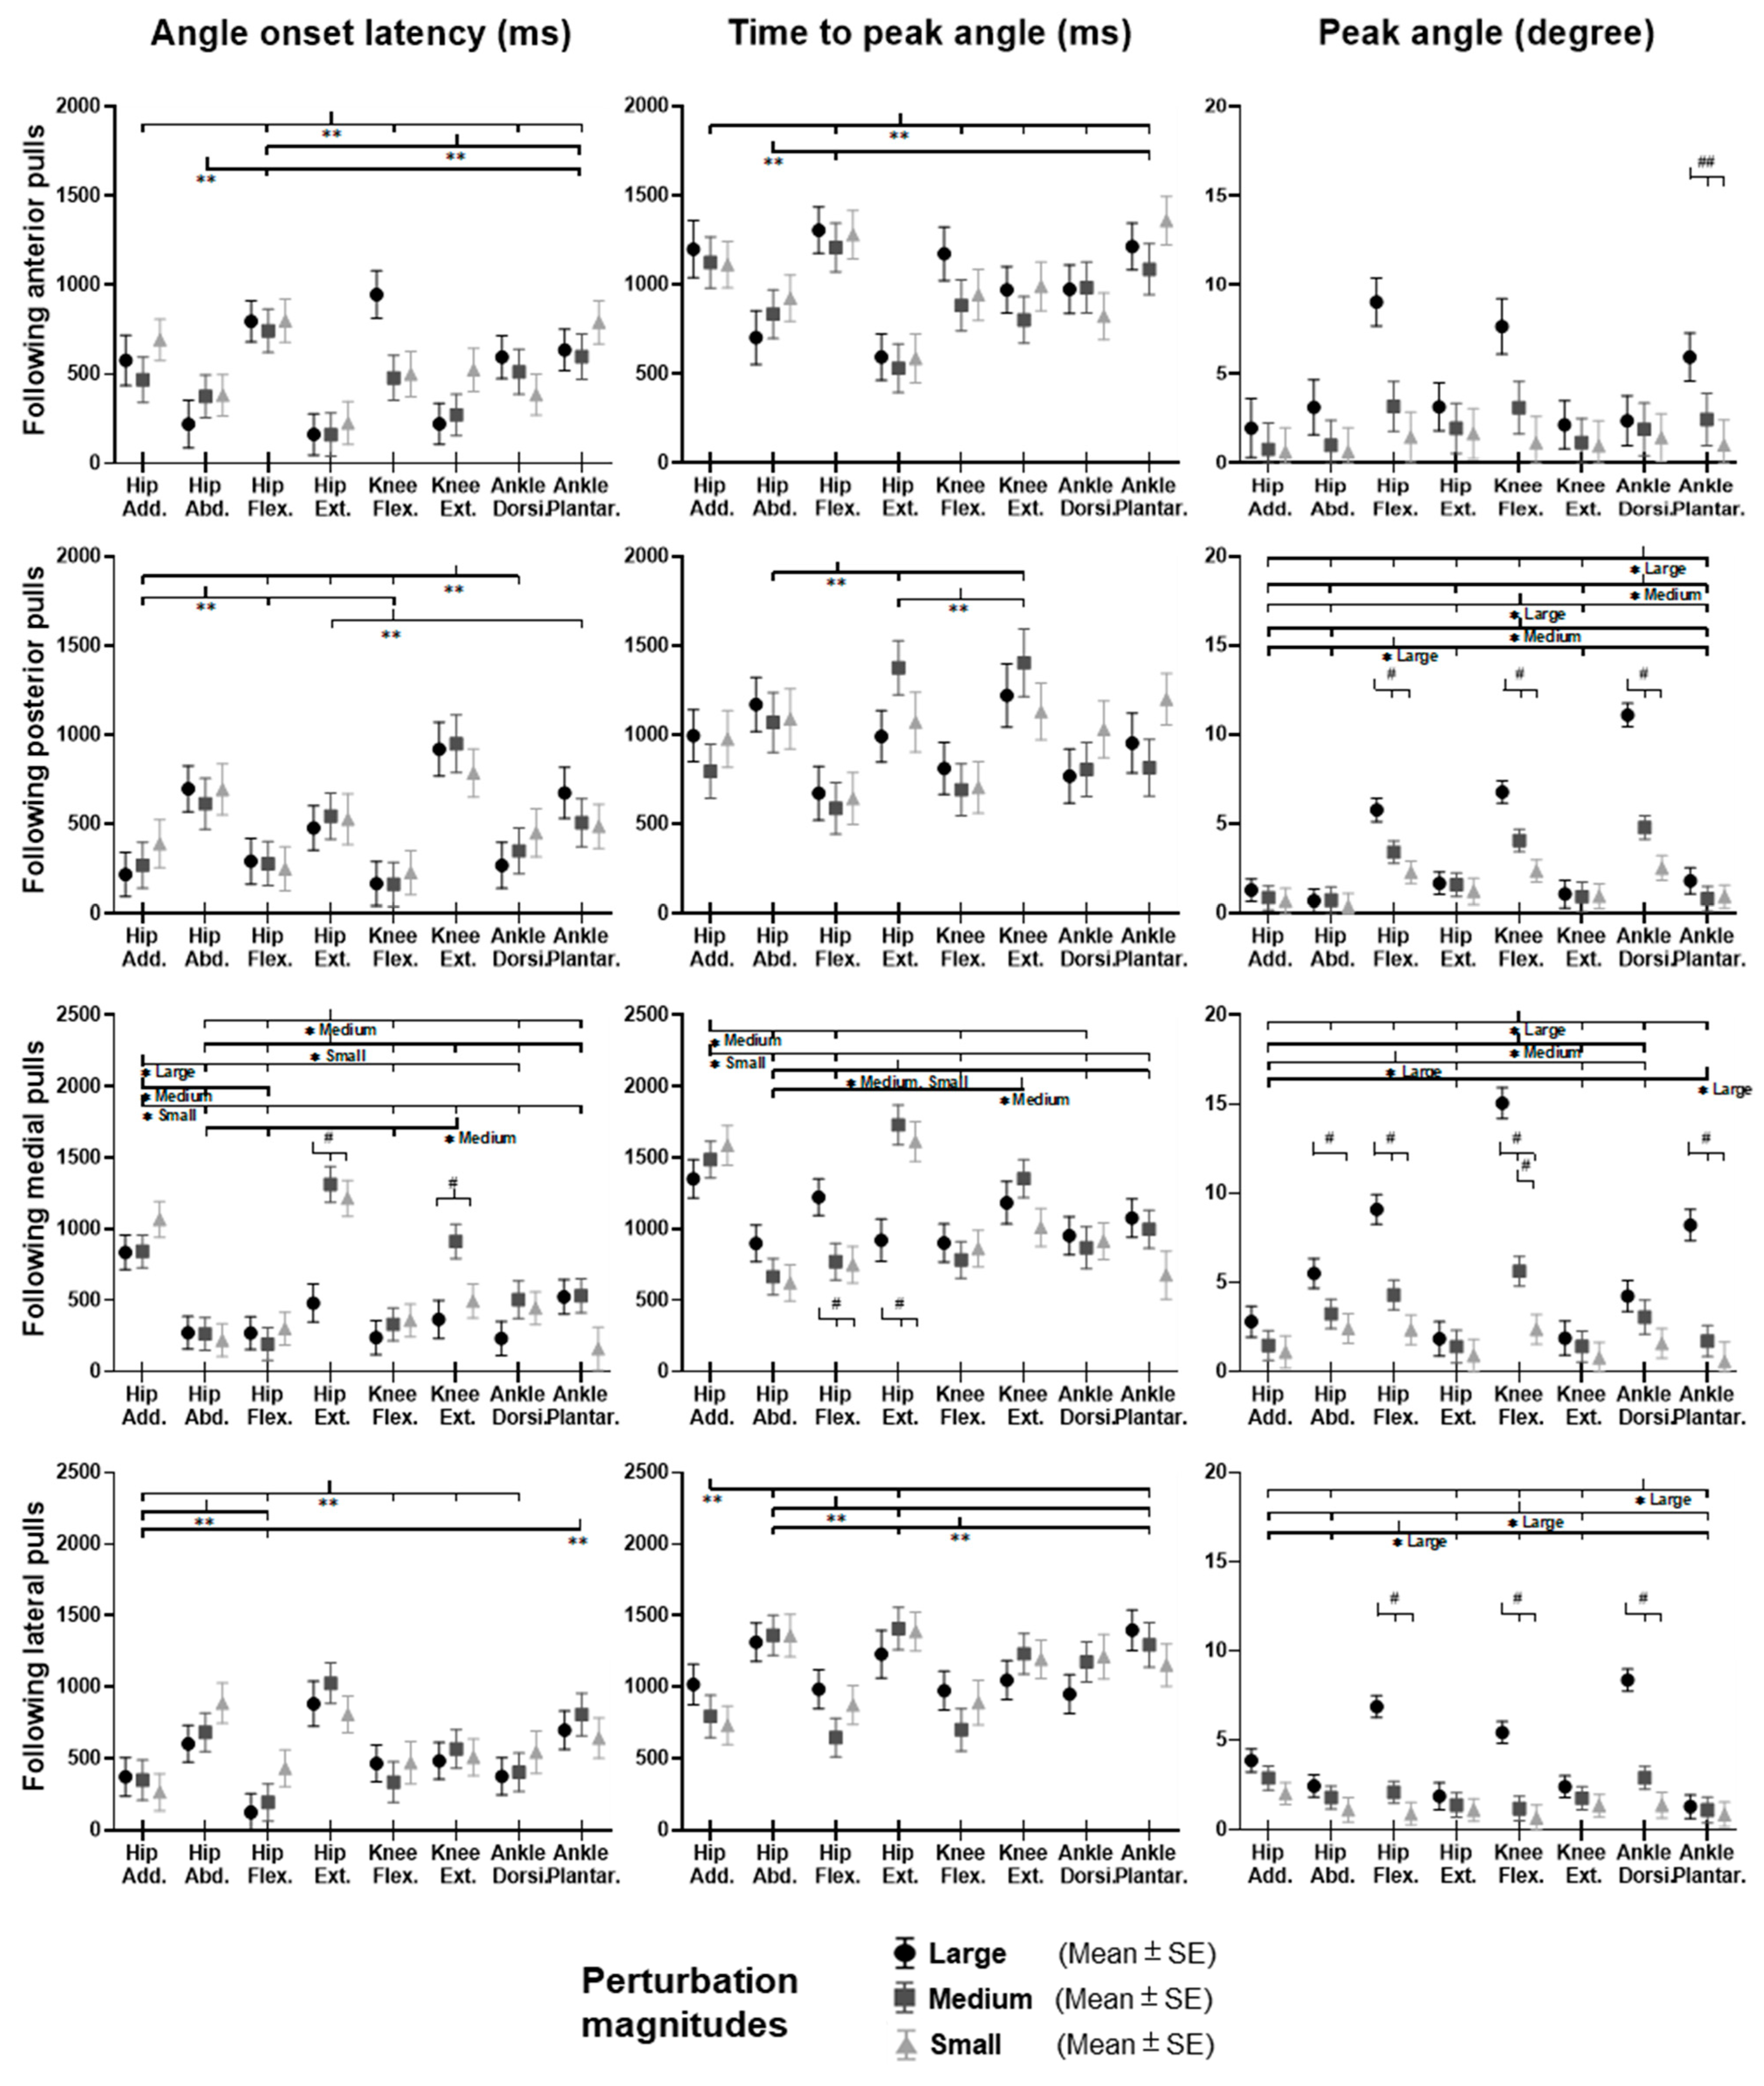
anterior perturbations, the hip extension angle showed significantly shorter onset latency and time to peak angle than the hip flexion angle (
p < 0.05). Peak angles were not significantly different among the eight joint motions. The larger perturbation magnitudes evoked significantly larger peak angles (
p < 0.05).
Following the unexpected posterior perturbations, significant within-joint differences were observed in the angle onset latency (knee flexion < extension; hip adduction < abduction; p < 0.05) and the time to peak angle (knee flexion < extension; hip flexion < extension; p < 0.05). The larger perturbation magnitudes evoked significantly larger peak angles in ankle dorsiflexion, knee flexion, and hip flexion (p < 0.05). Under the large magnitude, peak angles of these three joint motions were significantly larger than the other five joint motions (p < 0.05).
Following the unexpected medial perturbations, the hip abduction angle showed significantly shorter onset latency than the hip adduction angle irrespective of perturbation magnitudes (p < 0.05). Under the medium and the small magnitudes, significant within-joint differences were observed in the angle onset latency (hip flexion < extension; p < 0.05) and the time to peak angle (hip abduction < adduction; hip flexion < extension; p < 0.05). Under the medium magnitude, the knee flexion angle showed significantly shorter onset latency than the knee extension angle (p < 0.05). The larger perturbation magnitudes evoked significantly larger peak angles in ankle plantarflexion, knee flexion, hip flexion, and hip abduction (p < 0.05).
Following the unexpected lateral perturbations, significant within-joint differences were observed in the angle onset latency (hip flexion < extension; hip adduction < abduction; p < 0.05) and the time to peak angle (hip flexion < extension; hip adduction < abduction; p < 0.05). Under the large magnitude, peak angles of ankle dorsiflexion, knee flexion, and hip flexion were significantly larger than the other five joint motions (p < 0.05).
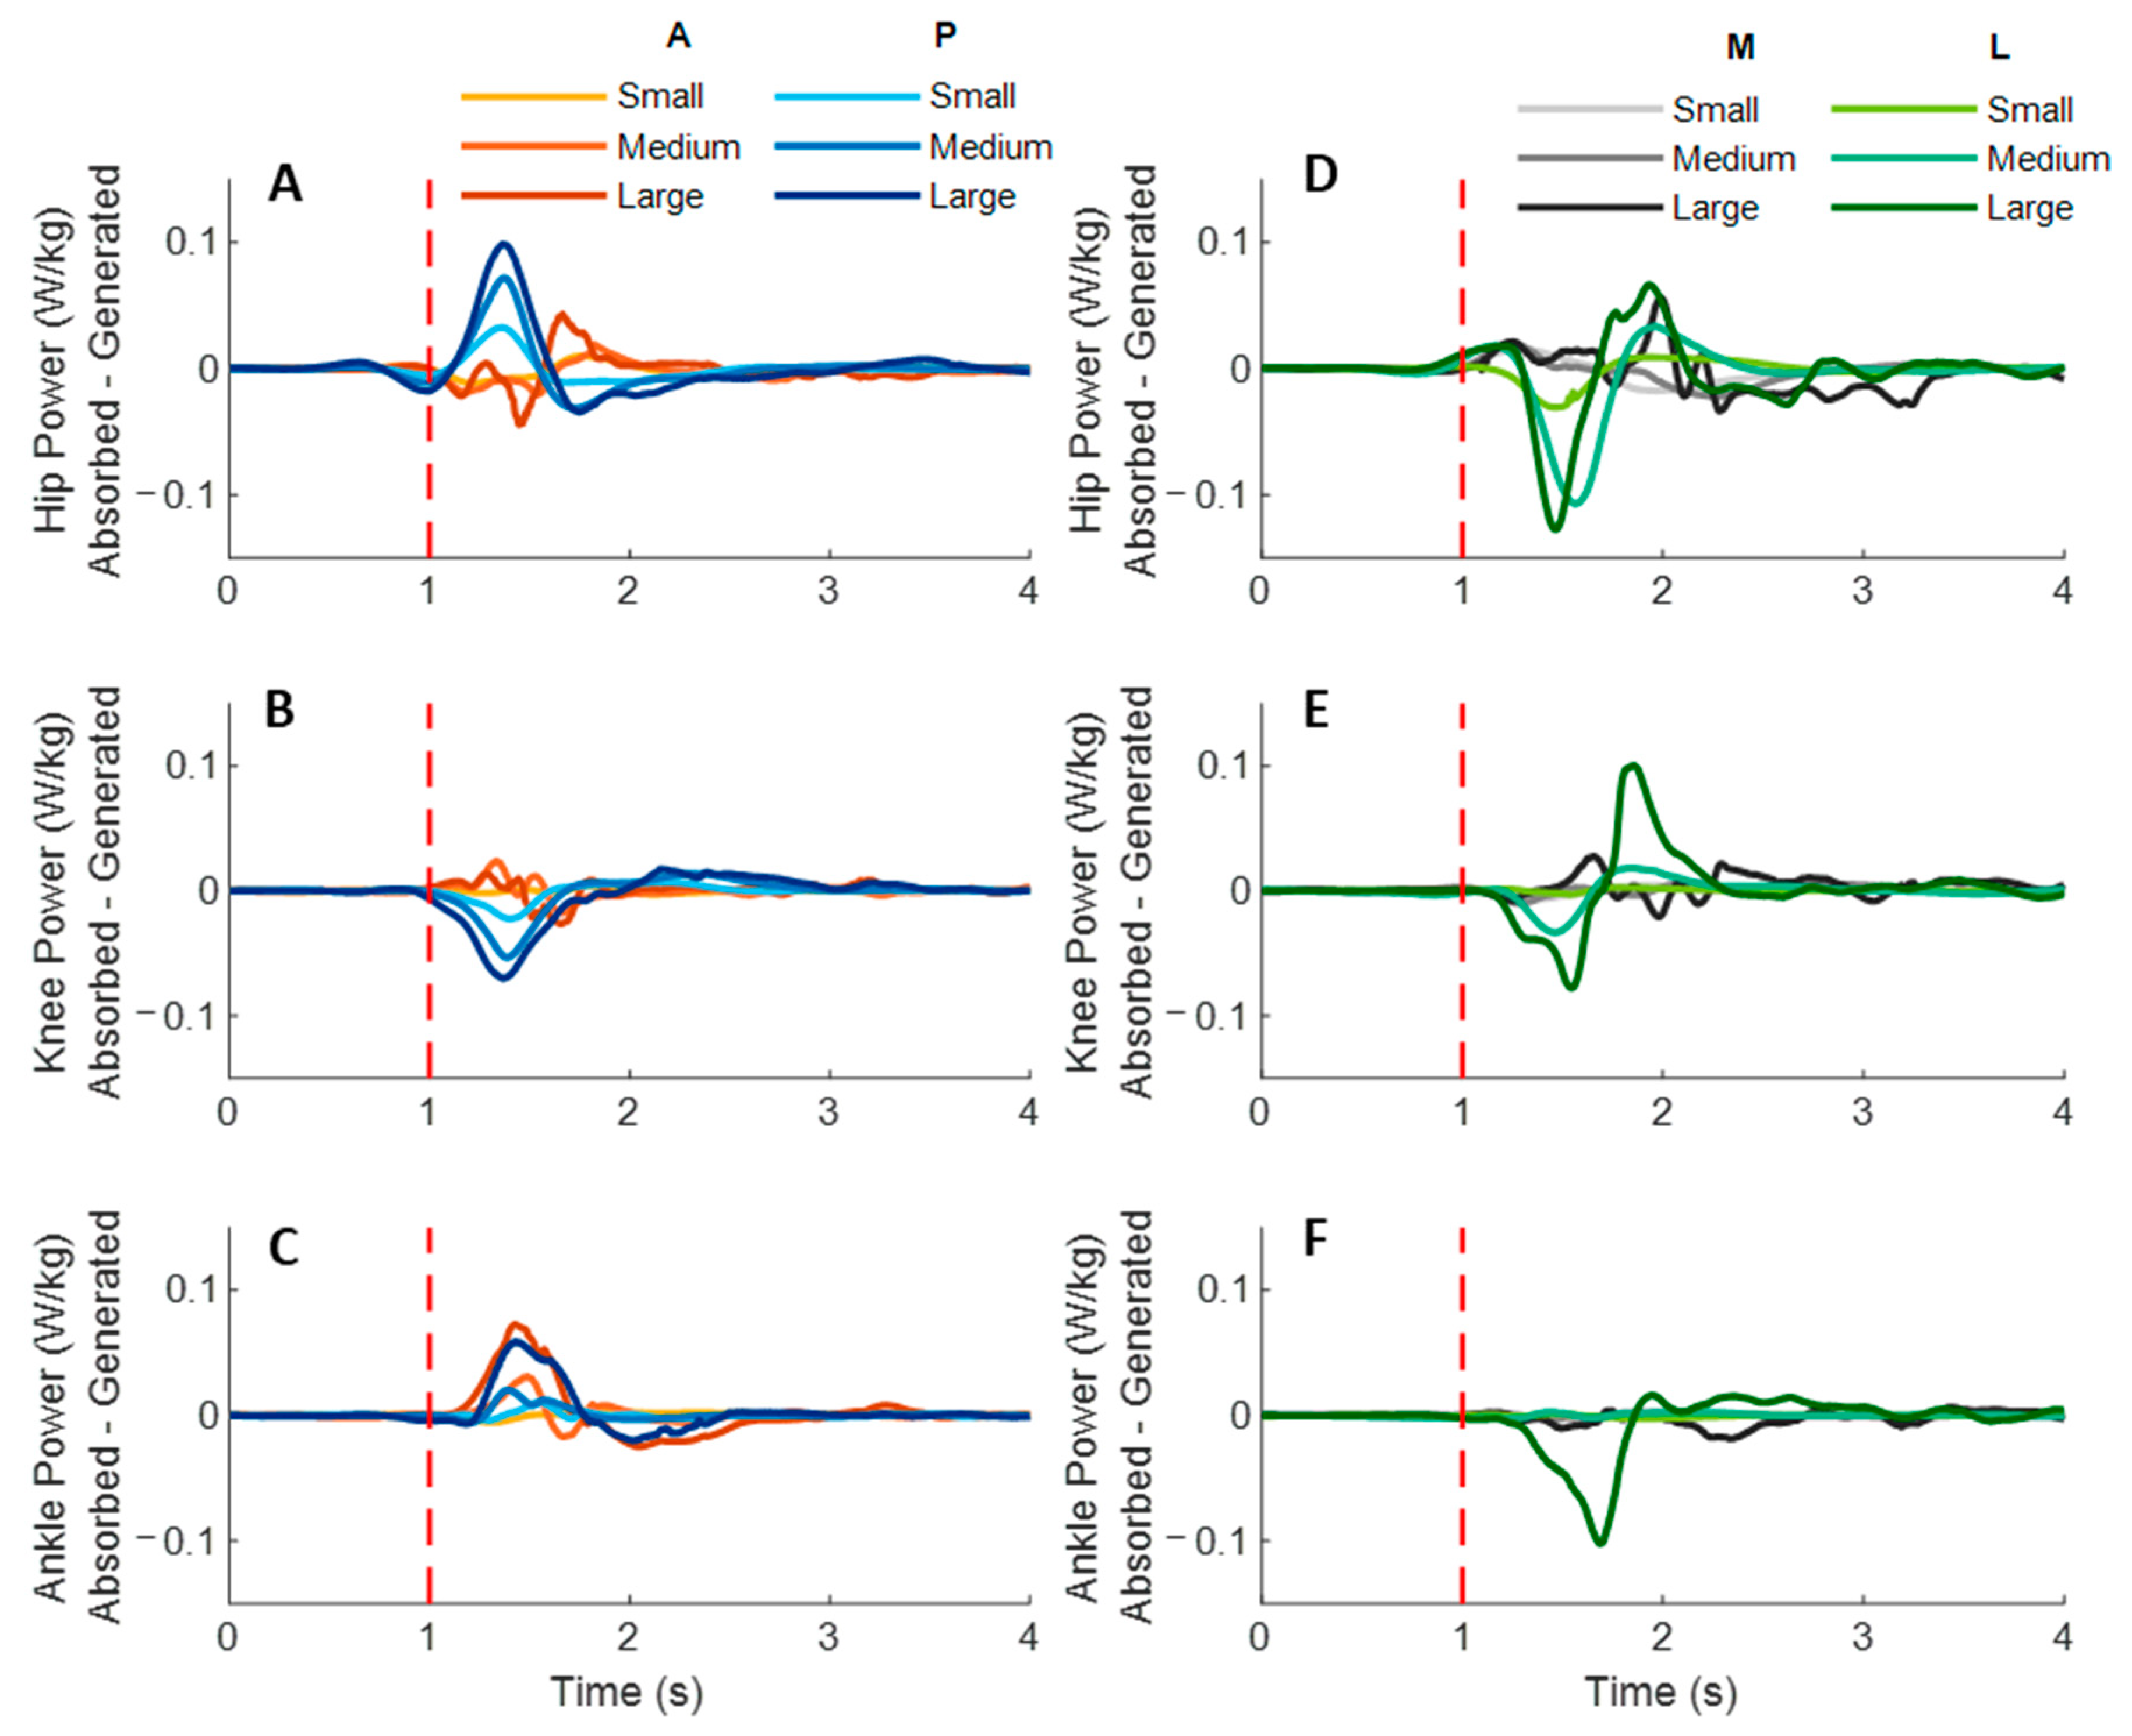
Figure 7 shows the dominant-leg joint power changes following the unexpected waist-pull perturbations. As shown in
Figure 8, following the unexpected
anterior perturbations, significant within-joint differences existed in the power onset latency (hip power absorption < generation;
p < 0.05) and the time to peak power (hip power absorption < generation; knee power generation < absorption;
p < 0.05). Peak power responses in the hip, knee, and ankle joints were not significantly different. The larger perturbation magnitudes evoked significantly larger peak power responses (
p < 0.05).
Following the unexpected posterior perturbations, significant within-joint differences existed in the power onset latency (hip power generation < absorption; knee power absorption < generation; p < 0.05) and the time to peak power (hip power generation < absorption; knee power absorption < generation; p < 0.05). Peak power generated in the hip joint was significantly larger than the absorbed (p < 0.05). The larger perturbation magnitudes evoked significantly larger peak power responses (p < 0.05).
Figure 5.
The mean dominant-leg joint angle changes of twelve participants following the unexpected anterior, posterior, medial, and lateral perturbations with three magnitudes (n = 12). Mean hip adduction-abduction (A), hip flexion-extension (B), knee flexion-extension (C), and ankle dorsiflexion-plantarflexion (D) angle changes following anterior and posterior perturbations; Mean hip adduction-abduction (E), hip flexion-extension (F), knee flexion-extension (G), and ankle dorsiflexion-plantarflexion (H) angle changes following medial and lateral perturbations. (Note: The red dotted line indicated the start of pulling perturbation. Add.: adduction; Abd.: abduction; Flex.: flexion; Ext.: extension; Dorsi.: dorsiflexion; Plantar.: plantarflexion. A: anterior; P: posterior; M: medial; L: lateral).
Figure 6.
The angle onset latencies, time to peak angle, and peak angles of eight lower-limb joint motions following unexpected horizontal perturbations (mean ± SE,
n = 12). (Note:
SE: standard error;
![Biosensors 12 00430 i001]()
or
![Biosensors 12 00430 i002]()
: pairwise comparison. Significant differences in post hoc pairwise comparisons (
p < 0.05) were indicated by the:
** for the main effect of joint motion factor;
* for the simple main effect of joint motion factor;
## for the main effect of magnitude factor;
# for the simple main effect of magnitude factor).
Following the unexpected medial perturbations, significant within-joint differences were observed in the power onset latency (hip power generation < absorption; knee power absorption < generation; p < 0.05). Hip power generation showed the shortest time to peak among the six lower-limb joint power responses (p < 0.05). Peak power responses in the hip, knee, and ankle joints were not significantly different. Generally, the larger perturbation magnitudes evoked significantly shorter power onset latency, longer time to peak power, and larger peak power (p < 0.05).
Following the unexpected lateral perturbations, significant within-joint differences in power onset latency were observed under the small (hip power absorption < generation; p < 0.05) and the large magnitudes (ankle power absorption < generation; p < 0.05). Knee power absorption showed a significantly shorter time to peak than a generation (p < 0.05). Peak power absorbed in the hip joint was significantly larger than the peak power responses in knee and ankle joints (p < 0.05). The larger perturbation magnitudes evoked significantly larger peak power responses (p < 0.05).
Figure 7.
The mean dominant-leg joint power changes of twelve participants following the unexpected anterior, posterior, medial, and lateral perturbations with three magnitudes (n = 12). Mean hip (A), knee (B), and ankle (C) power generation and absorption following anterior and posterior perturbations; Mean hip (D), knee (E), and ankle (F) power generation and absorption following medial and lateral perturbations. (Note: The red dotted line indicated the start of pulling perturbation. A: anterior; P: posterior; M: medial; L: lateral).
Figure 8.
The power onset latencies, time to peak power, and peak power responses in lower-limb joints following unexpected horizontal perturbations (mean ± SE,
n = 12). (Note:
Gener.: power generation;
Absorp.: power absorption;
SE: standard error;
![Biosensors 12 00430 i001]()
or
![Biosensors 12 00430 i002]()
: pairwise comparison. Significant differences in post hoc pairwise comparisons (
p < 0.05) were indicated by the:
** for the main effect of joint motion factor;
* for the simple main effect of joint motion factor;
## for the main effect of magnitude factor;
# for the simple main effect of magnitude factor).
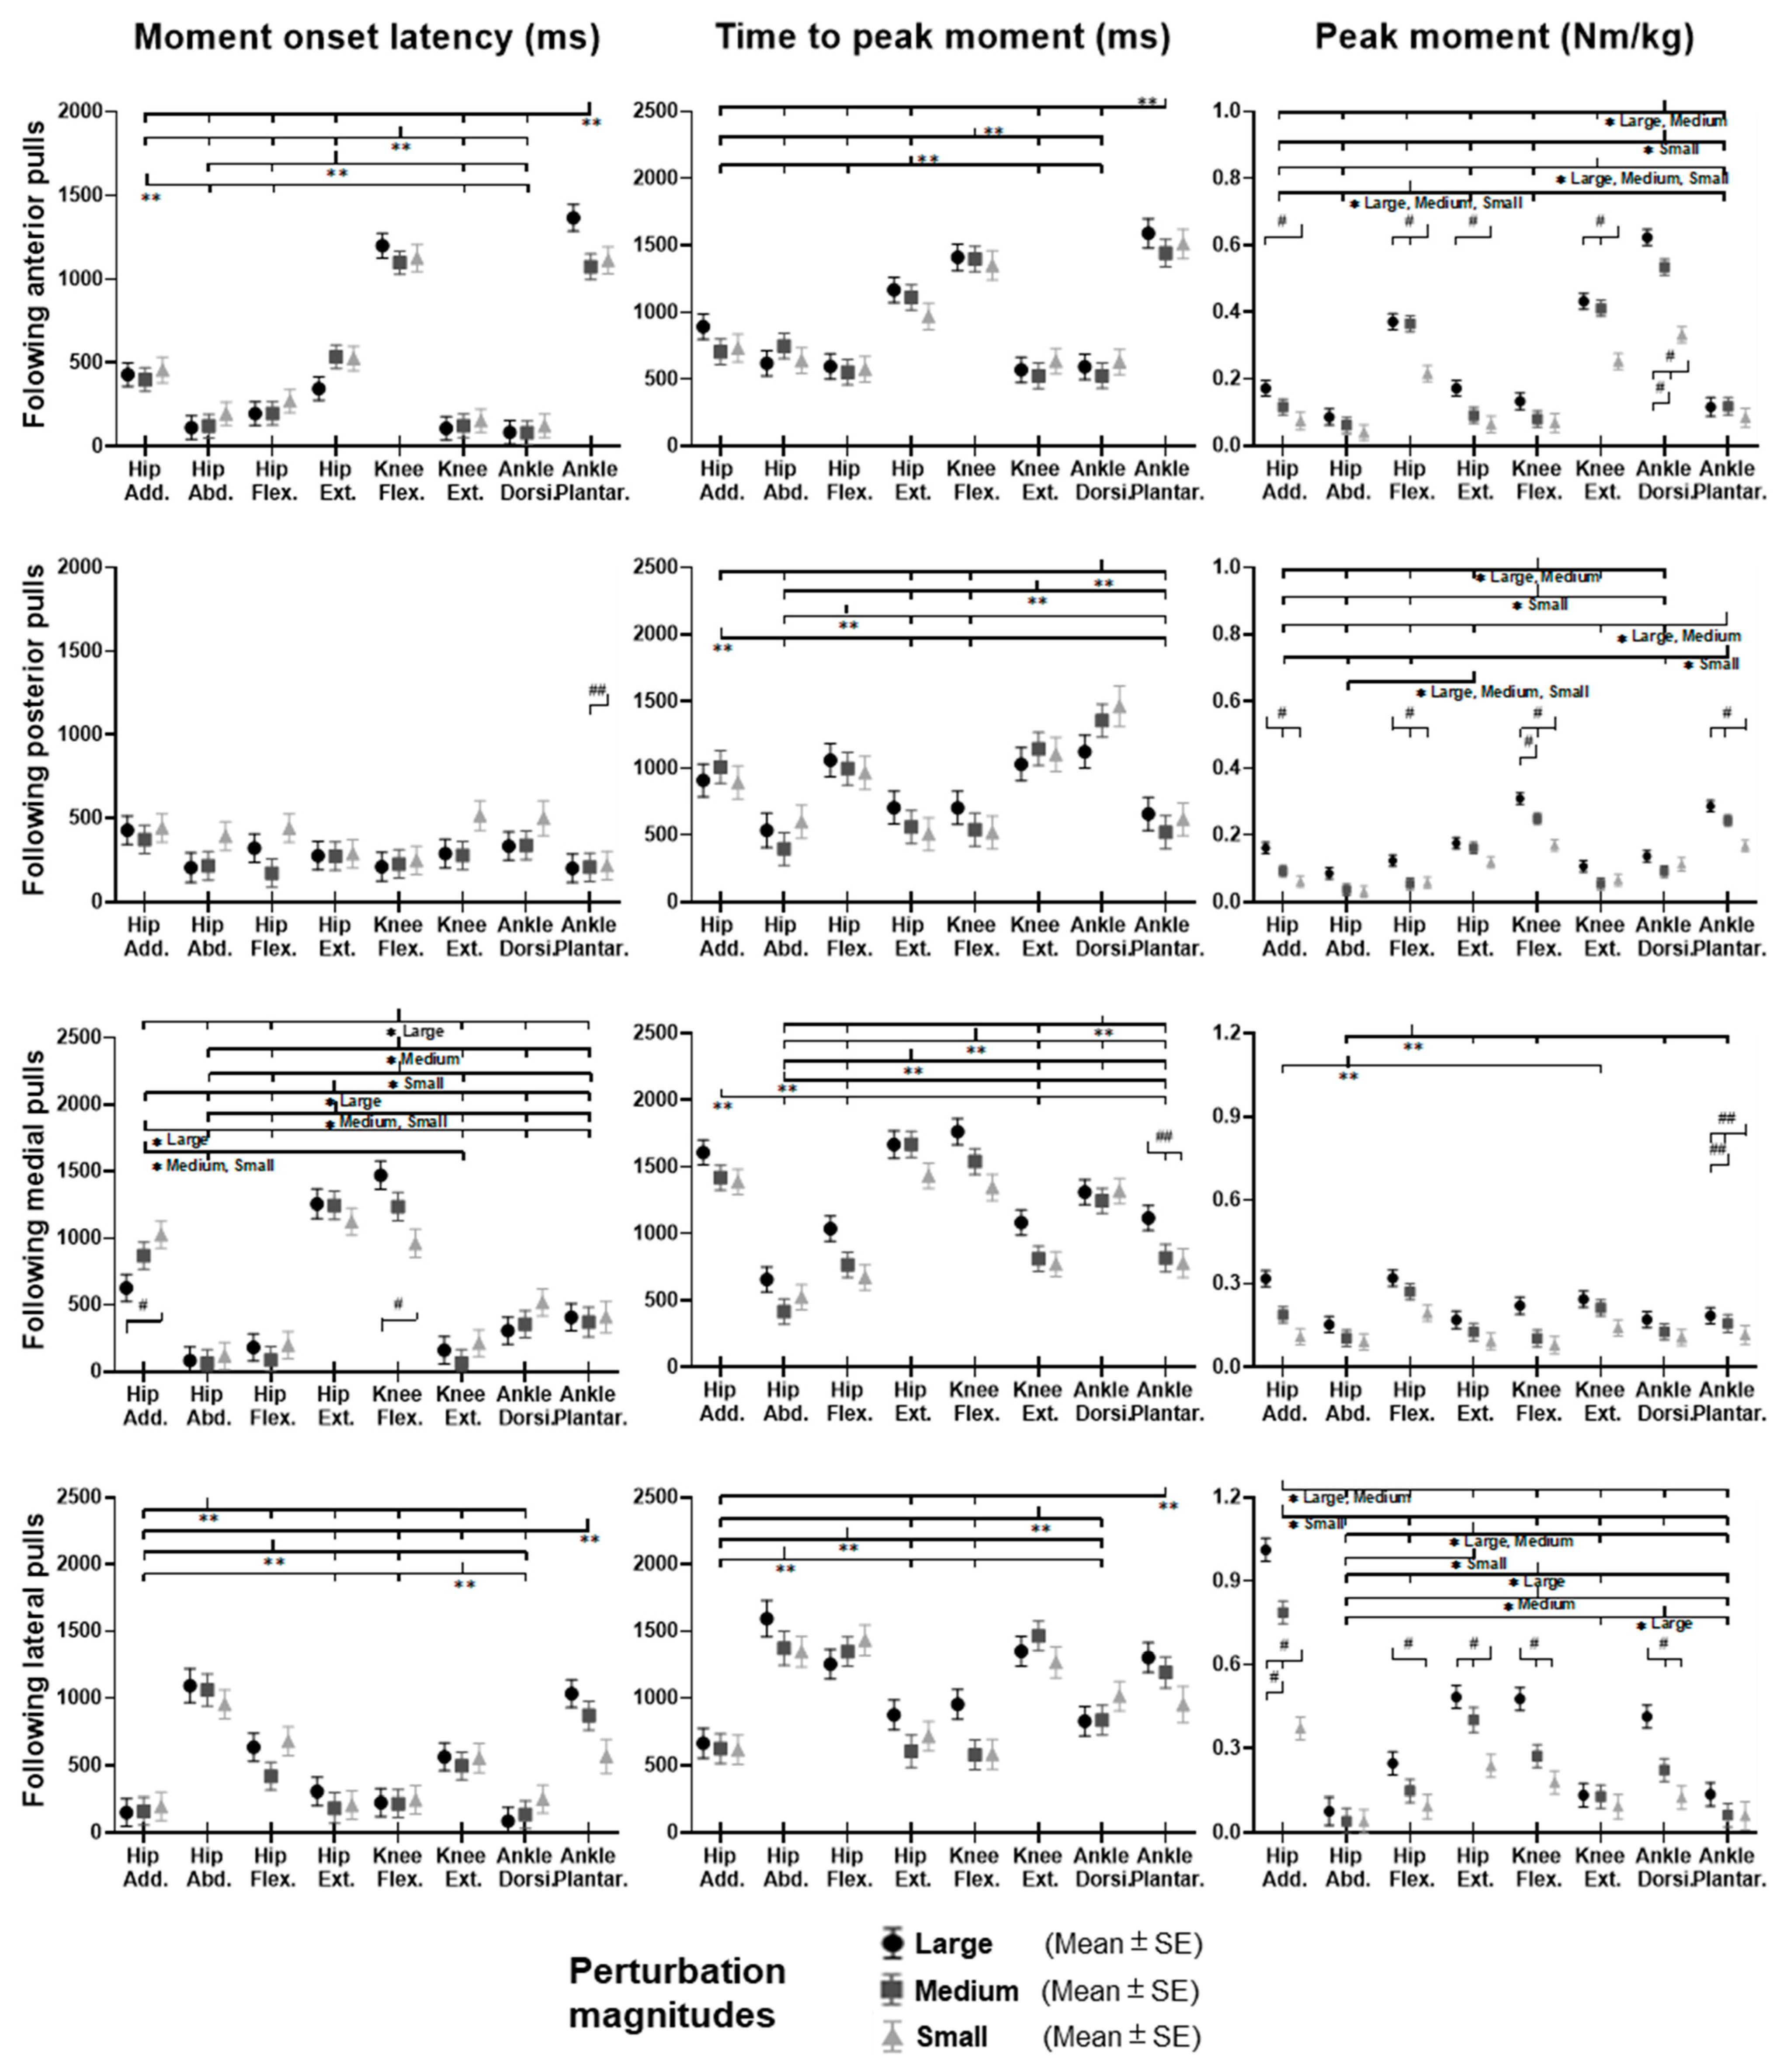
3.3. Lower-Limb Joint Moments
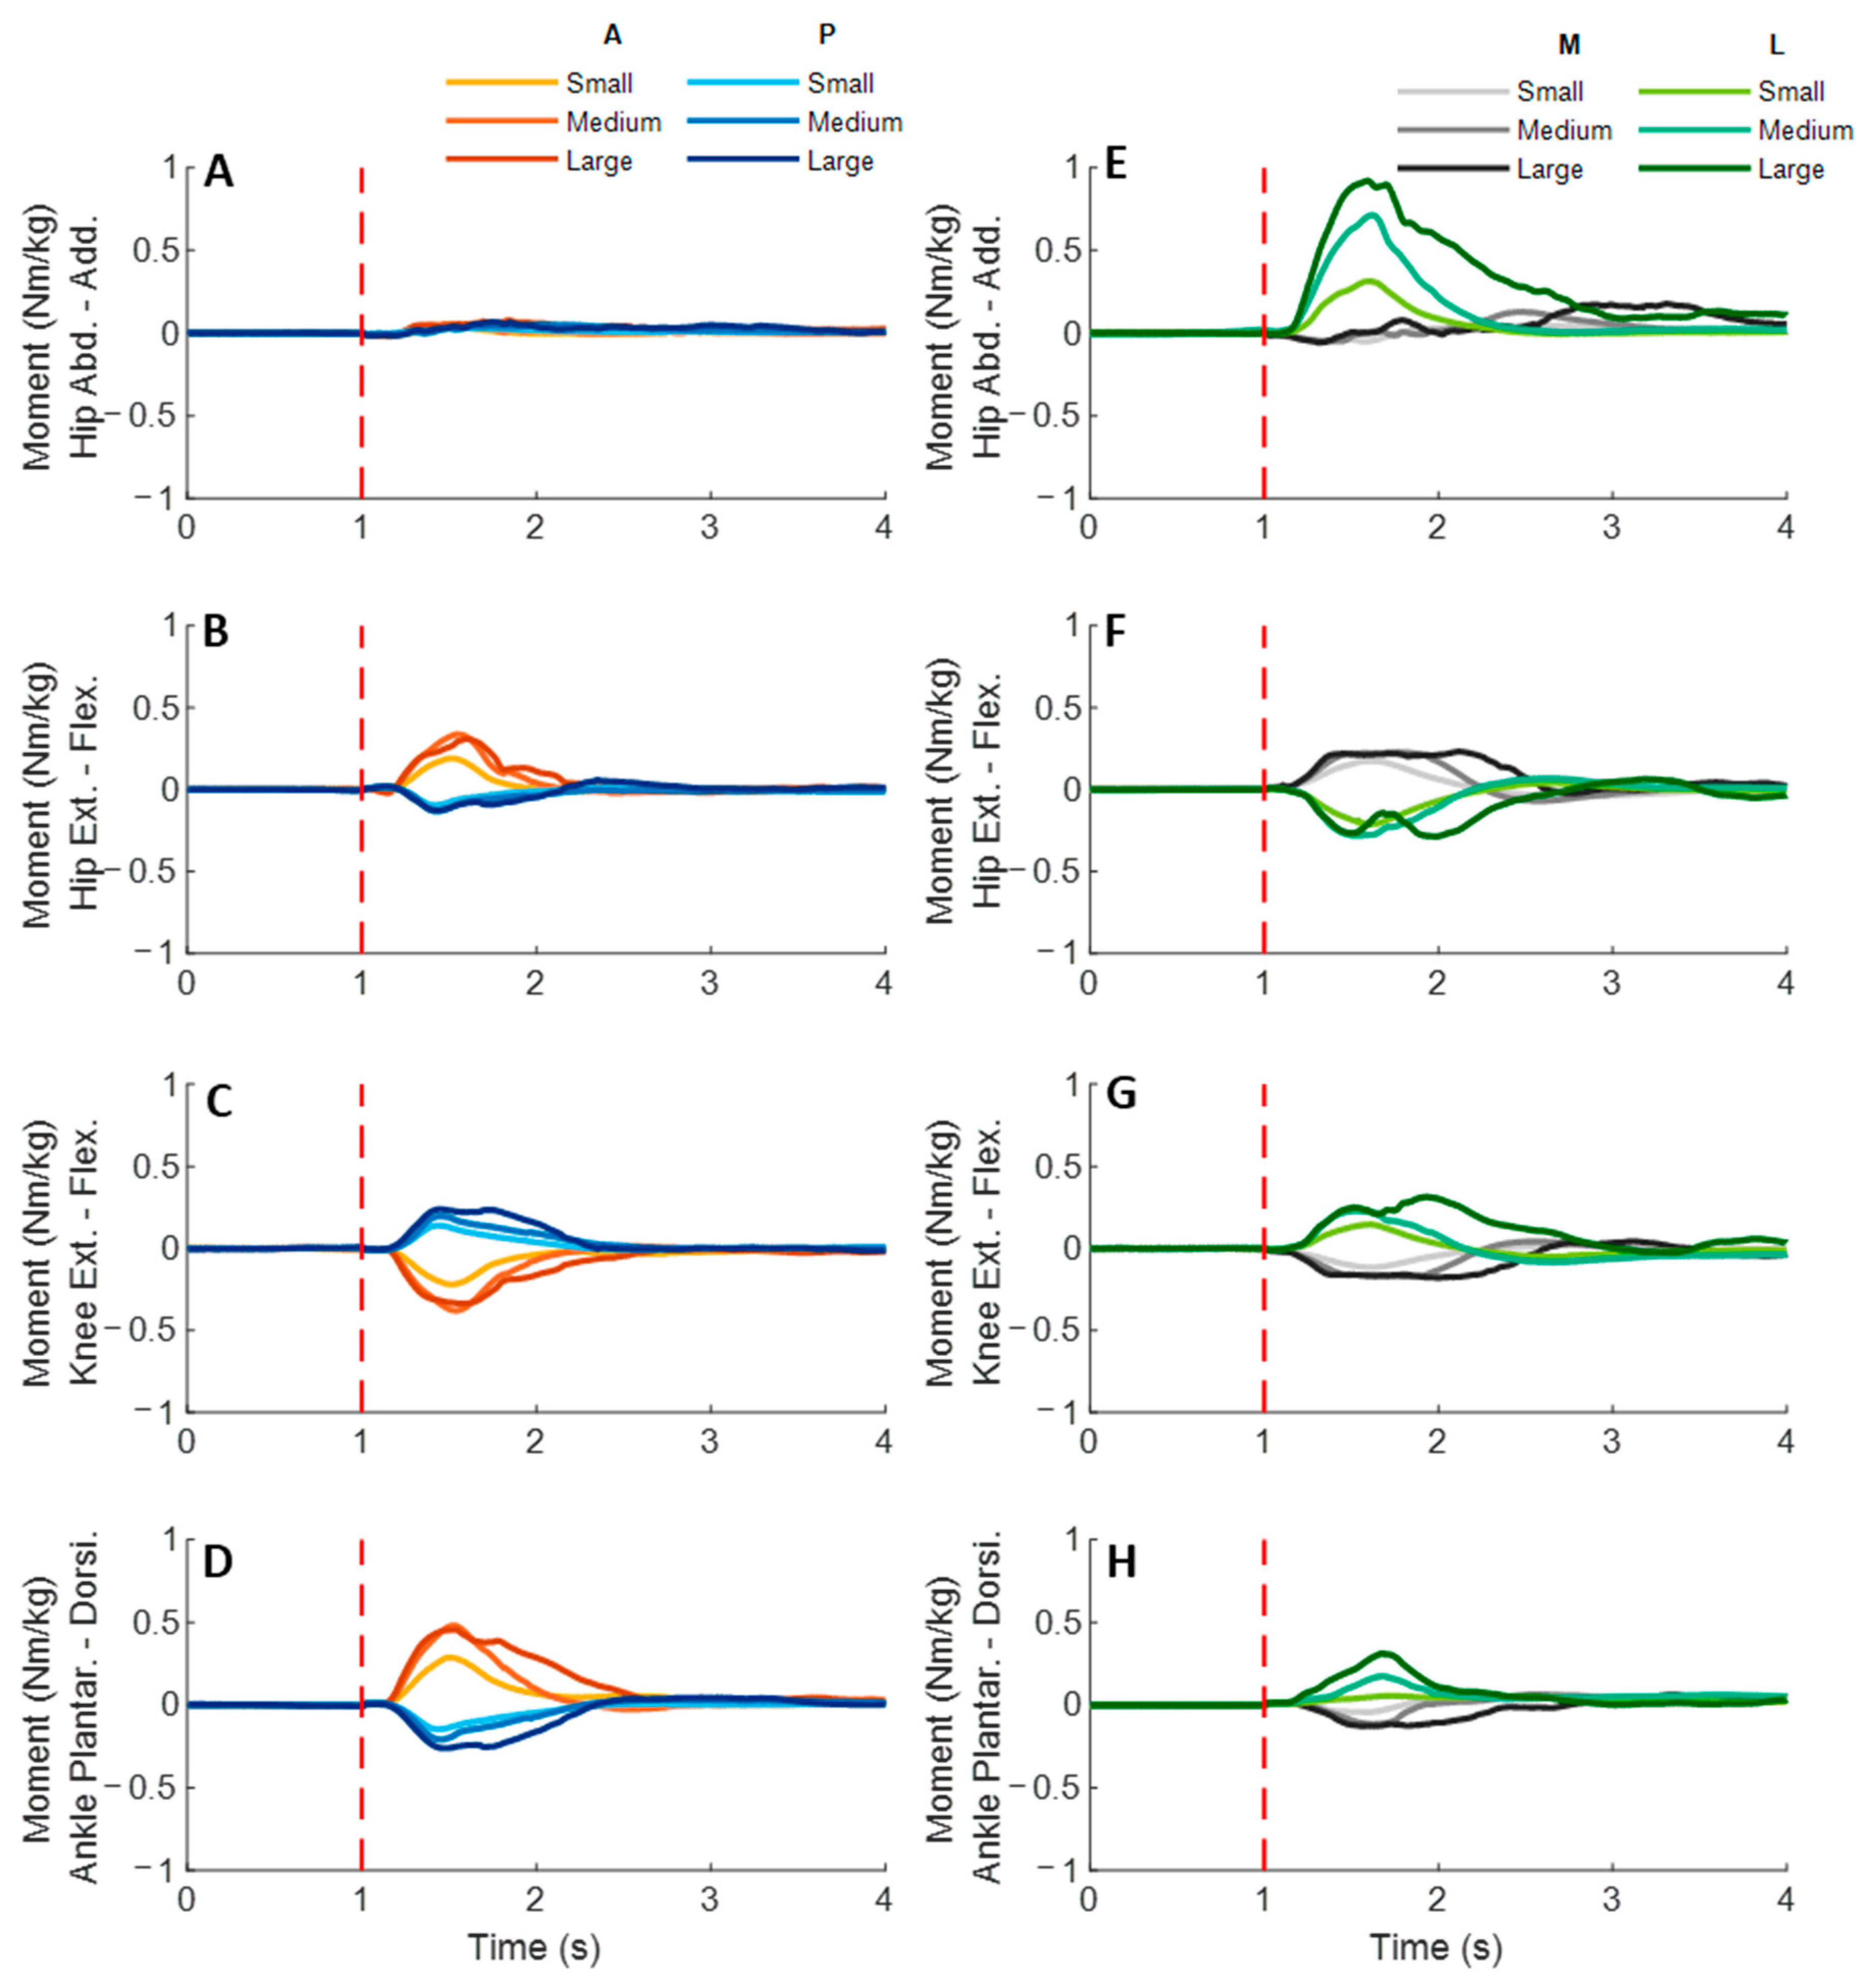
Figure 9 shows the dominant-leg joint moment changes following the unexpected waist-pull perturbations. As shown in
Figure 10, following the unexpected
anterior perturbations, significant within-joint differences existed in the moment onset latency (ankle dorsiflexion < plantarflexion; knee extension < flexion; hip flexion < extension; hip adduction < abduction;
p < 0.05) and the time to peak moment (ankle dorsiflexion < plantarflexion; knee extension < flexion; hip flexion < extension;
p < 0.05). Peak moments in ankle dorsiflexion, knee extension, and hip flexion were significantly larger than those in the other five joint motions (
p < 0.05). Particularly, under the medium and large magnitudes, the peak moment of ankle dorsiflexion was the largest among the eight joint motions (
p < 0.05).
Following the unexpected posterior perturbations, eight joint motions showed no significantly different moment onset latencies. Significant within-joint differences existed in the time to peak moment (ankle plantarflexion < dorsiflexion; knee flexion < extension; hip extension < flexion; hip abduction < adduction; p < 0.05). The peak moment of ankle plantarflexion was significantly larger than that of ankle dorsiflexion irrespective of perturbation magnitudes (p < 0.05). Knee flexion showed a significantly larger peak moment than knee extension under the medium and the large magnitudes (p < 0.05).
Following the unexpected medial perturbations, significant within-joint differences existed in the moment onset latency (hip abduction < adduction; knee extension < flexion; hip flexion < extension; p < 0.05). Hip abduction showed the shortest time to peak moment among the eight joint motions (p < 0.05). Besides, significant within-joint differences existed in the time to peak moment (hip flexion < extension, knee extension < flexion; ankle plantarflexion < dorsiflexion; p < 0.05) and the peak moment (hip flexion > extension; hip adduction > abduction; p < 0.05).
Following the unexpected
lateral perturbations, significant within-joint differences existed in the moment onset latency (hip adduction < abduction; hip extension < flexion; knee flexion < extension; ankle dorsiflexion < plantarflexion;
p < 0.05) and the time to peak moment (hip adduction < abduction; hip extension < flexion; knee flexion < extension;
p < 0.05). Under the medium and large magnitudes, the peak moment of hip adduction was the largest among the eight joint motions (
p < 0.05). In the sagittal plane, significant differences of peak moments were observed under the large (hip extension > flexion; knee flexion > extension; ankle dorsiflexion > plantarflexion;
p < 0.05) and the medium (hip extension > flexion;
p < 0.05) magnitudes.
Figure 11 summarized in what joint motions the more rapid moment response would occur following the four directions of waist-pull perturbations.
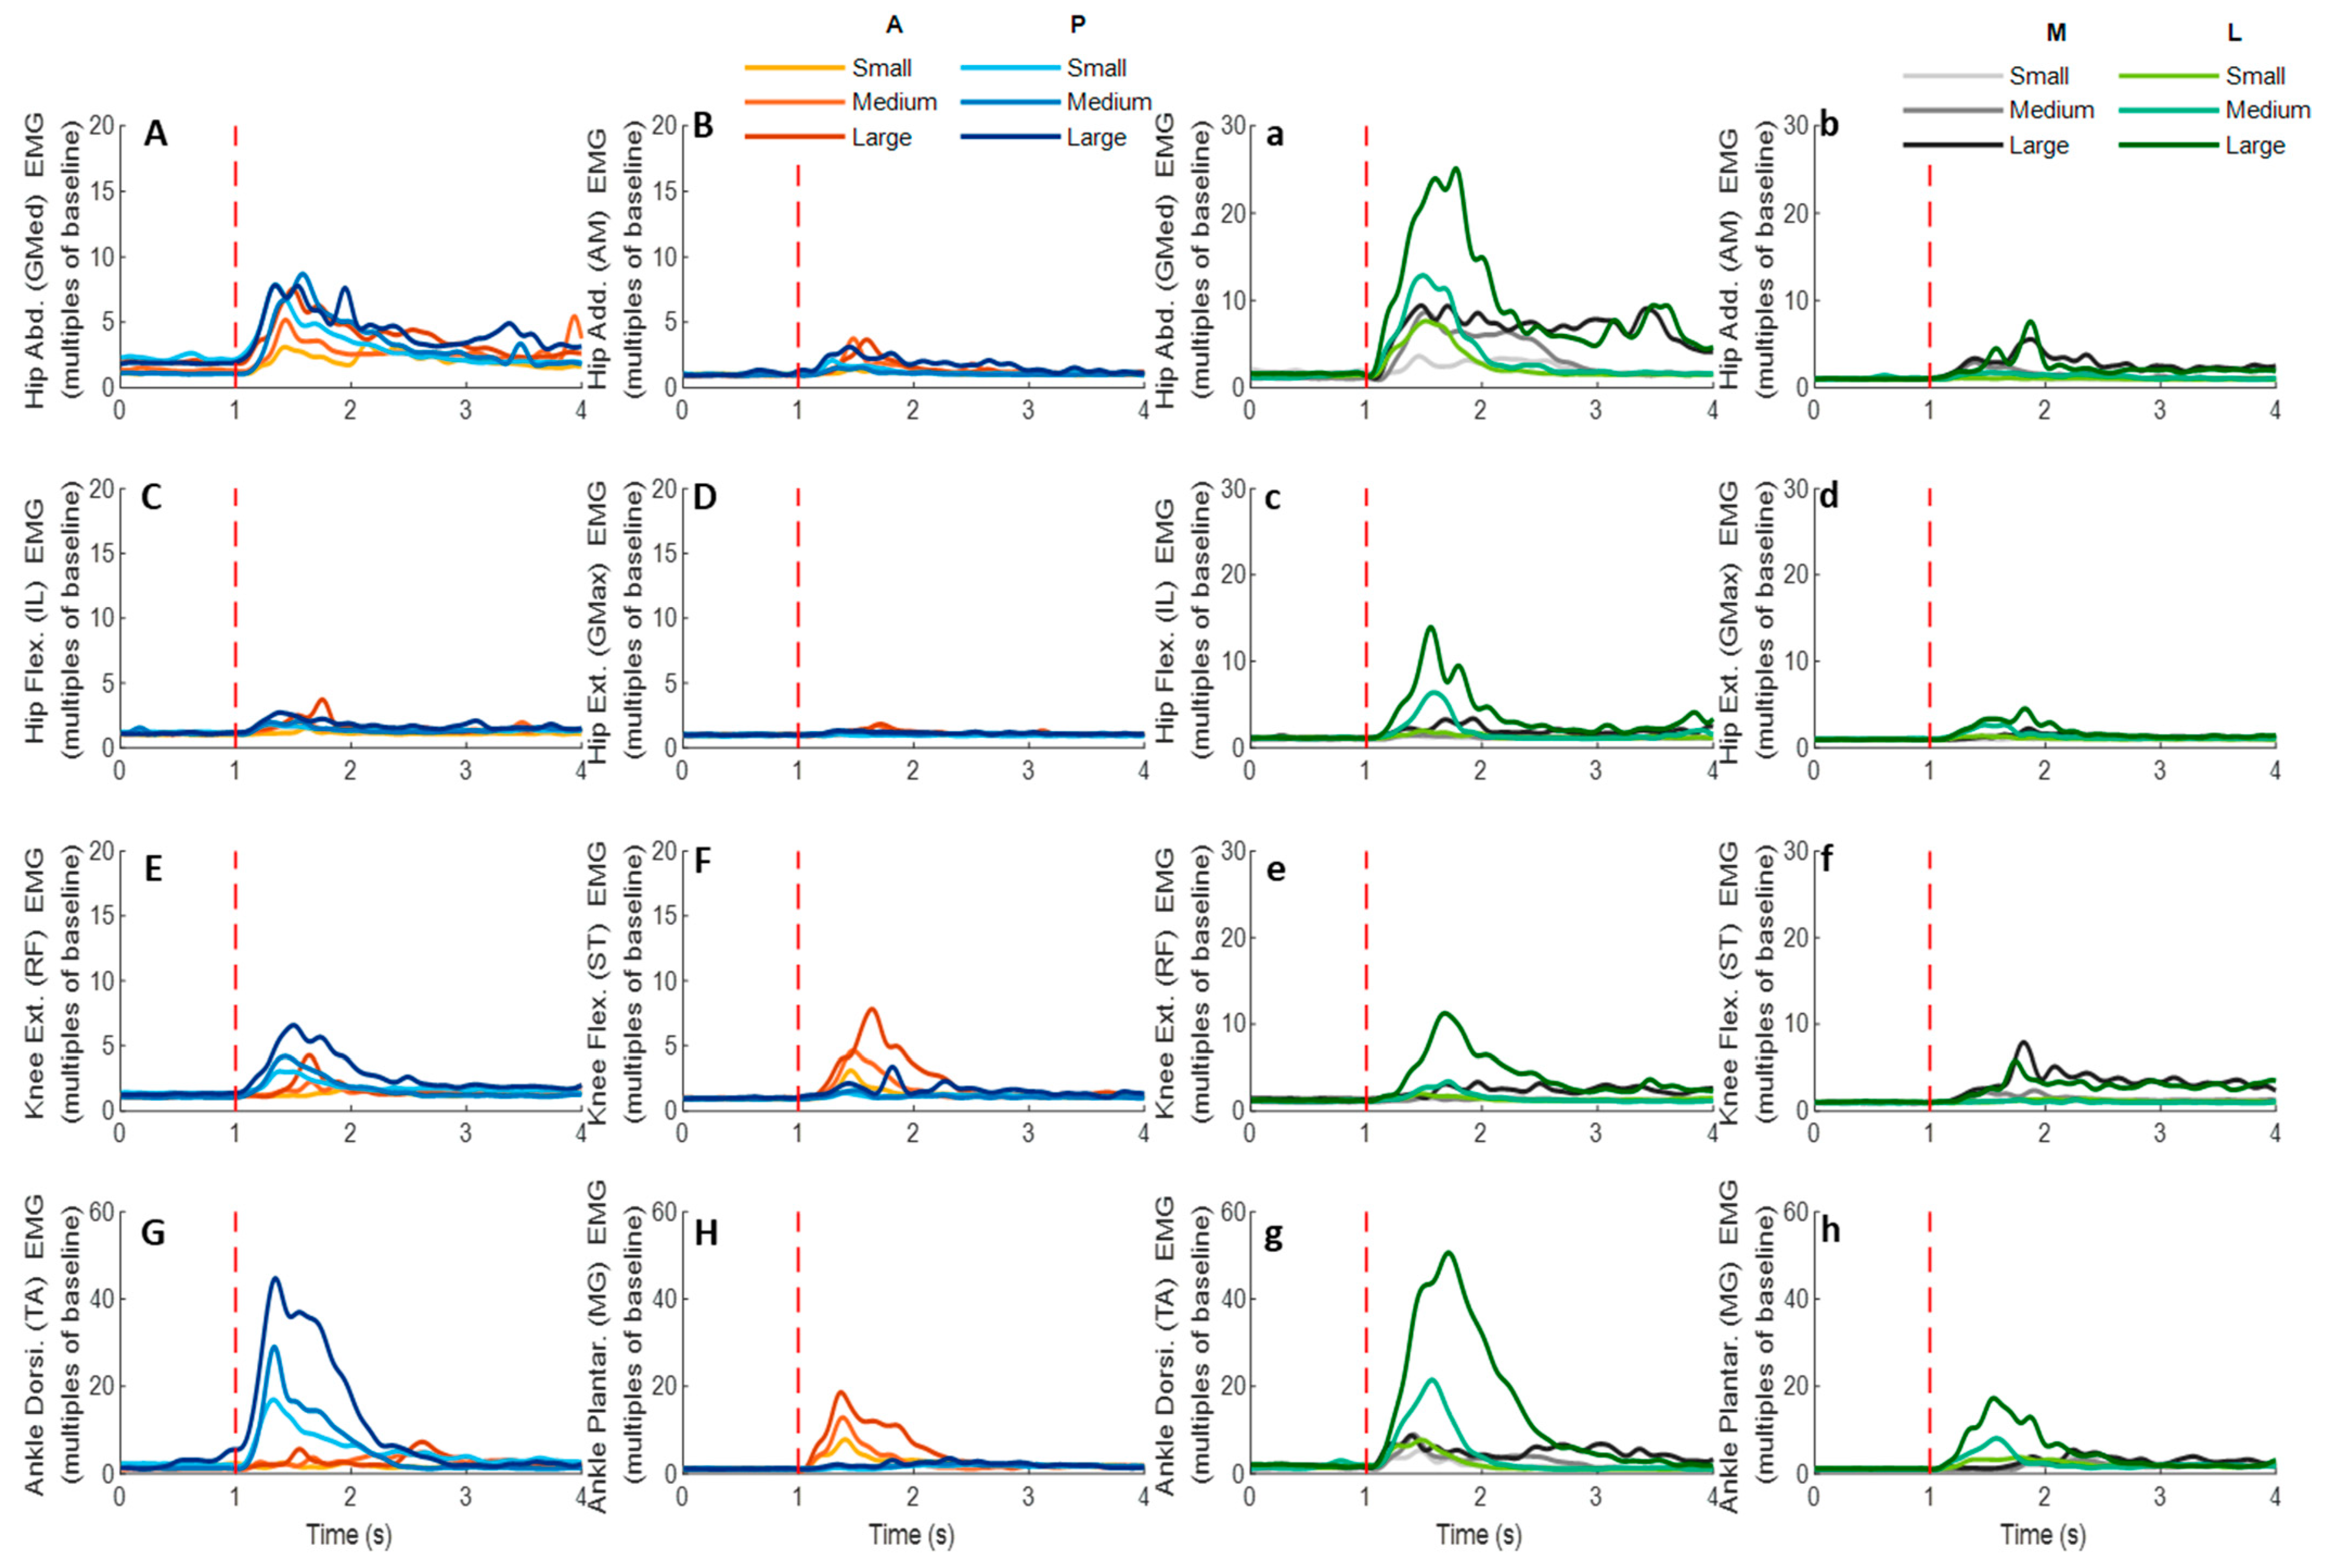
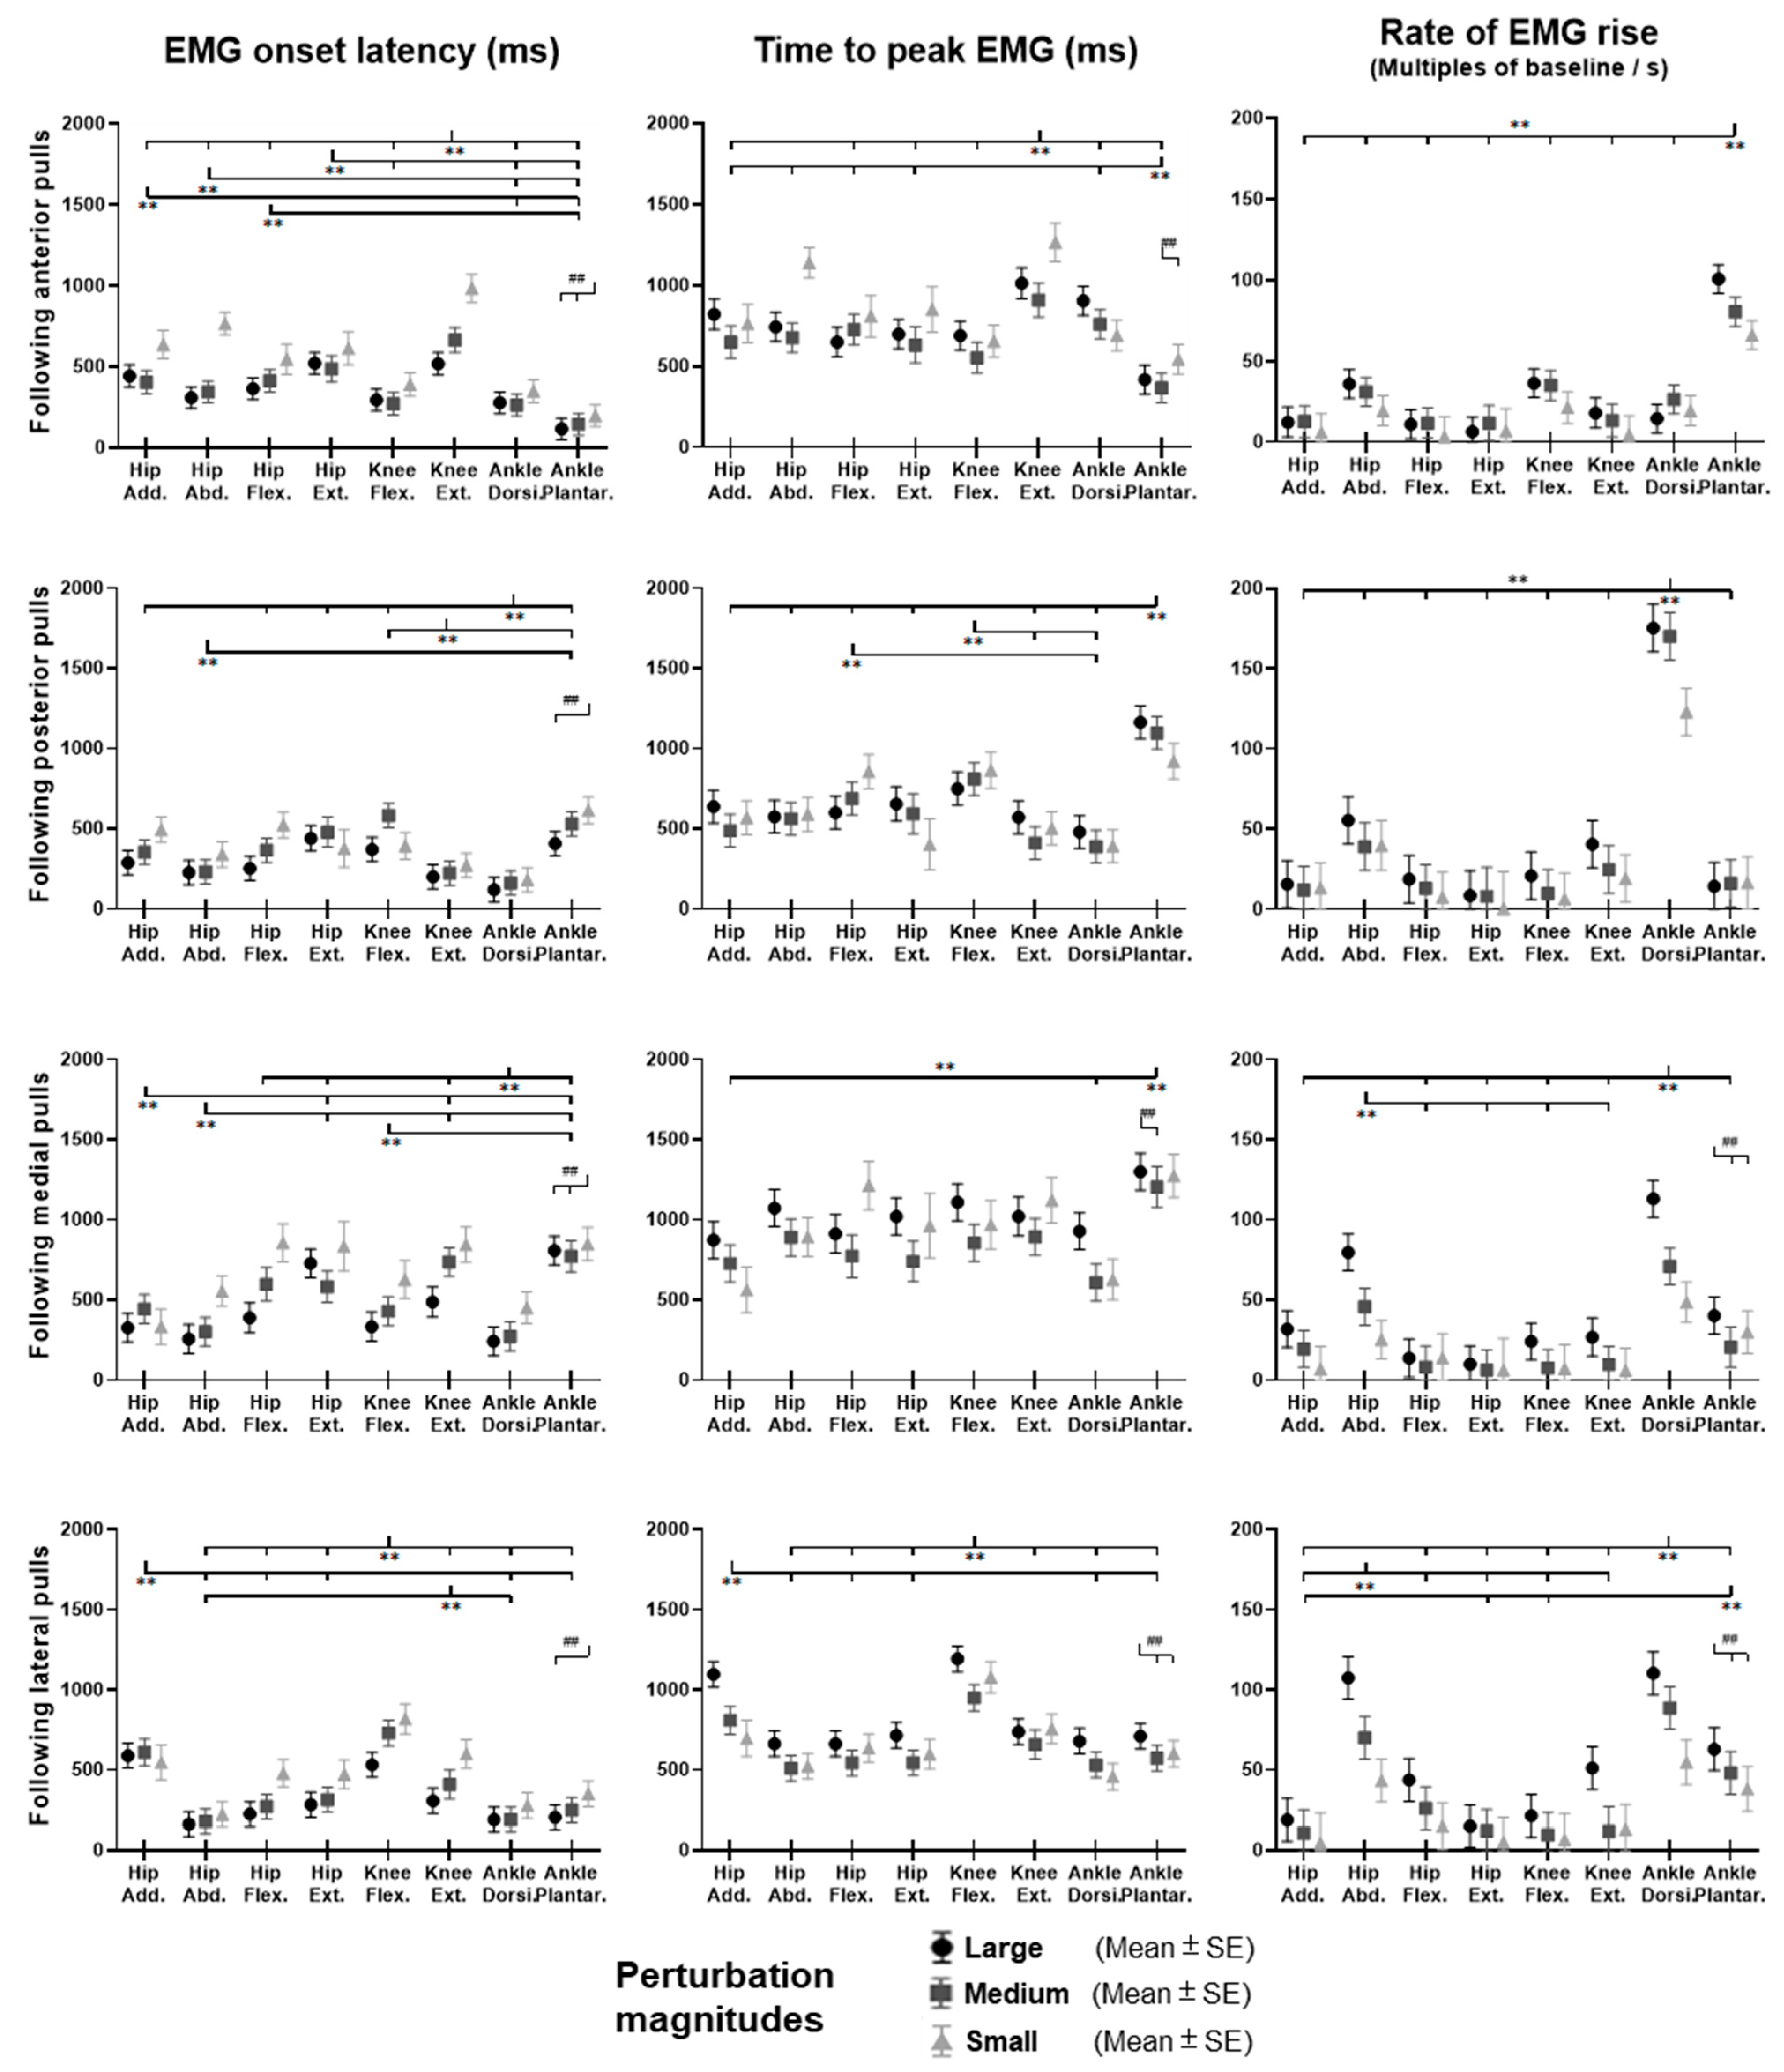
3.4. EMG Signals of Eight Lower-Limb Muscles
Figure 12 demonstrates the dominant-leg muscles’ EMG signal changes following the unexpected waist-pull perturbations. As shown in
Figure 13, following the unexpected
anterior perturbations, the ankle plantarflexor, ankle dorsiflexor, and knee flexor were in the queue with short EMG onset latencies, and the ankle plantarflexor showed a significantly shorter EMG onset latency than the other five muscles (
p < 0.05). Significant agonist-antagonist differences existed in the EMG onset latency (knee flexor < extensor;
p < 0.05) and the time to peak EMG amplitude (ankle plantarflexor < dorsiflexor; knee flexor < extensor;
p < 0.05). Ankle plantarflexor showed the largest rate of EMG rise among the eight lower-limb muscles (
p < 0.05). The larger perturbation magnitudes evoked significantly shorter EMG onset latencies and shorter time to peak EMG amplitude (
p < 0.05).
Figure 9.
The mean dominant-leg joint moment changes of twelve participants following the unexpected anterior, posterior, medial, and lateral perturbations with three magnitudes (n = 12). Mean hip adduction-abduction (A), hip flexion-extension (B), knee flexion-extension (C), and ankle dorsiflexion-plantarflexion (D) moment changes following anterior and posterior perturbations; Mean hip adduction-abduction (E), hip flexion-extension (F), knee flexion-extension (G), and ankle dorsiflexion-plantarflexion (H) moment changes following medial and lateral perturbations. (Note: The red dotted line indicated the start of pulling perturbation. Add.: adduction; Abd.: abduction; Flex.: flexion; Ext.: extension; Dorsi.: dorsiflexion; Plantar.: plantarflexion. A: anterior; P: posterior; M: medial; L: lateral).
Figure 10.
The moment onset latencies, time to peak moment, and peak moments of eight lower-limb joint motions following unexpected horizontal perturbations (mean ± SE,
n = 12). (Note:
SE: standard error;
![Biosensors 12 00430 i001]()
or
![Biosensors 12 00430 i002]()
: pairwise comparison. Significant differences in post hoc pairwise comparisons (
p < 0.05) were indicated by the:
** for the main effect of joint motion factor;
* for the simple main effect of joint motion factor;
## for the main effect of magnitude factor;
# for the simple main effect of magnitude factor).
Figure 11.
Rapid lower-limb joint moment responses evoked by the unexpected waist-pull perturbations. (Note that the right leg was the dominant leg. A: anterior pulls; P: posterior pulls; M: medial pulls; L: lateral pulls).
Figure 11.
Rapid lower-limb joint moment responses evoked by the unexpected waist-pull perturbations. (Note that the right leg was the dominant leg. A: anterior pulls; P: posterior pulls; M: medial pulls; L: lateral pulls).
Following the unexpected posterior perturbations, the ankle dorsiflexor, knee extensor, and hip abductor were in the queue with short EMG onset latencies, and the ankle dorsiflexor showed a significantly shorter EMG onset latency than the other five muscles (p < 0.05). Significant agonist-antagonist differences were observed in the EMG onset latency (ankle dorsiflexor < plantarflexor; knee extensor < flexor; p < 0.05) and the time to peak EMG amplitude (ankle dorsiflexor < plantarflexor; knee extensor < flexor; p < 0.05). The ankle dorsiflexor showed the largest rate of EMG rise among the eight lower-limb muscles (p < 0.05). The larger perturbation magnitudes evoked significantly shorter EMG onset latencies (p < 0.05).
Following the unexpected medial perturbations ankle dorsiflexor, hip adductor, hip abductor and knee flexor were in the queue with short EMG onset latencies, and the ankle dorsiflexor showed a significantly shorter EMG onset latency than the remaining four muscles (p < 0.05). Significant agonist-antagonist difference existed in the EMG onset latency (ankle dorsiflexor < plantarflexor; p < 0.05) and the time to peak EMG amplitude (ankle dorsiflexor < plantarflexor; p < 0.05). Except for the hip abductor, the ankle dorsiflexor muscle showed a significantly larger rate of EMG rise than the other six muscles (p < 0.05). The larger perturbation magnitudes evoked significantly shorter EMG onset latencies, longer time to peak EMG amplitude, and a larger rate of EMG rise (p < 0.05).
Following the unexpected lateral perturbations, significant agonist-antagonist differences existed in the EMG onset latency (hip abductor < hip adductor; knee extensor < knee flexor; p < 0.05) and the time to peak EMG amplitude (hip abductor < hip adductor; knee extensor < knee flexor; p < 0.05). Except for the hip abductor, the ankle dorsiflexor showed a significantly larger rate of EMG rise than the other six muscles (p < 0.05). In the frontal plane, the hip abductor showed a significantly larger rate of EMG rise than the hip adductor (p < 0.05). The larger perturbation magnitudes evoked significantly shorter EMG onset latencies, longer time to peak EMG amplitude, and a larger rate of EMG rise (p < 0.05).
Figure 12.
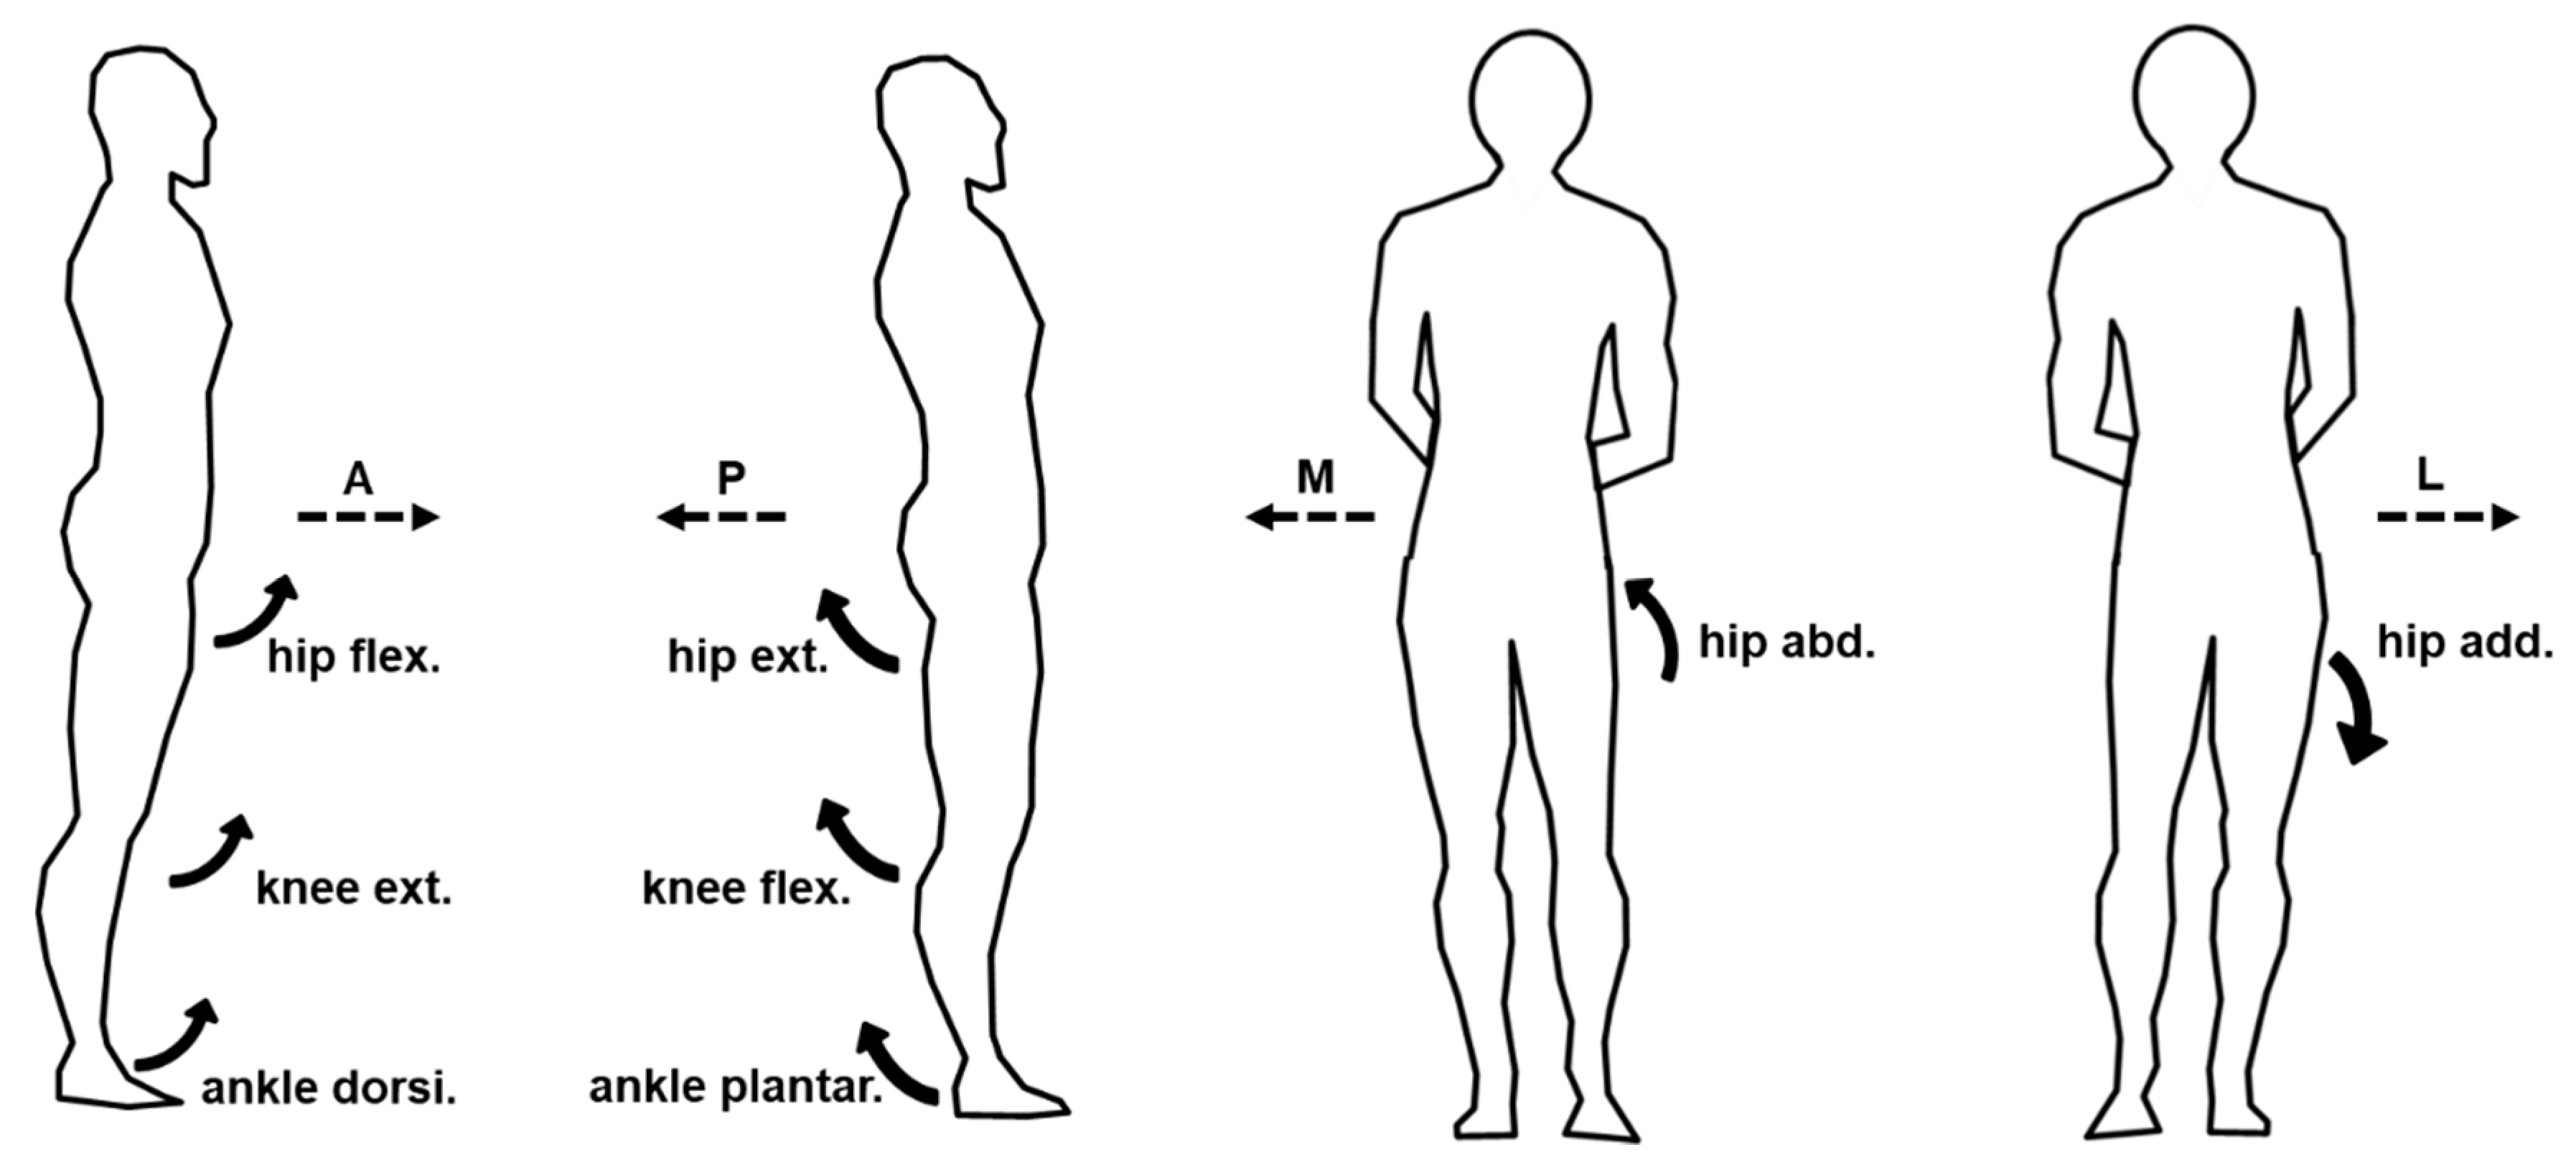
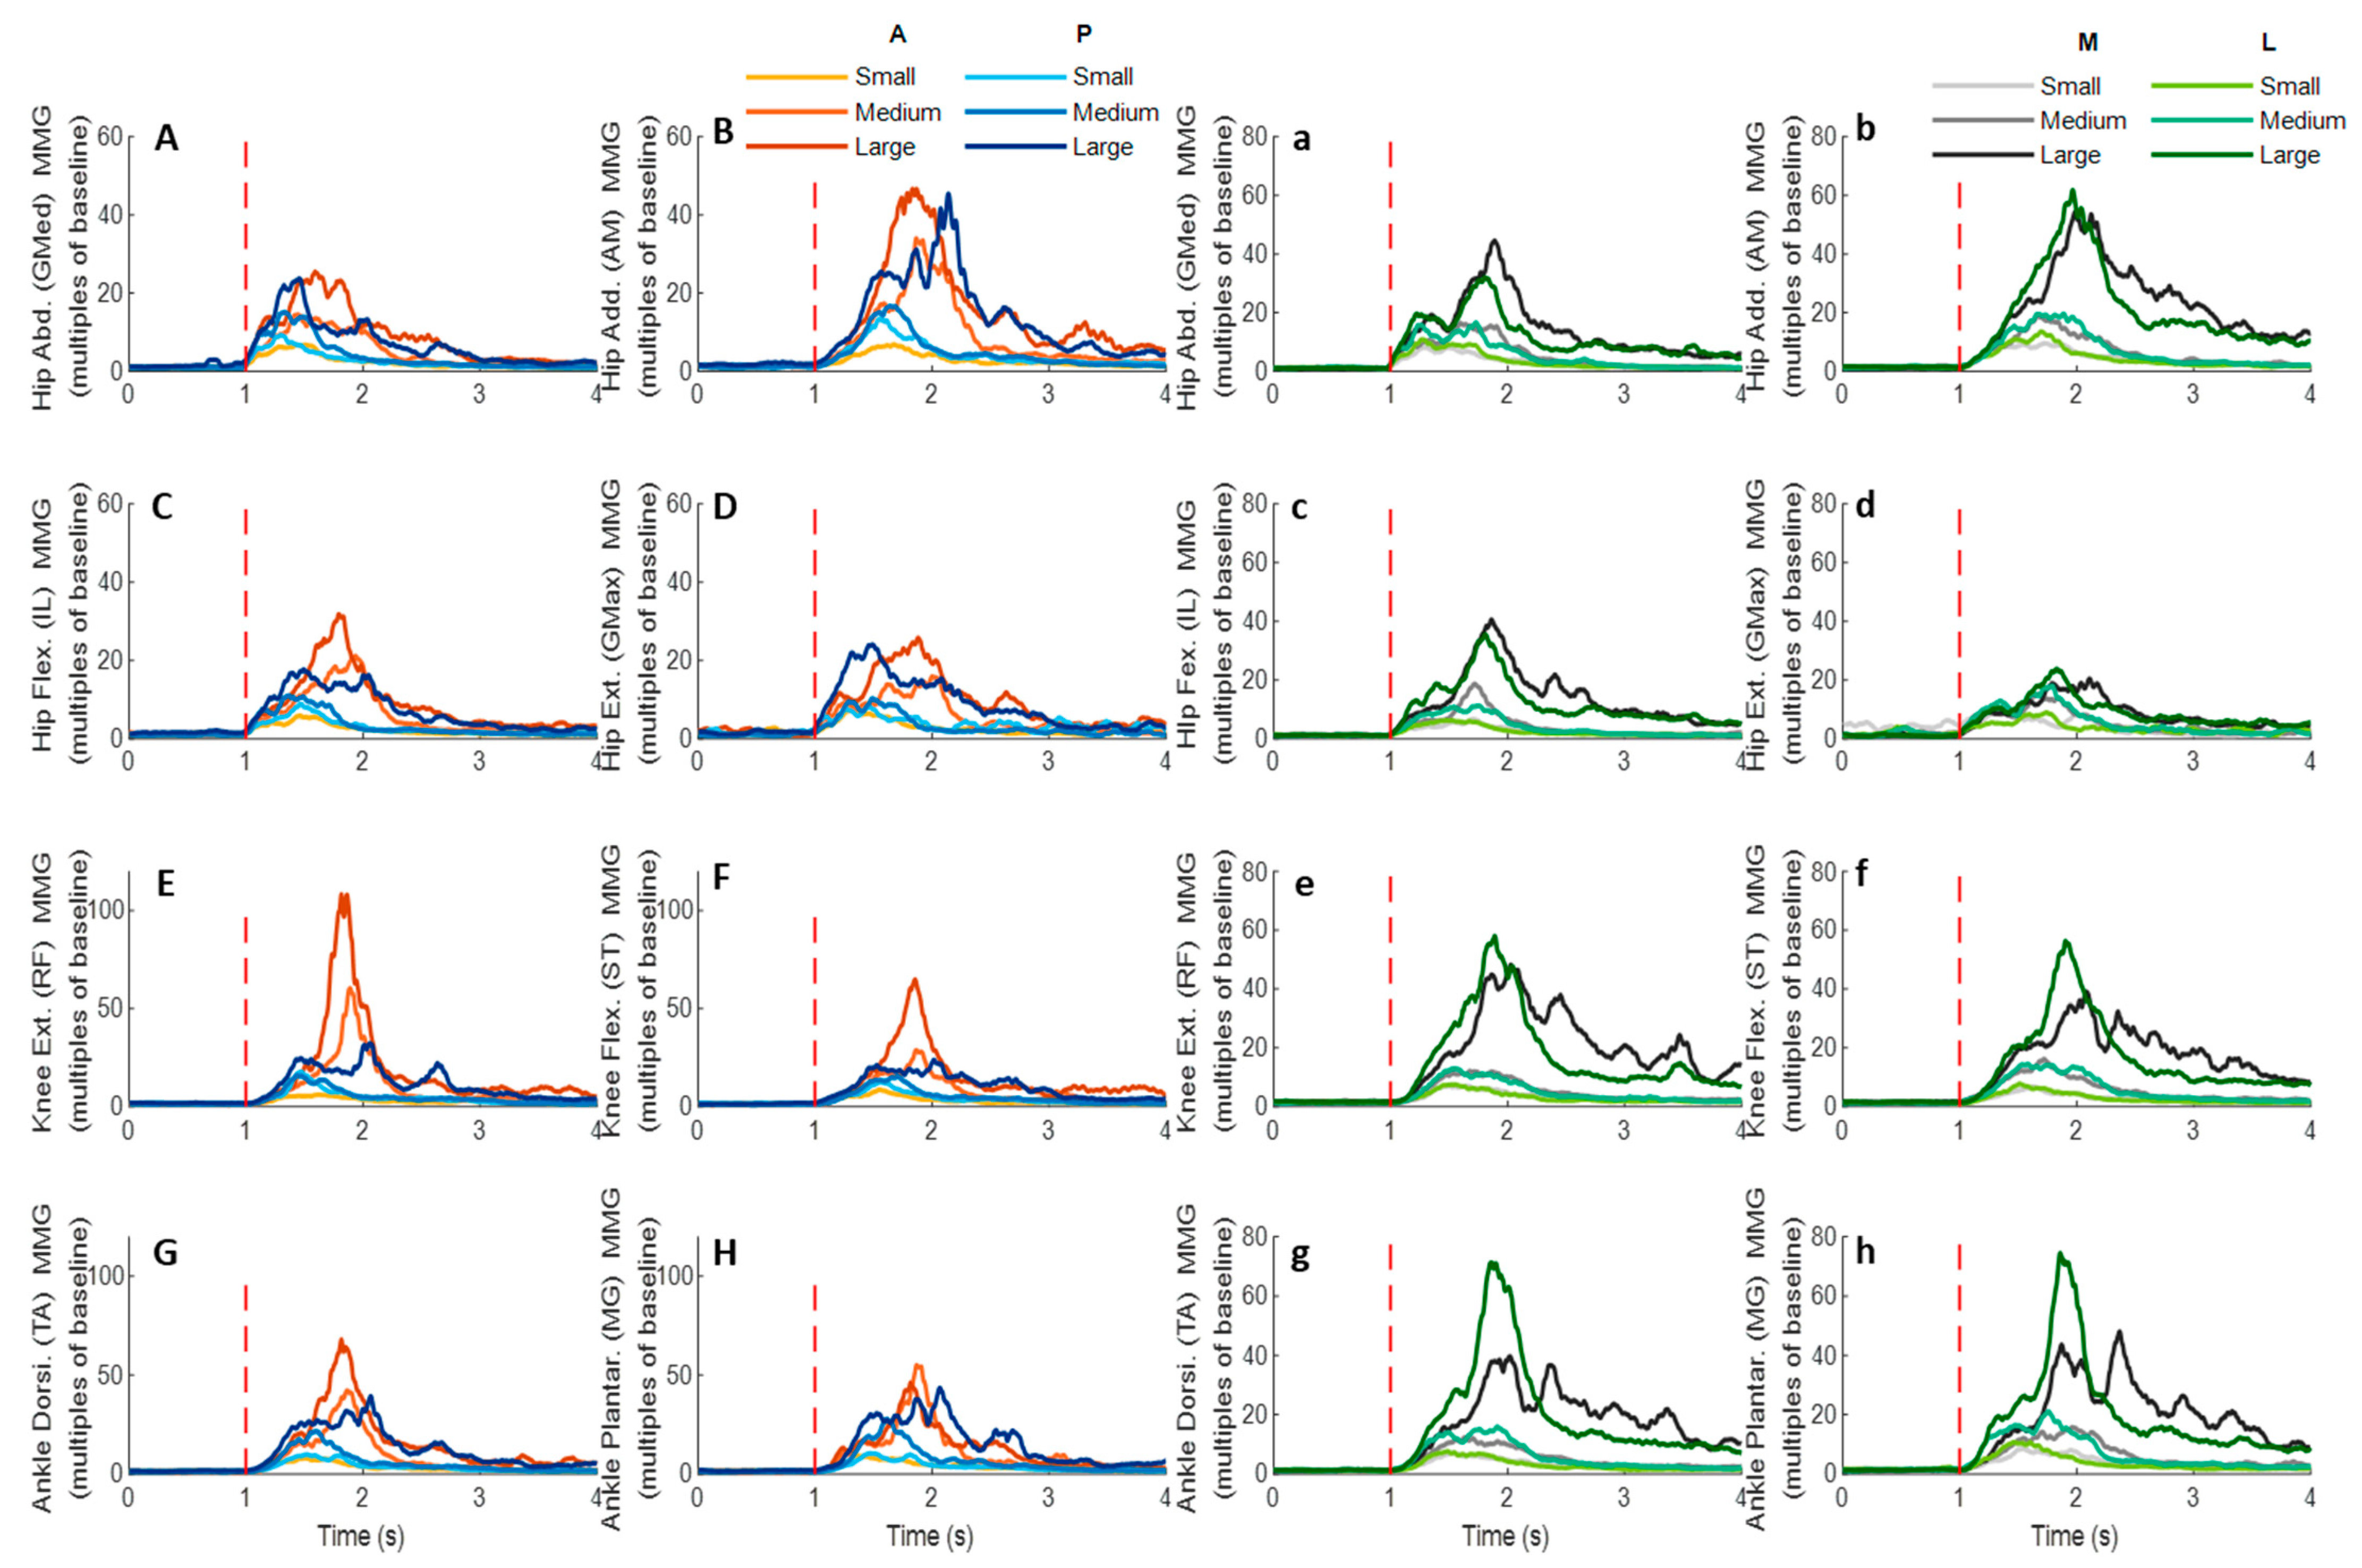
The mean EMG signal changes of twelve participants for eight dominant-leg muscles following the unexpected anterior, posterior, medial, and lateral perturbations with three magnitudes (n = 12). Mean EMG signal changes for hip abductor-adductor (A,B), hip flexor-extensor (C,D), knee extensor-flexor (E,F), and ankle dorsiflexor-plantarflexor (G,H) following anterior and posterior perturbations; Mean EMG signal changes of hip abductor-adductor (a,b), hip flexor-extensor (c,d), knee extensor-flexor (e,f), and ankle dorsiflexor-plantarflexor (g,h) following medial and lateral perturbations. (Note: The EMG amplitude values were multiples of the 1000-ms baseline mean value before a pulling perturbation. The red dotted line indicated the start of pulling perturbation. EMG: electromyography. GMed: gluteus medius; AM: adductor magus; IL: iliopsoas; GMax: gluteus maximus; RF: rectus femoris; ST: semitendinosus; TA: tibialis anterior; MG: gastrocnemius medialis; A: anterior; P: posterior; M: medial; L: lateral).
Figure 12.
The mean EMG signal changes of twelve participants for eight dominant-leg muscles following the unexpected anterior, posterior, medial, and lateral perturbations with three magnitudes (n = 12). Mean EMG signal changes for hip abductor-adductor (A,B), hip flexor-extensor (C,D), knee extensor-flexor (E,F), and ankle dorsiflexor-plantarflexor (G,H) following anterior and posterior perturbations; Mean EMG signal changes of hip abductor-adductor (a,b), hip flexor-extensor (c,d), knee extensor-flexor (e,f), and ankle dorsiflexor-plantarflexor (g,h) following medial and lateral perturbations. (Note: The EMG amplitude values were multiples of the 1000-ms baseline mean value before a pulling perturbation. The red dotted line indicated the start of pulling perturbation. EMG: electromyography. GMed: gluteus medius; AM: adductor magus; IL: iliopsoas; GMax: gluteus maximus; RF: rectus femoris; ST: semitendinosus; TA: tibialis anterior; MG: gastrocnemius medialis; A: anterior; P: posterior; M: medial; L: lateral).
![Biosensors 12 00430 g012]()
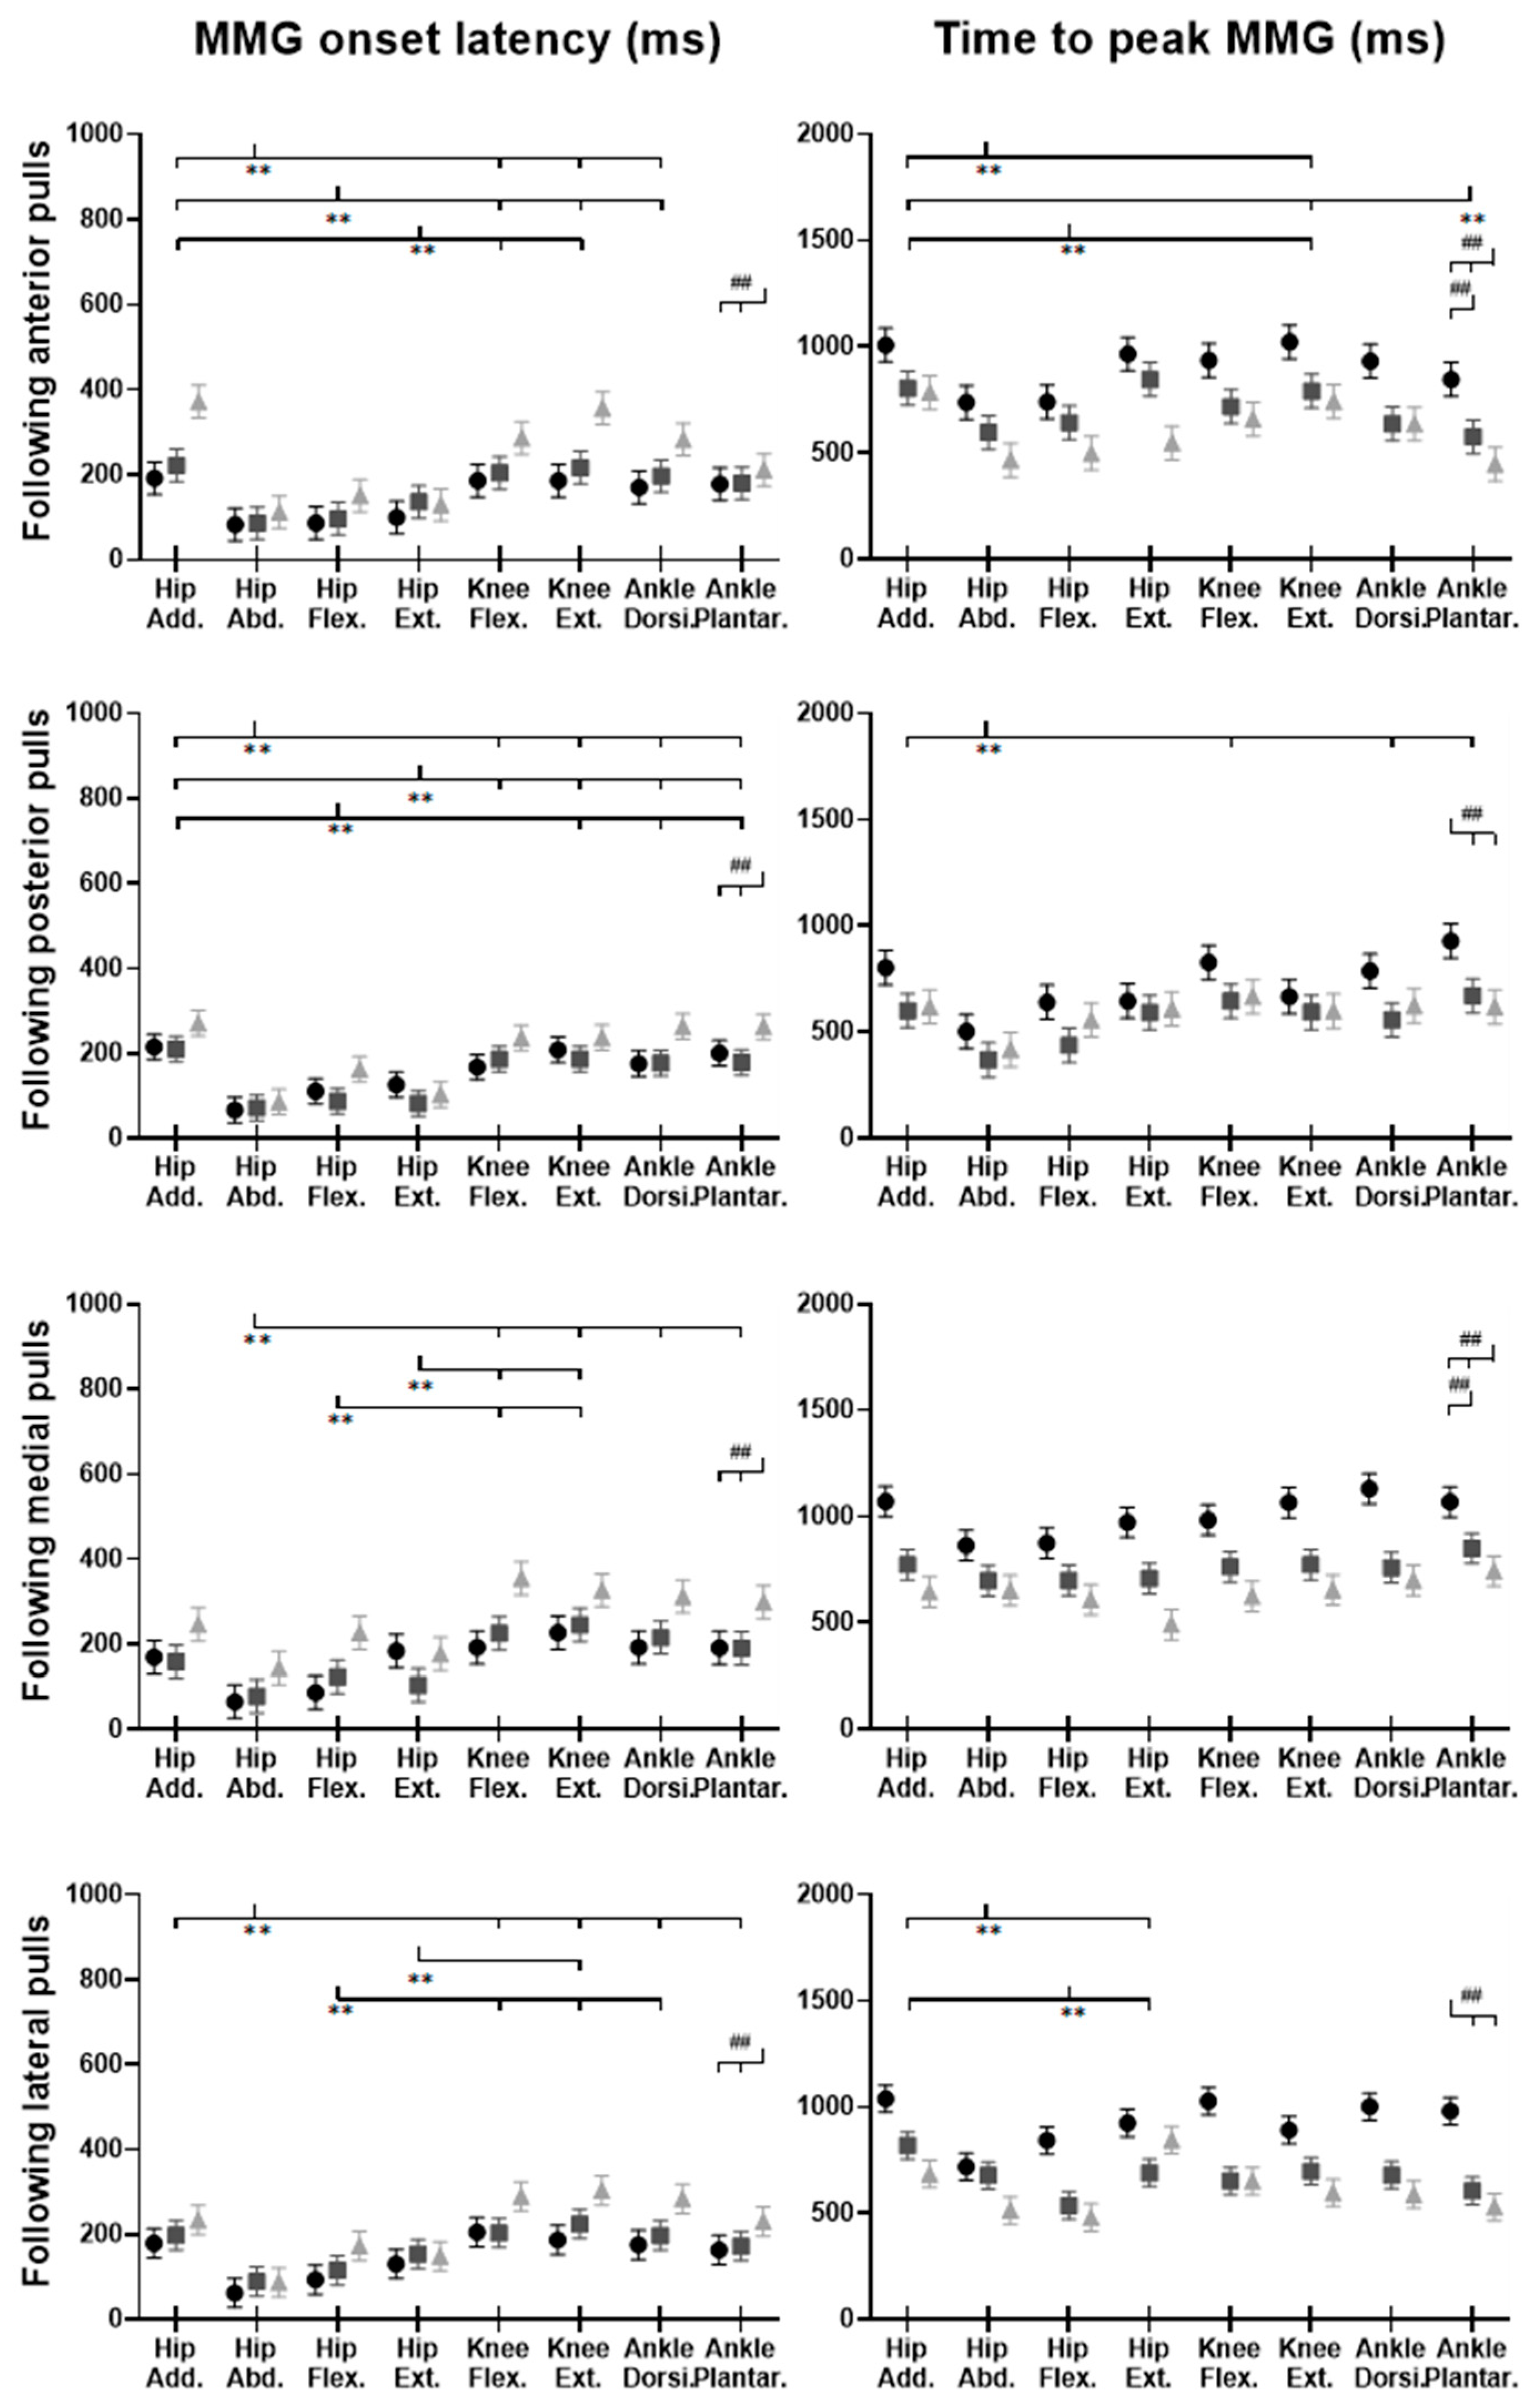
3.5. MMG Signals of Eight Lower-Limb Muscles
Figure 14 demonstrates the eight muscles’ MMG signal changes following the unexpected waist-pull perturbations. As shown in
Figure 15, following all the four directions of unexpected perturbations, the hip abductor, hip flexor, and hip extensor were in the queue with short MMG onset latencies. Significant agonist-antagonist differences in MMG onset latencies were observed (hip abductor < adductor;
p < 0.05) following anterior, posterior, and lateral perturbations. The larger perturbation magnitudes evoked significantly shorter MMG onset latencies for all the four pulling directions (
p < 0.05).
Regarding the time to peak MMG amplitude, significant agonist-antagonist differences were observed following anterior (hip abductor < adductor; p < 0.05), posterior (hip abductor < adductor; p < 0.05) and lateral (hip abductor < adductor; hip flexor < extensor; p < 0.05) perturbations. The larger perturbation magnitudes evoked a significantly longer time to peak MMG amplitude following all the four directions of unexpected perturbations (p < 0.05).
Figure 13.
The EMG onset latencies, time to peak EMG amplitude, and rate of EMG rise for eight dominant-leg muscles following unexpected horizontal perturbations (mean ± SE,
n = 12). (Note:
Hip Add.: adductor magus;
Hip Abd.: gluteus medius;
Hip Flex.: iliopsoas;
Hip Ext.: gluteus maximus;
Knee Flex.: semitendinosus;
Knee Ext.: rectus femoris;
Ankle Dorsi.: tibialis anterior;
Ankle Plantar.: gastrocnemius medialis.
SE: standard error;
![Biosensors 12 00430 i001]()
or
![Biosensors 12 00430 i002]()
: pairwise comparison. Significant differences in post hoc pairwise comparisons (
p < 0.05) were indicated by the:
** for the main effect of muscle factor;
## for the main effect of magnitude factor).
Figure 14.
The mean MMG signal changes of twelve participants for eight dominant-leg muscles following the unexpected anterior, posterior, medial, and lateral perturbations with three magnitudes (n = 12). Mean MMG signal changes for hip abductor-adductor (A,B), hip flexor-extensor (C,D), knee extensor-flexor (E,F), and ankle dorsiflexor-plantarflexor (G,H) following anterior and posterior perturbations; Mean MMG signal changes of hip abductor-adductor (a,b), hip flexor-extensor (c,d), knee extensor-flexor (e,f), and ankle dorsiflexor-plantarflexor (g,h) following medial and lateral perturbations. (Note: The MMG amplitude values were multiples of the 1000-ms baseline mean value before a pulling perturbation. The red dotted line indicated the start of pulling perturbation. MMG: mechanomyography. GMed: gluteus medius; AM: adductor magus; IL: iliopsoas; GMax: gluteus maximus; RF: rectus femoris; ST: semitendinosus; TA: tibialis anterior; MG: gastrocnemius medialis; A: anterior; P: posterior; M: medial; L: lateral).
![Biosensors 12 00430 g014]()
Figure 15.
The MMG onset latencies and time to peak MMG amplitude for eight dominant-leg muscles following unexpected horizontal perturbations (mean ± SE,
n = 12). (Note:
Hip Add.: adductor magus;
Hip Abd.: gluteus medius;
Hip Flex.: iliopsoas;
Hip Ext.: gluteus maximus;
Knee Flex.: semitendinosus;
Knee Ext.: rectus femoris;
Ankle Dorsi.: tibialis anterior;
Ankle Plantar.: gastrocnemius medialis.
MMG: mechanomyography;
SE: standard error;
![Biosensors 12 00430 i001]()
or
![Biosensors 12 00430 i002]()
: pairwise comparison. Significant differences in post hoc pairwise comparisons (
p < 0.05) were indicated by the: ** for the main effect of muscle factor; ## for the main effect of magnitude factor).
4. Discussion
With the innovatively synchronized measurement of postural sway, joint kinetics and kinematics, and muscle EMG and MMG activities, this study comprehensively investigated and uncovered how hip, knee, and ankle muscles and joints reacted to the unexpected perturbations in sagittal and frontal planes. Generally, this study observed that: (1) agonist muscles that resisted the perturbation had more rapid activation than the antagonist muscles; (2) among all agonist muscles resisting the perturbation, ankle muscles had the largest rate of activation in the sagittal or frontal plane; (3) CoP and lower-joint moments that followed the perturbation had faster increase; and (4) the larger magnitude of perturbations tended to induce faster responses in muscle activities, but not necessarily in joint motions. These findings not only build on our knowledge of how lower-limb muscles and joints respond to balance perturbations, but also facilitate future applied research on developing the targeted balance exercise program and/or the (robotic) assistive technologies/devices to prevent falls of older people and patients. More details can be found below.
4.1. Faster Activation Occurred in Muscles Resisting Perturbations, Especially for Ankle Muscles
The primary finding of this study is that more rapid activation existed in the agonist muscles that resisted the pulling perturbations, as compared to the antagonist muscles; and ankle muscles appeared to have the earliest and most rapid activation in response to the perturbations in either sagittal (anterior & posterior) or frontal (medial & lateral) plane.
This study observed that for
anterior perturbation, muscles moving the body posteriorly (ankle plantarflexor, knee flexor) had early activation and reached the peak neuromuscular activation early. This is consistent with the previous finding that dorsal leg muscles (gastrocnemius, hamstrings) had earlier onset of reflexive activities than ventral muscles, following the unexpected perturbations induced by a backward-moving platform [
9]. The ankle plantarflexor also showed the largest rate of neuromuscular activation among the eight muscles in this study. The rate of EMG rise in the early phase (50 ms after the EMG onset) has been reported as one key determinant of rapid force generation [
41], and a large rate of dorsal leg muscles’ activation was important for preventing tripping [
13]. This study further suggested that among the eight lower-limb muscles, the ankle plantarflexor had the most rapid increase of muscle activities to resist the excessive anterior pulling perturbations.
Similarly, this study observed that for
posterior perturbation, muscles moving the body anteriorly (ankle dorsiflexor, knee extensor) had earlier activation and reached the peak neuromuscular activation earlier than their antagonist muscles. Such results are consistent with the previous studies that found shorter EMG onset latencies [
16,
17,
42] and time to peak EMG amplitude [
17] existed in the ventral leg muscles (TA and RF), following the unexpected perturbations induced by a forward-moving platform. Furthermore, this study also observed that the ankle dorsiflexor had a significantly larger rate of neuromuscular activation than the other seven lower-limb muscles. While limited previous studies investigated the rate of neuromuscular activation following balance perturbations, the findings of this study suggested that the ankle dorsiflexor was activated most rapidly in response to the posterior perturbation.
This study also observed that for
medial perturbation, the hip adductor and hip abductor had earlier activation; and for
lateral perturbation, more lower-limb muscles, including the hip abductor, had earlier activation since more body weight was transferred to the dominant leg. This supported the previous studies’ finding that the declined rate of hip abductor/adductor activation correlated with a lower incidence of protective stepping following the unexpected lateral waist-pulls [
8]. On top of this, this study further found that the ankle dorsiflexor’s rapid neuromuscular activation is essential for maintaining the mediolateral standing balance.
4.2. Postural Sway and Joint Moment Response Followed Perturbations
The secondary finding of this study is that the CoP took less time to reach the peak displacement and had a larger peak displacement than the CoM, and the joint moments that resisted the perturbation had an earlier and faster increase following the perturbation.
This agrees with the inverted pendulum assumption that the distance between CoP and CoM displacements was correlated to the CoM acceleration [
6,
43]. By moving the CoP quickly in the same direction as the sudden CoM displacement, the change in CoM would be decelerated and kept within the BoS [
6]. Based on the current findings, it is also anticipated that the onset sequence of CoM and CoP may depend on the pulling direction. The anterior, medial, and lateral perturbation induced earlier onset of CoP, and the posterior perturbation induced earlier onset of CoM. This may be because the posterior perturbation is less anticipated and poses a higher risk of uncertainty/falls for participants, as compared to the other three directions. The previous study also reported earlier CoM displacement following the unexpected standing perturbations, and earlier CoP displacement following the anticipated perturbations [
44]. Concerning this, the findings of this study may further suggest that more reaction time is needed for making the compensatory postural adjustment (CPA) following the posterior perturbation or backward loss of balance.
The observation that quicker and larger joint moments occurred to comply with the perturbation direction further supported the above-mentioned postural sway trend (i.e., CoP and CoM displacements). Specifically, for
anterior perturbation, the ankle dorsiflexion, knee extension and hip flexion moments showed earlier onset, reached peaks faster, and reached larger peaks. Consequently, these joint moments drove the pelvis, thigh, and shank anteriorly, resulting in anterior CoP displacement. This is contrary to a previous study reporting earlier responses of ankle plantarflexion, knee extension, and hip extension moments following perturbation induced by a backward-moving platform, which caused also the sudden forward CoM displacement with respect to the BoS [
9]. This may be due to the different perturbation methods and magnitudes. The waist-pull perturbation in this study exerted perturbation at the proximal body part (at the pelvis), while that of using a moving platform generated perturbation at the distal body part (at the foot). Further studies are needed to compare the two perturbation methods and verify this.
Similarly, this study observed that
posterior perturbation induced a quicker response in ankle plantarflexion, knee flexion, and hip extension moments to move lower limbs posteriorly. This finding is comparable to a previous study reporting earlier responses of ankle plantarflexion, knee extension, and hip extension moments, following posterior perturbation induced by a backward-moving platform [
9]. The different reaction at knee joint may be explained by the strategy in participants, where they may try to further lower the CoM by flexing the knee joints. These findings provide evidence of the joint moment changes, in response to the posterior standing perturbations and sudden backward CoM displacement, which may have been unclear/unavailable previously.
For
medial perturbation, this study observed an earlier increase and earlier reaching of the peak for hip abduction moment, and a larger peak moment for hip adduction. This is consistent with a previous study, which observed sinusoidal response of hip adduction/abduction moment following inward pushes of the pelvis [
6]. The firstly appeared increase of hip abduction moment may contribute to the quick medial CoP displacement, while the latter increase of hip adduction moment may be functioned to restore the CoP laterally and back to the dominant leg. The observed earlier/quicker moment increase in hip flexion, knee extension, and ankle plantarflexion of the dominant leg may add more evidence on the joint moment responses of the sagittal plane to the medial perturbations.
For
lateral perturbation, this study observed an earlier, quicker, and larger increase of hip adduction moment, leading to lateral CoP displacement. This echoes the previous study that reported increased corrective hip abduction moment after lateral pushes on the pelvis [
6]. Additionally, this study observed the earlier and quicker increase of hip extension, knee flexion, and/or ankle dorsiflexion moments in the sagittal plane. While the faster response of knee flexion moment occurred in both the posterior and the lateral perturbation directions in this study, future studies are needed to verify if the knee flexion moment has functioned to lower the CoM and maintain standing balance by investigating the superior-inferior or vertical movement of CoM following a perturbation. These findings build on our knowledge and understanding regarding the detailed CoP, CoM, and joint moment reactions immediately after the perturbations.
4.3. Lower-Limb Responses Tended to Be Affected by the Varying Perturbation Magnitudes
The tertiary finding of this study is that in general, the rapid responses of lower-limb muscle activities tended to be proportional to the perturbation magnitude levels. More specifically, this study observed that the larger magnitude of perturbations evoked earlier onset of lower-limb muscle EMG and MMG activities, following all four directions of waist-pull perturbations. This was consistent with the previous finding that the increasing magnitude of forward [
16,
45] and backward [
9] moving-platform perturbation could result in shorter EMG onset latencies of leg muscles, but was contrary to another study that found no effects of varying perturbation magnitudes on the leg muscles’ EMG onset latencies (anterior & posterior) [
46]. The disparity may be caused by the different range of velocities used for perturbation magnitudes. On top of the previous findings, this study supported that in the frontal plane (medial & lateral), earlier onset of muscle activities may also be evoked by the larger perturbation magnitude. Further, this study observed that the larger magnitude of perturbations evoked a larger rate of EMG activation, and a longer time to peak muscle EMG and MMG activities, following medial and lateral perturbations. To the knowledge of the authors, previous studies reported little on the rate of EMG rise and the time to peak muscle activity in response to the different levels of balance perturbations. These results collectively suggested that for young adults, the lower-limb muscle activities appeared to have the below responses to accommodate a larger magnitude of waist-pull balance perturbation: starting earlier, increasing faster immediately after start, and keeping in activation for a longer time.
Similar to the previous findings [
9,
15,
46], the peak responses of CoM displacement, CoP displacement, lower-limb joint moments, power, and angles were observed to be proportional to the perturbation magnitudes in this study. By contrast, this trend was not observed for the rapid responses of these parameters which appeared to vary for different perturbation directions. The perturbation magnitudes were position- and velocity-controlled in this study, and the pulling durations of “small”, “medium” and “large” magnitudes were set to be the same. This may explain why the onset latencies and time to peak following some directions of pulls were not proportional to the perturbation magnitudes. Nevertheless, following the medial perturbation, lower-limb joint rapid responses were all found to be affected by the different perturbation magnitudes. This may account for why the stepping strategies and the foot elevations were more frequently observed under the large magnitude of the medial perturbation. Future studies can be conducted to verify this.
In addition, this study could be innovative in using the balance perturbations that were tailored to the participant’s stature. Some previous studies have attempted to normalize the force of perturbation to the bodyweight [
7]. However, regarding the position-controlled perturbations, very few attempts have been made to minimize the possible confounding effects of body height. The different perturbation magnitudes, i.e., pulling displacements, were divided by the participant’s height in this study, which may make the finding of different perturbation magnitudes’ effects on balance response more reliable and generalizable.
4.4. Rapid Power and Angle Responses Were Consistent in Proximal Joints
Regarding the joint angle and power responses, this study observed that the unexpected waist-pull perturbations would evoke the rapid power and angle responses more consistently in hip and/or knee joints, which are proximal lower-limb joints. Joint power was calculated by multiplying the angular velocity with the joint moment. Thus, the power generation would indicate a joint’s accelerating motion, and the power absorption would indicate a joint’s decelerating motion. The onset latency and time to peak results of this study may thus suggest that the anterior, posterior, medial, and lateral perturbations would evoke an earlier hip decelerating extension motion, earlier knee decelerating flexion motion, earlier hip accelerating abduction motion, and earlier abduction and flexion motions, respectively. Previous studies have rarely reported the onset sequence or the sequence of reaching a peak in hip, knee, and ankle joint motions following waist-pull perturbations. One study reported that the suddenly forward-moving platform evoked early joint motions of ankle plantarflexion, knee extension, and hip extension [
16], which has been different from the early onset of joint motions following anterior/posterior waist-pulls in this study. Such differences may be caused by the different perturbation locations. Consistent rapid response of joint angle and power at the proximal lower-limb joints may be because the pulling perturbations were exerted on the pelvis. The proprioceptive receptors in hip and/or knee joints may detect the perturbation signal earlier, leading to more consistent compensatory responses than the ankle joint. Further studies are needed to verify this.
4.5. Rapid Response of MMG Signals Occurred in Hip Muscles
This study applied the MMG technology, in an attempt to preliminarily investigate the muscle mechanical activities in response to the sudden perturbations. The detected MMG onset latencies were earlier than those of EMG signals, which did not adhere to the temporal sequence that the onset of electrical activity measured by EMG should precede the onset of muscle vibration measured by MMG [
21,
40]. This indicates that the detected rapid response of MMG signals in this study may not be generated by the active and voluntary muscle contraction, but by the passive and involuntary muscle movement following the waist-pull perturbation instead. This is further supported by the observed earliest MMG onset latencies at hip muscles, which have been the closest to the perturbation location in this study. While previous studies have reported the reliable use of MMG to reflect the onset of muscle’s voluntary isometric or concentric contractions in sitting and static positions [
40,
47], this study preliminarily applied it in standing and dynamic situations. However, it should be noted that the current processing method of MMG signals was not able to exclude the noise of passive body-segment movements caused by waist-pull perturbations, and the presented results were not generated by the active and voluntary muscle contraction in response to the sudden waist-pull perturbation. Previous studies have also reported that the location of the sensor influenced the captured MMG signals [
48]. Further optimization of the algorithm and experimental set-up is needed to identify an optimal MMG sensor location and achieve the accurate estimation of lower-limb muscles’ active and voluntary rapid contractile responses during dynamic standing situations in the future. The findings of this study on MMG data may serve as a steppingstone and inspire future studies. It may also help to apply some ultrafast imaging technologies to visualize the muscle activity from outside to inside of the human body [
40,
49,
50,
51,
52,
53,
54].
4.6. Limitations
There are several limitations of this study. Firstly, this study normalized the EMG or MMG signals with reference to the baseline value during unperturbed standing. After carefully reviewing the Consensus for Experimental Design in Electromyography (CEDE) recommendations [
55] and the current study’s protocol, the current practice of amplitude normalization may be acceptable. However, considering the leg muscles’ rapid activation, e.g., rate of EMG rise, would be affected by the normalization method, future efforts should be made to identify an optimal normalization procedure of the EMG/MMG signals in balance-perturbation-related studies.
Secondly, the EMG sensor placement in this study was based on clinical practice and somewhat obsolete. Future studies shall optimize the EMG electrode locations based on the innervation zone of each muscle [
56]. It is also possible that the crosstalk between the EMG of the investigated muscles may exist in this study, although such crosstalk shall be minimal, since the anatomical positions of investigated muscles, the locations of EMG sensor placement, and the design of EMG sensors have been carefully reviewed and determined based on the available guidelines in this study.
Thirdly, it appeared that the processed onset latencies of MMG signals in this study were due to the inertia and involuntary muscle movement following the sudden waist-pulling passively, rather than the active and voluntary muscle contraction in response to the perturbation. More efforts are needed to look into how to distinguish and extract the MMG signals generated from the active and voluntary muscle contraction from those generated from the passive and involuntary muscle movement in the future.
Another limitation is that a small number of healthy young participants were recruited in this pilot study. It should be noted that the range of 12 participants’ lower-limb responses was generally large for the captured signals, except for the postural sway signals. The large range could partly be caused by the sampling error of small sample size. A larger sample size will be needed to reduce the effects of between-individual difference on the outcomes. In addition, the specific sudden pulling direction and magnitude was randomized and blinded to each participant during the experiment, and the mean value of the three repeated perturbation trials was used for statistical analysis in this study. It is so far unclear how the first trial reaction may influence the results and may be investigated in the future.

 ,
, 


 or
or  : pairwise comparison. Significant differences in post hoc pairwise comparisons (p < 0.05) were indicated by the: ** for the main effect of postural sway factor; * for the simple main effect of postural sway factor; ## for the main effect of magnitude factor; # for the simple main effect of magnitude factor).


