Article

Sensitive and Stable Electrochemical Sensor for Folic Acid Determination Using a ZIF-67/AgNWs Nanocomposite

1
Beijing Laboratory of Food Quality and Safety, College of Food Science and Nutritional Engineering, China Agricultural University, Beijing 100083, China
2
Department of Nutrition and Health, China Agricultural University, Beijing 100091, China
*
Author to whom correspondence should be addressed.
Biosensors 2022, 12(6), 382; https://doi.org/10.3390/bios12060382
Submission received: 6 May 2022 / Revised: 25 May 2022 / Accepted: 30 May 2022 / Published: 31 May 2022
(This article belongs to the Section Biosensor Materials)

Abstract

:
An electrochemical sensor using silver nanowires (AgNWs)-doped with a zeolite-like metal–organic framework (ZIF-67) was developed for highly sensitive and stable determination of folic acid (FA). The ZIF-67/AgNWs nanocomposite was prepared by a one-step reaction via a template method and drop-coated onto the surface of a screen-printed carbon electrode (SPCE) to form a ZIF-67/AgNWs@SPCE electrochemical sensing platform. The electrochemical square wave voltammetry (SWV) curve for this sensing platform was measured in an electrolyte solution containing FA under the optimum experimental conditions. The redox peak current of FA (IFA) increased with increases in the FA concentration (CFA). There was a linear relationship between IFA and CFA in the range of 0.1 μM to 10 μM, and the determination limit was 30 nM. The ZIF-67/AgNWs@SPCE was used as an electrochemical sensor for FA which maintained a good stability over 7 days and showed good determination performance in real samples with a high recovery rate (100.9–102.1%, n = 6).

1. Introduction

Metal–organic frameworks (MOFs) are crystalline porous materials with a periodic network structure formed by self-assembly of transition metal ions with organic ligands. These materials are of interest because of their high porosities, high specific surface areas, controllable morphologies, and chemical tunability [1]. Unfortunately, most pristine MOFs have low electrical conductivity, which limits their use in electrochemical sensing. Zeolite imidazole frameworks (ZIFs) are MOFs composed of transition metal cations and organo-imidazole ester junctions [2]. ZIFs have large specific surface areas and good chemical and thermal stability [3]. ZIF-67 consists of a metal ion (Co2+) and an organic compound (2-methylimidazole). Interestingly, ZIF-67 combines the benefits of both MOFs and conventional zeolites [4]. Therefore, the excellent stability makes it possible to synthesize ZIF-67 in an environmentally friendly and economical way. Without high temperature or high pressure, room temperature is enough for the reaction to synthesize well-formed framework structures. ZIF-67 and its derivatives have been studied for the usage in molecular separation [5], gas adsorption [6], electrochemical catalysis [7], and many other applications. Similar to conventional MOFs, ZIF-67 has insulating properties. Therefore, increasing its conductivity would be beneficial for its application in electrochemical sensing. Many different multifunctional MOF-based composites have been investigated to enhance the electrical conductivity. The performance of composites is usually superior to that of individual components because of the synergistic effect between functional units [1]. Combining other components or structures with ZIF-67 to make compounds with better properties than pure ZIF-67 is an effective approach, and it is of interest to explore the characteristics and applications of ZIFs [8].
One-dimensional metallic nanomaterials have been widely investigated for their unique electrical properties. As a result, these types of nanomaterials are widely used in optoelectronics and nanoelectronics because of their high aspect ratios and excellent densities [9,10]. Silver, in particular, has high electrical conductivity, and silver nanowires (AgNWs) show great potential for a wide range of practical applications [11]. Nanostructured silver often has poor stability and easily aggregates, which obviously limits its practical application. As conductive fillers for the preparation of AgNW conductive polymer nanocomposites, the usage of AgNWs retains the advantages of high surface area and high electrical conductivity, while compensates for the disadvantages of AgNWs [12,13].
Folic acid (FA), commonly known as vitamin B9, is a water-soluble vitamin [14]. Vitamins are organic substances found in foods and they are essential in small quantities for normal body functioning [15]. Serum FA levels below the 5 ng mL−1 indicate a deficiency, which leads to a lot of diseases [16]. FA in the blood is mainly present as 5-methyltetrahydrofolate, and a deficiency of it leads to hyperhomocysteinemia [17,18]. Lack of FA can also lead to a range of health problems in pregnant women [19]. The requirement for FA monitoring has driven development of a variety of analytical devices for FA determination using HPLC [20], spectrophotometric [21], colorimetric [22], and fluorometric [23] methods. However, these devices have some major disadvantages, such as high setup costs, time-consuming procedures, and the requirement for specialized knowledge for instrument operation [24].
Electrochemical sensing devices generally consist of two main components: the sensing material and the transducer. The sensing material interacts with the target and undergoes a chemical change (electron transfer), and the signal generated by this change is converted into a readable signal by a converter [25]. Compared to other optical sensing methods, such as the colorimetric method based on Lambert–Beer law, electrochemical sensors are simple to operate and have a higher sensitivity. Recently, nanomaterials have been applied to the design of electrochemical sensors to improve the analytical performance and the stability of electrochemical sensors [26]. For example, Venu et al. synthesized Co3O4/reduced graphene oxide (rGO) nanocomposites for the construction of electrochemical sensors for the determination of FA, which exhibited effective electron-mediated behavior with a determination limit of 19 μM. However, the material was synthesized under high pressure and high temperature [27]. Abdelwahab et al. synthesized gold nanoclusters (AuNCs)/activated graphene (AGR)/MWCNT nanocomposite, which could be obtained by electrochemical reduction with an enhanced current response to FA oxidation with a determination limit as low as 0.09 μM. Additionally, the electrochemical sensor was used for the determination of real samples [28]. Electrochemical sensors have been developed for FA monitoring [29,30,31,32,33,34], but these methods always have complex and costly preparation conditions, and the stability of the prepared sensors need to be improved.
Herein, we developed an electrochemical sensor using a ZIF-67/AgNWs nanocomposite for stable and sensitive determination of FA (Scheme 1). The ZIF-67/AgNWs nanocomposite was prepared by a one-step reaction via a template method and drop-coated onto a screen-printed carbon electrode (SPCE) to form a ZIF-67/AgNWs@SPCE electrochemical sensing platform. FA underwent an oxidation reaction, which increased the redox peak current of FA (IFA). We explored the use of the ZIF-67/AgNWs@SPCE sensor to detect FA by plotting the linear relationship between IFA and the FA concentration (CFA). The sensor showed stable and sensitive determination performance in biological samples.

2. Materials and Methods

2.1. Chemicals

AgNWs were purchased from Leader-Nano (Jining, China, http://www.leadernano.com/ (accessed on 26 November 2021)). Uric acid (UA), 2-Methylimidazole, Co(NO3)2·6H2O, and FA were purchased from Shanghai Maclean Biochemical Technology Co. (Shanghai, China, http://www.macklin.cn/ (accessed on 29 November 2021)). Glucose and anhydrous methanol were purchased from Tianjin Yongda Reagent Co. (Tianjin, China, http://www.tjydhxsj.com/ (accessed on 20 October 2021)). Ascorbic acid (AA) was purchased from Beijing Aoboxing Biotechnology Co. (Beijing, China, https://bjabx.company.lookchem.cn/ (accessed on 15 August 2021)). Analytical grade NaCl, KCl, and CaCl2 were purchased from Shanghai Sinopharm Chemical Reagent Co. (Shanghai, China, https://www.sangon.com/ (accessed on 20 October 2021)). Serum samples, vitamin B1, vitamin B2 were purchased from Beijing Solarbio Science & Technology Co. (Beijing, China, http://solarbio.bioon.com.cn/ (accessed on 17 January 2022)). All chemicals and reagents were used directly without purification. Double distilled water and phosphate-buffered saline containing 0.9% NaCl (PBS) were used for pH adjustment in the experiments.

2.2. Apparatus

Scanning electron microscopy (SEM) images and Energy dispersive spectrometer (EDS) were obtained using a ZEISS Gemini SEM 300 (Jena, Germany, https://www.zeiss.com.cn/microscopy/home.html (accessed on 9 January 2022)). Fourier transform infrared (FT-IR) spectra were measured using a PerkinElmer Frontier (Akron, OH, USA, https://www.perkinelmer.com.cn/ (accessed on 14 December 2021)). UV-vis absorption spectra were measured using a UV-2550 spectrophotometer (Shimadzu, Kyoto, Japan, https://www.shimadzu.com.cn/ (accessed on 17 January 2022)). Powder X-ray diffraction (XRD) was performed using graphitized monochromatic Co Kα radiation by a Rigaku Ultima IV (Rigaku, Tokyo, Japan, https://www.nihonkohden.com/ (accessed on 31 December 2021)). X-ray photoelectron spectroscopy (XPS) was performed using a K-Alpha spectrometer (Thermo Fisher Scientific, Waltham, MA, USA, https://www.thermofisher.cn/cn/zh/home.html (accessed on 2 January 2022)). Raman spectra were measured using a LabRAM HR Evolution micro confocal Raman spectrometer (HORIBA Jobin Yvon S.A.S., Palaiseau, France, https://www.horiba.com/int/ (accessed on 26 December 2021)). Electrochemical profiles in cyclic voltammetry (CV) and square wave voltammetry (SWV) modes were detected using a CHI-1080C electrochemical workstation (Shanghai, China, http://www.chinstr.com/ (accessed on 8 December 2021)). Electrochemical impedance spectra (EIS) were measured using a CHI-760E electrochemical workstation (Shanghai, China). A three-electrode system using a modified SPCE was used for electrochemical measurements. Each electrochemical was repeated six times and the results were averaged.

2.3. Preparation of the ZIF-67/AgNWs Nanocomposites

ZIF-67/AgNWs were synthesized in one step using a template method. First, 1.5 mL 5 mg mL−1 AgNWs was slowly added dropwise to a methanol solution containing 109.3 mg dimethylimidazole under stirring for 20 min to obtain mixture A. Next, 87 mg Co(NO3)2·6H2O was dissolved in 10 mL methanol to obtain solution B. Afterward, solution B was added dropwise to solution A and the resulting mixture was stirred vigorously for 1 min. After stirring, the mixture was left to stand for 24 h at room temperature [35,36]. After the reaction was finished, the mixture was centrifuged at 12,000 rpm for 15 min. The resultant precipitate was repeatedly washed with methanol and then dried under vacuum at 40 °C. The purified ZIF-67/AgNWs complex was dispersed in methanol (1 mg mL−1) for subsequent use. Blank ZIF-67 was prepared using the same method but without AgNWs.

2.4. Preparation of ZIF-67/AgNWs@SPCE

The solution of ZIF-67/AgNWs (5 μL) was dropped on the surface of a SPCE, which was then dried in air at room temperature, the sensing platform based on ZIF-67/AgNWs@SPCE was achieved.

2.5. Electrochemical Measurements and Electrochemical Sensor Fabrication

CV, EIS, and SWV of bare SPCE and SPCE modified with ZIF-67 and ZIF-67/AgNWs were measured at different pH values. The bare or modified SPCE was immersed in a buffer containing 1 mM [Fe (CN)6]3−/4− as a redox probe. The SWV curves of the ZIF-67/AgNWs@SPCE platform were measured in PBS containing FA under the optimum conditions. The final CFA was regulated between 0.1 and 10 μM. The relationship between IFA (redox peak current intensity of FA) and CFA was plotted for use with the electrochemical sensor for accurate FA determination.

2.6. Selectivity, Stability, and Practicality of the Electrochemical Sensor

Under the optimum experimental conditions, the ZIF-67/AgNWs@SPCE sensing platform was used as an electrochemical sensor for determination of FA (1 μM). The signal responses obtained with potential interfering substances, including UA, AA, K+, Na+, Cl, lactate, vitamin B1, vitamin B2 and glucose, were evaluated at a concentration of 0.1 mM. The value of IFA was used to evaluate the selectivity of the sensor. The SWV signal was measured several times in succession in a buffer containing 1 μM FA. The stability was measured by the SWV method for 10 μM FA for 20 consecutive measurements. The sensor was also kept at 4 °C and tested every 24 h in the presence of FA (10 μM).
The practicality of the sensor was evaluated for determination of FA in real biological samples. Serum samples were diluted 10-fold with PBS (1 mM, pH = 7.4), and then a series of solutions was prepared with different concentrations of FA. The ZIF-67/AgNWs@SPCE sensing platform was immersed in each solution and the SWV curve was measured. The CFA in each sample was calculated from the linear relationship between IFA and CFA. Each measurement was repeated six times and the results are expressed as the mean ± standard deviation (SD).

3. Results and Discussion

3.1. Microscopic Morphological Characterization

The microstructural and morphological characteristics of the prepared nanomaterials were characterized by SEM. The ZIF-67 had a typical regular octahedron structure with a size of several hundred nanometers (Figure 1a). The ZIF-67/AgNWs composites had a pendant-like heterogeneous structure with the ZIF-67 nanoparticles located around the AgNWs (Figure 1b) [35]. Enlargement of the SEM images showed that the outer surface of ZIF-67/AgNWs was rough, whereas the surface of the blank ZIF-67 was relatively smooth. The binding of AgNWs to ZIF-67 did not affect the framework structure of ZIF-67. The AgNWs were homogeneous with a width of approximately 60 nm and lengths of 2–3 μm (Figure 1c). Furthermore, EDS was carried out showing the elemental composition of ZIF-67/AgNWs (Figure S1), which verified the presence of Co and Ag. Additionally, the weight and atomic percentages were described at the table of elemental compositions of ZIF-67/AgNWs in Figure S1 inset. The characterization results indicated that the ZIF-67/AgNWs nanocomposite was successfully prepared.

3.2. Spectral Characterizations

The prepared nanomaterials were characterized using various spectroscopic techniques. UV-vis absorption spectra of ZIF-67 and the ZIF-67/AgNWs dispersed in methanol were obtained (Figure 2a) [36]. For ZIF-67 and the ZIF-67/AgNWs, the products showed characteristic absorption bands at 600 nm with Co2+ tetrahedral connections. The Raman spectrum of the ZIF-67/AgNWs was similar to that of pure ZIF-67 (Figure 2b). Several low-energy Raman bands (<500 cm−1) were derived from the vibrational modes of the metallic ligands, which indicated that the imidazole ligands coordinated with the Co center. Raman peaks were assigned to C-N vibrations (1143 cm−1), C-H vibrations (3132 cm−1, 1450 cm−1), and symmetric and asymmetric methyl C-H vibrations (2921 cm−1) [37]. The ZIF-67/AgNWs exhibited strong and broad absorption bands because of the synergistic effect arising from the modification of ZIF-67 with AgNWs, which greatly amplified the Surface-Enhanced Raman Scattering (SERS) signal [38]. In the FT-IR spectra for the two products (Figure 2c), bands at 690 cm−1 and 748 cm−1 were assigned to out-of-plane bending of the imidazole ring, and peaks at 990 cm−1 and 1303 cm−1 were assigned to in-plane bending. A peak at 1577 cm−1 was attributed to stretching of the imidazole ring, and a peak at 1697 cm−1 was assigned to N-H bending vibration. A band at 1300–1500 cm−1 was attributed to whole ring stretching. Peaks at 2924 cm−1 and 3136 cm−1 were assigned to aliphatic and aromatic C-H stretching of imidazole, respectively [35].
The XRD diffraction pattern of ZIF-67 (Figure 2d) matched the previously reported XRD pattern for ZIF-67 crystals. The XRD pattern of the ZIF-67/AgNWs was almost identical to that of ZIF-67 but with the addition of a characteristic peak for silver (JCPDS NO. 040783). These results indicated that the AgNWs were successfully combined with ZIF-67 and had a negligible effect on the crystal structure of ZIF-67 [35,38]. The XPS spectra of the ZIF-67/AgNWs showed characteristic peaks for Co 2p, O 1s, N 1s, C 1s, and Ag 3d (Figure 2e) [35,38]. For ZIF-67, no Ag 3d peak was present in the XPS spectrum. These results showed that the AgNWs were combined with ZIF-67. The XPS spectra of Co 2p showed fine binding energy features (Figure 2f). Bands at 796.28 and 780.78 eV were assigned to Co 2p1/2 and Co 2p3/2, respectively. These peaks showed that both Co2+ and Co+ valence states coexisted [35].

3.3. Electrochemical Performance of the Modified Electrode

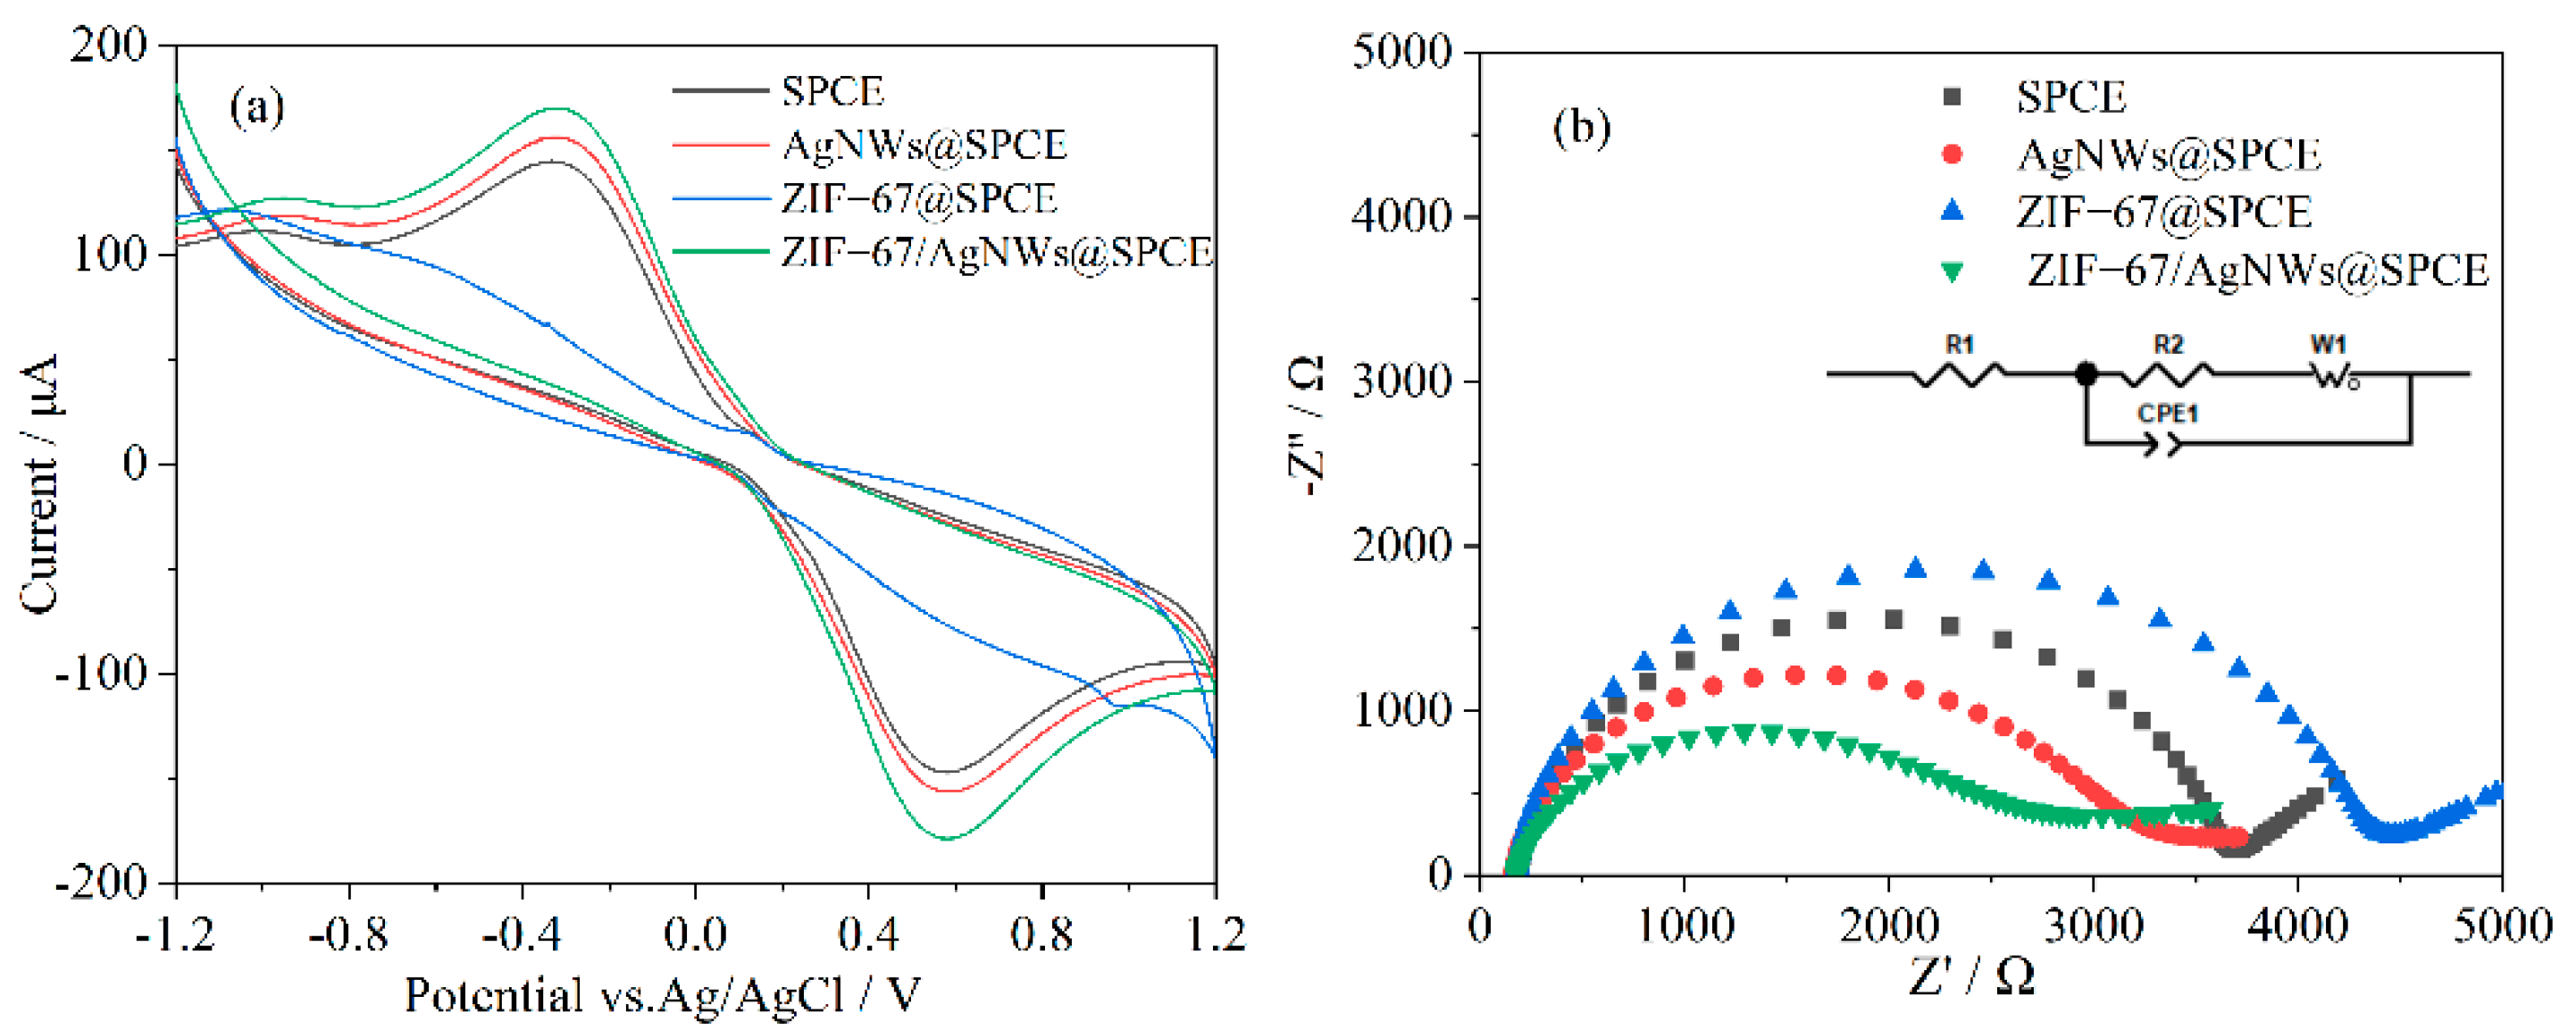
The preparation procedure of ZIF-67/AgNWs@SPCE sensing platform was evaluated by measuring CV and EIS curves for SPCE with different modifications in buffers containing [Fe (CN)6]3−/4− as redox probes. The peak current of ZIF-67@SPCE was lower than that of bare SPCE (Figure 3a), and this was attributed to the low conductivity of ZIF-67. The AgNWs@SPCE showed a slightly higher peak current than bare SPCE because of the good conductivity of the AgNWs. Compared with blank ZIF-67, the ZIF-67/AgNWs had a higher peak current. These results indicated there was a synergistic effect between ZIF-67 and the AgNWs promoted the electrical conductivity of the ZIF-67/AgNWs nanocomposite. The AgNWs increased the effective electrode area and conductivity of ZIF-67, which improved the charge transfer rate and provided rapid and sensitive electrochemical measurement. For the electrochemical determination of FA, the aniline structure of FA was oxidized to p-benzoquinone, generating an electron transfer and a characteristic oxidation peak [39]. ZIF-67/AgNWs@SPCE had the largest oxidation current compared to other modified electrodes (Figure S2). In addition, the single oxidation peak indicated that the process of FA oxidation was irreversible.
The interfacial properties of the different modified SPCE surfaces were assessed using EIS curves (Figure 3b). The charge transfer resistance (Rct) was calculated from the semicircle diameter of the Nyquist plot, and its value was influenced by the electron transfer kinetics of the redox probe at the electrode interface (Table S1). Large semicircular regions appeared when the SPCE surface was modified with different materials, which indicated resistance to charge transfer. The ZIF-67@SPCE had the largest diameter and the AgNWs@SPCE had a slightly smaller diameter than bare SPCE. The ZIF-67/AgNWs@SPCE had the smallest diameter. The trends for the redox currents and Rct were consistent with the CV results, which further proved that the ZIF-67/AgNWs@SPCE sensing platform was successfully prepared.

3.4. Sensitivity of the Electrochemical Sensor

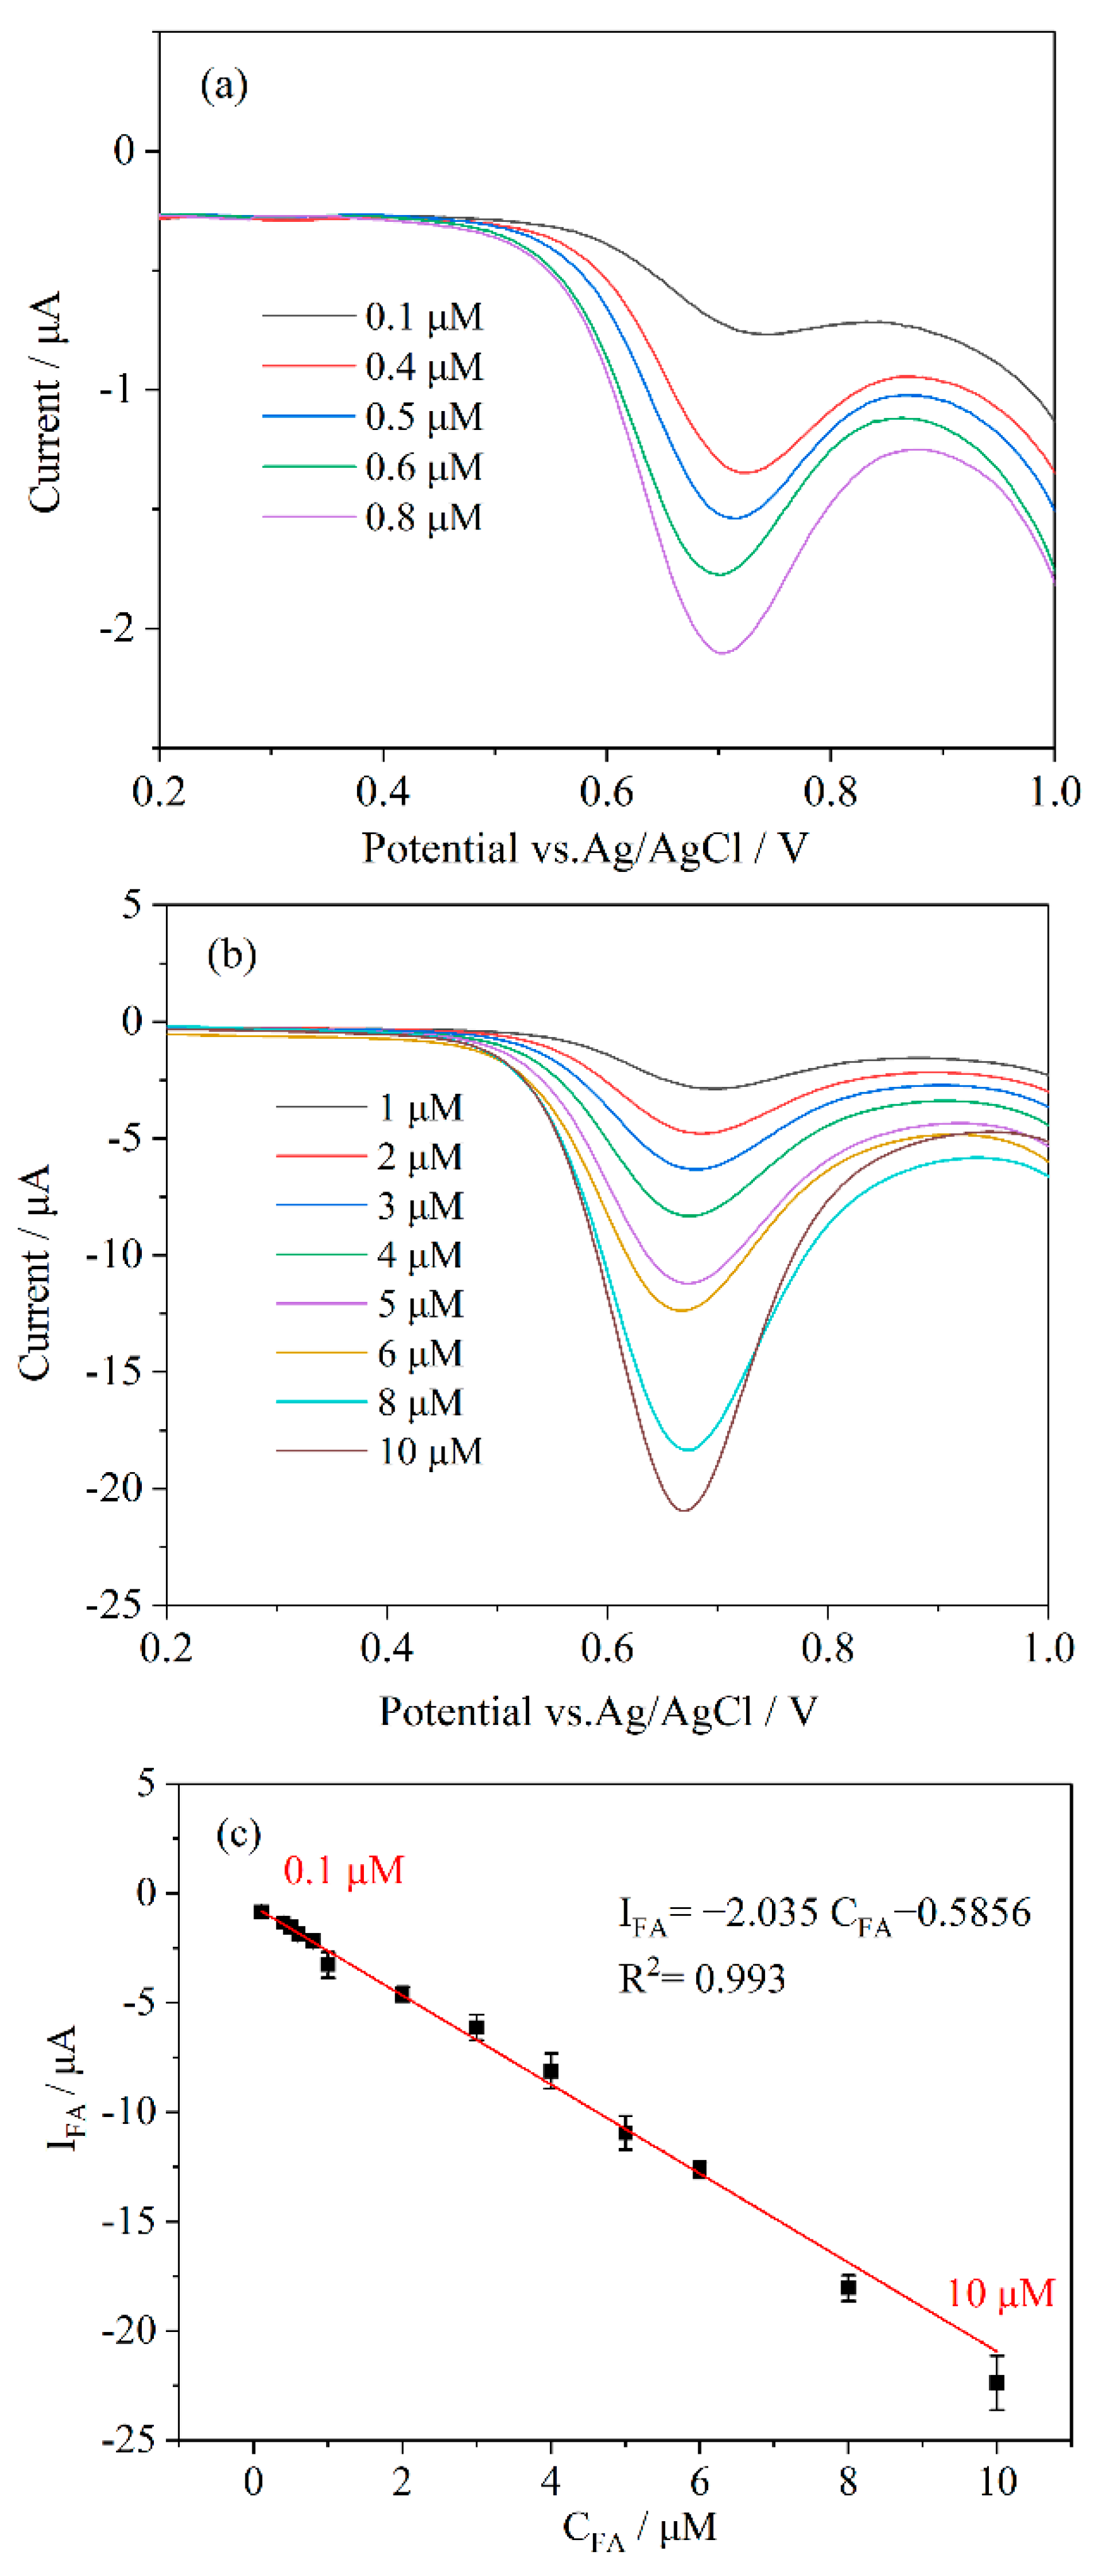
Under the optimum electrochemical measurement conditions at pH 7.4 (Figure S3), the SWV curves were measured using the ZIF-67/AgNWs@SPCE sensing platform in electrolyte solution with different concentrations of FA. The IFA, which peaked at 0.65 V, increased with gradual increases in the CFA from 0.1 μM to 10 μM (Figure 4a,b). There was a good linear relationship (IFA = −2.035 CFA −0.5856, R2 = 0.993) between IFA and CFA (Figure 4c). The LOD calculated using a signal-to-noise ratio of three was approximately 30 nM. These results showed that the electrochemical sensor was highly sensitive for the determination of FA.

3.5. Selectivity of the Electrochemical Sensor

To investigate the selectivity of the electrochemical signal response of the FA electrochemical sensor, the SWV curves of ZIF-67/AgNWs@SPCE were measured with the target FA and potential interfering substances (UA, AA, K+, Na+, Cl, lactate, vitamin B1, vitamin B2 and glucose). The selectivity and sensitivity of the electrochemical sensor for FA were assessed by comparing the IFA values (Figure 5). The IFA was slightly affected when each interfering substance (0.1 mM) was added, but 1 μM FA produced the largest changes in the IFA. The interfering substances showed a little effect on the IFA, even when they were presented at a concentration 100 times higher than FA. These results indicated that the sensor had high selectivity for FA determination and can effectively overcome the influence of potential interfering substances.

3.6. Stability of the Electrochemical Sensor

Twenty consecutive measurements of 10 μM FA were performed using the SWV method to test the stability of the sensor. The SWV signal remained stable during this process (Figure 6a). The sensor was also tested every 24 h in the presence of FA (10 μM), and the signal peak remained stable (Figure 6b). These results showed that the sensor maintained good stability over 7 days and multiple sensing cycles.

3.7. Determination Performance of the Electrochemical Sensor in Real Samples

The practicality of the electrochemical sensor was evaluated using real biological samples. The levels of FA in real serum samples with or without FA were determined from the IFA and CFA plot constructed for reference samples (Figure 4c). The CFA assay values (Table 1) were close to the spiked values with high determination recovery rates (100.9–102.1%) and low RSDs (2.459–3.065%) (n = 6). The CFA assay values agreed with the spiked values. These results indicated that the developed electrochemical sensor using the ZIF-67/AgNWs@SPCE sensing platform was capable of accurately capturing and detecting FA in real biofluid samples with high reliability and practicality.

3.8. Comparison of the Electrochemical Sensor with Other Methods

Compared with previous electrochemical methods (Table 2), the electrochemical sensing platform in this work demonstrated significant advantages in low concentration. The determination limit of the present sensor is 10–100 times less than most other platforms, and this could be attributed to the excellent electrochemical properties of the ZIF-67/AgNWs nanomaterials. Although the determination limits are similar to some other sensing platforms, these platforms are more complicated and expensive than our sensor. Moreover, our sensor had an excellent stability after a 7-day storage, which was benefited from the stability of ZIFs.

4. Conclusions

An electrochemical sensor was designed for highly sensitive and stable determination of FA. There was an excellent linear relationship between IFA and CFA. The linear range for determination of FA was 0.1 μM to 10 μM and the determination limit was 30 nM. This electrochemical sensor showed high sensitivity for FA and maintained good stability over 7 days. Responses of the sensor to potential interfering substances were very weak. The sensor could also detect FA in human serum with a low RSD and high recovery. Our experimental results show that the electrochemical sensor is reliable and practical for the determination of FA in real samples.

Supplementary Materials

The following supporting information can be downloaded at: www.mdpi.com/article/10.3390/bios12060382/s1, Figure S1. The EDS spectrum of ZIF-67/AgNWs. Figure S2. CV curves measured in the presence of FA (10 μM). Figure S3: SWV curves of ZIF-67/AgNWs@SPCE in PBS with FA (10 μM) and at different pH values (a). Relationship between pH and IFA (b). All measurements were performed six times. Table S1. The value of different entities.

Author Contributions

Y.S.: Conceptualization, Data curation, Formal analysis, Visualization, Software, Writing—original draft. X.W.: Writing—Review and Editing. H.Z.: Supervision, Writing—Review and Editing, Project administration, Funding acquisition. All authors have read and agreed to the published version of the manuscript.

Funding

This work was supported by the 2115 Talent Development Program of China Agricultural University [grant number 00109024] and the National Natural Science Foundation of China [grant number 31972068].

Institutional Review Board Statement

Not applicable.

Informed Consent Statement

Not applicable.

Data Availability Statement

Data available on request from the authors.

Conflicts of Interest

The authors declare no conflict of interest.

References

  1. Yan, J.; Liu, T.; Liu, X.; Yan, Y.; Huang, Y. Metal-organic framework-based materials for flexible supercapacitor application. Co-ord. Chem. Rev. 2021, 452, 214300. [Google Scholar] [CrossRef]
  2. Zhong, G.; Liu, D.; Zhang, J. The Application of ZIF-67 and Its Derivatives: Adsorption, Separation, Electrochemistry and Catalysts. J. Mater. Chem. A 2017, 6, 1887–1899. [Google Scholar] [CrossRef]
  3. Bennett, T.D.; Tan, J.-C.; Moggach, S.A.; Galvelis, R.; Mellot-Draznieks, C.; Reisner, B.A.; Thirumurugan, A.; Allan, D.R.; Cheetham, A.K. Mechanical properties of dense zeolitic imidazolate frameworks (zifs): A high-pressure x-ray diffraction, nanoindentation and computational study of the zinc framework zn(im)2, and its lithium-boron analogue, LiB(Im)4. Chem. A Eur. J. 2010, 16, 10684–10690. [Google Scholar] [CrossRef]
  4. Yang, Q.; Ren, S.; Zhao, Q.; Lu, R.; Hang, C.; Chen, Z.; Zheng, H. Selective separation of methyl orange from water using magnetic ZIF-67 composites. Chem. Eng. J. 2018, 333, 49–57. [Google Scholar] [CrossRef]
  5. Tran, N.T.; Kwon, H.T.; Kim, W.-S.; Kim, J. Counter-diffusion-based in situ synthesis of ZIF-67 membranes for propylene/propane separation. Mater. Lett. 2020, 271, 127777. [Google Scholar] [CrossRef]
  6. Ping, E.; Ji, H.; Zhang, L.; Zhou, Y.; Ding, C.; Chen, X. Kinetic and Chemical Affinity Quantum Sieving Effects of ZIF-67 for H2 and D2 and Gas Chromatographic Separation of Hydrogen Isotopes on Columns Packed with ZIF-67@NH2-γ-Al2O3. ACS Appl. Energy Mater. 2021, 4, 10857–10866. [Google Scholar] [CrossRef]
  7. Sun, S.; Tang, Y.; Wu, C.; Wan, C. Phytic acid functionalized ZIF-67 decorated graphene nanosheets with remarkably boosted electrochemical sensing performance. Anal. Chim. Acta 2020, 1107, 55–62. [Google Scholar] [CrossRef]
  8. Bibi, S.; Pervaiz, E.; Ali, M. Synthesis and applications of metal oxide derivatives of ZIF-67: A mini-review. Chem. Pap. 2021, 75, 2253–2275. [Google Scholar] [CrossRef]
  9. Zhao, J.; Calin, B.; Han, J.; Lu, J.P. Quantum transport properties of ultrathin silver nanowires. Nanotechnology 2003, 14, 501. [Google Scholar] [CrossRef] [Green Version]
  10. Zhang, R.; Engholm, M. Recent Progress on the Fabrication and Properties of Silver Nanowire-Based Transparent Electrodes. Nanomaterials 2018, 8, 628. [Google Scholar] [CrossRef] [Green Version]
  11. Kumar, A.; Shaikh, M.O.; Chuang, C.H. Silver Nanowire Synthesis and Strategies for Fabricating Transparent Conducting Electrodes. Nanomaterials 2021, 11, 693. [Google Scholar] [CrossRef]
  12. Abbasi, N.M.; Yu, H.; Wang, L.; Abdin, Z.U.; Amer, W.; Akram, M.; Khalid, H.; Chen, Y.; Saleem, M.; Sun, R.; et al. Preparation of silver nanowires and their application in conducting polymer nanocomposites. Mater. Chem. Phys. 2015, 166, 1–15. [Google Scholar] [CrossRef]
  13. Jones, R.S.; Draheim, R.R.; Roldo, M. Silver Nanowires: Synthesis, Antibacterial Activity and Biomedical Applications. Appl. Sci. 2018, 8, 673. [Google Scholar] [CrossRef] [Green Version]
  14. Amitai, Y.; Koren, G. The Folic Acid Rescue Strategy: High-Dose Folic Acid Supplementation in Early Pregnancy. JAMA Pediatr. 2015, 169, 1083–1084. [Google Scholar] [CrossRef]
  15. Pereira, D.F.; Santana, E.R.; Spinelli, A. Electrochemical paper-based analytical devices containing magnetite nanoparticles for the determination of vitamins B2 and B6. Microchem. J. 2022, 179, 107588. [Google Scholar] [CrossRef]
  16. Shulpekova, Y.; Nechaev, V.; Kardasheva, S.; Sedova, A.; Kurbatova, A.; Bueverova, E.; Kopylov, A.; Malsagova, K.; Dlamini, J.; Ivashkin, V. The Concept of Folic Acid in Health and Disease. Molecules 2021, 26, 3731. [Google Scholar] [CrossRef]
  17. Obeid, R.; Kirsch, S.H.; Kasoha, M.; Eckert, R.; Herrmann, W. Concentrations of unmetabolized folic acid and primary folate forms in plasma after folic acid treatment in older adults. Metabolism 2011, 60, 673–680. [Google Scholar] [CrossRef]
  18. Kumar, A.A.; Anusree, V.R.; Satheesh, G.; Vijayakumar, G.; Chandran, M.; Simon, L.; Lakshmi, S.; Pillai, M.R.; Jaleel, A. Hyperhomocysteinemia-related serum metabolome alterations not normalized by short-term folic acid treatment. Metabolomics 2021, 17, 47. [Google Scholar] [CrossRef]
  19. Van der Windt, M.; Schoenmakers, S.; van Rijn, B.; Galjaard, S.; Steegers-Theunissen, R.; van Rossem, L. Epidemiology and (Patho)Physiology of Folic Acid Supplement Use in Obese Women before and during Pregnancy. Nutrients 2021, 13, 331. [Google Scholar] [CrossRef]
  20. Sweeney, M.R.; McPartlin, J.; Weir, D.G.; Scott, J.M. Measurements of sub-nanomolar concentrations of unmetabolised folic acid in serum. J. Chromatogr. B 2003, 788, 187–191. [Google Scholar] [CrossRef]
  21. Modupe, O.; Maurras, J.B.; Diosady, L.L. A spectrophotometric method for determining the amount of folic acid in fortified salt. J. Agric. Food Res. 2020, 2, 100060. [Google Scholar] [CrossRef]
  22. Kanjilal, G.; Mahajan, S.N.; Rao, G.R. Colorimetric determination of folic acid in pharmaceutical preparations. Analyst 1975, 100, 19–24. [Google Scholar] [CrossRef]
  23. Chen, Z.; Wang, J.; Miao, H.; Wang, L.; Wu, S.; Yang, X. Fluorescent carbon dots derived from lactose for assaying folic acid. Sci. China Ser. B Chem. 2015, 59, 487–492. [Google Scholar] [CrossRef]
  24. Batra, B.; Narwal, V.; Kalra, V.; Sharma, M.; Rana, J. Folic acid biosensors: A review. Process Biochem. 2020, 92, 343–354. [Google Scholar] [CrossRef]
  25. Thévenot, D.R.; Toth, K.; Durst, R.A.; Wilson, G.S. Electrochemical biosensors: Recommended definitions and classification*. Anal. Lett. 2001, 34, 635–659. [Google Scholar] [CrossRef] [Green Version]
  26. Pundir, C.S.; Narwal, V.; Batra, B. Determination of lactic acid with special emphasis on biosensing methods: A review. Biosens. Bioelectron. 2016, 86, 777–790. [Google Scholar] [CrossRef]
  27. Venu, M. Simultaneous Determination of Dopamine, Uric Acid and Folic Acid with Electrochemical Techniques Based on Co3O4/rGO/CTAB Modified Carbon Paste Electrode. Int. J. Electrochem. Sci. 2018, 13, 11702–11719. [Google Scholar] [CrossRef]
  28. Abdelwahab, A.A.; Shim, Y.-B. Simultaneous determination of ascorbic acid, dopamine, uric acid and folic acid based on activated graphene/MWCNT nanocomposite loaded Au nanoclusters. Sens. Actuators B Chem. 2015, 221, 659–665. [Google Scholar] [CrossRef]
  29. Wang, Q.; Si, H.; Zhang, L.; Li, L.; Wang, X.; Wang, S. A fast and facile electrochemical method for the simultaneous detection of epinephrine, uric acid and folic acid based on ZrO2/ZnO nanocomposites as sensing material. Anal. Chim. Acta 2020, 1104, 69–77. [Google Scholar] [CrossRef]
  30. Cheraghi, S.; Taher, M.A.; Karimi-Maleh, H. Highly sensitive square wave voltammetric sensor employing CdO/SWCNTs and room temperature ionic liquid for analysis of vanillin and folic acid in food samples. J. Food Compos. Anal. 2017, 62, 254–259. [Google Scholar] [CrossRef]
  31. Raoof, J.B.; Teymoori, N.; Khalilzadeh, M.A.; Ojani, R. A high sensitive electrochemical nanosensor for simultaneous determination of glutathione, NADH and folic acid. Mater. Sci. Eng. C 2015, 47, 77–84. [Google Scholar] [CrossRef]
  32. Benvidi, A.; Dehghani-Firouzabadi, A.; Mazloum-Ardakani, M.; Mirjalili, B.-B.F.; Zare, R. Electrochemical deposition of gold nanoparticles on reduced graphene oxide modified glassy carbon electrode for simultaneous determination of levodopa, uric acid and folic acid. J. Electroanal. Chem. 2015, 736, 22–29. [Google Scholar] [CrossRef]
  33. Erçarıkcı, E.; Aksu, Z.; Kıranşan, K.D.; Topçu, E. Graphene paper with electrodeposited NiCo2S4 nanoparticles as a novel flexible sensor for simultaneous detection of folic acid and ascorbic acid. Diam. Relat. Mater. 2021, 121, 108713. [Google Scholar] [CrossRef]
  34. Winiarski, J.P.; Rampanelli, R.; Bassani, J.C.; Mezalira, D.Z.; Jost, C.L. Multi-walled carbon nanotubes/nickel hydroxide composite applied as electrochemical sensor for folic acid (vitamin B9) in food samples. J. Food Compos. Anal. 2020, 92, 103511. [Google Scholar] [CrossRef]
  35. Sun, D.; Yang, D.; Wei, P.; Liu, B.; Chen, Z.; Zhang, L.; Lu, J. One-Step Electrodeposition of Silver Nanostructures on 2D/3D Metal-Organic Framework ZIF-67: Comparison and Application in Electrochemical Detection of Hydrogen Peroxide. ACS Appl. Mater. Interfaces 2020, 12, 41960–41968. [Google Scholar] [CrossRef]
  36. Li, Q.; Gong, S.; Zhang, H.; Huang, F.; Zhang, L.; Li, S. Tailored necklace-like Ag@ZIF-8 core/shell heterostructure nanowires for high-performance plasmonic SERS detection. Chem. Eng. J. 2019, 371, 26–33. [Google Scholar] [CrossRef]
  37. Wang, C.; Yang, F.; Sheng, L.; Yu, J.; Yao, K.; Zhang, L.; Pan, Y. Zinc-substituted ZIF-67 nanocrystals and polycrystalline membranes for propylene/propane separation. Chem. Commun. 2016, 52, 12578–12581. [Google Scholar] [CrossRef]
  38. Usov, P.M.; McDonnell-Worth, C.; Zhou, F.; MacFarlane, D.; D’Alessandro, D. The Electrochemical Transformation of the Zeolitic Imidazolate Framework ZIF-67 in Aqueous Electrolytes. Electrochim. Acta 2015, 153, 433–438. [Google Scholar] [CrossRef]
  39. Gu, L.; Li, S.; Peng, L.; Zhang, J. Anodic Voltammetric Determination of Folic Acid Using Carbon Paste Electrode Modified with Amino-silicon Oil. PTCA 2010, 46, 503–505, 508. [Google Scholar]
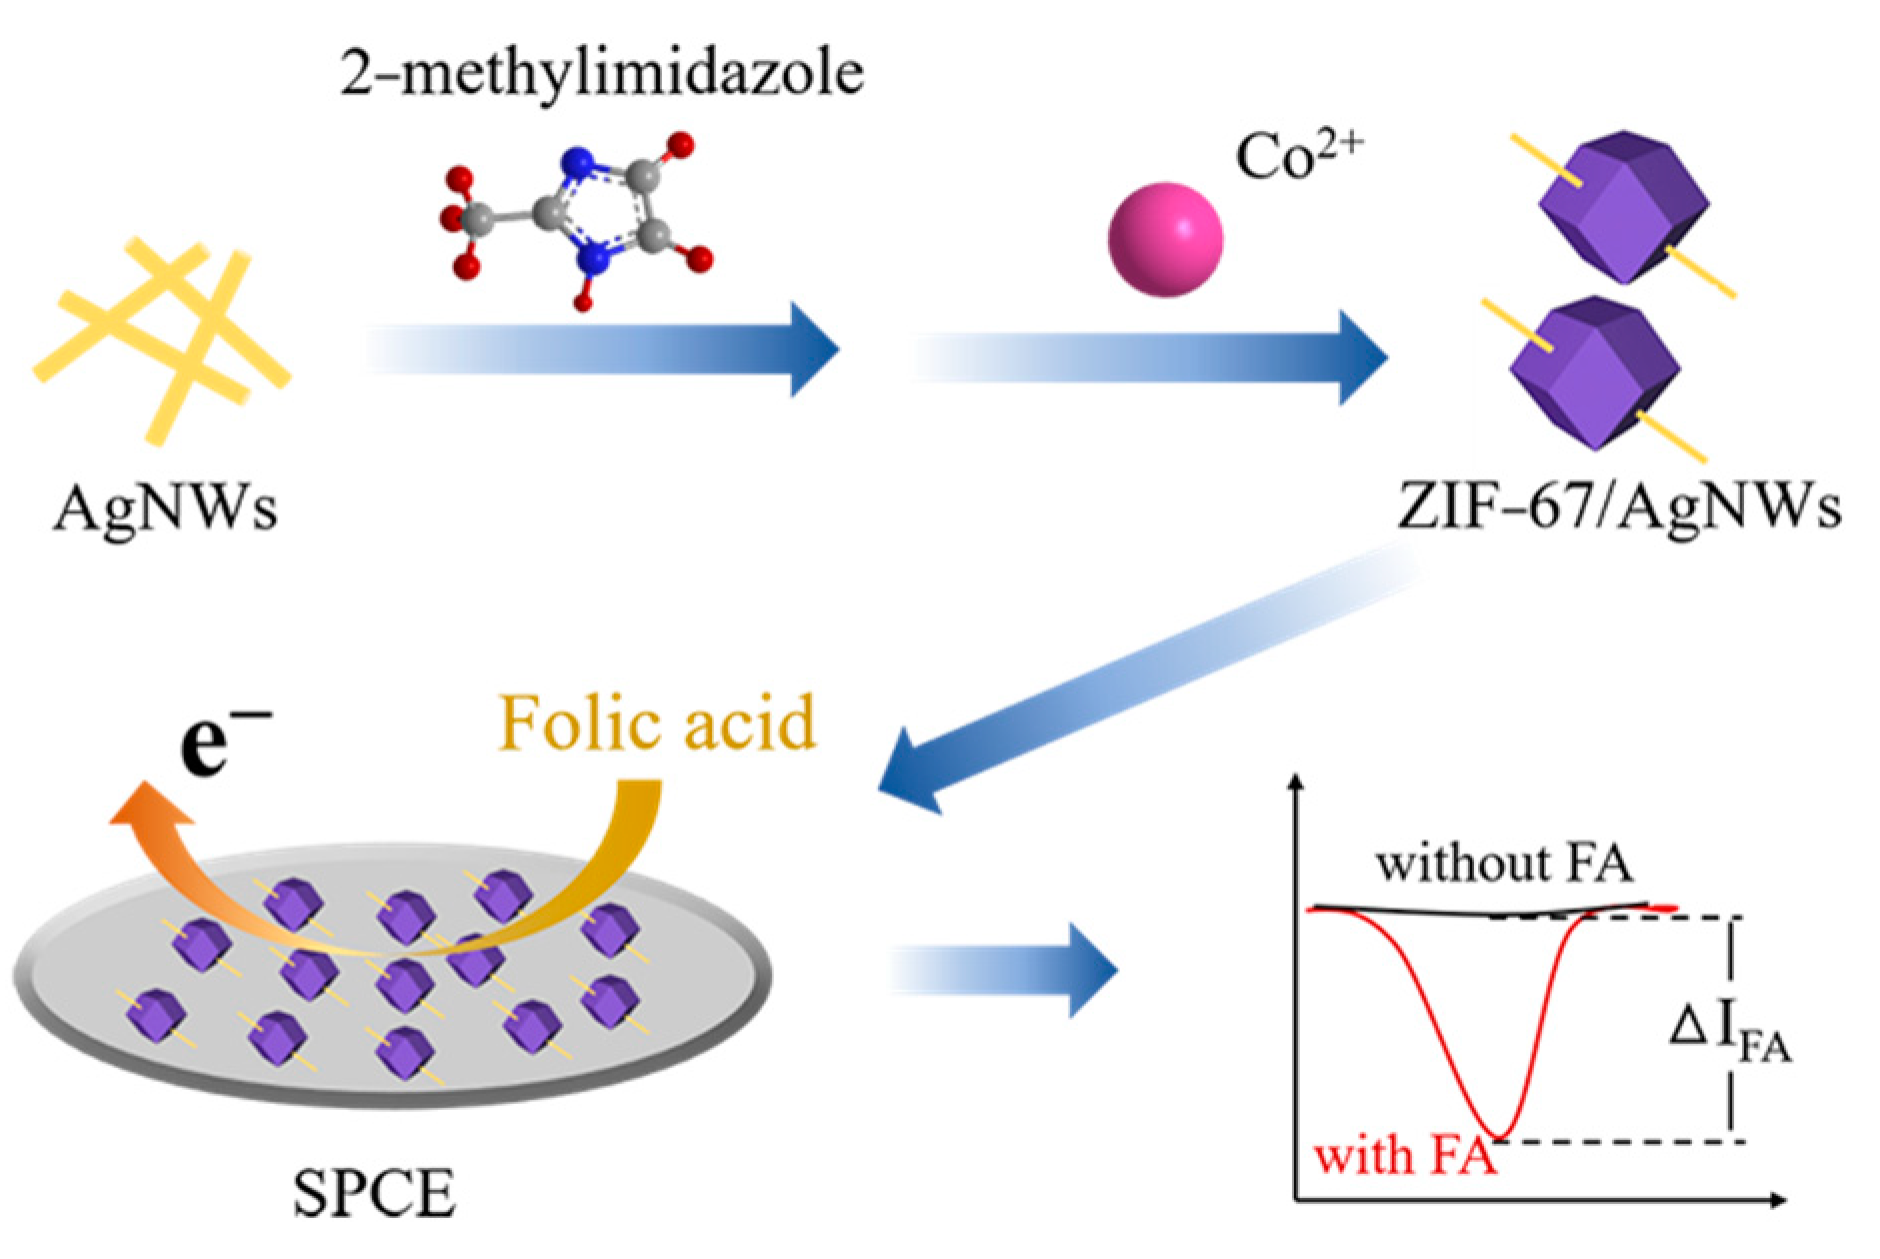
Scheme 1. Manufacturing process for the ZIF−67/AgNWs@SPCE sensing platform and its application to FA determination.
Biosensors 12 00382 sch001
Figure 1. SEM images of ZIF-67 (a), ZIF-67/AgNWs (b), and AgNWs (c). Insets show enlargements of the SEM images for ZIF-67 (a) and ZIF-67/AgNWs (b).
Biosensors 12 00382 g001
Figure 2. (a) UV−vis spectra, (b) Raman spectra, (c) FT–IR spectra, (d) XRD patterns, and (e) full-scan XPS spectra of ZIF−67 and ZIF−67/AgNWs. (f) High-resolution XPS spectrum of Co 2p.
Biosensors 12 00382 g002
Figure 3. CV curves (a) and EIS (b) curves for bare SPCE and SPCE modified with ZIF−67 and ZIF−67/AgNWs. Electrolyte solution containing [Fe (CN)6]3−/4− (1 mM) as an electrochemical signal probe.
Biosensors 12 00382 g003
Figure 4. (a,b) SWV curves of the ZIF−67/AgNWs@SPCE sensing platform with different concentrations of FA. (c) Linear relationship between IFA and CFA from 0.1 μM to 10 μM.
Biosensors 12 00382 g004
Figure 5. IFA measured from SWV curves of ZIF-67/AgNWs@SPCE in the presence of FA (1 μM) and 0.1 mM of each interfering substance. Current percentage (%) = (I0 − I)/I0 × 100%, where I0 represents the IFA detected without the addition of FA (control), and I was measured with addition of FA (1 μM) or each interfering substance (0.1 mM). Mixture indicates all interfering substance and FA. All measurements were repeated six times.
Biosensors 12 00382 g005
Figure 6. Twenty scans performed for the SWV measurements (a). Current response to FA after the sensor was left for a long time (b). The concentration of FA was 10 μM. Error bars represent the standard deviations for three measurements.
Biosensors 12 00382 g006
Table 1. Determination of FA in human serum samples using the electrochemical sensor. All experiments were performed six times.
a SampleSpiked/μMb Detected/μMc RSD/%Recovery/%
Serum 10Not Found--
Serum 211.021 ± 0.025102.459102.1
Serum 31010.09 ± 0.30923.065100.9
a Samples were prepared by diluting purchased human serum samples 10-fold with PBS (1 mM, pH 7.4). b All results are expressed as the mean (n = 6) ± the standard deviation. c The relative standard deviation (RSD) was calculated as (SD/average) × 100.
Table 2. Comparison of different methods for FA determination.
ElectrodeModifierLinear Range/μMLOD/μMRef.
CPECo3O4/RGO/PEI/CD19–9419[27]
GCEAuNCs/AGR/MWCNT10–1700.09[28]
GCEZrO2/ZnO2–4800.037[29]
CPECdO/SWCNTs/DPIB0.1–12000.06[30]
CPEZnO/CNTs/BCB3–7001[31]
GCEDHB/AuNPs/RGO1–5000.6[32]
PENiCo2S4/rGO0.1–36000.0016[33]
GCEf-MWCNT-Ni (OH)2-Si4Pic+Cl0.5–260.095[34]
SPCEZIF-67/AgNWs0.1–100.03This work
Abbreviations: CPE, carbon paste electrode; PE, paper electrode; SWCNTs, single-wall carbon nanotubes; DPIB, 1,3-dipropylimidazolium bromide; SPCE, screen-printed carbon electrode; MWCNTs, multi-walled carbon nanotubes; AGR, activation of graphene; BCB, 4,5-bis(4-chloroanilino)-1,2-benzendiol; DHB, 2-(3-dihydroxy phenyl) benzothiazole; Si4Pic+Cl, inorganic ionic silsesquioxane polymer.
Publisher’s Note: MDPI stays neutral with regard to jurisdictional claims in published maps and institutional affiliations.